Introduction
This is a report for the insert benchmark with 800M docs and 1 client(s). It is generated by scripts (bash, awk, sed) and Tufte might not be impressed. An overview of the insert benchmark is here and a short update is here. Below, by DBMS, I mean DBMS+version.config. An example is my8020.c10b40 where my means MySQL, 8020 is version 8.0.20 and c10b40 is the name for the configuration file.
The test server has 8 AMD cores, 32G RAM and an NVMe SSD. It is described here as the PN53. The benchmark was run with 1 client and there were 1 or 3 connections per client (1 for queries or inserts without rate limits, 1+1 for rate limited inserts+deletes). It uses 1 table. It loads 800M rows per table without secondary indexes, creates 3 secondary indexes per table, then inserts 4m+1m rows per table with a delete per insert to avoid growing the table. It then does 6 read+write tests for 1800s each that do queries as fast as possible with 100,100,500,500,1000,1000 inserts/s and the same for deletes/s per client concurrent with the queries. The database is larger than memory. Clients and the DBMS share one server. The per-database configs are in the per-database subdirectories here.
The tested DBMS are:
- pg140_o2nofp.cx10a_c8r32 - Postgres 14.0 with the cx10a_c8r32 config
- pg1418_o2nofp.cx10a_c8r32 - Postgres 14.18 with the cx10a_c8r32 config
- pg150_o2nofp.cx10a_c8r32 - Postgres 15.0 with the cx10a_c8r32 config
- pg1513_o2nofp.cx10a_c8r32 - Postgres 15.13 with the cx10a_c8r32 config
- pg160_o2nofp.cx10a_c8r32 - Postgres 16.0 with the cx10a_c8r32 config
- pg169_o2nofp.cx10a_c8r32 - Postgres 16.9 with the cx10a_c8r32 config
- pg170_o2nofp.cx10a_c8r32 - Postgres 17.0 with the cx10a_c8r32 config
- pg175_o2nofp.cx10a_c8r32 - Postgres 17.5 with the cx10a_c8r32 config
- pg18beta1_o2nofp.cx10b_c8r32 - Postgres 18 beta1 with the cx10b_c8r32 config that uses io_method=sync
Contents
- Summary
- l.i0: load without secondary indexes
- l.x: create secondary indexes
- l.i1: continue load after secondary indexes created with 50 inserts per transaction
- l.i2: continue load after secondary indexes created with 5 inserts per transaction
- qr100.L1: range queries with 100 insert/s per client
- qp100.L2: point queries with 100 insert/s per client
- qr500.L3: range queries with 500 insert/s per client
- qp500.L4: point queries with 500 insert/s per client
- qr1000.L5: range queries with 1000 insert/s per client
- qp1000.L6: point queries with 1000 insert/s per client
Summary
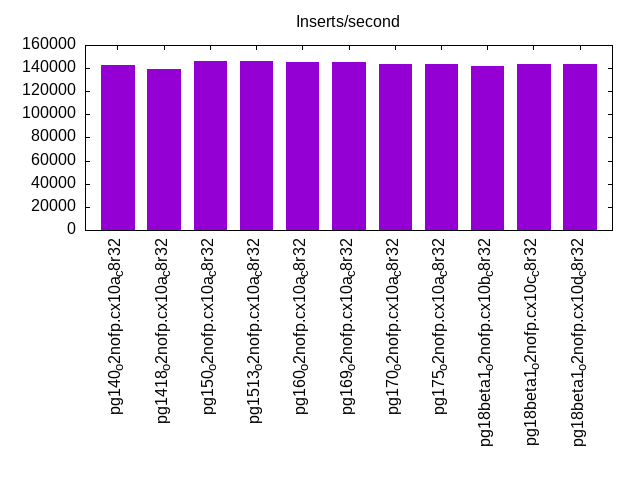
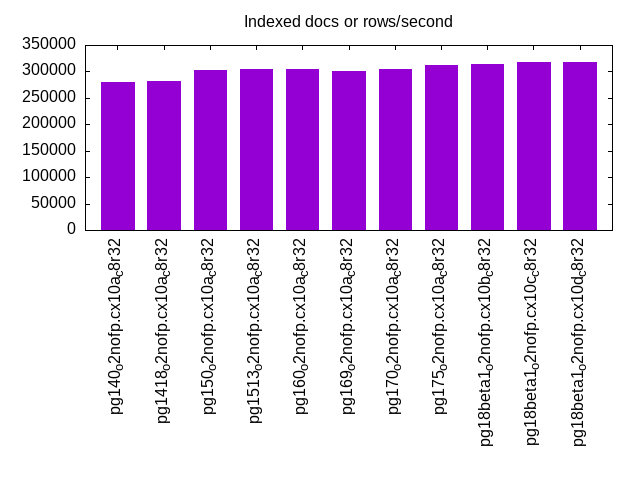
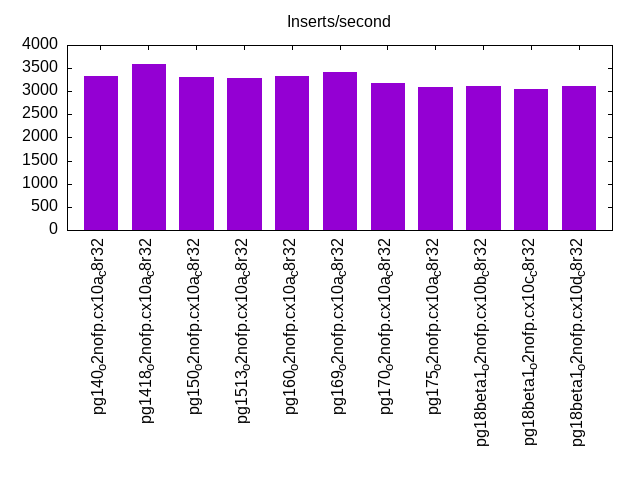
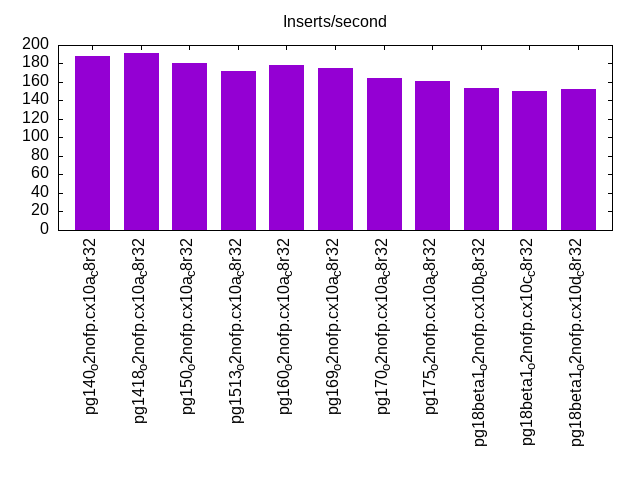
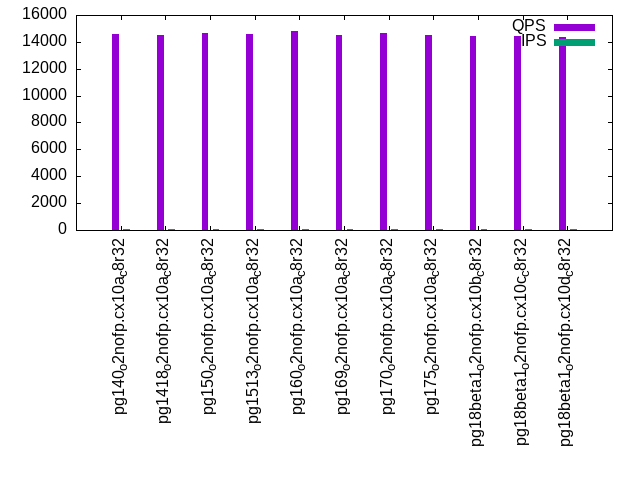
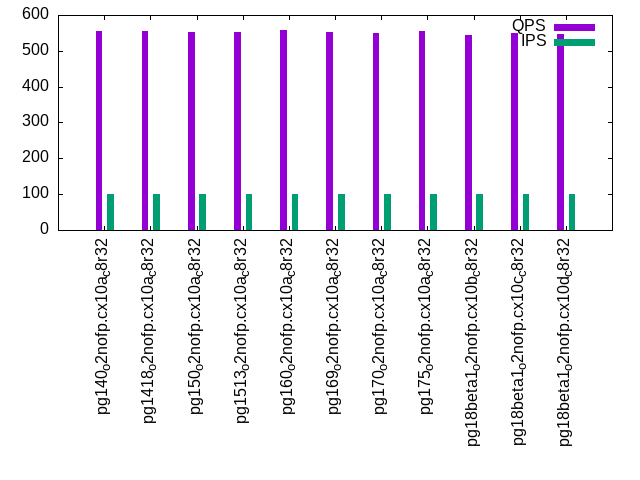
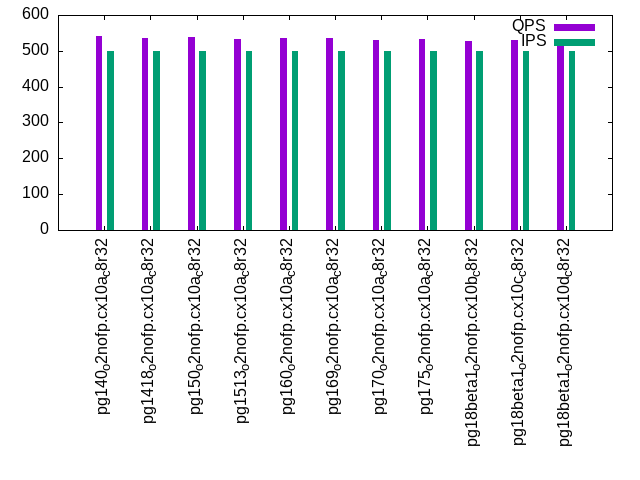
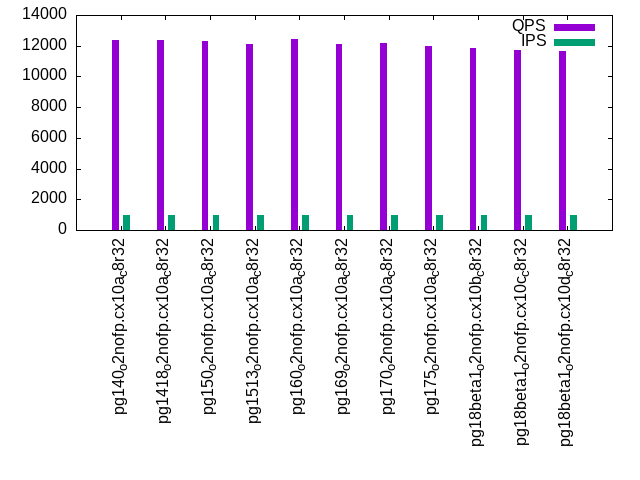
The numbers are inserts/s for l.i0, l.i1 and l.i2, indexed docs (or rows) /s for l.x and queries/s for qr100, qp100 thru qr1000, qp1000" The values are the average rate over the entire test for inserts (IPS) and queries (QPS). The range of values for IPS and QPS is split into 3 parts: bottom 25%, middle 50%, top 25%. Values in the bottom 25% have a red background, values in the top 25% have a green background and values in the middle have no color. A gray background is used for values that can be ignored because the DBMS did not sustain the target insert rate. Red backgrounds are not used when the minimum value is within 80% of the max value.
| dbms | l.i0 | l.x | l.i1 | l.i2 | qr100 | qp100 | qr500 | qp500 | qr1000 | qp1000 |
|---|---|---|---|---|---|---|---|---|---|---|
| pg140_o2nofp.cx10a_c8r32 | 142883 | 279916 | 3328 | 188 | 14554 | 554 | 13999 | 540 | 12392 | 508 |
| pg1418_o2nofp.cx10a_c8r32 | 139252 | 282087 | 3584 | 191 | 14546 | 554 | 13787 | 537 | 12345 | 501 |
| pg150_o2nofp.cx10a_c8r32 | 146413 | 302801 | 3303 | 180 | 14686 | 553 | 13942 | 538 | 12298 | 495 |
| pg1513_o2nofp.cx10a_c8r32 | 146012 | 304762 | 3279 | 172 | 14568 | 553 | 13735 | 534 | 12093 | 491 |
| pg160_o2nofp.cx10a_c8r32 | 145138 | 304646 | 3322 | 178 | 14794 | 557 | 14082 | 537 | 12433 | 496 |
| pg169_o2nofp.cx10a_c8r32 | 145059 | 300639 | 3413 | 175 | 14487 | 553 | 13749 | 535 | 12097 | 494 |
| pg170_o2nofp.cx10a_c8r32 | 143859 | 304878 | 3185 | 164 | 14674 | 550 | 13867 | 531 | 12161 | 489 |
| pg175_o2nofp.cx10a_c8r32 | 143292 | 311891 | 3101 | 161 | 14537 | 554 | 13638 | 533 | 11970 | 492 |
| pg18beta1_o2nofp.cx10b_c8r32 | 142096 | 314589 | 3113 | 154 | 14471 | 544 | 13730 | 528 | 11830 | 486 |
| pg18beta1_o2nofp.cx10c_c8r32 | 143781 | 318218 | 3056 | 150 | 14408 | 549 | 13255 | 531 | 11753 | 488 |
| pg18beta1_o2nofp.cx10d_c8r32 | 143369 | 317334 | 3122 | 152 | 14375 | 548 | 13512 | 532 | 11647 | 489 |
This table has relative throughput, throughput for the DBMS relative to the DBMS in the first line, using the absolute throughput from the previous table. Values less than 0.95 have a yellow background. Values greater than 1.05 have a blue background.
| dbms | l.i0 | l.x | l.i1 | l.i2 | qr100 | qp100 | qr500 | qp500 | qr1000 | qp1000 |
|---|---|---|---|---|---|---|---|---|---|---|
| pg140_o2nofp.cx10a_c8r32 | 1.00 | 1.00 | 1.00 | 1.00 | 1.00 | 1.00 | 1.00 | 1.00 | 1.00 | 1.00 |
| pg1418_o2nofp.cx10a_c8r32 | 0.97 | 1.01 | 1.08 | 1.02 | 1.00 | 1.00 | 0.98 | 0.99 | 1.00 | 0.99 |
| pg150_o2nofp.cx10a_c8r32 | 1.02 | 1.08 | 0.99 | 0.96 | 1.01 | 1.00 | 1.00 | 1.00 | 0.99 | 0.97 |
| pg1513_o2nofp.cx10a_c8r32 | 1.02 | 1.09 | 0.99 | 0.91 | 1.00 | 1.00 | 0.98 | 0.99 | 0.98 | 0.97 |
| pg160_o2nofp.cx10a_c8r32 | 1.02 | 1.09 | 1.00 | 0.95 | 1.02 | 1.01 | 1.01 | 0.99 | 1.00 | 0.98 |
| pg169_o2nofp.cx10a_c8r32 | 1.02 | 1.07 | 1.03 | 0.93 | 1.00 | 1.00 | 0.98 | 0.99 | 0.98 | 0.97 |
| pg170_o2nofp.cx10a_c8r32 | 1.01 | 1.09 | 0.96 | 0.87 | 1.01 | 0.99 | 0.99 | 0.98 | 0.98 | 0.96 |
| pg175_o2nofp.cx10a_c8r32 | 1.00 | 1.11 | 0.93 | 0.86 | 1.00 | 1.00 | 0.97 | 0.99 | 0.97 | 0.97 |
| pg18beta1_o2nofp.cx10b_c8r32 | 0.99 | 1.12 | 0.94 | 0.82 | 0.99 | 0.98 | 0.98 | 0.98 | 0.95 | 0.96 |
| pg18beta1_o2nofp.cx10c_c8r32 | 1.01 | 1.14 | 0.92 | 0.80 | 0.99 | 0.99 | 0.95 | 0.98 | 0.95 | 0.96 |
| pg18beta1_o2nofp.cx10d_c8r32 | 1.00 | 1.13 | 0.94 | 0.81 | 0.99 | 0.99 | 0.97 | 0.99 | 0.94 | 0.96 |
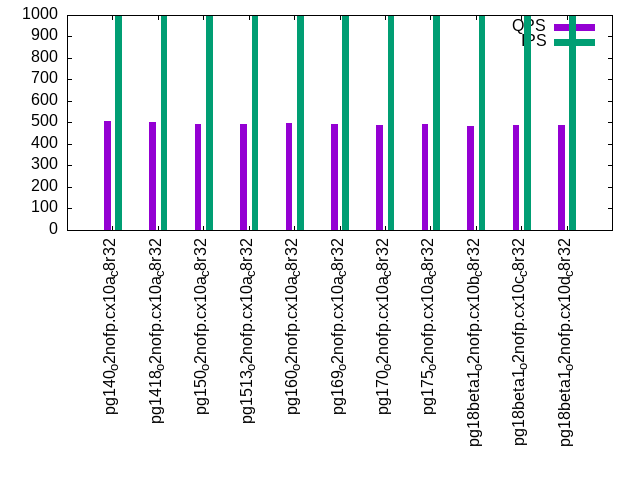
This lists the average rate of inserts/s for the tests that do inserts concurrent with queries. For such tests the query rate is listed in the table above. The read+write tests are setup so that the insert rate should match the target rate every second. Cells that are not at least 95% of the target have a red background to indicate a failure to satisfy the target.
| dbms | qr100.L1 | qp100.L2 | qr500.L3 | qp500.L4 | qr1000.L5 | qp1000.L6 |
|---|---|---|---|---|---|---|
| pg140_o2nofp.cx10a_c8r32 | 100 | 100 | 500 | 500 | 999 | 999 |
| pg1418_o2nofp.cx10a_c8r32 | 100 | 100 | 500 | 500 | 999 | 999 |
| pg150_o2nofp.cx10a_c8r32 | 100 | 100 | 500 | 500 | 999 | 999 |
| pg1513_o2nofp.cx10a_c8r32 | 100 | 100 | 500 | 500 | 999 | 999 |
| pg160_o2nofp.cx10a_c8r32 | 100 | 100 | 500 | 500 | 999 | 999 |
| pg169_o2nofp.cx10a_c8r32 | 100 | 100 | 500 | 500 | 999 | 999 |
| pg170_o2nofp.cx10a_c8r32 | 100 | 100 | 500 | 500 | 999 | 999 |
| pg175_o2nofp.cx10a_c8r32 | 100 | 100 | 500 | 500 | 999 | 999 |
| pg18beta1_o2nofp.cx10b_c8r32 | 100 | 100 | 500 | 500 | 999 | 999 |
| pg18beta1_o2nofp.cx10c_c8r32 | 100 | 100 | 500 | 500 | 999 | 999 |
| pg18beta1_o2nofp.cx10d_c8r32 | 100 | 100 | 500 | 500 | 999 | 999 |
| target | 100 | 100 | 500 | 500 | 1000 | 1000 |
l.i0
l.i0: load without secondary indexes. Graphs for performance per 1-second interval are here.
Average throughput:
Insert response time histogram: each cell has the percentage of responses that take <= the time in the header and max is the max response time in seconds. For the max column values in the top 25% of the range have a red background and in the bottom 25% of the range have a green background. The red background is not used when the min value is within 80% of the max value.
| dbms | 256us | 1ms | 4ms | 16ms | 64ms | 256ms | 1s | 4s | 16s | gt | max |
|---|---|---|---|---|---|---|---|---|---|---|---|
| pg140_o2nofp.cx10a_c8r32 | 99.973 | 0.024 | 0.003 | nonzero | 0.036 | ||||||
| pg1418_o2nofp.cx10a_c8r32 | 99.964 | 0.031 | 0.004 | 0.001 | nonzero | 0.068 | |||||
| pg150_o2nofp.cx10a_c8r32 | 99.974 | 0.021 | 0.003 | 0.002 | nonzero | 0.068 | |||||
| pg1513_o2nofp.cx10a_c8r32 | 99.972 | 0.023 | 0.003 | 0.002 | 0.062 | ||||||
| pg160_o2nofp.cx10a_c8r32 | 99.972 | 0.023 | 0.003 | 0.002 | 0.058 | ||||||
| pg169_o2nofp.cx10a_c8r32 | 99.973 | 0.022 | 0.003 | 0.001 | nonzero | 0.067 | |||||
| pg170_o2nofp.cx10a_c8r32 | 99.971 | 0.024 | 0.004 | 0.002 | nonzero | 0.065 | |||||
| pg175_o2nofp.cx10a_c8r32 | 99.970 | 0.024 | 0.004 | 0.002 | 0.054 | ||||||
| pg18beta1_o2nofp.cx10b_c8r32 | 99.872 | 0.118 | 0.010 | 0.001 | 0.048 | ||||||
| pg18beta1_o2nofp.cx10c_c8r32 | 99.968 | 0.026 | 0.005 | 0.001 | 0.046 | ||||||
| pg18beta1_o2nofp.cx10d_c8r32 | 99.967 | 0.026 | 0.006 | 0.001 | 0.046 |
Performance metrics for the DBMS listed above. Some are normalized by throughput, others are not. Legend for results is here.
ips	qps	rps	rmbps	wps	wmbps	rpq	rkbpq	wpi	wkbpi	csps	cpups	cspq	cpupq	dbgb1	dbgb2	rss	maxop	p50	p99	tag
142883	0	24	0.2	533.5	58.6	0.000	0.001	0.004	0.420	16740	20.5	0.117	11	76.5	116.6	2.9	0.036	143680	139184	pg140_o2nofp.cx10a_c8r32
139252	0	25	0.2	522.0	57.4	0.000	0.001	0.004	0.422	16351	20.2	0.117	12	76.5	116.6	3.5	0.068	139979	136086	pg1418_o2nofp.cx10a_c8r32
146413	0	27	0.2	548.6	60.2	0.000	0.001	0.004	0.421	17086	20.5	0.117	11	76.5	116.6	2.9	0.068	147282	142983	pg150_o2nofp.cx10a_c8r32
146012	0	27	0.2	547.8	60.1	0.000	0.001	0.004	0.421	17004	20.6	0.116	11	76.5	116.6	18.8	0.062	146781	142483	pg1513_o2nofp.cx10a_c8r32
145138	0	27	0.2	544.9	59.8	0.000	0.001	0.004	0.422	16933	20.5	0.117	11	76.5	116.6	1.8	0.058	146083	141384	pg160_o2nofp.cx10a_c8r32
145059	0	27	0.2	543.7	59.6	0.000	0.001	0.004	0.421	16930	20.6	0.117	11	76.5	116.6	18.6	0.067	145883	141881	pg169_o2nofp.cx10a_c8r32
143859	0	25	0.2	538.8	59.4	0.000	0.001	0.004	0.423	14349	20.5	0.100	11	76.5	116.6	19.3	0.065	144779	140680	pg170_o2nofp.cx10a_c8r32
143292	0	25	0.2	536.9	59.1	0.000	0.001	0.004	0.422	14293	20.4	0.100	11	76.5	116.6	18.9	0.054	144180	140280	pg175_o2nofp.cx10a_c8r32
142096	0	24	0.2	530.5	58.5	0.000	0.001	0.004	0.421	14382	20.5	0.101	12	76.5	116.6	18.8	0.048	142981	124583	pg18beta1_o2nofp.cx10b_c8r32
143781	0	26	0.2	539.4	59.3	0.000	0.001	0.004	0.422	14449	20.5	0.100	11	76.5	116.6	18.9	0.046	144684	140280	pg18beta1_o2nofp.cx10c_c8r32
143369	0	25	0.2	539.7	59.4	0.000	0.001	0.004	0.424	14383	20.4	0.100	11	76.5	116.6	18.3	0.046	144380	139878	pg18beta1_o2nofp.cx10d_c8r32
l.x
l.x: create secondary indexes.
Average throughput:
Performance metrics for the DBMS listed above. Some are normalized by throughput, others are not. Legend for results is here.
ips	qps	rps	rmbps	wps	wmbps	rpq	rkbpq	wpi	wkbpi	csps	cpups	cspq	cpupq	dbgb1	dbgb2	rss	maxop	p50	p99	tag
279916	0	741	91.9	850.7	102.1	0.003	0.336	0.003	0.374	369	13.0	0.001	4	153.6	193.7	23.4	0.004	NA	NA	pg140_o2nofp.cx10a_c8r32
282087	0	746	92.6	874.7	103.2	0.003	0.336	0.003	0.375	390	12.8	0.001	4	153.6	193.7	1.9	0.003	NA	NA	pg1418_o2nofp.cx10a_c8r32
302801	0	824	102.1	951.8	113.2	0.003	0.345	0.003	0.383	413	12.9	0.001	3	153.6	193.7	23.4	0.006	NA	NA	pg150_o2nofp.cx10a_c8r32
304762	0	829	102.7	951.8	113.7	0.003	0.345	0.003	0.382	420	13.0	0.001	3	153.6	193.7	23.4	0.004	NA	NA	pg1513_o2nofp.cx10a_c8r32
304646	0	827	102.6	951.9	114.0	0.003	0.345	0.003	0.383	429	12.9	0.001	3	153.6	193.7	23.5	0.005	NA	NA	pg160_o2nofp.cx10a_c8r32
300639	0	816	101.2	941.0	112.4	0.003	0.345	0.003	0.383	422	12.9	0.001	3	153.6	193.7	23.5	0.007	NA	NA	pg169_o2nofp.cx10a_c8r32
304878	0	826	102.7	969.5	113.9	0.003	0.345	0.003	0.382	354	13.0	0.001	3	153.6	193.7	23.4	0.004	NA	NA	pg170_o2nofp.cx10a_c8r32
311891	0	845	105.0	989.8	116.4	0.003	0.345	0.003	0.382	423	13.0	0.001	3	153.6	193.7	23.4	0.004	NA	NA	pg175_o2nofp.cx10a_c8r32
314589	0	852	105.9	997.5	117.2	0.003	0.345	0.003	0.381	426	13.0	0.001	3	153.6	193.7	23.4	0.005	NA	NA	pg18beta1_o2nofp.cx10b_c8r32
318218	0	862	107.1	994.0	118.5	0.003	0.345	0.003	0.381	1258	13.5	0.004	3	153.6	193.7	23.4	0.005	NA	NA	pg18beta1_o2nofp.cx10c_c8r32
317334	0	860	106.8	1006.2	118.2	0.003	0.345	0.003	0.381	1010	13.4	0.003	3	153.6	193.7	23.4	0.005	NA	NA	pg18beta1_o2nofp.cx10d_c8r32
l.i1
l.i1: continue load after secondary indexes created with 50 inserts per transaction. Graphs for performance per 1-second interval are here.
Average throughput:
Insert response time histogram: each cell has the percentage of responses that take <= the time in the header and max is the max response time in seconds. For the max column values in the top 25% of the range have a red background and in the bottom 25% of the range have a green background. The red background is not used when the min value is within 80% of the max value.
| dbms | 256us | 1ms | 4ms | 16ms | 64ms | 256ms | 1s | 4s | 16s | gt | max |
|---|---|---|---|---|---|---|---|---|---|---|---|
| pg140_o2nofp.cx10a_c8r32 | 99.141 | 0.859 | 0.040 | ||||||||
| pg1418_o2nofp.cx10a_c8r32 | 98.228 | 1.773 | 0.050 | ||||||||
| pg150_o2nofp.cx10a_c8r32 | 98.445 | 1.555 | 0.051 | ||||||||
| pg1513_o2nofp.cx10a_c8r32 | 98.495 | 1.505 | 0.051 | ||||||||
| pg160_o2nofp.cx10a_c8r32 | 98.306 | 1.694 | 0.063 | ||||||||
| pg169_o2nofp.cx10a_c8r32 | 98.171 | 1.829 | 0.050 | ||||||||
| pg170_o2nofp.cx10a_c8r32 | 98.460 | 1.540 | 0.056 | ||||||||
| pg175_o2nofp.cx10a_c8r32 | 98.621 | 1.379 | 0.051 | ||||||||
| pg18beta1_o2nofp.cx10b_c8r32 | 98.572 | 1.427 | 0.058 | ||||||||
| pg18beta1_o2nofp.cx10c_c8r32 | 98.595 | 1.405 | 0.052 | ||||||||
| pg18beta1_o2nofp.cx10d_c8r32 | 98.454 | 1.546 | 0.053 |
Delete response time histogram: each cell has the percentage of responses that take <= the time in the header and max is the max response time in seconds. For the max column values in the top 25% of the range have a red background and in the bottom 25% of the range have a green background. The red background is not used when the min value is within 80% of the max value.
| dbms | 256us | 1ms | 4ms | 16ms | 64ms | 256ms | 1s | 4s | 16s | gt | max |
|---|---|---|---|---|---|---|---|---|---|---|---|
| pg140_o2nofp.cx10a_c8r32 | 0.948 | 16.205 | 48.483 | 34.365 | 0.032 | ||||||
| pg1418_o2nofp.cx10a_c8r32 | 0.694 | 16.674 | 51.007 | 31.625 | 0.026 | ||||||
| pg150_o2nofp.cx10a_c8r32 | 0.925 | 16.414 | 43.359 | 39.303 | 0.033 | ||||||
| pg1513_o2nofp.cx10a_c8r32 | 0.596 | 16.069 | 44.196 | 39.139 | 0.029 | ||||||
| pg160_o2nofp.cx10a_c8r32 | 0.759 | 16.980 | 48.265 | 33.996 | 0.031 | ||||||
| pg169_o2nofp.cx10a_c8r32 | 0.514 | 16.799 | 48.193 | 34.495 | 0.033 | ||||||
| pg170_o2nofp.cx10a_c8r32 | 0.476 | 15.313 | 43.139 | 41.072 | 0.034 | ||||||
| pg175_o2nofp.cx10a_c8r32 | 0.517 | 15.865 | 41.474 | 42.144 | 0.033 | ||||||
| pg18beta1_o2nofp.cx10b_c8r32 | 0.434 | 15.422 | 41.789 | 42.355 | 0.038 | ||||||
| pg18beta1_o2nofp.cx10c_c8r32 | 0.407 | 15.585 | 41.459 | 42.549 | 0.037 | ||||||
| pg18beta1_o2nofp.cx10d_c8r32 | 0.771 | 15.543 | 40.509 | 43.178 | 0.031 |
Performance metrics for the DBMS listed above. Some are normalized by throughput, others are not. Legend for results is here.
ips	qps	rps	rmbps	wps	wmbps	rpq	rkbpq	wpi	wkbpi	csps	cpups	cspq	cpupq	dbgb1	dbgb2	rss	maxop	p50	p99	tag
3328	0	4784	37.9	3986.1	68.4	1.438	11.655	1.198	21.039	10999	14.6	3.305	351	154.3	194.3	23.0	0.040	3250	2000	pg140_o2nofp.cx10a_c8r32
3584	0	5149	40.8	4244.1	72.6	1.437	11.644	1.184	20.742	11797	15.4	3.291	344	154.3	194.3	23.0	0.050	3400	2150	pg1418_o2nofp.cx10a_c8r32
3303	0	4746	37.6	3943.5	67.5	1.437	11.650	1.194	20.915	10836	15.1	3.281	366	154.3	194.3	22.8	0.051	2800	1800	pg150_o2nofp.cx10a_c8r32
3279	0	4722	37.4	3920.1	67.0	1.440	11.678	1.196	20.924	10787	15.1	3.290	368	154.3	194.3	22.8	0.051	2750	1950	pg1513_o2nofp.cx10a_c8r32
3322	0	4778	37.8	3957.3	67.6	1.438	11.661	1.191	20.826	10910	15.1	3.284	364	154.3	194.3	22.9	0.063	3149	1800	pg160_o2nofp.cx10a_c8r32
3413	0	4907	38.8	4078.6	69.7	1.438	11.656	1.195	20.924	11188	15.3	3.278	359	154.3	194.3	22.8	0.050	3150	2000	pg169_o2nofp.cx10a_c8r32
3185	0	4574	36.2	3770.8	64.5	1.436	11.645	1.184	20.732	10315	15.0	3.239	377	154.3	194.3	22.8	0.056	2850	1800	pg170_o2nofp.cx10a_c8r32
3101	0	4484	35.5	3687.9	63.0	1.446	11.724	1.189	20.803	10040	14.8	3.238	382	154.3	194.3	22.7	0.051	2499	1800	pg175_o2nofp.cx10a_c8r32
3113	0	4482	35.5	3723.1	63.7	1.440	11.677	1.196	20.949	10086	15.0	3.240	386	154.3	194.3	22.8	0.058	2699	1750	pg18beta1_o2nofp.cx10b_c8r32
3056	0	4395	34.8	3638.7	62.2	1.438	11.659	1.191	20.837	9891	14.9	3.237	390	154.3	194.3	22.8	0.052	2750	1550	pg18beta1_o2nofp.cx10c_c8r32
3122	0	4488	35.5	3706.7	63.2	1.437	11.652	1.187	20.719	10135	14.9	3.246	382	154.3	194.3	23.1	0.053	2750	1800	pg18beta1_o2nofp.cx10d_c8r32
l.i2
l.i2: continue load after secondary indexes created with 5 inserts per transaction. Graphs for performance per 1-second interval are here.
Average throughput:
Insert response time histogram: each cell has the percentage of responses that take <= the time in the header and max is the max response time in seconds. For the max column values in the top 25% of the range have a red background and in the bottom 25% of the range have a green background. The red background is not used when the min value is within 80% of the max value.
| dbms | 256us | 1ms | 4ms | 16ms | 64ms | 256ms | 1s | 4s | 16s | gt | max |
|---|---|---|---|---|---|---|---|---|---|---|---|
| pg140_o2nofp.cx10a_c8r32 | 18.306 | 81.671 | 0.024 | 0.009 | |||||||
| pg1418_o2nofp.cx10a_c8r32 | 10.579 | 89.237 | 0.177 | 0.007 | 0.040 | ||||||
| pg150_o2nofp.cx10a_c8r32 | 9.624 | 90.148 | 0.222 | 0.006 | 0.033 | ||||||
| pg1513_o2nofp.cx10a_c8r32 | 9.486 | 90.293 | 0.214 | 0.007 | 0.025 | ||||||
| pg160_o2nofp.cx10a_c8r32 | 9.582 | 90.219 | 0.190 | 0.008 | 0.026 | ||||||
| pg169_o2nofp.cx10a_c8r32 | 8.271 | 91.435 | 0.285 | 0.009 | 0.022 | ||||||
| pg170_o2nofp.cx10a_c8r32 | 10.113 | 89.838 | 0.042 | 0.006 | 0.039 | ||||||
| pg175_o2nofp.cx10a_c8r32 | 10.543 | 89.402 | 0.052 | 0.003 | 0.024 | ||||||
| pg18beta1_o2nofp.cx10b_c8r32 | 10.913 | 89.043 | 0.040 | 0.003 | 0.029 | ||||||
| pg18beta1_o2nofp.cx10c_c8r32 | 10.680 | 89.263 | 0.053 | 0.003 | 0.020 | ||||||
| pg18beta1_o2nofp.cx10d_c8r32 | 10.260 | 89.691 | 0.046 | 0.003 | 0.020 |
Delete response time histogram: each cell has the percentage of responses that take <= the time in the header and max is the max response time in seconds. For the max column values in the top 25% of the range have a red background and in the bottom 25% of the range have a green background. The red background is not used when the min value is within 80% of the max value.
| dbms | 256us | 1ms | 4ms | 16ms | 64ms | 256ms | 1s | 4s | 16s | gt | max |
|---|---|---|---|---|---|---|---|---|---|---|---|
| pg140_o2nofp.cx10a_c8r32 | 99.999 | 0.001 | 0.102 | ||||||||
| pg1418_o2nofp.cx10a_c8r32 | 99.999 | 0.001 | 0.102 | ||||||||
| pg150_o2nofp.cx10a_c8r32 | 99.999 | 0.001 | 0.097 | ||||||||
| pg1513_o2nofp.cx10a_c8r32 | 99.999 | 0.001 | 0.103 | ||||||||
| pg160_o2nofp.cx10a_c8r32 | 99.999 | 0.001 | 0.099 | ||||||||
| pg169_o2nofp.cx10a_c8r32 | 99.999 | 0.001 | 0.099 | ||||||||
| pg170_o2nofp.cx10a_c8r32 | 99.999 | 0.001 | 0.097 | ||||||||
| pg175_o2nofp.cx10a_c8r32 | 99.999 | 0.001 | 0.098 | ||||||||
| pg18beta1_o2nofp.cx10b_c8r32 | 99.999 | 0.001 | 0.108 | ||||||||
| pg18beta1_o2nofp.cx10c_c8r32 | 99.999 | 0.001 | 0.104 | ||||||||
| pg18beta1_o2nofp.cx10d_c8r32 | 99.999 | 0.001 | 0.105 |
Performance metrics for the DBMS listed above. Some are normalized by throughput, others are not. Legend for results is here.
ips	qps	rps	rmbps	wps	wmbps	rpq	rkbpq	wpi	wkbpi	csps	cpups	cspq	cpupq	dbgb1	dbgb2	rss	maxop	p50	p99	tag
188	0	207	1.7	543.1	7.4	1.101	8.996	2.883	40.358	1465	12.9	7.779	5478	154.5	194.5	23.3	0.009	190	160	pg140_o2nofp.cx10a_c8r32
191	0	204	1.6	554.1	7.5	1.072	8.760	2.906	40.311	1478	12.9	7.752	5412	154.5	194.5	23.3	0.040	190	165	pg1418_o2nofp.cx10a_c8r32
180	0	193	1.5	515.5	7.2	1.071	8.761	2.859	40.760	1338	12.8	7.419	5679	154.4	194.5	23.3	0.033	180	150	pg150_o2nofp.cx10a_c8r32
172	0	184	1.5	497.1	6.9	1.072	8.770	2.895	41.339	1286	12.7	7.491	5917	154.4	194.5	23.3	0.025	170	145	pg1513_o2nofp.cx10a_c8r32
178	0	190	1.5	513.6	7.1	1.071	8.765	2.893	41.201	1321	12.8	7.445	5769	154.4	194.5	23.3	0.026	180	135	pg160_o2nofp.cx10a_c8r32
175	0	187	1.5	505.9	7.0	1.071	8.764	2.894	41.031	1308	12.8	7.484	5858	154.4	194.5	23.3	0.022	175	140	pg169_o2nofp.cx10a_c8r32
164	0	175	1.4	482.2	6.7	1.071	8.763	2.948	41.752	1117	12.7	6.826	6210	154.5	194.5	23.4	0.039	160	140	pg170_o2nofp.cx10a_c8r32
161	0	173	1.4	477.5	6.6	1.072	8.770	2.958	42.056	1109	12.7	6.872	6295	154.4	194.5	23.4	0.024	160	125	pg175_o2nofp.cx10a_c8r32
154	0	165	1.3	448.5	6.3	1.074	8.789	2.918	41.840	1058	12.7	6.882	6610	154.5	191.5	23.3	0.029	155	120	pg18beta1_o2nofp.cx10b_c8r32
150	0	161	1.3	440.9	6.2	1.072	8.762	2.930	42.203	1047	12.7	6.954	6751	154.5	191.5	23.4	0.020	150	135	pg18beta1_o2nofp.cx10c_c8r32
152	0	163	1.3	443.6	6.2	1.072	8.767	2.924	41.936	1047	12.7	6.902	6697	154.5	191.6	23.4	0.020	150	120	pg18beta1_o2nofp.cx10d_c8r32
qr100.L1
qr100.L1: range queries with 100 insert/s per client. Graphs for performance per 1-second interval are here.
Average throughput:
Query response time histogram: each cell has the percentage of responses that take <= the time in the header and max is the max response time in seconds. For max values in the top 25% of the range have a red background and in the bottom 25% of the range have a green background. The red background is not used when the min value is within 80% of the max value.
| dbms | 256us | 1ms | 4ms | 16ms | 64ms | 256ms | 1s | 4s | 16s | gt | max |
|---|---|---|---|---|---|---|---|---|---|---|---|
| pg140_o2nofp.cx10a_c8r32 | 99.997 | 0.003 | nonzero | nonzero | 0.009 | ||||||
| pg1418_o2nofp.cx10a_c8r32 | 99.997 | 0.003 | nonzero | nonzero | 0.009 | ||||||
| pg150_o2nofp.cx10a_c8r32 | 99.996 | 0.003 | nonzero | nonzero | 0.010 | ||||||
| pg1513_o2nofp.cx10a_c8r32 | 99.997 | 0.003 | nonzero | nonzero | 0.009 | ||||||
| pg160_o2nofp.cx10a_c8r32 | 99.996 | 0.004 | nonzero | nonzero | 0.009 | ||||||
| pg169_o2nofp.cx10a_c8r32 | 99.996 | 0.003 | nonzero | nonzero | 0.009 | ||||||
| pg170_o2nofp.cx10a_c8r32 | 99.997 | 0.003 | nonzero | nonzero | 0.009 | ||||||
| pg175_o2nofp.cx10a_c8r32 | 99.997 | 0.003 | nonzero | nonzero | 0.010 | ||||||
| pg18beta1_o2nofp.cx10b_c8r32 | 99.996 | 0.004 | nonzero | nonzero | 0.010 | ||||||
| pg18beta1_o2nofp.cx10c_c8r32 | 99.996 | 0.003 | nonzero | nonzero | 0.009 | ||||||
| pg18beta1_o2nofp.cx10d_c8r32 | 99.996 | 0.003 | nonzero | nonzero | 0.011 |
Insert response time histogram: each cell has the percentage of responses that take <= the time in the header and max is the max response time in seconds. For max values in the top 25% of the range have a red background and in the bottom 25% of the range have a green background. The red background is not used when the min value is within 80% of the max value.
| dbms | 256us | 1ms | 4ms | 16ms | 64ms | 256ms | 1s | 4s | 16s | gt | max |
|---|---|---|---|---|---|---|---|---|---|---|---|
| pg140_o2nofp.cx10a_c8r32 | 61.139 | 38.861 | 0.024 | ||||||||
| pg1418_o2nofp.cx10a_c8r32 | 60.306 | 39.694 | 0.025 | ||||||||
| pg150_o2nofp.cx10a_c8r32 | 56.333 | 43.667 | 0.025 | ||||||||
| pg1513_o2nofp.cx10a_c8r32 | 56.222 | 43.778 | 0.025 | ||||||||
| pg160_o2nofp.cx10a_c8r32 | 55.611 | 44.389 | 0.025 | ||||||||
| pg169_o2nofp.cx10a_c8r32 | 56.222 | 43.778 | 0.024 | ||||||||
| pg170_o2nofp.cx10a_c8r32 | 59.639 | 40.361 | 0.025 | ||||||||
| pg175_o2nofp.cx10a_c8r32 | 59.694 | 40.306 | 0.026 | ||||||||
| pg18beta1_o2nofp.cx10b_c8r32 | 60.139 | 39.861 | 0.026 | ||||||||
| pg18beta1_o2nofp.cx10c_c8r32 | 59.861 | 40.139 | 0.027 | ||||||||
| pg18beta1_o2nofp.cx10d_c8r32 | 60.306 | 39.694 | 0.025 |
Delete response time histogram: each cell has the percentage of responses that take <= the time in the header and max is the max response time in seconds. For max values in the top 25% of the range have a red background and in the bottom 25% of the range have a green background. The red background is not used when the min value is within 80% of the max value.
| dbms | 256us | 1ms | 4ms | 16ms | 64ms | 256ms | 1s | 4s | 16s | gt | max |
|---|---|---|---|---|---|---|---|---|---|---|---|
| pg140_o2nofp.cx10a_c8r32 | 52.722 | 47.250 | 0.028 | 0.010 | |||||||
| pg1418_o2nofp.cx10a_c8r32 | 50.194 | 49.750 | 0.056 | 0.010 | |||||||
| pg150_o2nofp.cx10a_c8r32 | 49.083 | 50.861 | 0.056 | 0.010 | |||||||
| pg1513_o2nofp.cx10a_c8r32 | 54.194 | 45.750 | 0.056 | 0.010 | |||||||
| pg160_o2nofp.cx10a_c8r32 | 48.000 | 51.944 | 0.056 | 0.010 | |||||||
| pg169_o2nofp.cx10a_c8r32 | 41.444 | 58.500 | 0.056 | 0.010 | |||||||
| pg170_o2nofp.cx10a_c8r32 | 43.472 | 56.472 | 0.056 | 0.010 | |||||||
| pg175_o2nofp.cx10a_c8r32 | 39.444 | 60.500 | 0.056 | 0.010 | |||||||
| pg18beta1_o2nofp.cx10b_c8r32 | 42.528 | 57.417 | 0.056 | 0.010 | |||||||
| pg18beta1_o2nofp.cx10c_c8r32 | 40.889 | 59.056 | 0.056 | 0.010 | |||||||
| pg18beta1_o2nofp.cx10d_c8r32 | 42.056 | 57.889 | 0.056 | 0.010 |
Performance metrics for the DBMS listed above. Some are normalized by throughput, others are not. Legend for results is here.
ips	qps	rps	rmbps	wps	wmbps	rpq	rkbpq	wpi	wkbpi	csps	cpups	cspq	cpupq	dbgb1	dbgb2	rss	maxop	p50	p99	tag
100	14554	112	0.9	57.0	1.8	0.008	0.066	0.570	18.474	55844	12.5	3.837	69	154.5	191.8	23.3	0.009	14574	14270	pg140_o2nofp.cx10a_c8r32
100	14546	111	0.9	48.4	1.7	0.008	0.065	0.484	17.756	55812	12.4	3.837	68	154.5	192.0	23.3	0.009	14542	14286	pg1418_o2nofp.cx10a_c8r32
100	14686	111	0.9	45.0	1.7	0.008	0.065	0.450	17.442	56352	12.5	3.837	68	154.5	191.8	23.3	0.010	14686	14302	pg150_o2nofp.cx10a_c8r32
100	14568	111	0.9	45.1	1.7	0.008	0.065	0.451	17.443	55851	12.5	3.834	69	154.5	192.0	23.3	0.009	14558	14302	pg1513_o2nofp.cx10a_c8r32
100	14794	112	0.9	41.2	1.7	0.008	0.064	0.412	17.109	56711	12.4	3.833	67	154.5	192.1	23.3	0.009	14798	14510	pg160_o2nofp.cx10a_c8r32
100	14487	111	0.9	45.0	1.7	0.008	0.066	0.451	17.454	55575	12.5	3.836	69	154.5	191.7	23.3	0.009	14510	14222	pg169_o2nofp.cx10a_c8r32
100	14674	111	0.9	65.0	1.9	0.008	0.065	0.650	19.247	56248	12.5	3.833	68	154.5	191.7	23.4	0.009	14654	14445	pg170_o2nofp.cx10a_c8r32
100	14537	112	0.9	61.8	1.9	0.008	0.065	0.618	18.992	55729	12.5	3.833	69	154.5	193.7	23.4	0.010	14510	14254	pg175_o2nofp.cx10a_c8r32
100	14471	112	0.9	65.1	1.9	0.008	0.064	0.652	19.293	55511	12.6	3.836	70	154.5	189.9	23.3	0.010	14493	14190	pg18beta1_o2nofp.cx10b_c8r32
100	14408	112	0.9	66.7	1.9	0.008	0.064	0.667	19.398	55238	12.6	3.834	70	154.5	191.3	23.4	0.009	14398	14142	pg18beta1_o2nofp.cx10c_c8r32
100	14375	111	0.9	66.4	1.9	0.008	0.065	0.665	19.412	55145	12.6	3.836	70	154.5	190.1	23.4	0.011	14398	14078	pg18beta1_o2nofp.cx10d_c8r32
qp100.L2
qp100.L2: point queries with 100 insert/s per client. Graphs for performance per 1-second interval are here.
Average throughput:
Query response time histogram: each cell has the percentage of responses that take <= the time in the header and max is the max response time in seconds. For max values in the top 25% of the range have a red background and in the bottom 25% of the range have a green background. The red background is not used when the min value is within 80% of the max value.
| dbms | 256us | 1ms | 4ms | 16ms | 64ms | 256ms | 1s | 4s | 16s | gt | max |
|---|---|---|---|---|---|---|---|---|---|---|---|
| pg140_o2nofp.cx10a_c8r32 | 0.844 | 99.146 | 0.009 | 0.007 | |||||||
| pg1418_o2nofp.cx10a_c8r32 | 0.852 | 99.139 | 0.009 | 0.015 | |||||||
| pg150_o2nofp.cx10a_c8r32 | 0.840 | 99.150 | 0.010 | 0.015 | |||||||
| pg1513_o2nofp.cx10a_c8r32 | 0.847 | 99.138 | 0.015 | 0.007 | |||||||
| pg160_o2nofp.cx10a_c8r32 | 0.878 | 99.112 | 0.009 | 0.007 | |||||||
| pg169_o2nofp.cx10a_c8r32 | 0.835 | 99.155 | 0.010 | 0.006 | |||||||
| pg170_o2nofp.cx10a_c8r32 | 0.807 | 99.182 | 0.011 | 0.007 | |||||||
| pg175_o2nofp.cx10a_c8r32 | 0.820 | 99.169 | 0.010 | 0.007 | |||||||
| pg18beta1_o2nofp.cx10b_c8r32 | 0.736 | 99.252 | 0.012 | 0.014 | |||||||
| pg18beta1_o2nofp.cx10c_c8r32 | 0.782 | 99.209 | 0.010 | 0.007 | |||||||
| pg18beta1_o2nofp.cx10d_c8r32 | 0.752 | 99.238 | 0.010 | 0.015 |
Insert response time histogram: each cell has the percentage of responses that take <= the time in the header and max is the max response time in seconds. For max values in the top 25% of the range have a red background and in the bottom 25% of the range have a green background. The red background is not used when the min value is within 80% of the max value.
| dbms | 256us | 1ms | 4ms | 16ms | 64ms | 256ms | 1s | 4s | 16s | gt | max |
|---|---|---|---|---|---|---|---|---|---|---|---|
| pg140_o2nofp.cx10a_c8r32 | 94.889 | 5.111 | 0.018 | ||||||||
| pg1418_o2nofp.cx10a_c8r32 | 92.944 | 7.056 | 0.024 | ||||||||
| pg150_o2nofp.cx10a_c8r32 | 93.278 | 6.722 | 0.023 | ||||||||
| pg1513_o2nofp.cx10a_c8r32 | 93.639 | 6.361 | 0.020 | ||||||||
| pg160_o2nofp.cx10a_c8r32 | 94.639 | 5.361 | 0.020 | ||||||||
| pg169_o2nofp.cx10a_c8r32 | 94.778 | 5.222 | 0.021 | ||||||||
| pg170_o2nofp.cx10a_c8r32 | 99.611 | 0.389 | 0.020 | ||||||||
| pg175_o2nofp.cx10a_c8r32 | 99.528 | 0.472 | 0.019 | ||||||||
| pg18beta1_o2nofp.cx10b_c8r32 | 99.278 | 0.722 | 0.025 | ||||||||
| pg18beta1_o2nofp.cx10c_c8r32 | 99.472 | 0.528 | 0.020 | ||||||||
| pg18beta1_o2nofp.cx10d_c8r32 | 99.361 | 0.639 | 0.024 |
Delete response time histogram: each cell has the percentage of responses that take <= the time in the header and max is the max response time in seconds. For max values in the top 25% of the range have a red background and in the bottom 25% of the range have a green background. The red background is not used when the min value is within 80% of the max value.
| dbms | 256us | 1ms | 4ms | 16ms | 64ms | 256ms | 1s | 4s | 16s | gt | max |
|---|---|---|---|---|---|---|---|---|---|---|---|
| pg140_o2nofp.cx10a_c8r32 | 0.167 | 99.806 | 0.028 | 0.009 | |||||||
| pg1418_o2nofp.cx10a_c8r32 | 99.972 | 0.028 | 0.009 | ||||||||
| pg150_o2nofp.cx10a_c8r32 | 0.056 | 99.917 | 0.028 | 0.009 | |||||||
| pg1513_o2nofp.cx10a_c8r32 | 0.278 | 99.694 | 0.028 | 0.009 | |||||||
| pg160_o2nofp.cx10a_c8r32 | 0.111 | 99.833 | 0.056 | 0.009 | |||||||
| pg169_o2nofp.cx10a_c8r32 | 0.056 | 99.917 | 0.028 | 0.009 | |||||||
| pg170_o2nofp.cx10a_c8r32 | 99.806 | 0.194 | 0.008 | ||||||||
| pg175_o2nofp.cx10a_c8r32 | 99.972 | 0.028 | 0.009 | ||||||||
| pg18beta1_o2nofp.cx10b_c8r32 | 98.583 | 1.417 | 0.009 | ||||||||
| pg18beta1_o2nofp.cx10c_c8r32 | 99.944 | 0.056 | 0.009 | ||||||||
| pg18beta1_o2nofp.cx10d_c8r32 | 99.944 | 0.056 | 0.009 |
Performance metrics for the DBMS listed above. Some are normalized by throughput, others are not. Legend for results is here.
ips	qps	rps	rmbps	wps	wmbps	rpq	rkbpq	wpi	wkbpi	csps	cpups	cspq	cpupq	dbgb1	dbgb2	rss	maxop	p50	p99	tag
100	554	7196	56.6	360.9	4.2	12.999	104.616	3.613	42.776	16071	3.5	29.030	506	154.5	191.8	23.3	0.007	576	368	pg140_o2nofp.cx10a_c8r32
100	554	7209	56.7	369.4	4.2	13.008	104.699	3.698	43.483	16100	3.5	29.052	505	154.5	192.0	23.3	0.015	576	368	pg1418_o2nofp.cx10a_c8r32
100	553	7196	56.6	368.5	4.2	13.011	104.759	3.689	43.366	16014	3.4	28.954	492	154.5	191.8	23.3	0.015	576	368	pg150_o2nofp.cx10a_c8r32
100	553	7191	56.5	368.7	4.2	13.000	104.689	3.687	43.339	16004	3.4	28.935	492	154.5	192.0	23.3	0.007	576	352	pg1513_o2nofp.cx10a_c8r32
100	557	7237	56.9	372.9	4.3	12.997	104.645	3.729	43.689	16100	3.4	28.915	489	154.5	192.1	23.3	0.007	592	368	pg160_o2nofp.cx10a_c8r32
100	553	7191	56.5	368.4	4.2	13.010	104.754	3.688	43.362	15998	3.5	28.945	507	154.5	191.7	23.3	0.006	576	368	pg169_o2nofp.cx10a_c8r32
100	550	7158	56.3	345.8	4.1	13.010	104.720	3.458	41.558	16248	4.2	29.530	611	154.5	191.7	23.4	0.007	576	368	pg170_o2nofp.cx10a_c8r32
100	554	7196	56.6	349.0	4.1	12.998	104.655	3.490	41.801	16000	3.5	28.902	506	154.5	193.7	23.4	0.007	576	368	pg175_o2nofp.cx10a_c8r32
100	544	7113	55.9	345.9	4.1	13.087	105.406	3.463	41.606	15805	3.6	29.079	530	154.5	189.9	23.3	0.014	576	352	pg18beta1_o2nofp.cx10b_c8r32
100	549	7138	56.1	344.1	4.0	13.002	104.667	3.441	41.414	15871	3.6	28.908	525	154.5	191.3	23.4	0.007	576	368	pg18beta1_o2nofp.cx10c_c8r32
100	548	7132	56.1	345.1	4.1	13.012	104.772	3.454	41.534	15861	3.6	28.939	525	154.5	190.1	23.4	0.015	576	368	pg18beta1_o2nofp.cx10d_c8r32
qr500.L3
qr500.L3: range queries with 500 insert/s per client. Graphs for performance per 1-second interval are here.
Average throughput:

Query response time histogram: each cell has the percentage of responses that take <= the time in the header and max is the max response time in seconds. For max values in the top 25% of the range have a red background and in the bottom 25% of the range have a green background. The red background is not used when the min value is within 80% of the max value.
| dbms | 256us | 1ms | 4ms | 16ms | 64ms | 256ms | 1s | 4s | 16s | gt | max |
|---|---|---|---|---|---|---|---|---|---|---|---|
| pg140_o2nofp.cx10a_c8r32 | 99.983 | 0.016 | nonzero | nonzero | nonzero | 0.022 | |||||
| pg1418_o2nofp.cx10a_c8r32 | 99.982 | 0.017 | nonzero | 0.001 | nonzero | 0.026 | |||||
| pg150_o2nofp.cx10a_c8r32 | 99.982 | 0.017 | nonzero | nonzero | nonzero | 0.025 | |||||
| pg1513_o2nofp.cx10a_c8r32 | 99.982 | 0.017 | nonzero | nonzero | nonzero | 0.042 | |||||
| pg160_o2nofp.cx10a_c8r32 | 99.984 | 0.015 | nonzero | nonzero | nonzero | 0.029 | |||||
| pg169_o2nofp.cx10a_c8r32 | 99.981 | 0.018 | nonzero | nonzero | nonzero | 0.025 | |||||
| pg170_o2nofp.cx10a_c8r32 | 99.983 | 0.016 | nonzero | nonzero | nonzero | 0.025 | |||||
| pg175_o2nofp.cx10a_c8r32 | 99.982 | 0.018 | nonzero | nonzero | nonzero | 0.028 | |||||
| pg18beta1_o2nofp.cx10b_c8r32 | 99.984 | 0.016 | nonzero | nonzero | nonzero | 0.018 | |||||
| pg18beta1_o2nofp.cx10c_c8r32 | 99.982 | 0.017 | nonzero | nonzero | nonzero | 0.031 | |||||
| pg18beta1_o2nofp.cx10d_c8r32 | 99.983 | 0.017 | nonzero | nonzero | nonzero | 0.028 |
Insert response time histogram: each cell has the percentage of responses that take <= the time in the header and max is the max response time in seconds. For max values in the top 25% of the range have a red background and in the bottom 25% of the range have a green background. The red background is not used when the min value is within 80% of the max value.
| dbms | 256us | 1ms | 4ms | 16ms | 64ms | 256ms | 1s | 4s | 16s | gt | max |
|---|---|---|---|---|---|---|---|---|---|---|---|
| pg140_o2nofp.cx10a_c8r32 | 93.367 | 6.633 | 0.027 | ||||||||
| pg1418_o2nofp.cx10a_c8r32 | 91.856 | 8.144 | 0.027 | ||||||||
| pg150_o2nofp.cx10a_c8r32 | 91.694 | 8.306 | 0.030 | ||||||||
| pg1513_o2nofp.cx10a_c8r32 | 91.739 | 8.261 | 0.030 | ||||||||
| pg160_o2nofp.cx10a_c8r32 | 91.522 | 8.478 | 0.030 | ||||||||
| pg169_o2nofp.cx10a_c8r32 | 91.872 | 8.128 | 0.030 | ||||||||
| pg170_o2nofp.cx10a_c8r32 | 93.406 | 6.594 | 0.025 | ||||||||
| pg175_o2nofp.cx10a_c8r32 | 93.156 | 6.844 | 0.025 | ||||||||
| pg18beta1_o2nofp.cx10b_c8r32 | 93.417 | 6.583 | 0.030 | ||||||||
| pg18beta1_o2nofp.cx10c_c8r32 | 93.733 | 6.267 | 0.030 | ||||||||
| pg18beta1_o2nofp.cx10d_c8r32 | 93.633 | 6.367 | 0.029 |
Delete response time histogram: each cell has the percentage of responses that take <= the time in the header and max is the max response time in seconds. For max values in the top 25% of the range have a red background and in the bottom 25% of the range have a green background. The red background is not used when the min value is within 80% of the max value.
| dbms | 256us | 1ms | 4ms | 16ms | 64ms | 256ms | 1s | 4s | 16s | gt | max |
|---|---|---|---|---|---|---|---|---|---|---|---|
| pg140_o2nofp.cx10a_c8r32 | 47.800 | 52.200 | 0.015 | ||||||||
| pg1418_o2nofp.cx10a_c8r32 | 45.861 | 54.139 | 0.015 | ||||||||
| pg150_o2nofp.cx10a_c8r32 | 44.889 | 55.111 | 0.014 | ||||||||
| pg1513_o2nofp.cx10a_c8r32 | 38.739 | 61.261 | 0.015 | ||||||||
| pg160_o2nofp.cx10a_c8r32 | 43.883 | 56.117 | 0.015 | ||||||||
| pg169_o2nofp.cx10a_c8r32 | 42.022 | 57.978 | 0.015 | ||||||||
| pg170_o2nofp.cx10a_c8r32 | 43.050 | 56.950 | 0.015 | ||||||||
| pg175_o2nofp.cx10a_c8r32 | 36.561 | 63.439 | 0.015 | ||||||||
| pg18beta1_o2nofp.cx10b_c8r32 | 36.100 | 63.894 | 0.006 | 0.016 | |||||||
| pg18beta1_o2nofp.cx10c_c8r32 | 36.222 | 63.778 | 0.016 | ||||||||
| pg18beta1_o2nofp.cx10d_c8r32 | 30.744 | 69.256 | 0.016 |
Performance metrics for the DBMS listed above. Some are normalized by throughput, others are not. Legend for results is here.
ips	qps	rps	rmbps	wps	wmbps	rpq	rkbpq	wpi	wkbpi	csps	cpups	cspq	cpupq	dbgb1	dbgb2	rss	maxop	p50	p99	tag
500	13999	869	6.9	313.5	8.9	0.062	0.507	0.627	18.322	55377	13.6	3.956	78	154.6	190.1	23.3	0.022	14014	13486	pg140_o2nofp.cx10a_c8r32
500	13787	870	6.9	285.5	8.6	0.063	0.515	0.571	17.682	54572	13.6	3.958	79	154.6	190.1	23.3	0.026	13806	13262	pg1418_o2nofp.cx10a_c8r32
500	13942	869	6.9	279.1	8.6	0.062	0.509	0.558	17.532	55105	13.6	3.952	78	154.6	190.3	23.3	0.025	13965	13406	pg150_o2nofp.cx10a_c8r32
500	13735	870	6.9	279.3	8.6	0.063	0.517	0.559	17.556	54330	13.7	3.956	80	154.6	190.4	23.3	0.042	13742	13214	pg1513_o2nofp.cx10a_c8r32
500	14082	868	6.9	264.6	8.4	0.062	0.503	0.529	17.207	55616	13.6	3.949	77	154.6	190.4	23.3	0.029	14094	13550	pg160_o2nofp.cx10a_c8r32
500	13749	869	6.9	280.1	8.6	0.063	0.516	0.561	17.565	54384	13.7	3.955	80	154.6	190.3	23.3	0.025	13758	13230	pg169_o2nofp.cx10a_c8r32
500	13867	869	6.9	346.8	9.3	0.063	0.512	0.694	19.090	54762	13.7	3.949	79	154.6	190.2	23.4	0.025	13886	13294	pg170_o2nofp.cx10a_c8r32
500	13638	870	6.9	338.0	9.2	0.064	0.521	0.676	18.909	53925	13.8	3.954	81	154.6	191.3	23.4	0.028	13662	13086	pg175_o2nofp.cx10a_c8r32
500	13730	868	6.9	351.2	9.4	0.063	0.516	0.703	19.163	54275	13.7	3.953	80	154.6	190.0	23.3	0.018	13758	13230	pg18beta1_o2nofp.cx10b_c8r32
500	13255	869	6.9	353.6	9.4	0.066	0.536	0.708	19.238	52466	13.8	3.958	83	154.6	190.2	23.4	0.031	13262	12798	pg18beta1_o2nofp.cx10c_c8r32
500	13512	868	6.9	352.5	9.4	0.064	0.525	0.705	19.209	53452	13.8	3.956	82	154.6	190.0	23.4	0.028	13534	13022	pg18beta1_o2nofp.cx10d_c8r32
qp500.L4
qp500.L4: point queries with 500 insert/s per client. Graphs for performance per 1-second interval are here.
Average throughput:
Query response time histogram: each cell has the percentage of responses that take <= the time in the header and max is the max response time in seconds. For max values in the top 25% of the range have a red background and in the bottom 25% of the range have a green background. The red background is not used when the min value is within 80% of the max value.
| dbms | 256us | 1ms | 4ms | 16ms | 64ms | 256ms | 1s | 4s | 16s | gt | max |
|---|---|---|---|---|---|---|---|---|---|---|---|
| pg140_o2nofp.cx10a_c8r32 | 0.473 | 99.519 | 0.009 | 0.008 | |||||||
| pg1418_o2nofp.cx10a_c8r32 | 0.448 | 99.542 | 0.009 | 0.008 | |||||||
| pg150_o2nofp.cx10a_c8r32 | 0.452 | 99.540 | 0.008 | 0.008 | |||||||
| pg1513_o2nofp.cx10a_c8r32 | 0.424 | 99.566 | 0.009 | 0.011 | |||||||
| pg160_o2nofp.cx10a_c8r32 | 0.448 | 99.544 | 0.008 | 0.010 | |||||||
| pg169_o2nofp.cx10a_c8r32 | 0.425 | 99.565 | 0.009 | 0.007 | |||||||
| pg170_o2nofp.cx10a_c8r32 | 0.402 | 99.589 | 0.009 | 0.008 | |||||||
| pg175_o2nofp.cx10a_c8r32 | 0.427 | 99.564 | 0.009 | 0.007 | |||||||
| pg18beta1_o2nofp.cx10b_c8r32 | 0.386 | 99.605 | 0.009 | 0.009 | |||||||
| pg18beta1_o2nofp.cx10c_c8r32 | 0.411 | 99.579 | 0.010 | 0.008 | |||||||
| pg18beta1_o2nofp.cx10d_c8r32 | 0.408 | 99.583 | 0.009 | 0.010 |
Insert response time histogram: each cell has the percentage of responses that take <= the time in the header and max is the max response time in seconds. For max values in the top 25% of the range have a red background and in the bottom 25% of the range have a green background. The red background is not used when the min value is within 80% of the max value.
| dbms | 256us | 1ms | 4ms | 16ms | 64ms | 256ms | 1s | 4s | 16s | gt | max |
|---|---|---|---|---|---|---|---|---|---|---|---|
| pg140_o2nofp.cx10a_c8r32 | 99.683 | 0.317 | 0.025 | ||||||||
| pg1418_o2nofp.cx10a_c8r32 | 99.689 | 0.311 | 0.021 | ||||||||
| pg150_o2nofp.cx10a_c8r32 | 99.744 | 0.256 | 0.020 | ||||||||
| pg1513_o2nofp.cx10a_c8r32 | 99.750 | 0.250 | 0.020 | ||||||||
| pg160_o2nofp.cx10a_c8r32 | 99.739 | 0.261 | 0.020 | ||||||||
| pg169_o2nofp.cx10a_c8r32 | 99.656 | 0.344 | 0.021 | ||||||||
| pg170_o2nofp.cx10a_c8r32 | 99.789 | 0.211 | 0.021 | ||||||||
| pg175_o2nofp.cx10a_c8r32 | 99.767 | 0.233 | 0.021 | ||||||||
| pg18beta1_o2nofp.cx10b_c8r32 | 99.739 | 0.261 | 0.020 | ||||||||
| pg18beta1_o2nofp.cx10c_c8r32 | 99.722 | 0.278 | 0.022 | ||||||||
| pg18beta1_o2nofp.cx10d_c8r32 | 99.728 | 0.272 | 0.020 |
Delete response time histogram: each cell has the percentage of responses that take <= the time in the header and max is the max response time in seconds. For max values in the top 25% of the range have a red background and in the bottom 25% of the range have a green background. The red background is not used when the min value is within 80% of the max value.
| dbms | 256us | 1ms | 4ms | 16ms | 64ms | 256ms | 1s | 4s | 16s | gt | max |
|---|---|---|---|---|---|---|---|---|---|---|---|
| pg140_o2nofp.cx10a_c8r32 | 98.178 | 1.822 | 0.044 | ||||||||
| pg1418_o2nofp.cx10a_c8r32 | 98.122 | 1.878 | 0.044 | ||||||||
| pg150_o2nofp.cx10a_c8r32 | 99.361 | 0.639 | 0.040 | ||||||||
| pg1513_o2nofp.cx10a_c8r32 | 99.350 | 0.650 | 0.044 | ||||||||
| pg160_o2nofp.cx10a_c8r32 | 97.789 | 2.211 | 0.043 | ||||||||
| pg169_o2nofp.cx10a_c8r32 | 97.411 | 2.589 | 0.043 | ||||||||
| pg170_o2nofp.cx10a_c8r32 | 92.950 | 7.050 | 0.042 | ||||||||
| pg175_o2nofp.cx10a_c8r32 | 91.678 | 8.322 | 0.042 | ||||||||
| pg18beta1_o2nofp.cx10b_c8r32 | 91.083 | 8.917 | 0.044 | ||||||||
| pg18beta1_o2nofp.cx10c_c8r32 | 89.611 | 10.389 | 0.043 | ||||||||
| pg18beta1_o2nofp.cx10d_c8r32 | 91.361 | 8.639 | 0.044 |
Performance metrics for the DBMS listed above. Some are normalized by throughput, others are not. Legend for results is here.
ips	qps	rps	rmbps	wps	wmbps	rpq	rkbpq	wpi	wkbpi	csps	cpups	cspq	cpupq	dbgb1	dbgb2	rss	maxop	p50	p99	tag
500	540	7930	62.2	1588.3	18.6	14.691	118.051	3.177	38.006	17584	5.0	32.575	741	154.6	188.7	23.3	0.008	560	432	pg140_o2nofp.cx10a_c8r32
500	537	7901	62.0	1618.4	18.8	14.722	118.298	3.239	38.523	17522	5.0	32.647	745	154.6	188.7	23.3	0.008	560	432	pg1418_o2nofp.cx10a_c8r32
500	538	7909	62.1	1621.8	18.8	14.711	118.225	3.244	38.548	17497	5.0	32.546	744	154.6	188.9	23.3	0.008	560	416	pg150_o2nofp.cx10a_c8r32
500	534	7868	61.8	1621.6	18.8	14.732	118.394	3.245	38.569	17394	5.0	32.566	749	154.6	189.1	23.3	0.011	544	431	pg1513_o2nofp.cx10a_c8r32
500	537	7908	62.1	1636.3	18.9	14.719	118.287	3.275	38.814	17480	5.0	32.534	744	154.6	189.1	23.3	0.010	560	432	pg160_o2nofp.cx10a_c8r32
500	535	7872	61.8	1620.5	18.8	14.719	118.288	3.241	38.527	17395	5.1	32.526	763	154.6	189.0	23.3	0.007	560	416	pg169_o2nofp.cx10a_c8r32
500	531	7832	61.5	1549.9	18.2	14.751	118.525	3.102	37.375	17281	5.2	32.550	784	154.6	188.5	23.4	0.008	544	432	pg170_o2nofp.cx10a_c8r32
500	533	7852	61.6	1557.4	18.3	14.737	118.428	3.117	37.497	17327	5.2	32.521	781	154.6	189.0	23.4	0.007	544	432	pg175_o2nofp.cx10a_c8r32
500	528	7824	61.4	1544.6	18.2	14.822	119.133	3.089	37.264	17254	5.3	32.684	803	154.6	188.3	23.3	0.009	544	416	pg18beta1_o2nofp.cx10b_c8r32
500	531	7831	61.5	1544.2	18.2	14.742	118.460	3.090	37.277	17283	5.3	32.536	798	154.6	188.5	23.4	0.008	544	432	pg18beta1_o2nofp.cx10c_c8r32
500	532	7846	61.6	1545.2	18.2	14.737	118.423	3.092	37.287	17314	5.3	32.521	796	154.6	188.3	23.4	0.010	544	432	pg18beta1_o2nofp.cx10d_c8r32
qr1000.L5
qr1000.L5: range queries with 1000 insert/s per client. Graphs for performance per 1-second interval are here.
Average throughput:
Query response time histogram: each cell has the percentage of responses that take <= the time in the header and max is the max response time in seconds. For max values in the top 25% of the range have a red background and in the bottom 25% of the range have a green background. The red background is not used when the min value is within 80% of the max value.
| dbms | 256us | 1ms | 4ms | 16ms | 64ms | 256ms | 1s | 4s | 16s | gt | max |
|---|---|---|---|---|---|---|---|---|---|---|---|
| pg140_o2nofp.cx10a_c8r32 | 99.955 | 0.041 | 0.002 | 0.001 | nonzero | nonzero | 0.090 | ||||
| pg1418_o2nofp.cx10a_c8r32 | 99.953 | 0.043 | 0.002 | 0.002 | nonzero | nonzero | 0.095 | ||||
| pg150_o2nofp.cx10a_c8r32 | 99.955 | 0.041 | 0.002 | 0.001 | nonzero | nonzero | 0.090 | ||||
| pg1513_o2nofp.cx10a_c8r32 | 99.953 | 0.043 | 0.002 | 0.001 | nonzero | nonzero | 0.089 | ||||
| pg160_o2nofp.cx10a_c8r32 | 99.953 | 0.043 | 0.003 | 0.001 | nonzero | nonzero | 0.091 | ||||
| pg169_o2nofp.cx10a_c8r32 | 99.954 | 0.042 | 0.002 | 0.002 | nonzero | nonzero | 0.086 | ||||
| pg170_o2nofp.cx10a_c8r32 | 99.953 | 0.043 | 0.003 | 0.001 | nonzero | nonzero | 0.089 | ||||
| pg175_o2nofp.cx10a_c8r32 | 99.953 | 0.044 | 0.003 | 0.001 | nonzero | nonzero | 0.085 | ||||
| pg18beta1_o2nofp.cx10b_c8r32 | 99.950 | 0.046 | 0.003 | 0.001 | nonzero | nonzero | 0.093 | ||||
| pg18beta1_o2nofp.cx10c_c8r32 | 99.949 | 0.047 | 0.003 | 0.001 | nonzero | nonzero | 0.095 | ||||
| pg18beta1_o2nofp.cx10d_c8r32 | 99.949 | 0.047 | 0.003 | 0.001 | nonzero | nonzero | 0.099 |
Insert response time histogram: each cell has the percentage of responses that take <= the time in the header and max is the max response time in seconds. For max values in the top 25% of the range have a red background and in the bottom 25% of the range have a green background. The red background is not used when the min value is within 80% of the max value.
| dbms | 256us | 1ms | 4ms | 16ms | 64ms | 256ms | 1s | 4s | 16s | gt | max |
|---|---|---|---|---|---|---|---|---|---|---|---|
| pg140_o2nofp.cx10a_c8r32 | 96.939 | 3.061 | 0.023 | ||||||||
| pg1418_o2nofp.cx10a_c8r32 | 96.822 | 3.178 | 0.024 | ||||||||
| pg150_o2nofp.cx10a_c8r32 | 96.686 | 3.314 | 0.025 | ||||||||
| pg1513_o2nofp.cx10a_c8r32 | 96.767 | 3.233 | 0.024 | ||||||||
| pg160_o2nofp.cx10a_c8r32 | 96.739 | 3.261 | 0.023 | ||||||||
| pg169_o2nofp.cx10a_c8r32 | 96.775 | 3.225 | 0.024 | ||||||||
| pg170_o2nofp.cx10a_c8r32 | 96.869 | 3.131 | 0.024 | ||||||||
| pg175_o2nofp.cx10a_c8r32 | 96.836 | 3.164 | 0.023 | ||||||||
| pg18beta1_o2nofp.cx10b_c8r32 | 97.181 | 2.819 | 0.027 | ||||||||
| pg18beta1_o2nofp.cx10c_c8r32 | 97.033 | 2.967 | 0.027 | ||||||||
| pg18beta1_o2nofp.cx10d_c8r32 | 96.750 | 3.250 | 0.022 |
Delete response time histogram: each cell has the percentage of responses that take <= the time in the header and max is the max response time in seconds. For max values in the top 25% of the range have a red background and in the bottom 25% of the range have a green background. The red background is not used when the min value is within 80% of the max value.
| dbms | 256us | 1ms | 4ms | 16ms | 64ms | 256ms | 1s | 4s | 16s | gt | max |
|---|---|---|---|---|---|---|---|---|---|---|---|
| pg140_o2nofp.cx10a_c8r32 | 24.381 | 75.617 | 0.003 | 0.065 | |||||||
| pg1418_o2nofp.cx10a_c8r32 | 23.125 | 76.872 | 0.003 | 0.064 | |||||||
| pg150_o2nofp.cx10a_c8r32 | 15.883 | 84.117 | 0.061 | ||||||||
| pg1513_o2nofp.cx10a_c8r32 | 17.319 | 82.678 | 0.003 | 0.066 | |||||||
| pg160_o2nofp.cx10a_c8r32 | 17.564 | 82.436 | 0.063 | ||||||||
| pg169_o2nofp.cx10a_c8r32 | 19.886 | 80.114 | 0.062 | ||||||||
| pg170_o2nofp.cx10a_c8r32 | 5.078 | 94.922 | 0.062 | ||||||||
| pg175_o2nofp.cx10a_c8r32 | 6.611 | 93.389 | 0.062 | ||||||||
| pg18beta1_o2nofp.cx10b_c8r32 | 1.133 | 98.864 | 0.003 | 0.066 | |||||||
| pg18beta1_o2nofp.cx10c_c8r32 | 5.194 | 94.803 | 0.003 | 0.065 | |||||||
| pg18beta1_o2nofp.cx10d_c8r32 | 8.083 | 91.914 | 0.003 | 0.066 |
Performance metrics for the DBMS listed above. Some are normalized by throughput, others are not. Legend for results is here.
ips	qps	rps	rmbps	wps	wmbps	rpq	rkbpq	wpi	wkbpi	csps	cpups	cspq	cpupq	dbgb1	dbgb2	rss	maxop	p50	p99	tag
999	12392	1490	12.0	922.7	18.8	0.120	0.988	0.923	19.288	50695	18.5	4.091	119	154.8	187.8	23.3	0.090	12399	11630	pg140_o2nofp.cx10a_c8r32
999	12345	1490	11.9	890.1	18.4	0.121	0.991	0.891	18.840	50523	18.5	4.093	120	154.8	187.9	23.3	0.095	12350	11646	pg1418_o2nofp.cx10a_c8r32
999	12298	1489	11.9	881.6	18.3	0.121	0.995	0.883	18.749	50358	18.6	4.095	121	154.8	188.1	23.3	0.090	12318	11599	pg150_o2nofp.cx10a_c8r32
999	12093	1490	12.0	883.4	18.3	0.123	1.012	0.884	18.760	49505	18.6	4.094	123	154.8	188.1	23.3	0.089	12095	11375	pg1513_o2nofp.cx10a_c8r32
999	12433	1490	12.0	865.6	18.1	0.120	0.984	0.867	18.533	50831	18.7	4.088	120	154.8	188.2	23.3	0.091	12446	11678	pg160_o2nofp.cx10a_c8r32
999	12097	1488	11.9	883.9	18.3	0.123	1.011	0.884	18.762	49522	18.6	4.094	123	154.8	188.1	23.3	0.086	12095	11390	pg169_o2nofp.cx10a_c8r32
999	12161	1490	12.0	949.2	19.2	0.123	1.007	0.950	19.693	49732	19.4	4.089	128	154.8	187.7	23.4	0.089	12174	11454	pg170_o2nofp.cx10a_c8r32
999	11970	1488	11.9	944.4	19.1	0.124	1.022	0.945	19.599	48975	19.3	4.092	129	154.8	188.1	23.4	0.085	11982	11199	pg175_o2nofp.cx10a_c8r32
999	11830	1488	12.0	950.2	19.2	0.126	1.035	0.951	19.675	48444	19.6	4.095	133	154.8	187.5	23.3	0.093	11838	11086	pg18beta1_o2nofp.cx10b_c8r32
999	11753	1490	12.0	950.5	19.2	0.127	1.042	0.952	19.717	48177	19.4	4.099	132	154.8	187.6	23.4	0.095	11758	10990	pg18beta1_o2nofp.cx10c_c8r32
999	11647	1489	12.0	949.4	19.2	0.128	1.051	0.950	19.692	47764	19.3	4.101	133	154.8	187.5	23.4	0.099	11647	10830	pg18beta1_o2nofp.cx10d_c8r32
qp1000.L6
qp1000.L6: point queries with 1000 insert/s per client. Graphs for performance per 1-second interval are here.
Average throughput:
Query response time histogram: each cell has the percentage of responses that take <= the time in the header and max is the max response time in seconds. For max values in the top 25% of the range have a red background and in the bottom 25% of the range have a green background. The red background is not used when the min value is within 80% of the max value.
| dbms | 256us | 1ms | 4ms | 16ms | 64ms | 256ms | 1s | 4s | 16s | gt | max |
|---|---|---|---|---|---|---|---|---|---|---|---|
| pg140_o2nofp.cx10a_c8r32 | 0.205 | 99.773 | 0.022 | 0.008 | |||||||
| pg1418_o2nofp.cx10a_c8r32 | 0.193 | 99.411 | 0.395 | 0.001 | 0.037 | ||||||
| pg150_o2nofp.cx10a_c8r32 | 0.200 | 98.925 | 0.873 | 0.002 | 0.048 | ||||||
| pg1513_o2nofp.cx10a_c8r32 | 0.173 | 98.874 | 0.950 | 0.003 | 0.044 | ||||||
| pg160_o2nofp.cx10a_c8r32 | 0.185 | 99.104 | 0.710 | 0.002 | 0.043 | ||||||
| pg169_o2nofp.cx10a_c8r32 | 0.184 | 99.031 | 0.782 | 0.002 | 0.041 | ||||||
| pg170_o2nofp.cx10a_c8r32 | 0.162 | 98.929 | 0.906 | 0.003 | 0.037 | ||||||
| pg175_o2nofp.cx10a_c8r32 | 0.186 | 98.941 | 0.871 | 0.003 | 0.041 | ||||||
| pg18beta1_o2nofp.cx10b_c8r32 | 0.149 | 98.997 | 0.852 | 0.002 | 0.039 | ||||||
| pg18beta1_o2nofp.cx10c_c8r32 | 0.168 | 98.907 | 0.923 | 0.002 | 0.043 | ||||||
| pg18beta1_o2nofp.cx10d_c8r32 | 0.165 | 98.908 | 0.924 | 0.003 | 0.040 |
Insert response time histogram: each cell has the percentage of responses that take <= the time in the header and max is the max response time in seconds. For max values in the top 25% of the range have a red background and in the bottom 25% of the range have a green background. The red background is not used when the min value is within 80% of the max value.
| dbms | 256us | 1ms | 4ms | 16ms | 64ms | 256ms | 1s | 4s | 16s | gt | max |
|---|---|---|---|---|---|---|---|---|---|---|---|
| pg140_o2nofp.cx10a_c8r32 | 99.983 | 0.017 | 0.021 | ||||||||
| pg1418_o2nofp.cx10a_c8r32 | 99.453 | 0.547 | 0.050 | ||||||||
| pg150_o2nofp.cx10a_c8r32 | 97.886 | 2.114 | 0.062 | ||||||||
| pg1513_o2nofp.cx10a_c8r32 | 98.033 | 1.967 | 0.050 | ||||||||
| pg160_o2nofp.cx10a_c8r32 | 98.375 | 1.625 | 0.051 | ||||||||
| pg169_o2nofp.cx10a_c8r32 | 98.456 | 1.544 | 0.052 | ||||||||
| pg170_o2nofp.cx10a_c8r32 | 98.272 | 1.728 | 0.048 | ||||||||
| pg175_o2nofp.cx10a_c8r32 | 98.508 | 1.492 | 0.051 | ||||||||
| pg18beta1_o2nofp.cx10b_c8r32 | 98.536 | 1.464 | 0.057 | ||||||||
| pg18beta1_o2nofp.cx10c_c8r32 | 98.353 | 1.647 | 0.045 | ||||||||
| pg18beta1_o2nofp.cx10d_c8r32 | 98.328 | 1.672 | 0.052 |
Delete response time histogram: each cell has the percentage of responses that take <= the time in the header and max is the max response time in seconds. For max values in the top 25% of the range have a red background and in the bottom 25% of the range have a green background. The red background is not used when the min value is within 80% of the max value.
| dbms | 256us | 1ms | 4ms | 16ms | 64ms | 256ms | 1s | 4s | 16s | gt | max |
|---|---|---|---|---|---|---|---|---|---|---|---|
| pg140_o2nofp.cx10a_c8r32 | 99.997 | 0.003 | 0.102 | ||||||||
| pg1418_o2nofp.cx10a_c8r32 | 99.997 | 0.003 | 0.101 | ||||||||
| pg150_o2nofp.cx10a_c8r32 | 99.997 | 0.003 | 0.097 | ||||||||
| pg1513_o2nofp.cx10a_c8r32 | 99.997 | 0.003 | 0.103 | ||||||||
| pg160_o2nofp.cx10a_c8r32 | 99.997 | 0.003 | 0.100 | ||||||||
| pg169_o2nofp.cx10a_c8r32 | 99.997 | 0.003 | 0.100 | ||||||||
| pg170_o2nofp.cx10a_c8r32 | 99.997 | 0.003 | 0.097 | ||||||||
| pg175_o2nofp.cx10a_c8r32 | 99.997 | 0.003 | 0.099 | ||||||||
| pg18beta1_o2nofp.cx10b_c8r32 | 99.997 | 0.003 | 0.108 | ||||||||
| pg18beta1_o2nofp.cx10c_c8r32 | 99.997 | 0.003 | 0.103 | ||||||||
| pg18beta1_o2nofp.cx10d_c8r32 | 99.997 | 0.003 | 0.105 |
Performance metrics for the DBMS listed above. Some are normalized by throughput, others are not. Legend for results is here.
ips	qps	rps	rmbps	wps	wmbps	rpq	rkbpq	wpi	wkbpi	csps	cpups	cspq	cpupq	dbgb1	dbgb2	rss	maxop	p50	p99	tag
999	508	8714	68.4	2755.4	34.5	17.153	137.790	2.757	35.387	19270	12.5	37.933	1969	155.0	191.9	23.3	0.008	528	368	pg140_o2nofp.cx10a_c8r32
999	501	8632	67.7	2785.9	35.0	17.237	138.469	2.788	35.856	19096	12.4	38.132	1981	155.0	192.3	23.3	0.037	512	368	pg1418_o2nofp.cx10a_c8r32
999	495	8557	67.1	2787.7	34.9	17.297	138.965	2.791	35.814	18886	12.7	38.177	2054	155.0	192.4	23.3	0.048	512	368	pg150_o2nofp.cx10a_c8r32
999	491	8509	66.8	2785.1	34.9	17.326	139.196	2.787	35.724	18774	12.7	38.228	2069	155.0	192.4	23.3	0.044	512	368	pg1513_o2nofp.cx10a_c8r32
999	496	8574	67.3	2806.7	35.1	17.293	138.927	2.810	36.008	18901	12.7	38.123	2049	155.0	192.6	23.3	0.043	512	368	pg160_o2nofp.cx10a_c8r32
999	494	8543	67.0	2785.2	34.9	17.304	139.021	2.789	35.767	18838	12.9	38.158	2090	155.0	192.4	23.3	0.041	512	368	pg169_o2nofp.cx10a_c8r32
999	489	8488	66.6	2719.5	33.8	17.354	139.394	2.723	34.636	18624	13.6	38.078	2225	155.0	190.9	23.4	0.037	511	368	pg170_o2nofp.cx10a_c8r32
999	492	8519	66.8	2721.4	33.7	17.319	139.132	2.723	34.544	18706	13.7	38.027	2228	155.0	191.2	23.4	0.041	512	368	pg175_o2nofp.cx10a_c8r32
999	486	8477	66.5	2717.7	33.9	17.445	140.169	2.719	34.698	18590	14.0	38.260	2305	155.0	190.9	23.3	0.039	496	368	pg18beta1_o2nofp.cx10b_c8r32
999	488	8474	66.5	2720.4	33.7	17.351	139.385	2.722	34.549	18600	13.8	38.083	2260	155.0	190.7	23.4	0.043	496	368	pg18beta1_o2nofp.cx10c_c8r32
999	489	8478	66.5	2720.7	33.8	17.344	139.343	2.722	34.646	18615	13.9	38.083	2275	155.0	190.7	23.4	0.040	496	368	pg18beta1_o2nofp.cx10d_c8r32
l.i0
l.i0: load without secondary indexes
Performance metrics for all DBMS, not just the ones listed above. Some are normalized by throughput, others are not. Legend for results is here.
ips	qps	rps	rmbps	wps	wmbps	rpq	rkbpq	wpi	wkbpi	csps	cpups	cspq	cpupq	dbgb1	dbgb2	rss	maxop	p50	p99	tag
142883	0	24	0.2	533.5	58.6	0.000	0.001	0.004	0.420	16740	20.5	0.117	11	76.5	116.6	2.9	0.036	143680	139184	pg140_o2nofp.cx10a_c8r32
139252	0	25	0.2	522.0	57.4	0.000	0.001	0.004	0.422	16351	20.2	0.117	12	76.5	116.6	3.5	0.068	139979	136086	pg1418_o2nofp.cx10a_c8r32
146413	0	27	0.2	548.6	60.2	0.000	0.001	0.004	0.421	17086	20.5	0.117	11	76.5	116.6	2.9	0.068	147282	142983	pg150_o2nofp.cx10a_c8r32
146012	0	27	0.2	547.8	60.1	0.000	0.001	0.004	0.421	17004	20.6	0.116	11	76.5	116.6	18.8	0.062	146781	142483	pg1513_o2nofp.cx10a_c8r32
145138	0	27	0.2	544.9	59.8	0.000	0.001	0.004	0.422	16933	20.5	0.117	11	76.5	116.6	1.8	0.058	146083	141384	pg160_o2nofp.cx10a_c8r32
145059	0	27	0.2	543.7	59.6	0.000	0.001	0.004	0.421	16930	20.6	0.117	11	76.5	116.6	18.6	0.067	145883	141881	pg169_o2nofp.cx10a_c8r32
143859	0	25	0.2	538.8	59.4	0.000	0.001	0.004	0.423	14349	20.5	0.100	11	76.5	116.6	19.3	0.065	144779	140680	pg170_o2nofp.cx10a_c8r32
143292	0	25	0.2	536.9	59.1	0.000	0.001	0.004	0.422	14293	20.4	0.100	11	76.5	116.6	18.9	0.054	144180	140280	pg175_o2nofp.cx10a_c8r32
142096	0	24	0.2	530.5	58.5	0.000	0.001	0.004	0.421	14382	20.5	0.101	12	76.5	116.6	18.8	0.048	142981	124583	pg18beta1_o2nofp.cx10b_c8r32
143781	0	26	0.2	539.4	59.3	0.000	0.001	0.004	0.422	14449	20.5	0.100	11	76.5	116.6	18.9	0.046	144684	140280	pg18beta1_o2nofp.cx10c_c8r32
143369	0	25	0.2	539.7	59.4	0.000	0.001	0.004	0.424	14383	20.4	0.100	11	76.5	116.6	18.3	0.046	144380	139878	pg18beta1_o2nofp.cx10d_c8r32
l.x
l.x: create secondary indexes
Performance metrics for all DBMS, not just the ones listed above. Some are normalized by throughput, others are not. Legend for results is here.
ips	qps	rps	rmbps	wps	wmbps	rpq	rkbpq	wpi	wkbpi	csps	cpups	cspq	cpupq	dbgb1	dbgb2	rss	maxop	p50	p99	tag
279916	0	741	91.9	850.7	102.1	0.003	0.336	0.003	0.374	369	13.0	0.001	4	153.6	193.7	23.4	0.004	NA	NA	pg140_o2nofp.cx10a_c8r32
282087	0	746	92.6	874.7	103.2	0.003	0.336	0.003	0.375	390	12.8	0.001	4	153.6	193.7	1.9	0.003	NA	NA	pg1418_o2nofp.cx10a_c8r32
302801	0	824	102.1	951.8	113.2	0.003	0.345	0.003	0.383	413	12.9	0.001	3	153.6	193.7	23.4	0.006	NA	NA	pg150_o2nofp.cx10a_c8r32
304762	0	829	102.7	951.8	113.7	0.003	0.345	0.003	0.382	420	13.0	0.001	3	153.6	193.7	23.4	0.004	NA	NA	pg1513_o2nofp.cx10a_c8r32
304646	0	827	102.6	951.9	114.0	0.003	0.345	0.003	0.383	429	12.9	0.001	3	153.6	193.7	23.5	0.005	NA	NA	pg160_o2nofp.cx10a_c8r32
300639	0	816	101.2	941.0	112.4	0.003	0.345	0.003	0.383	422	12.9	0.001	3	153.6	193.7	23.5	0.007	NA	NA	pg169_o2nofp.cx10a_c8r32
304878	0	826	102.7	969.5	113.9	0.003	0.345	0.003	0.382	354	13.0	0.001	3	153.6	193.7	23.4	0.004	NA	NA	pg170_o2nofp.cx10a_c8r32
311891	0	845	105.0	989.8	116.4	0.003	0.345	0.003	0.382	423	13.0	0.001	3	153.6	193.7	23.4	0.004	NA	NA	pg175_o2nofp.cx10a_c8r32
314589	0	852	105.9	997.5	117.2	0.003	0.345	0.003	0.381	426	13.0	0.001	3	153.6	193.7	23.4	0.005	NA	NA	pg18beta1_o2nofp.cx10b_c8r32
318218	0	862	107.1	994.0	118.5	0.003	0.345	0.003	0.381	1258	13.5	0.004	3	153.6	193.7	23.4	0.005	NA	NA	pg18beta1_o2nofp.cx10c_c8r32
317334	0	860	106.8	1006.2	118.2	0.003	0.345	0.003	0.381	1010	13.4	0.003	3	153.6	193.7	23.4	0.005	NA	NA	pg18beta1_o2nofp.cx10d_c8r32
l.i1
l.i1: continue load after secondary indexes created with 50 inserts per transaction
Performance metrics for all DBMS, not just the ones listed above. Some are normalized by throughput, others are not. Legend for results is here.
ips	qps	rps	rmbps	wps	wmbps	rpq	rkbpq	wpi	wkbpi	csps	cpups	cspq	cpupq	dbgb1	dbgb2	rss	maxop	p50	p99	tag
3328	0	4784	37.9	3986.1	68.4	1.438	11.655	1.198	21.039	10999	14.6	3.305	351	154.3	194.3	23.0	0.040	3250	2000	pg140_o2nofp.cx10a_c8r32
3584	0	5149	40.8	4244.1	72.6	1.437	11.644	1.184	20.742	11797	15.4	3.291	344	154.3	194.3	23.0	0.050	3400	2150	pg1418_o2nofp.cx10a_c8r32
3303	0	4746	37.6	3943.5	67.5	1.437	11.650	1.194	20.915	10836	15.1	3.281	366	154.3	194.3	22.8	0.051	2800	1800	pg150_o2nofp.cx10a_c8r32
3279	0	4722	37.4	3920.1	67.0	1.440	11.678	1.196	20.924	10787	15.1	3.290	368	154.3	194.3	22.8	0.051	2750	1950	pg1513_o2nofp.cx10a_c8r32
3322	0	4778	37.8	3957.3	67.6	1.438	11.661	1.191	20.826	10910	15.1	3.284	364	154.3	194.3	22.9	0.063	3149	1800	pg160_o2nofp.cx10a_c8r32
3413	0	4907	38.8	4078.6	69.7	1.438	11.656	1.195	20.924	11188	15.3	3.278	359	154.3	194.3	22.8	0.050	3150	2000	pg169_o2nofp.cx10a_c8r32
3185	0	4574	36.2	3770.8	64.5	1.436	11.645	1.184	20.732	10315	15.0	3.239	377	154.3	194.3	22.8	0.056	2850	1800	pg170_o2nofp.cx10a_c8r32
3101	0	4484	35.5	3687.9	63.0	1.446	11.724	1.189	20.803	10040	14.8	3.238	382	154.3	194.3	22.7	0.051	2499	1800	pg175_o2nofp.cx10a_c8r32
3113	0	4482	35.5	3723.1	63.7	1.440	11.677	1.196	20.949	10086	15.0	3.240	386	154.3	194.3	22.8	0.058	2699	1750	pg18beta1_o2nofp.cx10b_c8r32
3056	0	4395	34.8	3638.7	62.2	1.438	11.659	1.191	20.837	9891	14.9	3.237	390	154.3	194.3	22.8	0.052	2750	1550	pg18beta1_o2nofp.cx10c_c8r32
3122	0	4488	35.5	3706.7	63.2	1.437	11.652	1.187	20.719	10135	14.9	3.246	382	154.3	194.3	23.1	0.053	2750	1800	pg18beta1_o2nofp.cx10d_c8r32
l.i2
l.i2: continue load after secondary indexes created with 5 inserts per transaction
Performance metrics for all DBMS, not just the ones listed above. Some are normalized by throughput, others are not. Legend for results is here.
ips	qps	rps	rmbps	wps	wmbps	rpq	rkbpq	wpi	wkbpi	csps	cpups	cspq	cpupq	dbgb1	dbgb2	rss	maxop	p50	p99	tag
188	0	207	1.7	543.1	7.4	1.101	8.996	2.883	40.358	1465	12.9	7.779	5478	154.5	194.5	23.3	0.009	190	160	pg140_o2nofp.cx10a_c8r32
191	0	204	1.6	554.1	7.5	1.072	8.760	2.906	40.311	1478	12.9	7.752	5412	154.5	194.5	23.3	0.040	190	165	pg1418_o2nofp.cx10a_c8r32
180	0	193	1.5	515.5	7.2	1.071	8.761	2.859	40.760	1338	12.8	7.419	5679	154.4	194.5	23.3	0.033	180	150	pg150_o2nofp.cx10a_c8r32
172	0	184	1.5	497.1	6.9	1.072	8.770	2.895	41.339	1286	12.7	7.491	5917	154.4	194.5	23.3	0.025	170	145	pg1513_o2nofp.cx10a_c8r32
178	0	190	1.5	513.6	7.1	1.071	8.765	2.893	41.201	1321	12.8	7.445	5769	154.4	194.5	23.3	0.026	180	135	pg160_o2nofp.cx10a_c8r32
175	0	187	1.5	505.9	7.0	1.071	8.764	2.894	41.031	1308	12.8	7.484	5858	154.4	194.5	23.3	0.022	175	140	pg169_o2nofp.cx10a_c8r32
164	0	175	1.4	482.2	6.7	1.071	8.763	2.948	41.752	1117	12.7	6.826	6210	154.5	194.5	23.4	0.039	160	140	pg170_o2nofp.cx10a_c8r32
161	0	173	1.4	477.5	6.6	1.072	8.770	2.958	42.056	1109	12.7	6.872	6295	154.4	194.5	23.4	0.024	160	125	pg175_o2nofp.cx10a_c8r32
154	0	165	1.3	448.5	6.3	1.074	8.789	2.918	41.840	1058	12.7	6.882	6610	154.5	191.5	23.3	0.029	155	120	pg18beta1_o2nofp.cx10b_c8r32
150	0	161	1.3	440.9	6.2	1.072	8.762	2.930	42.203	1047	12.7	6.954	6751	154.5	191.5	23.4	0.020	150	135	pg18beta1_o2nofp.cx10c_c8r32
152	0	163	1.3	443.6	6.2	1.072	8.767	2.924	41.936	1047	12.7	6.902	6697	154.5	191.6	23.4	0.020	150	120	pg18beta1_o2nofp.cx10d_c8r32
qr100.L1
qr100.L1: range queries with 100 insert/s per client
Performance metrics for all DBMS, not just the ones listed above. Some are normalized by throughput, others are not. Legend for results is here.
ips	qps	rps	rmbps	wps	wmbps	rpq	rkbpq	wpi	wkbpi	csps	cpups	cspq	cpupq	dbgb1	dbgb2	rss	maxop	p50	p99	tag
100	14554	112	0.9	57.0	1.8	0.008	0.066	0.570	18.474	55844	12.5	3.837	69	154.5	191.8	23.3	0.009	14574	14270	pg140_o2nofp.cx10a_c8r32
100	14546	111	0.9	48.4	1.7	0.008	0.065	0.484	17.756	55812	12.4	3.837	68	154.5	192.0	23.3	0.009	14542	14286	pg1418_o2nofp.cx10a_c8r32
100	14686	111	0.9	45.0	1.7	0.008	0.065	0.450	17.442	56352	12.5	3.837	68	154.5	191.8	23.3	0.010	14686	14302	pg150_o2nofp.cx10a_c8r32
100	14568	111	0.9	45.1	1.7	0.008	0.065	0.451	17.443	55851	12.5	3.834	69	154.5	192.0	23.3	0.009	14558	14302	pg1513_o2nofp.cx10a_c8r32
100	14794	112	0.9	41.2	1.7	0.008	0.064	0.412	17.109	56711	12.4	3.833	67	154.5	192.1	23.3	0.009	14798	14510	pg160_o2nofp.cx10a_c8r32
100	14487	111	0.9	45.0	1.7	0.008	0.066	0.451	17.454	55575	12.5	3.836	69	154.5	191.7	23.3	0.009	14510	14222	pg169_o2nofp.cx10a_c8r32
100	14674	111	0.9	65.0	1.9	0.008	0.065	0.650	19.247	56248	12.5	3.833	68	154.5	191.7	23.4	0.009	14654	14445	pg170_o2nofp.cx10a_c8r32
100	14537	112	0.9	61.8	1.9	0.008	0.065	0.618	18.992	55729	12.5	3.833	69	154.5	193.7	23.4	0.010	14510	14254	pg175_o2nofp.cx10a_c8r32
100	14471	112	0.9	65.1	1.9	0.008	0.064	0.652	19.293	55511	12.6	3.836	70	154.5	189.9	23.3	0.010	14493	14190	pg18beta1_o2nofp.cx10b_c8r32
100	14408	112	0.9	66.7	1.9	0.008	0.064	0.667	19.398	55238	12.6	3.834	70	154.5	191.3	23.4	0.009	14398	14142	pg18beta1_o2nofp.cx10c_c8r32
100	14375	111	0.9	66.4	1.9	0.008	0.065	0.665	19.412	55145	12.6	3.836	70	154.5	190.1	23.4	0.011	14398	14078	pg18beta1_o2nofp.cx10d_c8r32
qp100.L2
qp100.L2: point queries with 100 insert/s per client
Performance metrics for all DBMS, not just the ones listed above. Some are normalized by throughput, others are not. Legend for results is here.
ips	qps	rps	rmbps	wps	wmbps	rpq	rkbpq	wpi	wkbpi	csps	cpups	cspq	cpupq	dbgb1	dbgb2	rss	maxop	p50	p99	tag
100	554	7196	56.6	360.9	4.2	12.999	104.616	3.613	42.776	16071	3.5	29.030	506	154.5	191.8	23.3	0.007	576	368	pg140_o2nofp.cx10a_c8r32
100	554	7209	56.7	369.4	4.2	13.008	104.699	3.698	43.483	16100	3.5	29.052	505	154.5	192.0	23.3	0.015	576	368	pg1418_o2nofp.cx10a_c8r32
100	553	7196	56.6	368.5	4.2	13.011	104.759	3.689	43.366	16014	3.4	28.954	492	154.5	191.8	23.3	0.015	576	368	pg150_o2nofp.cx10a_c8r32
100	553	7191	56.5	368.7	4.2	13.000	104.689	3.687	43.339	16004	3.4	28.935	492	154.5	192.0	23.3	0.007	576	352	pg1513_o2nofp.cx10a_c8r32
100	557	7237	56.9	372.9	4.3	12.997	104.645	3.729	43.689	16100	3.4	28.915	489	154.5	192.1	23.3	0.007	592	368	pg160_o2nofp.cx10a_c8r32
100	553	7191	56.5	368.4	4.2	13.010	104.754	3.688	43.362	15998	3.5	28.945	507	154.5	191.7	23.3	0.006	576	368	pg169_o2nofp.cx10a_c8r32
100	550	7158	56.3	345.8	4.1	13.010	104.720	3.458	41.558	16248	4.2	29.530	611	154.5	191.7	23.4	0.007	576	368	pg170_o2nofp.cx10a_c8r32
100	554	7196	56.6	349.0	4.1	12.998	104.655	3.490	41.801	16000	3.5	28.902	506	154.5	193.7	23.4	0.007	576	368	pg175_o2nofp.cx10a_c8r32
100	544	7113	55.9	345.9	4.1	13.087	105.406	3.463	41.606	15805	3.6	29.079	530	154.5	189.9	23.3	0.014	576	352	pg18beta1_o2nofp.cx10b_c8r32
100	549	7138	56.1	344.1	4.0	13.002	104.667	3.441	41.414	15871	3.6	28.908	525	154.5	191.3	23.4	0.007	576	368	pg18beta1_o2nofp.cx10c_c8r32
100	548	7132	56.1	345.1	4.1	13.012	104.772	3.454	41.534	15861	3.6	28.939	525	154.5	190.1	23.4	0.015	576	368	pg18beta1_o2nofp.cx10d_c8r32
qr500.L3
qr500.L3: range queries with 500 insert/s per client
Performance metrics for all DBMS, not just the ones listed above. Some are normalized by throughput, others are not. Legend for results is here.
ips	qps	rps	rmbps	wps	wmbps	rpq	rkbpq	wpi	wkbpi	csps	cpups	cspq	cpupq	dbgb1	dbgb2	rss	maxop	p50	p99	tag
500	13999	869	6.9	313.5	8.9	0.062	0.507	0.627	18.322	55377	13.6	3.956	78	154.6	190.1	23.3	0.022	14014	13486	pg140_o2nofp.cx10a_c8r32
500	13787	870	6.9	285.5	8.6	0.063	0.515	0.571	17.682	54572	13.6	3.958	79	154.6	190.1	23.3	0.026	13806	13262	pg1418_o2nofp.cx10a_c8r32
500	13942	869	6.9	279.1	8.6	0.062	0.509	0.558	17.532	55105	13.6	3.952	78	154.6	190.3	23.3	0.025	13965	13406	pg150_o2nofp.cx10a_c8r32
500	13735	870	6.9	279.3	8.6	0.063	0.517	0.559	17.556	54330	13.7	3.956	80	154.6	190.4	23.3	0.042	13742	13214	pg1513_o2nofp.cx10a_c8r32
500	14082	868	6.9	264.6	8.4	0.062	0.503	0.529	17.207	55616	13.6	3.949	77	154.6	190.4	23.3	0.029	14094	13550	pg160_o2nofp.cx10a_c8r32
500	13749	869	6.9	280.1	8.6	0.063	0.516	0.561	17.565	54384	13.7	3.955	80	154.6	190.3	23.3	0.025	13758	13230	pg169_o2nofp.cx10a_c8r32
500	13867	869	6.9	346.8	9.3	0.063	0.512	0.694	19.090	54762	13.7	3.949	79	154.6	190.2	23.4	0.025	13886	13294	pg170_o2nofp.cx10a_c8r32
500	13638	870	6.9	338.0	9.2	0.064	0.521	0.676	18.909	53925	13.8	3.954	81	154.6	191.3	23.4	0.028	13662	13086	pg175_o2nofp.cx10a_c8r32
500	13730	868	6.9	351.2	9.4	0.063	0.516	0.703	19.163	54275	13.7	3.953	80	154.6	190.0	23.3	0.018	13758	13230	pg18beta1_o2nofp.cx10b_c8r32
500	13255	869	6.9	353.6	9.4	0.066	0.536	0.708	19.238	52466	13.8	3.958	83	154.6	190.2	23.4	0.031	13262	12798	pg18beta1_o2nofp.cx10c_c8r32
500	13512	868	6.9	352.5	9.4	0.064	0.525	0.705	19.209	53452	13.8	3.956	82	154.6	190.0	23.4	0.028	13534	13022	pg18beta1_o2nofp.cx10d_c8r32
qp500.L4
qp500.L4: point queries with 500 insert/s per client
Performance metrics for all DBMS, not just the ones listed above. Some are normalized by throughput, others are not. Legend for results is here.
ips	qps	rps	rmbps	wps	wmbps	rpq	rkbpq	wpi	wkbpi	csps	cpups	cspq	cpupq	dbgb1	dbgb2	rss	maxop	p50	p99	tag
500	540	7930	62.2	1588.3	18.6	14.691	118.051	3.177	38.006	17584	5.0	32.575	741	154.6	188.7	23.3	0.008	560	432	pg140_o2nofp.cx10a_c8r32
500	537	7901	62.0	1618.4	18.8	14.722	118.298	3.239	38.523	17522	5.0	32.647	745	154.6	188.7	23.3	0.008	560	432	pg1418_o2nofp.cx10a_c8r32
500	538	7909	62.1	1621.8	18.8	14.711	118.225	3.244	38.548	17497	5.0	32.546	744	154.6	188.9	23.3	0.008	560	416	pg150_o2nofp.cx10a_c8r32
500	534	7868	61.8	1621.6	18.8	14.732	118.394	3.245	38.569	17394	5.0	32.566	749	154.6	189.1	23.3	0.011	544	431	pg1513_o2nofp.cx10a_c8r32
500	537	7908	62.1	1636.3	18.9	14.719	118.287	3.275	38.814	17480	5.0	32.534	744	154.6	189.1	23.3	0.010	560	432	pg160_o2nofp.cx10a_c8r32
500	535	7872	61.8	1620.5	18.8	14.719	118.288	3.241	38.527	17395	5.1	32.526	763	154.6	189.0	23.3	0.007	560	416	pg169_o2nofp.cx10a_c8r32
500	531	7832	61.5	1549.9	18.2	14.751	118.525	3.102	37.375	17281	5.2	32.550	784	154.6	188.5	23.4	0.008	544	432	pg170_o2nofp.cx10a_c8r32
500	533	7852	61.6	1557.4	18.3	14.737	118.428	3.117	37.497	17327	5.2	32.521	781	154.6	189.0	23.4	0.007	544	432	pg175_o2nofp.cx10a_c8r32
500	528	7824	61.4	1544.6	18.2	14.822	119.133	3.089	37.264	17254	5.3	32.684	803	154.6	188.3	23.3	0.009	544	416	pg18beta1_o2nofp.cx10b_c8r32
500	531	7831	61.5	1544.2	18.2	14.742	118.460	3.090	37.277	17283	5.3	32.536	798	154.6	188.5	23.4	0.008	544	432	pg18beta1_o2nofp.cx10c_c8r32
500	532	7846	61.6	1545.2	18.2	14.737	118.423	3.092	37.287	17314	5.3	32.521	796	154.6	188.3	23.4	0.010	544	432	pg18beta1_o2nofp.cx10d_c8r32
qr1000.L5
qr1000.L5: range queries with 1000 insert/s per client
Performance metrics for all DBMS, not just the ones listed above. Some are normalized by throughput, others are not. Legend for results is here.
ips	qps	rps	rmbps	wps	wmbps	rpq	rkbpq	wpi	wkbpi	csps	cpups	cspq	cpupq	dbgb1	dbgb2	rss	maxop	p50	p99	tag
999	12392	1490	12.0	922.7	18.8	0.120	0.988	0.923	19.288	50695	18.5	4.091	119	154.8	187.8	23.3	0.090	12399	11630	pg140_o2nofp.cx10a_c8r32
999	12345	1490	11.9	890.1	18.4	0.121	0.991	0.891	18.840	50523	18.5	4.093	120	154.8	187.9	23.3	0.095	12350	11646	pg1418_o2nofp.cx10a_c8r32
999	12298	1489	11.9	881.6	18.3	0.121	0.995	0.883	18.749	50358	18.6	4.095	121	154.8	188.1	23.3	0.090	12318	11599	pg150_o2nofp.cx10a_c8r32
999	12093	1490	12.0	883.4	18.3	0.123	1.012	0.884	18.760	49505	18.6	4.094	123	154.8	188.1	23.3	0.089	12095	11375	pg1513_o2nofp.cx10a_c8r32
999	12433	1490	12.0	865.6	18.1	0.120	0.984	0.867	18.533	50831	18.7	4.088	120	154.8	188.2	23.3	0.091	12446	11678	pg160_o2nofp.cx10a_c8r32
999	12097	1488	11.9	883.9	18.3	0.123	1.011	0.884	18.762	49522	18.6	4.094	123	154.8	188.1	23.3	0.086	12095	11390	pg169_o2nofp.cx10a_c8r32
999	12161	1490	12.0	949.2	19.2	0.123	1.007	0.950	19.693	49732	19.4	4.089	128	154.8	187.7	23.4	0.089	12174	11454	pg170_o2nofp.cx10a_c8r32
999	11970	1488	11.9	944.4	19.1	0.124	1.022	0.945	19.599	48975	19.3	4.092	129	154.8	188.1	23.4	0.085	11982	11199	pg175_o2nofp.cx10a_c8r32
999	11830	1488	12.0	950.2	19.2	0.126	1.035	0.951	19.675	48444	19.6	4.095	133	154.8	187.5	23.3	0.093	11838	11086	pg18beta1_o2nofp.cx10b_c8r32
999	11753	1490	12.0	950.5	19.2	0.127	1.042	0.952	19.717	48177	19.4	4.099	132	154.8	187.6	23.4	0.095	11758	10990	pg18beta1_o2nofp.cx10c_c8r32
999	11647	1489	12.0	949.4	19.2	0.128	1.051	0.950	19.692	47764	19.3	4.101	133	154.8	187.5	23.4	0.099	11647	10830	pg18beta1_o2nofp.cx10d_c8r32
qp1000.L6
qp1000.L6: point queries with 1000 insert/s per client
Performance metrics for all DBMS, not just the ones listed above. Some are normalized by throughput, others are not. Legend for results is here.
ips	qps	rps	rmbps	wps	wmbps	rpq	rkbpq	wpi	wkbpi	csps	cpups	cspq	cpupq	dbgb1	dbgb2	rss	maxop	p50	p99	tag
999	508	8714	68.4	2755.4	34.5	17.153	137.790	2.757	35.387	19270	12.5	37.933	1969	155.0	191.9	23.3	0.008	528	368	pg140_o2nofp.cx10a_c8r32
999	501	8632	67.7	2785.9	35.0	17.237	138.469	2.788	35.856	19096	12.4	38.132	1981	155.0	192.3	23.3	0.037	512	368	pg1418_o2nofp.cx10a_c8r32
999	495	8557	67.1	2787.7	34.9	17.297	138.965	2.791	35.814	18886	12.7	38.177	2054	155.0	192.4	23.3	0.048	512	368	pg150_o2nofp.cx10a_c8r32
999	491	8509	66.8	2785.1	34.9	17.326	139.196	2.787	35.724	18774	12.7	38.228	2069	155.0	192.4	23.3	0.044	512	368	pg1513_o2nofp.cx10a_c8r32
999	496	8574	67.3	2806.7	35.1	17.293	138.927	2.810	36.008	18901	12.7	38.123	2049	155.0	192.6	23.3	0.043	512	368	pg160_o2nofp.cx10a_c8r32
999	494	8543	67.0	2785.2	34.9	17.304	139.021	2.789	35.767	18838	12.9	38.158	2090	155.0	192.4	23.3	0.041	512	368	pg169_o2nofp.cx10a_c8r32
999	489	8488	66.6	2719.5	33.8	17.354	139.394	2.723	34.636	18624	13.6	38.078	2225	155.0	190.9	23.4	0.037	511	368	pg170_o2nofp.cx10a_c8r32
999	492	8519	66.8	2721.4	33.7	17.319	139.132	2.723	34.544	18706	13.7	38.027	2228	155.0	191.2	23.4	0.041	512	368	pg175_o2nofp.cx10a_c8r32
999	486	8477	66.5	2717.7	33.9	17.445	140.169	2.719	34.698	18590	14.0	38.260	2305	155.0	190.9	23.3	0.039	496	368	pg18beta1_o2nofp.cx10b_c8r32
999	488	8474	66.5	2720.4	33.7	17.351	139.385	2.722	34.549	18600	13.8	38.083	2260	155.0	190.7	23.4	0.043	496	368	pg18beta1_o2nofp.cx10c_c8r32
999	489	8478	66.5	2720.7	33.8	17.344	139.343	2.722	34.646	18615	13.9	38.083	2275	155.0	190.7	23.4	0.040	496	368	pg18beta1_o2nofp.cx10d_c8r32
l.i0
- l.i0: load without secondary indexes
- Legend for results is here.
- Each entry lists the percentage of responses that fit in that bucket (slower than max time for previous bucket, faster than min time for next bucket).
Insert response time histogram
256us	1ms	4ms	16ms	64ms	256ms	1s	4s	16s	gt	max	tag
0.000	99.973	0.024	0.003	nonzero	0.000	0.000	0.000	0.000	0.000	0.036	pg140_o2nofp.cx10a_c8r32
0.000	99.964	0.031	0.004	0.001	nonzero	0.000	0.000	0.000	0.000	0.068	pg1418_o2nofp.cx10a_c8r32
0.000	99.974	0.021	0.003	0.002	nonzero	0.000	0.000	0.000	0.000	0.068	pg150_o2nofp.cx10a_c8r32
0.000	99.972	0.023	0.003	0.002	0.000	0.000	0.000	0.000	0.000	0.062	pg1513_o2nofp.cx10a_c8r32
0.000	99.972	0.023	0.003	0.002	0.000	0.000	0.000	0.000	0.000	0.058	pg160_o2nofp.cx10a_c8r32
0.000	99.973	0.022	0.003	0.001	nonzero	0.000	0.000	0.000	0.000	0.067	pg169_o2nofp.cx10a_c8r32
0.000	99.971	0.024	0.004	0.002	nonzero	0.000	0.000	0.000	0.000	0.065	pg170_o2nofp.cx10a_c8r32
0.000	99.970	0.024	0.004	0.002	0.000	0.000	0.000	0.000	0.000	0.054	pg175_o2nofp.cx10a_c8r32
0.000	99.872	0.118	0.010	0.001	0.000	0.000	0.000	0.000	0.000	0.048	pg18beta1_o2nofp.cx10b_c8r32
0.000	99.968	0.026	0.005	0.001	0.000	0.000	0.000	0.000	0.000	0.046	pg18beta1_o2nofp.cx10c_c8r32
0.000	99.967	0.026	0.006	0.001	0.000	0.000	0.000	0.000	0.000	0.046	pg18beta1_o2nofp.cx10d_c8r32
l.x
- l.x: create secondary indexes
- Legend for results is here.
- Each entry lists the percentage of responses that fit in that bucket (slower than max time for previous bucket, faster than min time for next bucket).
TODO - determine whether there is data for create index response time
l.i1
- l.i1: continue load after secondary indexes created with 50 inserts per transaction
- Legend for results is here.
- Each entry lists the percentage of responses that fit in that bucket (slower than max time for previous bucket, faster than min time for next bucket).
Insert response time histogram
256us	1ms	4ms	16ms	64ms	256ms	1s	4s	16s	gt	max	tag
0.000	0.000	0.000	99.141	0.859	0.000	0.000	0.000	0.000	0.000	0.040	pg140_o2nofp.cx10a_c8r32
0.000	0.000	0.000	98.228	1.773	0.000	0.000	0.000	0.000	0.000	0.050	pg1418_o2nofp.cx10a_c8r32
0.000	0.000	0.000	98.445	1.555	0.000	0.000	0.000	0.000	0.000	0.051	pg150_o2nofp.cx10a_c8r32
0.000	0.000	0.000	98.495	1.505	0.000	0.000	0.000	0.000	0.000	0.051	pg1513_o2nofp.cx10a_c8r32
0.000	0.000	0.000	98.306	1.694	0.000	0.000	0.000	0.000	0.000	0.063	pg160_o2nofp.cx10a_c8r32
0.000	0.000	0.000	98.171	1.829	0.000	0.000	0.000	0.000	0.000	0.050	pg169_o2nofp.cx10a_c8r32
0.000	0.000	0.000	98.460	1.540	0.000	0.000	0.000	0.000	0.000	0.056	pg170_o2nofp.cx10a_c8r32
0.000	0.000	0.000	98.621	1.379	0.000	0.000	0.000	0.000	0.000	0.051	pg175_o2nofp.cx10a_c8r32
0.000	0.000	0.000	98.572	1.427	0.000	0.000	0.000	0.000	0.000	0.058	pg18beta1_o2nofp.cx10b_c8r32
0.000	0.000	0.000	98.595	1.405	0.000	0.000	0.000	0.000	0.000	0.052	pg18beta1_o2nofp.cx10c_c8r32
0.000	0.000	0.000	98.454	1.546	0.000	0.000	0.000	0.000	0.000	0.053	pg18beta1_o2nofp.cx10d_c8r32
Delete response time histogram
256us	1ms	4ms	16ms	64ms	256ms	1s	4s	16s	gt	max	tag
0.000	0.948	16.205	48.483	34.365	0.000	0.000	0.000	0.000	0.000	0.032	pg140_o2nofp.cx10a_c8r32
0.000	0.694	16.674	51.007	31.625	0.000	0.000	0.000	0.000	0.000	0.026	pg1418_o2nofp.cx10a_c8r32
0.000	0.925	16.414	43.359	39.303	0.000	0.000	0.000	0.000	0.000	0.033	pg150_o2nofp.cx10a_c8r32
0.000	0.596	16.069	44.196	39.139	0.000	0.000	0.000	0.000	0.000	0.029	pg1513_o2nofp.cx10a_c8r32
0.000	0.759	16.980	48.265	33.996	0.000	0.000	0.000	0.000	0.000	0.031	pg160_o2nofp.cx10a_c8r32
0.000	0.514	16.799	48.193	34.495	0.000	0.000	0.000	0.000	0.000	0.033	pg169_o2nofp.cx10a_c8r32
0.000	0.476	15.313	43.139	41.072	0.000	0.000	0.000	0.000	0.000	0.034	pg170_o2nofp.cx10a_c8r32
0.000	0.517	15.865	41.474	42.144	0.000	0.000	0.000	0.000	0.000	0.033	pg175_o2nofp.cx10a_c8r32
0.000	0.434	15.422	41.789	42.355	0.000	0.000	0.000	0.000	0.000	0.038	pg18beta1_o2nofp.cx10b_c8r32
0.000	0.407	15.585	41.459	42.549	0.000	0.000	0.000	0.000	0.000	0.037	pg18beta1_o2nofp.cx10c_c8r32
0.000	0.771	15.543	40.509	43.178	0.000	0.000	0.000	0.000	0.000	0.031	pg18beta1_o2nofp.cx10d_c8r32
l.i2
- l.i2: continue load after secondary indexes created with 5 inserts per transaction
- Legend for results is here.
- Each entry lists the percentage of responses that fit in that bucket (slower than max time for previous bucket, faster than min time for next bucket).
Insert response time histogram
256us	1ms	4ms	16ms	64ms	256ms	1s	4s	16s	gt	max	tag
0.000	18.306	81.671	0.024	0.000	0.000	0.000	0.000	0.000	0.000	0.009	pg140_o2nofp.cx10a_c8r32
0.000	10.579	89.237	0.177	0.007	0.000	0.000	0.000	0.000	0.000	0.040	pg1418_o2nofp.cx10a_c8r32
0.000	9.624	90.148	0.222	0.006	0.000	0.000	0.000	0.000	0.000	0.033	pg150_o2nofp.cx10a_c8r32
0.000	9.486	90.293	0.214	0.007	0.000	0.000	0.000	0.000	0.000	0.025	pg1513_o2nofp.cx10a_c8r32
0.000	9.582	90.219	0.190	0.008	0.000	0.000	0.000	0.000	0.000	0.026	pg160_o2nofp.cx10a_c8r32
0.000	8.271	91.435	0.285	0.009	0.000	0.000	0.000	0.000	0.000	0.022	pg169_o2nofp.cx10a_c8r32
0.000	10.113	89.838	0.042	0.006	0.000	0.000	0.000	0.000	0.000	0.039	pg170_o2nofp.cx10a_c8r32
0.000	10.543	89.402	0.052	0.003	0.000	0.000	0.000	0.000	0.000	0.024	pg175_o2nofp.cx10a_c8r32
0.000	10.913	89.043	0.040	0.003	0.000	0.000	0.000	0.000	0.000	0.029	pg18beta1_o2nofp.cx10b_c8r32
0.000	10.680	89.263	0.053	0.003	0.000	0.000	0.000	0.000	0.000	0.020	pg18beta1_o2nofp.cx10c_c8r32
0.000	10.260	89.691	0.046	0.003	0.000	0.000	0.000	0.000	0.000	0.020	pg18beta1_o2nofp.cx10d_c8r32
Delete response time histogram
256us	1ms	4ms	16ms	64ms	256ms	1s	4s	16s	gt	max	tag
0.000	0.000	0.000	0.000	99.999	0.001	0.000	0.000	0.000	0.000	0.102	pg140_o2nofp.cx10a_c8r32
0.000	0.000	0.000	0.000	99.999	0.001	0.000	0.000	0.000	0.000	0.102	pg1418_o2nofp.cx10a_c8r32
0.000	0.000	0.000	0.000	99.999	0.001	0.000	0.000	0.000	0.000	0.097	pg150_o2nofp.cx10a_c8r32
0.000	0.000	0.000	0.000	99.999	0.001	0.000	0.000	0.000	0.000	0.103	pg1513_o2nofp.cx10a_c8r32
0.000	0.000	0.000	0.000	99.999	0.001	0.000	0.000	0.000	0.000	0.099	pg160_o2nofp.cx10a_c8r32
0.000	0.000	0.000	0.000	99.999	0.001	0.000	0.000	0.000	0.000	0.099	pg169_o2nofp.cx10a_c8r32
0.000	0.000	0.000	0.000	99.999	0.001	0.000	0.000	0.000	0.000	0.097	pg170_o2nofp.cx10a_c8r32
0.000	0.000	0.000	0.000	99.999	0.001	0.000	0.000	0.000	0.000	0.098	pg175_o2nofp.cx10a_c8r32
0.000	0.000	0.000	0.000	99.999	0.001	0.000	0.000	0.000	0.000	0.108	pg18beta1_o2nofp.cx10b_c8r32
0.000	0.000	0.000	0.000	99.999	0.001	0.000	0.000	0.000	0.000	0.104	pg18beta1_o2nofp.cx10c_c8r32
0.000	0.000	0.000	0.000	99.999	0.001	0.000	0.000	0.000	0.000	0.105	pg18beta1_o2nofp.cx10d_c8r32
qr100.L1
- qr100.L1: range queries with 100 insert/s per client
- Legend for results is here.
- Each entry lists the percentage of responses that fit in that bucket (slower than max time for previous bucket, faster than min time for next bucket).
Query response time histogram
256us	1ms	4ms	16ms	64ms	256ms	1s	4s	16s	gt	max	tag
99.997	0.003	nonzero	nonzero	0.000	0.000	0.000	0.000	0.000	0.000	0.009	pg140_o2nofp.cx10a_c8r32
99.997	0.003	nonzero	nonzero	0.000	0.000	0.000	0.000	0.000	0.000	0.009	pg1418_o2nofp.cx10a_c8r32
99.996	0.003	nonzero	nonzero	0.000	0.000	0.000	0.000	0.000	0.000	0.010	pg150_o2nofp.cx10a_c8r32
99.997	0.003	nonzero	nonzero	0.000	0.000	0.000	0.000	0.000	0.000	0.009	pg1513_o2nofp.cx10a_c8r32
99.996	0.004	nonzero	nonzero	0.000	0.000	0.000	0.000	0.000	0.000	0.009	pg160_o2nofp.cx10a_c8r32
99.996	0.003	nonzero	nonzero	0.000	0.000	0.000	0.000	0.000	0.000	0.009	pg169_o2nofp.cx10a_c8r32
99.997	0.003	nonzero	nonzero	0.000	0.000	0.000	0.000	0.000	0.000	0.009	pg170_o2nofp.cx10a_c8r32
99.997	0.003	nonzero	nonzero	0.000	0.000	0.000	0.000	0.000	0.000	0.010	pg175_o2nofp.cx10a_c8r32
99.996	0.004	nonzero	nonzero	0.000	0.000	0.000	0.000	0.000	0.000	0.010	pg18beta1_o2nofp.cx10b_c8r32
99.996	0.003	nonzero	nonzero	0.000	0.000	0.000	0.000	0.000	0.000	0.009	pg18beta1_o2nofp.cx10c_c8r32
99.996	0.003	nonzero	nonzero	0.000	0.000	0.000	0.000	0.000	0.000	0.011	pg18beta1_o2nofp.cx10d_c8r32
Insert response time histogram
256us	1ms	4ms	16ms	64ms	256ms	1s	4s	16s	gt	max	tag
0.000	0.000	0.000	61.139	38.861	0.000	0.000	0.000	0.000	0.000	0.024	pg140_o2nofp.cx10a_c8r32
0.000	0.000	0.000	60.306	39.694	0.000	0.000	0.000	0.000	0.000	0.025	pg1418_o2nofp.cx10a_c8r32
0.000	0.000	0.000	56.333	43.667	0.000	0.000	0.000	0.000	0.000	0.025	pg150_o2nofp.cx10a_c8r32
0.000	0.000	0.000	56.222	43.778	0.000	0.000	0.000	0.000	0.000	0.025	pg1513_o2nofp.cx10a_c8r32
0.000	0.000	0.000	55.611	44.389	0.000	0.000	0.000	0.000	0.000	0.025	pg160_o2nofp.cx10a_c8r32
0.000	0.000	0.000	56.222	43.778	0.000	0.000	0.000	0.000	0.000	0.024	pg169_o2nofp.cx10a_c8r32
0.000	0.000	0.000	59.639	40.361	0.000	0.000	0.000	0.000	0.000	0.025	pg170_o2nofp.cx10a_c8r32
0.000	0.000	0.000	59.694	40.306	0.000	0.000	0.000	0.000	0.000	0.026	pg175_o2nofp.cx10a_c8r32
0.000	0.000	0.000	60.139	39.861	0.000	0.000	0.000	0.000	0.000	0.026	pg18beta1_o2nofp.cx10b_c8r32
0.000	0.000	0.000	59.861	40.139	0.000	0.000	0.000	0.000	0.000	0.027	pg18beta1_o2nofp.cx10c_c8r32
0.000	0.000	0.000	60.306	39.694	0.000	0.000	0.000	0.000	0.000	0.025	pg18beta1_o2nofp.cx10d_c8r32
Delete response time histogram
256us	1ms	4ms	16ms	64ms	256ms	1s	4s	16s	gt	max	tag
0.000	52.722	47.250	0.028	0.000	0.000	0.000	0.000	0.000	0.000	0.010	pg140_o2nofp.cx10a_c8r32
0.000	50.194	49.750	0.056	0.000	0.000	0.000	0.000	0.000	0.000	0.010	pg1418_o2nofp.cx10a_c8r32
0.000	49.083	50.861	0.056	0.000	0.000	0.000	0.000	0.000	0.000	0.010	pg150_o2nofp.cx10a_c8r32
0.000	54.194	45.750	0.056	0.000	0.000	0.000	0.000	0.000	0.000	0.010	pg1513_o2nofp.cx10a_c8r32
0.000	48.000	51.944	0.056	0.000	0.000	0.000	0.000	0.000	0.000	0.010	pg160_o2nofp.cx10a_c8r32
0.000	41.444	58.500	0.056	0.000	0.000	0.000	0.000	0.000	0.000	0.010	pg169_o2nofp.cx10a_c8r32
0.000	43.472	56.472	0.056	0.000	0.000	0.000	0.000	0.000	0.000	0.010	pg170_o2nofp.cx10a_c8r32
0.000	39.444	60.500	0.056	0.000	0.000	0.000	0.000	0.000	0.000	0.010	pg175_o2nofp.cx10a_c8r32
0.000	42.528	57.417	0.056	0.000	0.000	0.000	0.000	0.000	0.000	0.010	pg18beta1_o2nofp.cx10b_c8r32
0.000	40.889	59.056	0.056	0.000	0.000	0.000	0.000	0.000	0.000	0.010	pg18beta1_o2nofp.cx10c_c8r32
0.000	42.056	57.889	0.056	0.000	0.000	0.000	0.000	0.000	0.000	0.010	pg18beta1_o2nofp.cx10d_c8r32
qp100.L2
- qp100.L2: point queries with 100 insert/s per client
- Legend for results is here.
- Each entry lists the percentage of responses that fit in that bucket (slower than max time for previous bucket, faster than min time for next bucket).
Query response time histogram
256us	1ms	4ms	16ms	64ms	256ms	1s	4s	16s	gt	max	tag
0.000	0.844	99.146	0.009	0.000	0.000	0.000	0.000	0.000	0.000	0.007	pg140_o2nofp.cx10a_c8r32
0.000	0.852	99.139	0.009	0.000	0.000	0.000	0.000	0.000	0.000	0.015	pg1418_o2nofp.cx10a_c8r32
0.000	0.840	99.150	0.010	0.000	0.000	0.000	0.000	0.000	0.000	0.015	pg150_o2nofp.cx10a_c8r32
0.000	0.847	99.138	0.015	0.000	0.000	0.000	0.000	0.000	0.000	0.007	pg1513_o2nofp.cx10a_c8r32
0.000	0.878	99.112	0.009	0.000	0.000	0.000	0.000	0.000	0.000	0.007	pg160_o2nofp.cx10a_c8r32
0.000	0.835	99.155	0.010	0.000	0.000	0.000	0.000	0.000	0.000	0.006	pg169_o2nofp.cx10a_c8r32
0.000	0.807	99.182	0.011	0.000	0.000	0.000	0.000	0.000	0.000	0.007	pg170_o2nofp.cx10a_c8r32
0.000	0.820	99.169	0.010	0.000	0.000	0.000	0.000	0.000	0.000	0.007	pg175_o2nofp.cx10a_c8r32
0.000	0.736	99.252	0.012	0.000	0.000	0.000	0.000	0.000	0.000	0.014	pg18beta1_o2nofp.cx10b_c8r32
0.000	0.782	99.209	0.010	0.000	0.000	0.000	0.000	0.000	0.000	0.007	pg18beta1_o2nofp.cx10c_c8r32
0.000	0.752	99.238	0.010	0.000	0.000	0.000	0.000	0.000	0.000	0.015	pg18beta1_o2nofp.cx10d_c8r32
Insert response time histogram
256us	1ms	4ms	16ms	64ms	256ms	1s	4s	16s	gt	max	tag
0.000	0.000	0.000	94.889	5.111	0.000	0.000	0.000	0.000	0.000	0.018	pg140_o2nofp.cx10a_c8r32
0.000	0.000	0.000	92.944	7.056	0.000	0.000	0.000	0.000	0.000	0.024	pg1418_o2nofp.cx10a_c8r32
0.000	0.000	0.000	93.278	6.722	0.000	0.000	0.000	0.000	0.000	0.023	pg150_o2nofp.cx10a_c8r32
0.000	0.000	0.000	93.639	6.361	0.000	0.000	0.000	0.000	0.000	0.020	pg1513_o2nofp.cx10a_c8r32
0.000	0.000	0.000	94.639	5.361	0.000	0.000	0.000	0.000	0.000	0.020	pg160_o2nofp.cx10a_c8r32
0.000	0.000	0.000	94.778	5.222	0.000	0.000	0.000	0.000	0.000	0.021	pg169_o2nofp.cx10a_c8r32
0.000	0.000	0.000	99.611	0.389	0.000	0.000	0.000	0.000	0.000	0.020	pg170_o2nofp.cx10a_c8r32
0.000	0.000	0.000	99.528	0.472	0.000	0.000	0.000	0.000	0.000	0.019	pg175_o2nofp.cx10a_c8r32
0.000	0.000	0.000	99.278	0.722	0.000	0.000	0.000	0.000	0.000	0.025	pg18beta1_o2nofp.cx10b_c8r32
0.000	0.000	0.000	99.472	0.528	0.000	0.000	0.000	0.000	0.000	0.020	pg18beta1_o2nofp.cx10c_c8r32
0.000	0.000	0.000	99.361	0.639	0.000	0.000	0.000	0.000	0.000	0.024	pg18beta1_o2nofp.cx10d_c8r32
Delete response time histogram
256us	1ms	4ms	16ms	64ms	256ms	1s	4s	16s	gt	max	tag
0.000	0.167	99.806	0.028	0.000	0.000	0.000	0.000	0.000	0.000	0.009	pg140_o2nofp.cx10a_c8r32
0.000	0.000	99.972	0.028	0.000	0.000	0.000	0.000	0.000	0.000	0.009	pg1418_o2nofp.cx10a_c8r32
0.000	0.056	99.917	0.028	0.000	0.000	0.000	0.000	0.000	0.000	0.009	pg150_o2nofp.cx10a_c8r32
0.000	0.278	99.694	0.028	0.000	0.000	0.000	0.000	0.000	0.000	0.009	pg1513_o2nofp.cx10a_c8r32
0.000	0.111	99.833	0.056	0.000	0.000	0.000	0.000	0.000	0.000	0.009	pg160_o2nofp.cx10a_c8r32
0.000	0.056	99.917	0.028	0.000	0.000	0.000	0.000	0.000	0.000	0.009	pg169_o2nofp.cx10a_c8r32
0.000	0.000	99.806	0.194	0.000	0.000	0.000	0.000	0.000	0.000	0.008	pg170_o2nofp.cx10a_c8r32
0.000	0.000	99.972	0.028	0.000	0.000	0.000	0.000	0.000	0.000	0.009	pg175_o2nofp.cx10a_c8r32
0.000	0.000	98.583	1.417	0.000	0.000	0.000	0.000	0.000	0.000	0.009	pg18beta1_o2nofp.cx10b_c8r32
0.000	0.000	99.944	0.056	0.000	0.000	0.000	0.000	0.000	0.000	0.009	pg18beta1_o2nofp.cx10c_c8r32
0.000	0.000	99.944	0.056	0.000	0.000	0.000	0.000	0.000	0.000	0.009	pg18beta1_o2nofp.cx10d_c8r32
qr500.L3
- qr500.L3: range queries with 500 insert/s per client
- Legend for results is here.
- Each entry lists the percentage of responses that fit in that bucket (slower than max time for previous bucket, faster than min time for next bucket).
Query response time histogram
256us	1ms	4ms	16ms	64ms	256ms	1s	4s	16s	gt	max	tag
99.983	0.016	nonzero	nonzero	nonzero	0.000	0.000	0.000	0.000	0.000	0.022	pg140_o2nofp.cx10a_c8r32
99.982	0.017	nonzero	0.001	nonzero	0.000	0.000	0.000	0.000	0.000	0.026	pg1418_o2nofp.cx10a_c8r32
99.982	0.017	nonzero	nonzero	nonzero	0.000	0.000	0.000	0.000	0.000	0.025	pg150_o2nofp.cx10a_c8r32
99.982	0.017	nonzero	nonzero	nonzero	0.000	0.000	0.000	0.000	0.000	0.042	pg1513_o2nofp.cx10a_c8r32
99.984	0.015	nonzero	nonzero	nonzero	0.000	0.000	0.000	0.000	0.000	0.029	pg160_o2nofp.cx10a_c8r32
99.981	0.018	nonzero	nonzero	nonzero	0.000	0.000	0.000	0.000	0.000	0.025	pg169_o2nofp.cx10a_c8r32
99.983	0.016	nonzero	nonzero	nonzero	0.000	0.000	0.000	0.000	0.000	0.025	pg170_o2nofp.cx10a_c8r32
99.982	0.018	nonzero	nonzero	nonzero	0.000	0.000	0.000	0.000	0.000	0.028	pg175_o2nofp.cx10a_c8r32
99.984	0.016	nonzero	nonzero	nonzero	0.000	0.000	0.000	0.000	0.000	0.018	pg18beta1_o2nofp.cx10b_c8r32
99.982	0.017	nonzero	nonzero	nonzero	0.000	0.000	0.000	0.000	0.000	0.031	pg18beta1_o2nofp.cx10c_c8r32
99.983	0.017	nonzero	nonzero	nonzero	0.000	0.000	0.000	0.000	0.000	0.028	pg18beta1_o2nofp.cx10d_c8r32
Insert response time histogram
256us	1ms	4ms	16ms	64ms	256ms	1s	4s	16s	gt	max	tag
0.000	0.000	0.000	93.367	6.633	0.000	0.000	0.000	0.000	0.000	0.027	pg140_o2nofp.cx10a_c8r32
0.000	0.000	0.000	91.856	8.144	0.000	0.000	0.000	0.000	0.000	0.027	pg1418_o2nofp.cx10a_c8r32
0.000	0.000	0.000	91.694	8.306	0.000	0.000	0.000	0.000	0.000	0.030	pg150_o2nofp.cx10a_c8r32
0.000	0.000	0.000	91.739	8.261	0.000	0.000	0.000	0.000	0.000	0.030	pg1513_o2nofp.cx10a_c8r32
0.000	0.000	0.000	91.522	8.478	0.000	0.000	0.000	0.000	0.000	0.030	pg160_o2nofp.cx10a_c8r32
0.000	0.000	0.000	91.872	8.128	0.000	0.000	0.000	0.000	0.000	0.030	pg169_o2nofp.cx10a_c8r32
0.000	0.000	0.000	93.406	6.594	0.000	0.000	0.000	0.000	0.000	0.025	pg170_o2nofp.cx10a_c8r32
0.000	0.000	0.000	93.156	6.844	0.000	0.000	0.000	0.000	0.000	0.025	pg175_o2nofp.cx10a_c8r32
0.000	0.000	0.000	93.417	6.583	0.000	0.000	0.000	0.000	0.000	0.030	pg18beta1_o2nofp.cx10b_c8r32
0.000	0.000	0.000	93.733	6.267	0.000	0.000	0.000	0.000	0.000	0.030	pg18beta1_o2nofp.cx10c_c8r32
0.000	0.000	0.000	93.633	6.367	0.000	0.000	0.000	0.000	0.000	0.029	pg18beta1_o2nofp.cx10d_c8r32
Delete response time histogram
256us	1ms	4ms	16ms	64ms	256ms	1s	4s	16s	gt	max	tag
0.000	0.000	47.800	52.200	0.000	0.000	0.000	0.000	0.000	0.000	0.015	pg140_o2nofp.cx10a_c8r32
0.000	0.000	45.861	54.139	0.000	0.000	0.000	0.000	0.000	0.000	0.015	pg1418_o2nofp.cx10a_c8r32
0.000	0.000	44.889	55.111	0.000	0.000	0.000	0.000	0.000	0.000	0.014	pg150_o2nofp.cx10a_c8r32
0.000	0.000	38.739	61.261	0.000	0.000	0.000	0.000	0.000	0.000	0.015	pg1513_o2nofp.cx10a_c8r32
0.000	0.000	43.883	56.117	0.000	0.000	0.000	0.000	0.000	0.000	0.015	pg160_o2nofp.cx10a_c8r32
0.000	0.000	42.022	57.978	0.000	0.000	0.000	0.000	0.000	0.000	0.015	pg169_o2nofp.cx10a_c8r32
0.000	0.000	43.050	56.950	0.000	0.000	0.000	0.000	0.000	0.000	0.015	pg170_o2nofp.cx10a_c8r32
0.000	0.000	36.561	63.439	0.000	0.000	0.000	0.000	0.000	0.000	0.015	pg175_o2nofp.cx10a_c8r32
0.000	0.000	36.100	63.894	0.006	0.000	0.000	0.000	0.000	0.000	0.016	pg18beta1_o2nofp.cx10b_c8r32
0.000	0.000	36.222	63.778	0.000	0.000	0.000	0.000	0.000	0.000	0.016	pg18beta1_o2nofp.cx10c_c8r32
0.000	0.000	30.744	69.256	0.000	0.000	0.000	0.000	0.000	0.000	0.016	pg18beta1_o2nofp.cx10d_c8r32
qp500.L4
- qp500.L4: point queries with 500 insert/s per client
- Legend for results is here.
- Each entry lists the percentage of responses that fit in that bucket (slower than max time for previous bucket, faster than min time for next bucket).
Query response time histogram
256us	1ms	4ms	16ms	64ms	256ms	1s	4s	16s	gt	max	tag
0.000	0.473	99.519	0.009	0.000	0.000	0.000	0.000	0.000	0.000	0.008	pg140_o2nofp.cx10a_c8r32
0.000	0.448	99.542	0.009	0.000	0.000	0.000	0.000	0.000	0.000	0.008	pg1418_o2nofp.cx10a_c8r32
0.000	0.452	99.540	0.008	0.000	0.000	0.000	0.000	0.000	0.000	0.008	pg150_o2nofp.cx10a_c8r32
0.000	0.424	99.566	0.009	0.000	0.000	0.000	0.000	0.000	0.000	0.011	pg1513_o2nofp.cx10a_c8r32
0.000	0.448	99.544	0.008	0.000	0.000	0.000	0.000	0.000	0.000	0.010	pg160_o2nofp.cx10a_c8r32
0.000	0.425	99.565	0.009	0.000	0.000	0.000	0.000	0.000	0.000	0.007	pg169_o2nofp.cx10a_c8r32
0.000	0.402	99.589	0.009	0.000	0.000	0.000	0.000	0.000	0.000	0.008	pg170_o2nofp.cx10a_c8r32
0.000	0.427	99.564	0.009	0.000	0.000	0.000	0.000	0.000	0.000	0.007	pg175_o2nofp.cx10a_c8r32
0.000	0.386	99.605	0.009	0.000	0.000	0.000	0.000	0.000	0.000	0.009	pg18beta1_o2nofp.cx10b_c8r32
0.000	0.411	99.579	0.010	0.000	0.000	0.000	0.000	0.000	0.000	0.008	pg18beta1_o2nofp.cx10c_c8r32
0.000	0.408	99.583	0.009	0.000	0.000	0.000	0.000	0.000	0.000	0.010	pg18beta1_o2nofp.cx10d_c8r32
Insert response time histogram
256us	1ms	4ms	16ms	64ms	256ms	1s	4s	16s	gt	max	tag
0.000	0.000	0.000	99.683	0.317	0.000	0.000	0.000	0.000	0.000	0.025	pg140_o2nofp.cx10a_c8r32
0.000	0.000	0.000	99.689	0.311	0.000	0.000	0.000	0.000	0.000	0.021	pg1418_o2nofp.cx10a_c8r32
0.000	0.000	0.000	99.744	0.256	0.000	0.000	0.000	0.000	0.000	0.020	pg150_o2nofp.cx10a_c8r32
0.000	0.000	0.000	99.750	0.250	0.000	0.000	0.000	0.000	0.000	0.020	pg1513_o2nofp.cx10a_c8r32
0.000	0.000	0.000	99.739	0.261	0.000	0.000	0.000	0.000	0.000	0.020	pg160_o2nofp.cx10a_c8r32
0.000	0.000	0.000	99.656	0.344	0.000	0.000	0.000	0.000	0.000	0.021	pg169_o2nofp.cx10a_c8r32
0.000	0.000	0.000	99.789	0.211	0.000	0.000	0.000	0.000	0.000	0.021	pg170_o2nofp.cx10a_c8r32
0.000	0.000	0.000	99.767	0.233	0.000	0.000	0.000	0.000	0.000	0.021	pg175_o2nofp.cx10a_c8r32
0.000	0.000	0.000	99.739	0.261	0.000	0.000	0.000	0.000	0.000	0.020	pg18beta1_o2nofp.cx10b_c8r32
0.000	0.000	0.000	99.722	0.278	0.000	0.000	0.000	0.000	0.000	0.022	pg18beta1_o2nofp.cx10c_c8r32
0.000	0.000	0.000	99.728	0.272	0.000	0.000	0.000	0.000	0.000	0.020	pg18beta1_o2nofp.cx10d_c8r32
Delete response time histogram
256us	1ms	4ms	16ms	64ms	256ms	1s	4s	16s	gt	max	tag
0.000	0.000	0.000	98.178	1.822	0.000	0.000	0.000	0.000	0.000	0.044	pg140_o2nofp.cx10a_c8r32
0.000	0.000	0.000	98.122	1.878	0.000	0.000	0.000	0.000	0.000	0.044	pg1418_o2nofp.cx10a_c8r32
0.000	0.000	0.000	99.361	0.639	0.000	0.000	0.000	0.000	0.000	0.040	pg150_o2nofp.cx10a_c8r32
0.000	0.000	0.000	99.350	0.650	0.000	0.000	0.000	0.000	0.000	0.044	pg1513_o2nofp.cx10a_c8r32
0.000	0.000	0.000	97.789	2.211	0.000	0.000	0.000	0.000	0.000	0.043	pg160_o2nofp.cx10a_c8r32
0.000	0.000	0.000	97.411	2.589	0.000	0.000	0.000	0.000	0.000	0.043	pg169_o2nofp.cx10a_c8r32
0.000	0.000	0.000	92.950	7.050	0.000	0.000	0.000	0.000	0.000	0.042	pg170_o2nofp.cx10a_c8r32
0.000	0.000	0.000	91.678	8.322	0.000	0.000	0.000	0.000	0.000	0.042	pg175_o2nofp.cx10a_c8r32
0.000	0.000	0.000	91.083	8.917	0.000	0.000	0.000	0.000	0.000	0.044	pg18beta1_o2nofp.cx10b_c8r32
0.000	0.000	0.000	89.611	10.389	0.000	0.000	0.000	0.000	0.000	0.043	pg18beta1_o2nofp.cx10c_c8r32
0.000	0.000	0.000	91.361	8.639	0.000	0.000	0.000	0.000	0.000	0.044	pg18beta1_o2nofp.cx10d_c8r32
qr1000.L5
- qr1000.L5: range queries with 1000 insert/s per client
- Legend for results is here.
- Each entry lists the percentage of responses that fit in that bucket (slower than max time for previous bucket, faster than min time for next bucket).
Query response time histogram
256us	1ms	4ms	16ms	64ms	256ms	1s	4s	16s	gt	max	tag
99.955	0.041	0.002	0.001	nonzero	nonzero	0.000	0.000	0.000	0.000	0.090	pg140_o2nofp.cx10a_c8r32
99.953	0.043	0.002	0.002	nonzero	nonzero	0.000	0.000	0.000	0.000	0.095	pg1418_o2nofp.cx10a_c8r32
99.955	0.041	0.002	0.001	nonzero	nonzero	0.000	0.000	0.000	0.000	0.090	pg150_o2nofp.cx10a_c8r32
99.953	0.043	0.002	0.001	nonzero	nonzero	0.000	0.000	0.000	0.000	0.089	pg1513_o2nofp.cx10a_c8r32
99.953	0.043	0.003	0.001	nonzero	nonzero	0.000	0.000	0.000	0.000	0.091	pg160_o2nofp.cx10a_c8r32
99.954	0.042	0.002	0.002	nonzero	nonzero	0.000	0.000	0.000	0.000	0.086	pg169_o2nofp.cx10a_c8r32
99.953	0.043	0.003	0.001	nonzero	nonzero	0.000	0.000	0.000	0.000	0.089	pg170_o2nofp.cx10a_c8r32
99.953	0.044	0.003	0.001	nonzero	nonzero	0.000	0.000	0.000	0.000	0.085	pg175_o2nofp.cx10a_c8r32
99.950	0.046	0.003	0.001	nonzero	nonzero	0.000	0.000	0.000	0.000	0.093	pg18beta1_o2nofp.cx10b_c8r32
99.949	0.047	0.003	0.001	nonzero	nonzero	0.000	0.000	0.000	0.000	0.095	pg18beta1_o2nofp.cx10c_c8r32
99.949	0.047	0.003	0.001	nonzero	nonzero	0.000	0.000	0.000	0.000	0.099	pg18beta1_o2nofp.cx10d_c8r32
Insert response time histogram
256us	1ms	4ms	16ms	64ms	256ms	1s	4s	16s	gt	max	tag
0.000	0.000	0.000	96.939	3.061	0.000	0.000	0.000	0.000	0.000	0.023	pg140_o2nofp.cx10a_c8r32
0.000	0.000	0.000	96.822	3.178	0.000	0.000	0.000	0.000	0.000	0.024	pg1418_o2nofp.cx10a_c8r32
0.000	0.000	0.000	96.686	3.314	0.000	0.000	0.000	0.000	0.000	0.025	pg150_o2nofp.cx10a_c8r32
0.000	0.000	0.000	96.767	3.233	0.000	0.000	0.000	0.000	0.000	0.024	pg1513_o2nofp.cx10a_c8r32
0.000	0.000	0.000	96.739	3.261	0.000	0.000	0.000	0.000	0.000	0.023	pg160_o2nofp.cx10a_c8r32
0.000	0.000	0.000	96.775	3.225	0.000	0.000	0.000	0.000	0.000	0.024	pg169_o2nofp.cx10a_c8r32
0.000	0.000	0.000	96.869	3.131	0.000	0.000	0.000	0.000	0.000	0.024	pg170_o2nofp.cx10a_c8r32
0.000	0.000	0.000	96.836	3.164	0.000	0.000	0.000	0.000	0.000	0.023	pg175_o2nofp.cx10a_c8r32
0.000	0.000	0.000	97.181	2.819	0.000	0.000	0.000	0.000	0.000	0.027	pg18beta1_o2nofp.cx10b_c8r32
0.000	0.000	0.000	97.033	2.967	0.000	0.000	0.000	0.000	0.000	0.027	pg18beta1_o2nofp.cx10c_c8r32
0.000	0.000	0.000	96.750	3.250	0.000	0.000	0.000	0.000	0.000	0.022	pg18beta1_o2nofp.cx10d_c8r32
Delete response time histogram
256us	1ms	4ms	16ms	64ms	256ms	1s	4s	16s	gt	max	tag
0.000	0.000	0.000	24.381	75.617	0.003	0.000	0.000	0.000	0.000	0.065	pg140_o2nofp.cx10a_c8r32
0.000	0.000	0.000	23.125	76.872	0.003	0.000	0.000	0.000	0.000	0.064	pg1418_o2nofp.cx10a_c8r32
0.000	0.000	0.000	15.883	84.117	0.000	0.000	0.000	0.000	0.000	0.061	pg150_o2nofp.cx10a_c8r32
0.000	0.000	0.000	17.319	82.678	0.003	0.000	0.000	0.000	0.000	0.066	pg1513_o2nofp.cx10a_c8r32
0.000	0.000	0.000	17.564	82.436	0.000	0.000	0.000	0.000	0.000	0.063	pg160_o2nofp.cx10a_c8r32
0.000	0.000	0.000	19.886	80.114	0.000	0.000	0.000	0.000	0.000	0.062	pg169_o2nofp.cx10a_c8r32
0.000	0.000	0.000	5.078	94.922	0.000	0.000	0.000	0.000	0.000	0.062	pg170_o2nofp.cx10a_c8r32
0.000	0.000	0.000	6.611	93.389	0.000	0.000	0.000	0.000	0.000	0.062	pg175_o2nofp.cx10a_c8r32
0.000	0.000	0.000	1.133	98.864	0.003	0.000	0.000	0.000	0.000	0.066	pg18beta1_o2nofp.cx10b_c8r32
0.000	0.000	0.000	5.194	94.803	0.003	0.000	0.000	0.000	0.000	0.065	pg18beta1_o2nofp.cx10c_c8r32
0.000	0.000	0.000	8.083	91.914	0.003	0.000	0.000	0.000	0.000	0.066	pg18beta1_o2nofp.cx10d_c8r32
qp1000.L6
- qp1000.L6: point queries with 1000 insert/s per client
- Legend for results is here.
- Each entry lists the percentage of responses that fit in that bucket (slower than max time for previous bucket, faster than min time for next bucket).
Query response time histogram
256us	1ms	4ms	16ms	64ms	256ms	1s	4s	16s	gt	max	tag
0.000	0.205	99.773	0.022	0.000	0.000	0.000	0.000	0.000	0.000	0.008	pg140_o2nofp.cx10a_c8r32
0.000	0.193	99.411	0.395	0.001	0.000	0.000	0.000	0.000	0.000	0.037	pg1418_o2nofp.cx10a_c8r32
0.000	0.200	98.925	0.873	0.002	0.000	0.000	0.000	0.000	0.000	0.048	pg150_o2nofp.cx10a_c8r32
0.000	0.173	98.874	0.950	0.003	0.000	0.000	0.000	0.000	0.000	0.044	pg1513_o2nofp.cx10a_c8r32
0.000	0.185	99.104	0.710	0.002	0.000	0.000	0.000	0.000	0.000	0.043	pg160_o2nofp.cx10a_c8r32
0.000	0.184	99.031	0.782	0.002	0.000	0.000	0.000	0.000	0.000	0.041	pg169_o2nofp.cx10a_c8r32
0.000	0.162	98.929	0.906	0.003	0.000	0.000	0.000	0.000	0.000	0.037	pg170_o2nofp.cx10a_c8r32
0.000	0.186	98.941	0.871	0.003	0.000	0.000	0.000	0.000	0.000	0.041	pg175_o2nofp.cx10a_c8r32
0.000	0.149	98.997	0.852	0.002	0.000	0.000	0.000	0.000	0.000	0.039	pg18beta1_o2nofp.cx10b_c8r32
0.000	0.168	98.907	0.923	0.002	0.000	0.000	0.000	0.000	0.000	0.043	pg18beta1_o2nofp.cx10c_c8r32
0.000	0.165	98.908	0.924	0.003	0.000	0.000	0.000	0.000	0.000	0.040	pg18beta1_o2nofp.cx10d_c8r32
Insert response time histogram
256us	1ms	4ms	16ms	64ms	256ms	1s	4s	16s	gt	max	tag
0.000	0.000	0.000	99.983	0.017	0.000	0.000	0.000	0.000	0.000	0.021	pg140_o2nofp.cx10a_c8r32
0.000	0.000	0.000	99.453	0.547	0.000	0.000	0.000	0.000	0.000	0.050	pg1418_o2nofp.cx10a_c8r32
0.000	0.000	0.000	97.886	2.114	0.000	0.000	0.000	0.000	0.000	0.062	pg150_o2nofp.cx10a_c8r32
0.000	0.000	0.000	98.033	1.967	0.000	0.000	0.000	0.000	0.000	0.050	pg1513_o2nofp.cx10a_c8r32
0.000	0.000	0.000	98.375	1.625	0.000	0.000	0.000	0.000	0.000	0.051	pg160_o2nofp.cx10a_c8r32
0.000	0.000	0.000	98.456	1.544	0.000	0.000	0.000	0.000	0.000	0.052	pg169_o2nofp.cx10a_c8r32
0.000	0.000	0.000	98.272	1.728	0.000	0.000	0.000	0.000	0.000	0.048	pg170_o2nofp.cx10a_c8r32
0.000	0.000	0.000	98.508	1.492	0.000	0.000	0.000	0.000	0.000	0.051	pg175_o2nofp.cx10a_c8r32
0.000	0.000	0.000	98.536	1.464	0.000	0.000	0.000	0.000	0.000	0.057	pg18beta1_o2nofp.cx10b_c8r32
0.000	0.000	0.000	98.353	1.647	0.000	0.000	0.000	0.000	0.000	0.045	pg18beta1_o2nofp.cx10c_c8r32
0.000	0.000	0.000	98.328	1.672	0.000	0.000	0.000	0.000	0.000	0.052	pg18beta1_o2nofp.cx10d_c8r32
Delete response time histogram
256us	1ms	4ms	16ms	64ms	256ms	1s	4s	16s	gt	max	tag
0.000	0.000	0.000	0.000	99.997	0.003	0.000	0.000	0.000	0.000	0.102	pg140_o2nofp.cx10a_c8r32
0.000	0.000	0.000	0.000	99.997	0.003	0.000	0.000	0.000	0.000	0.101	pg1418_o2nofp.cx10a_c8r32
0.000	0.000	0.000	0.000	99.997	0.003	0.000	0.000	0.000	0.000	0.097	pg150_o2nofp.cx10a_c8r32
0.000	0.000	0.000	0.000	99.997	0.003	0.000	0.000	0.000	0.000	0.103	pg1513_o2nofp.cx10a_c8r32
0.000	0.000	0.000	0.000	99.997	0.003	0.000	0.000	0.000	0.000	0.100	pg160_o2nofp.cx10a_c8r32
0.000	0.000	0.000	0.000	99.997	0.003	0.000	0.000	0.000	0.000	0.100	pg169_o2nofp.cx10a_c8r32
0.000	0.000	0.000	0.000	99.997	0.003	0.000	0.000	0.000	0.000	0.097	pg170_o2nofp.cx10a_c8r32
0.000	0.000	0.000	0.000	99.997	0.003	0.000	0.000	0.000	0.000	0.099	pg175_o2nofp.cx10a_c8r32
0.000	0.000	0.000	0.000	99.997	0.003	0.000	0.000	0.000	0.000	0.108	pg18beta1_o2nofp.cx10b_c8r32
0.000	0.000	0.000	0.000	99.997	0.003	0.000	0.000	0.000	0.000	0.103	pg18beta1_o2nofp.cx10c_c8r32
0.000	0.000	0.000	0.000	99.997	0.003	0.000	0.000	0.000	0.000	0.105	pg18beta1_o2nofp.cx10d_c8r32