Introduction
This is a report for the insert benchmark with 800M docs and 1 client(s). It is generated by scripts (bash, awk, sed) and Tufte might not be impressed. An overview of the insert benchmark is here and a short update is here. Below, by DBMS, I mean DBMS+version.config. An example is my8020.c10b40 where my means MySQL, 8020 is version 8.0.20 and c10b40 is the name for the configuration file.
The test server has 8 AMD cores, 32G RAM and an NVMe SSD. It is described here as the PN53. The benchmark was run with 1 client and there were 1 or 3 connections per client (1 for queries or inserts without rate limits, 1+1 for rate limited inserts+deletes). It uses 1 table. It loads 800M rows per table without secondary indexes, creates 3 secondary indexes per table, then inserts 4m+1m rows per table with a delete per insert to avoid growing the table. It then does 6 read+write tests for 1800s each that do queries as fast as possible with 100,100,500,500,1000,1000 inserts/s and the same for deletes/s per client concurrent with the queries. The database is larger than memory. Clients and the DBMS share one server. The per-database configs are in the per-database subdirectories here.
The tested DBMS are:
- pg175_o2nofp.cx10a_c8r32 - Postgres 17.5 with the cx10a_c8r32 config
- pg18beta1_o2nofp.cx10b_c8r32 - Postgres 18 beta1 with the cx10b_c8r32 config that uses io_method=sync
- pg18beta1_o2nofp.cx10c_c8r32 - Postgres 18 beta1 with the cx10b_c8r32 config that uses io_method=worker and io_workers=16
- pg18beta1_o2nofp.cx10d_c8r32 - Postgres 18 beta1 with the cx10b_c8r32 config that uses io_method=io_uring
Contents
- Summary
- l.i0: load without secondary indexes
- l.x: create secondary indexes
- l.i1: continue load after secondary indexes created with 50 inserts per transaction
- l.i2: continue load after secondary indexes created with 5 inserts per transaction
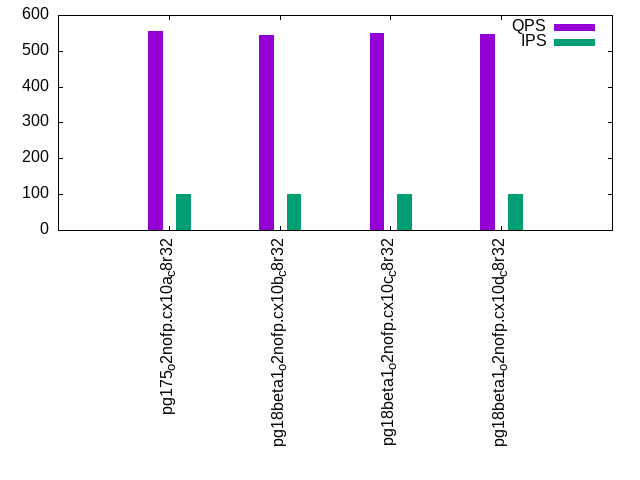
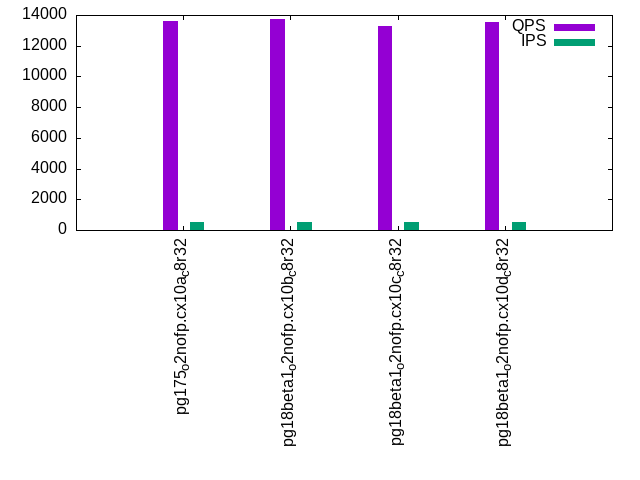
- qr100.L1: range queries with 100 insert/s per client
- qp100.L2: point queries with 100 insert/s per client
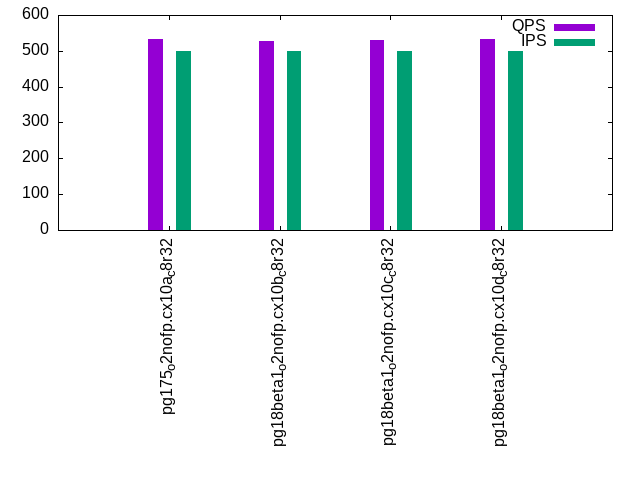
- qr500.L3: range queries with 500 insert/s per client
- qp500.L4: point queries with 500 insert/s per client
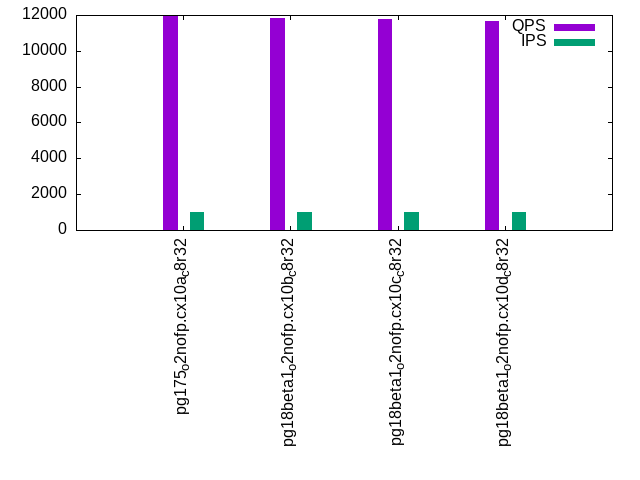
- qr1000.L5: range queries with 1000 insert/s per client
- qp1000.L6: point queries with 1000 insert/s per client
Summary
The numbers are inserts/s for l.i0, l.i1 and l.i2, indexed docs (or rows) /s for l.x and queries/s for qr100, qp100 thru qr1000, qp1000" The values are the average rate over the entire test for inserts (IPS) and queries (QPS). The range of values for IPS and QPS is split into 3 parts: bottom 25%, middle 50%, top 25%. Values in the bottom 25% have a red background, values in the top 25% have a green background and values in the middle have no color. A gray background is used for values that can be ignored because the DBMS did not sustain the target insert rate. Red backgrounds are not used when the minimum value is within 80% of the max value.
| dbms | l.i0 | l.x | l.i1 | l.i2 | qr100 | qp100 | qr500 | qp500 | qr1000 | qp1000 |
|---|---|---|---|---|---|---|---|---|---|---|
| pg175_o2nofp.cx10a_c8r32 | 143292 | 311891 | 3101 | 161 | 14537 | 554 | 13638 | 533 | 11970 | 492 |
| pg18beta1_o2nofp.cx10b_c8r32 | 142096 | 314589 | 3113 | 154 | 14471 | 544 | 13730 | 528 | 11830 | 486 |
| pg18beta1_o2nofp.cx10c_c8r32 | 143781 | 318218 | 3056 | 150 | 14408 | 549 | 13255 | 531 | 11753 | 488 |
| pg18beta1_o2nofp.cx10d_c8r32 | 143369 | 317334 | 3122 | 152 | 14375 | 548 | 13512 | 532 | 11647 | 489 |
This table has relative throughput, throughput for the DBMS relative to the DBMS in the first line, using the absolute throughput from the previous table. Values less than 0.95 have a yellow background. Values greater than 1.05 have a blue background.
| dbms | l.i0 | l.x | l.i1 | l.i2 | qr100 | qp100 | qr500 | qp500 | qr1000 | qp1000 |
|---|---|---|---|---|---|---|---|---|---|---|
| pg175_o2nofp.cx10a_c8r32 | 1.00 | 1.00 | 1.00 | 1.00 | 1.00 | 1.00 | 1.00 | 1.00 | 1.00 | 1.00 |
| pg18beta1_o2nofp.cx10b_c8r32 | 0.99 | 1.01 | 1.00 | 0.96 | 1.00 | 0.98 | 1.01 | 0.99 | 0.99 | 0.99 |
| pg18beta1_o2nofp.cx10c_c8r32 | 1.00 | 1.02 | 0.99 | 0.93 | 0.99 | 0.99 | 0.97 | 1.00 | 0.98 | 0.99 |
| pg18beta1_o2nofp.cx10d_c8r32 | 1.00 | 1.02 | 1.01 | 0.94 | 0.99 | 0.99 | 0.99 | 1.00 | 0.97 | 0.99 |
This lists the average rate of inserts/s for the tests that do inserts concurrent with queries. For such tests the query rate is listed in the table above. The read+write tests are setup so that the insert rate should match the target rate every second. Cells that are not at least 95% of the target have a red background to indicate a failure to satisfy the target.
| dbms | qr100.L1 | qp100.L2 | qr500.L3 | qp500.L4 | qr1000.L5 | qp1000.L6 |
|---|---|---|---|---|---|---|
| pg175_o2nofp.cx10a_c8r32 | 100 | 100 | 500 | 500 | 999 | 999 |
| pg18beta1_o2nofp.cx10b_c8r32 | 100 | 100 | 500 | 500 | 999 | 999 |
| pg18beta1_o2nofp.cx10c_c8r32 | 100 | 100 | 500 | 500 | 999 | 999 |
| pg18beta1_o2nofp.cx10d_c8r32 | 100 | 100 | 500 | 500 | 999 | 999 |
| target | 100 | 100 | 500 | 500 | 1000 | 1000 |
l.i0
l.i0: load without secondary indexes. Graphs for performance per 1-second interval are here.
Average throughput:

Insert response time histogram: each cell has the percentage of responses that take <= the time in the header and max is the max response time in seconds. For the max column values in the top 25% of the range have a red background and in the bottom 25% of the range have a green background. The red background is not used when the min value is within 80% of the max value.
| dbms | 256us | 1ms | 4ms | 16ms | 64ms | 256ms | 1s | 4s | 16s | gt | max |
|---|---|---|---|---|---|---|---|---|---|---|---|
| pg175_o2nofp.cx10a_c8r32 | 99.970 | 0.024 | 0.004 | 0.002 | 0.054 | ||||||
| pg18beta1_o2nofp.cx10b_c8r32 | 99.872 | 0.118 | 0.010 | 0.001 | 0.048 | ||||||
| pg18beta1_o2nofp.cx10c_c8r32 | 99.968 | 0.026 | 0.005 | 0.001 | 0.046 | ||||||
| pg18beta1_o2nofp.cx10d_c8r32 | 99.967 | 0.026 | 0.006 | 0.001 | 0.046 |
Performance metrics for the DBMS listed above. Some are normalized by throughput, others are not. Legend for results is here.
ips	qps	rps	rmbps	wps	wmbps	rpq	rkbpq	wpi	wkbpi	csps	cpups	cspq	cpupq	dbgb1	dbgb2	rss	maxop	p50	p99	tag
143292	0	25	0.2	536.9	59.1	0.000	0.001	0.004	0.422	14293	20.4	0.100	11	76.5	116.6	18.9	0.054	144180	140280	pg175_o2nofp.cx10a_c8r32
142096	0	24	0.2	530.5	58.5	0.000	0.001	0.004	0.421	14382	20.5	0.101	12	76.5	116.6	18.8	0.048	142981	124583	pg18beta1_o2nofp.cx10b_c8r32
143781	0	26	0.2	539.4	59.3	0.000	0.001	0.004	0.422	14449	20.5	0.100	11	76.5	116.6	18.9	0.046	144684	140280	pg18beta1_o2nofp.cx10c_c8r32
143369	0	25	0.2	539.7	59.4	0.000	0.001	0.004	0.424	14383	20.4	0.100	11	76.5	116.6	18.3	0.046	144380	139878	pg18beta1_o2nofp.cx10d_c8r32
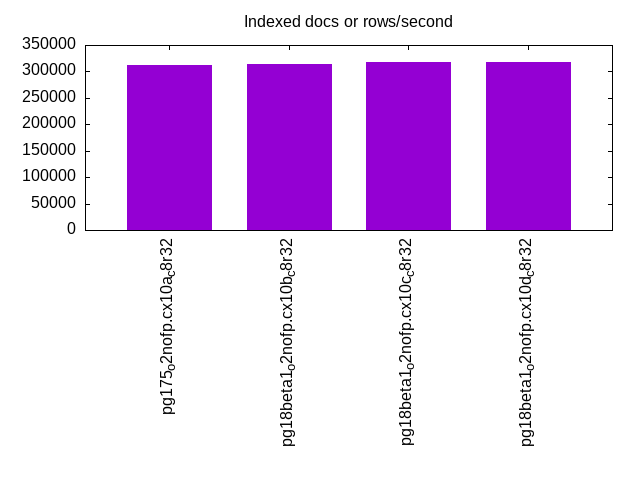
l.x
l.x: create secondary indexes.
Average throughput:
Performance metrics for the DBMS listed above. Some are normalized by throughput, others are not. Legend for results is here.
ips	qps	rps	rmbps	wps	wmbps	rpq	rkbpq	wpi	wkbpi	csps	cpups	cspq	cpupq	dbgb1	dbgb2	rss	maxop	p50	p99	tag
311891	0	845	105.0	989.8	116.4	0.003	0.345	0.003	0.382	423	13.0	0.001	3	153.6	193.7	23.4	0.004	NA	NA	pg175_o2nofp.cx10a_c8r32
314589	0	852	105.9	997.5	117.2	0.003	0.345	0.003	0.381	426	13.0	0.001	3	153.6	193.7	23.4	0.005	NA	NA	pg18beta1_o2nofp.cx10b_c8r32
318218	0	862	107.1	994.0	118.5	0.003	0.345	0.003	0.381	1258	13.5	0.004	3	153.6	193.7	23.4	0.005	NA	NA	pg18beta1_o2nofp.cx10c_c8r32
317334	0	860	106.8	1006.2	118.2	0.003	0.345	0.003	0.381	1010	13.4	0.003	3	153.6	193.7	23.4	0.005	NA	NA	pg18beta1_o2nofp.cx10d_c8r32
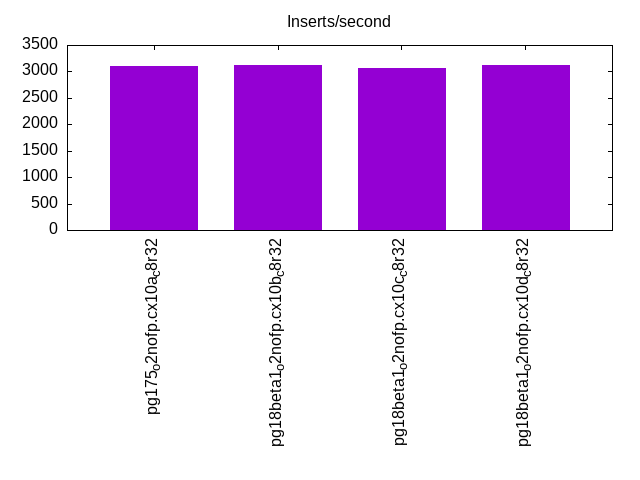
l.i1
l.i1: continue load after secondary indexes created with 50 inserts per transaction. Graphs for performance per 1-second interval are here.
Average throughput:
Insert response time histogram: each cell has the percentage of responses that take <= the time in the header and max is the max response time in seconds. For the max column values in the top 25% of the range have a red background and in the bottom 25% of the range have a green background. The red background is not used when the min value is within 80% of the max value.
| dbms | 256us | 1ms | 4ms | 16ms | 64ms | 256ms | 1s | 4s | 16s | gt | max |
|---|---|---|---|---|---|---|---|---|---|---|---|
| pg175_o2nofp.cx10a_c8r32 | 98.621 | 1.379 | 0.051 | ||||||||
| pg18beta1_o2nofp.cx10b_c8r32 | 98.572 | 1.427 | 0.058 | ||||||||
| pg18beta1_o2nofp.cx10c_c8r32 | 98.595 | 1.405 | 0.052 | ||||||||
| pg18beta1_o2nofp.cx10d_c8r32 | 98.454 | 1.546 | 0.053 |
Delete response time histogram: each cell has the percentage of responses that take <= the time in the header and max is the max response time in seconds. For the max column values in the top 25% of the range have a red background and in the bottom 25% of the range have a green background. The red background is not used when the min value is within 80% of the max value.
| dbms | 256us | 1ms | 4ms | 16ms | 64ms | 256ms | 1s | 4s | 16s | gt | max |
|---|---|---|---|---|---|---|---|---|---|---|---|
| pg175_o2nofp.cx10a_c8r32 | 0.517 | 15.865 | 41.474 | 42.144 | 0.033 | ||||||
| pg18beta1_o2nofp.cx10b_c8r32 | 0.434 | 15.422 | 41.789 | 42.355 | 0.038 | ||||||
| pg18beta1_o2nofp.cx10c_c8r32 | 0.407 | 15.585 | 41.459 | 42.549 | 0.037 | ||||||
| pg18beta1_o2nofp.cx10d_c8r32 | 0.771 | 15.543 | 40.509 | 43.178 | 0.031 |
Performance metrics for the DBMS listed above. Some are normalized by throughput, others are not. Legend for results is here.
ips	qps	rps	rmbps	wps	wmbps	rpq	rkbpq	wpi	wkbpi	csps	cpups	cspq	cpupq	dbgb1	dbgb2	rss	maxop	p50	p99	tag
3101	0	4484	35.5	3687.9	63.0	1.446	11.724	1.189	20.803	10040	14.8	3.238	382	154.3	194.3	22.7	0.051	2499	1800	pg175_o2nofp.cx10a_c8r32
3113	0	4482	35.5	3723.1	63.7	1.440	11.677	1.196	20.949	10086	15.0	3.240	386	154.3	194.3	22.8	0.058	2699	1750	pg18beta1_o2nofp.cx10b_c8r32
3056	0	4395	34.8	3638.7	62.2	1.438	11.659	1.191	20.837	9891	14.9	3.237	390	154.3	194.3	22.8	0.052	2750	1550	pg18beta1_o2nofp.cx10c_c8r32
3122	0	4488	35.5	3706.7	63.2	1.437	11.652	1.187	20.719	10135	14.9	3.246	382	154.3	194.3	23.1	0.053	2750	1800	pg18beta1_o2nofp.cx10d_c8r32
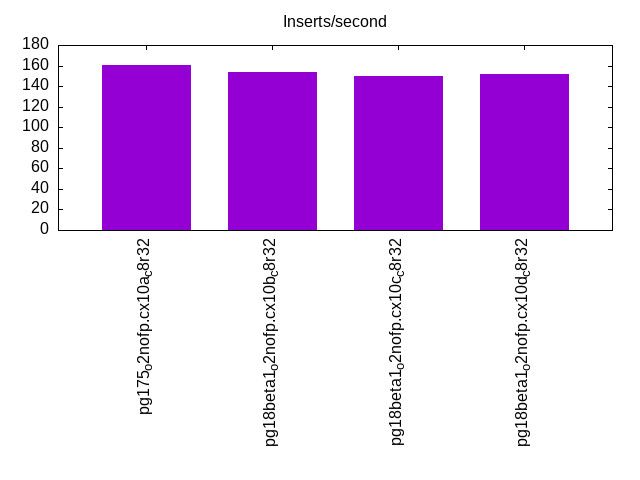
l.i2
l.i2: continue load after secondary indexes created with 5 inserts per transaction. Graphs for performance per 1-second interval are here.
Average throughput:
Insert response time histogram: each cell has the percentage of responses that take <= the time in the header and max is the max response time in seconds. For the max column values in the top 25% of the range have a red background and in the bottom 25% of the range have a green background. The red background is not used when the min value is within 80% of the max value.
| dbms | 256us | 1ms | 4ms | 16ms | 64ms | 256ms | 1s | 4s | 16s | gt | max |
|---|---|---|---|---|---|---|---|---|---|---|---|
| pg175_o2nofp.cx10a_c8r32 | 10.543 | 89.402 | 0.052 | 0.003 | 0.024 | ||||||
| pg18beta1_o2nofp.cx10b_c8r32 | 10.913 | 89.043 | 0.040 | 0.003 | 0.029 | ||||||
| pg18beta1_o2nofp.cx10c_c8r32 | 10.680 | 89.263 | 0.053 | 0.003 | 0.020 | ||||||
| pg18beta1_o2nofp.cx10d_c8r32 | 10.260 | 89.691 | 0.046 | 0.003 | 0.020 |
Delete response time histogram: each cell has the percentage of responses that take <= the time in the header and max is the max response time in seconds. For the max column values in the top 25% of the range have a red background and in the bottom 25% of the range have a green background. The red background is not used when the min value is within 80% of the max value.
| dbms | 256us | 1ms | 4ms | 16ms | 64ms | 256ms | 1s | 4s | 16s | gt | max |
|---|---|---|---|---|---|---|---|---|---|---|---|
| pg175_o2nofp.cx10a_c8r32 | 99.999 | 0.001 | 0.098 | ||||||||
| pg18beta1_o2nofp.cx10b_c8r32 | 99.999 | 0.001 | 0.108 | ||||||||
| pg18beta1_o2nofp.cx10c_c8r32 | 99.999 | 0.001 | 0.104 | ||||||||
| pg18beta1_o2nofp.cx10d_c8r32 | 99.999 | 0.001 | 0.105 |
Performance metrics for the DBMS listed above. Some are normalized by throughput, others are not. Legend for results is here.
ips	qps	rps	rmbps	wps	wmbps	rpq	rkbpq	wpi	wkbpi	csps	cpups	cspq	cpupq	dbgb1	dbgb2	rss	maxop	p50	p99	tag
161	0	173	1.4	477.5	6.6	1.072	8.770	2.958	42.056	1109	12.7	6.872	6295	154.4	194.5	23.4	0.024	160	125	pg175_o2nofp.cx10a_c8r32
154	0	165	1.3	448.5	6.3	1.074	8.789	2.918	41.840	1058	12.7	6.882	6610	154.5	191.5	23.3	0.029	155	120	pg18beta1_o2nofp.cx10b_c8r32
150	0	161	1.3	440.9	6.2	1.072	8.762	2.930	42.203	1047	12.7	6.954	6751	154.5	191.5	23.4	0.020	150	135	pg18beta1_o2nofp.cx10c_c8r32
152	0	163	1.3	443.6	6.2	1.072	8.767	2.924	41.936	1047	12.7	6.902	6697	154.5	191.6	23.4	0.020	150	120	pg18beta1_o2nofp.cx10d_c8r32
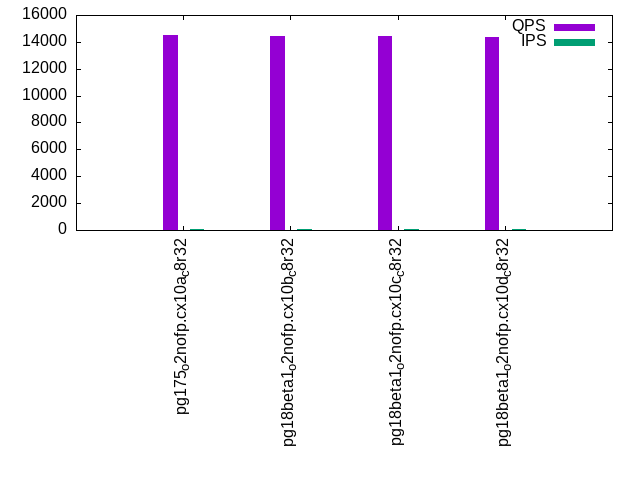
qr100.L1
qr100.L1: range queries with 100 insert/s per client. Graphs for performance per 1-second interval are here.
Average throughput:
Query response time histogram: each cell has the percentage of responses that take <= the time in the header and max is the max response time in seconds. For max values in the top 25% of the range have a red background and in the bottom 25% of the range have a green background. The red background is not used when the min value is within 80% of the max value.
| dbms | 256us | 1ms | 4ms | 16ms | 64ms | 256ms | 1s | 4s | 16s | gt | max |
|---|---|---|---|---|---|---|---|---|---|---|---|
| pg175_o2nofp.cx10a_c8r32 | 99.997 | 0.003 | nonzero | nonzero | 0.010 | ||||||
| pg18beta1_o2nofp.cx10b_c8r32 | 99.996 | 0.004 | nonzero | nonzero | 0.010 | ||||||
| pg18beta1_o2nofp.cx10c_c8r32 | 99.996 | 0.003 | nonzero | nonzero | 0.009 | ||||||
| pg18beta1_o2nofp.cx10d_c8r32 | 99.996 | 0.003 | nonzero | nonzero | 0.011 |
Insert response time histogram: each cell has the percentage of responses that take <= the time in the header and max is the max response time in seconds. For max values in the top 25% of the range have a red background and in the bottom 25% of the range have a green background. The red background is not used when the min value is within 80% of the max value.
| dbms | 256us | 1ms | 4ms | 16ms | 64ms | 256ms | 1s | 4s | 16s | gt | max |
|---|---|---|---|---|---|---|---|---|---|---|---|
| pg175_o2nofp.cx10a_c8r32 | 59.694 | 40.306 | 0.026 | ||||||||
| pg18beta1_o2nofp.cx10b_c8r32 | 60.139 | 39.861 | 0.026 | ||||||||
| pg18beta1_o2nofp.cx10c_c8r32 | 59.861 | 40.139 | 0.027 | ||||||||
| pg18beta1_o2nofp.cx10d_c8r32 | 60.306 | 39.694 | 0.025 |
Delete response time histogram: each cell has the percentage of responses that take <= the time in the header and max is the max response time in seconds. For max values in the top 25% of the range have a red background and in the bottom 25% of the range have a green background. The red background is not used when the min value is within 80% of the max value.
| dbms | 256us | 1ms | 4ms | 16ms | 64ms | 256ms | 1s | 4s | 16s | gt | max |
|---|---|---|---|---|---|---|---|---|---|---|---|
| pg175_o2nofp.cx10a_c8r32 | 39.444 | 60.500 | 0.056 | 0.010 | |||||||
| pg18beta1_o2nofp.cx10b_c8r32 | 42.528 | 57.417 | 0.056 | 0.010 | |||||||
| pg18beta1_o2nofp.cx10c_c8r32 | 40.889 | 59.056 | 0.056 | 0.010 | |||||||
| pg18beta1_o2nofp.cx10d_c8r32 | 42.056 | 57.889 | 0.056 | 0.010 |
Performance metrics for the DBMS listed above. Some are normalized by throughput, others are not. Legend for results is here.
ips	qps	rps	rmbps	wps	wmbps	rpq	rkbpq	wpi	wkbpi	csps	cpups	cspq	cpupq	dbgb1	dbgb2	rss	maxop	p50	p99	tag
100	14537	112	0.9	61.8	1.9	0.008	0.065	0.618	18.992	55729	12.5	3.833	69	154.5	193.7	23.4	0.010	14510	14254	pg175_o2nofp.cx10a_c8r32
100	14471	112	0.9	65.1	1.9	0.008	0.064	0.652	19.293	55511	12.6	3.836	70	154.5	189.9	23.3	0.010	14493	14190	pg18beta1_o2nofp.cx10b_c8r32
100	14408	112	0.9	66.7	1.9	0.008	0.064	0.667	19.398	55238	12.6	3.834	70	154.5	191.3	23.4	0.009	14398	14142	pg18beta1_o2nofp.cx10c_c8r32
100	14375	111	0.9	66.4	1.9	0.008	0.065	0.665	19.412	55145	12.6	3.836	70	154.5	190.1	23.4	0.011	14398	14078	pg18beta1_o2nofp.cx10d_c8r32
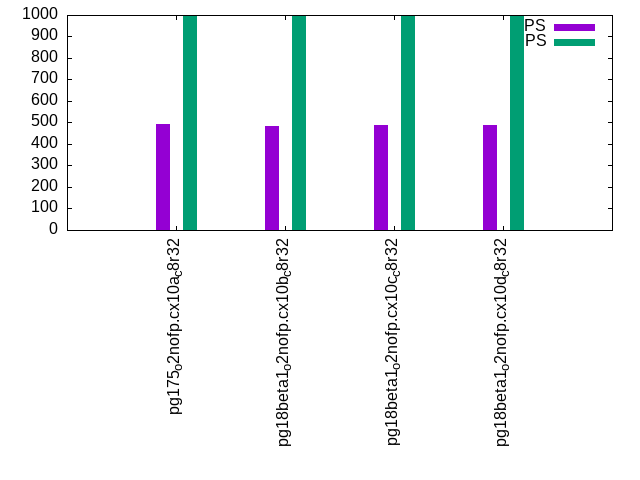
qp100.L2
qp100.L2: point queries with 100 insert/s per client. Graphs for performance per 1-second interval are here.
Average throughput:
Query response time histogram: each cell has the percentage of responses that take <= the time in the header and max is the max response time in seconds. For max values in the top 25% of the range have a red background and in the bottom 25% of the range have a green background. The red background is not used when the min value is within 80% of the max value.
| dbms | 256us | 1ms | 4ms | 16ms | 64ms | 256ms | 1s | 4s | 16s | gt | max |
|---|---|---|---|---|---|---|---|---|---|---|---|
| pg175_o2nofp.cx10a_c8r32 | 0.820 | 99.169 | 0.010 | 0.007 | |||||||
| pg18beta1_o2nofp.cx10b_c8r32 | 0.736 | 99.252 | 0.012 | 0.014 | |||||||
| pg18beta1_o2nofp.cx10c_c8r32 | 0.782 | 99.209 | 0.010 | 0.007 | |||||||
| pg18beta1_o2nofp.cx10d_c8r32 | 0.752 | 99.238 | 0.010 | 0.015 |
Insert response time histogram: each cell has the percentage of responses that take <= the time in the header and max is the max response time in seconds. For max values in the top 25% of the range have a red background and in the bottom 25% of the range have a green background. The red background is not used when the min value is within 80% of the max value.
| dbms | 256us | 1ms | 4ms | 16ms | 64ms | 256ms | 1s | 4s | 16s | gt | max |
|---|---|---|---|---|---|---|---|---|---|---|---|
| pg175_o2nofp.cx10a_c8r32 | 99.528 | 0.472 | 0.019 | ||||||||
| pg18beta1_o2nofp.cx10b_c8r32 | 99.278 | 0.722 | 0.025 | ||||||||
| pg18beta1_o2nofp.cx10c_c8r32 | 99.472 | 0.528 | 0.020 | ||||||||
| pg18beta1_o2nofp.cx10d_c8r32 | 99.361 | 0.639 | 0.024 |
Delete response time histogram: each cell has the percentage of responses that take <= the time in the header and max is the max response time in seconds. For max values in the top 25% of the range have a red background and in the bottom 25% of the range have a green background. The red background is not used when the min value is within 80% of the max value.
| dbms | 256us | 1ms | 4ms | 16ms | 64ms | 256ms | 1s | 4s | 16s | gt | max |
|---|---|---|---|---|---|---|---|---|---|---|---|
| pg175_o2nofp.cx10a_c8r32 | 99.972 | 0.028 | 0.009 | ||||||||
| pg18beta1_o2nofp.cx10b_c8r32 | 98.583 | 1.417 | 0.009 | ||||||||
| pg18beta1_o2nofp.cx10c_c8r32 | 99.944 | 0.056 | 0.009 | ||||||||
| pg18beta1_o2nofp.cx10d_c8r32 | 99.944 | 0.056 | 0.009 |
Performance metrics for the DBMS listed above. Some are normalized by throughput, others are not. Legend for results is here.
ips	qps	rps	rmbps	wps	wmbps	rpq	rkbpq	wpi	wkbpi	csps	cpups	cspq	cpupq	dbgb1	dbgb2	rss	maxop	p50	p99	tag
100	554	7196	56.6	349.0	4.1	12.998	104.655	3.490	41.801	16000	3.5	28.902	506	154.5	193.7	23.4	0.007	576	368	pg175_o2nofp.cx10a_c8r32
100	544	7113	55.9	345.9	4.1	13.087	105.406	3.463	41.606	15805	3.6	29.079	530	154.5	189.9	23.3	0.014	576	352	pg18beta1_o2nofp.cx10b_c8r32
100	549	7138	56.1	344.1	4.0	13.002	104.667	3.441	41.414	15871	3.6	28.908	525	154.5	191.3	23.4	0.007	576	368	pg18beta1_o2nofp.cx10c_c8r32
100	548	7132	56.1	345.1	4.1	13.012	104.772	3.454	41.534	15861	3.6	28.939	525	154.5	190.1	23.4	0.015	576	368	pg18beta1_o2nofp.cx10d_c8r32
qr500.L3
qr500.L3: range queries with 500 insert/s per client. Graphs for performance per 1-second interval are here.
Average throughput:
Query response time histogram: each cell has the percentage of responses that take <= the time in the header and max is the max response time in seconds. For max values in the top 25% of the range have a red background and in the bottom 25% of the range have a green background. The red background is not used when the min value is within 80% of the max value.
| dbms | 256us | 1ms | 4ms | 16ms | 64ms | 256ms | 1s | 4s | 16s | gt | max |
|---|---|---|---|---|---|---|---|---|---|---|---|
| pg175_o2nofp.cx10a_c8r32 | 99.982 | 0.018 | nonzero | nonzero | nonzero | 0.028 | |||||
| pg18beta1_o2nofp.cx10b_c8r32 | 99.984 | 0.016 | nonzero | nonzero | nonzero | 0.018 | |||||
| pg18beta1_o2nofp.cx10c_c8r32 | 99.982 | 0.017 | nonzero | nonzero | nonzero | 0.031 | |||||
| pg18beta1_o2nofp.cx10d_c8r32 | 99.983 | 0.017 | nonzero | nonzero | nonzero | 0.028 |
Insert response time histogram: each cell has the percentage of responses that take <= the time in the header and max is the max response time in seconds. For max values in the top 25% of the range have a red background and in the bottom 25% of the range have a green background. The red background is not used when the min value is within 80% of the max value.
| dbms | 256us | 1ms | 4ms | 16ms | 64ms | 256ms | 1s | 4s | 16s | gt | max |
|---|---|---|---|---|---|---|---|---|---|---|---|
| pg175_o2nofp.cx10a_c8r32 | 93.156 | 6.844 | 0.025 | ||||||||
| pg18beta1_o2nofp.cx10b_c8r32 | 93.417 | 6.583 | 0.030 | ||||||||
| pg18beta1_o2nofp.cx10c_c8r32 | 93.733 | 6.267 | 0.030 | ||||||||
| pg18beta1_o2nofp.cx10d_c8r32 | 93.633 | 6.367 | 0.029 |
Delete response time histogram: each cell has the percentage of responses that take <= the time in the header and max is the max response time in seconds. For max values in the top 25% of the range have a red background and in the bottom 25% of the range have a green background. The red background is not used when the min value is within 80% of the max value.
| dbms | 256us | 1ms | 4ms | 16ms | 64ms | 256ms | 1s | 4s | 16s | gt | max |
|---|---|---|---|---|---|---|---|---|---|---|---|
| pg175_o2nofp.cx10a_c8r32 | 36.561 | 63.439 | 0.015 | ||||||||
| pg18beta1_o2nofp.cx10b_c8r32 | 36.100 | 63.894 | 0.006 | 0.016 | |||||||
| pg18beta1_o2nofp.cx10c_c8r32 | 36.222 | 63.778 | 0.016 | ||||||||
| pg18beta1_o2nofp.cx10d_c8r32 | 30.744 | 69.256 | 0.016 |
Performance metrics for the DBMS listed above. Some are normalized by throughput, others are not. Legend for results is here.
ips	qps	rps	rmbps	wps	wmbps	rpq	rkbpq	wpi	wkbpi	csps	cpups	cspq	cpupq	dbgb1	dbgb2	rss	maxop	p50	p99	tag
500	13638	870	6.9	338.0	9.2	0.064	0.521	0.676	18.909	53925	13.8	3.954	81	154.6	191.3	23.4	0.028	13662	13086	pg175_o2nofp.cx10a_c8r32
500	13730	868	6.9	351.2	9.4	0.063	0.516	0.703	19.163	54275	13.7	3.953	80	154.6	190.0	23.3	0.018	13758	13230	pg18beta1_o2nofp.cx10b_c8r32
500	13255	869	6.9	353.6	9.4	0.066	0.536	0.708	19.238	52466	13.8	3.958	83	154.6	190.2	23.4	0.031	13262	12798	pg18beta1_o2nofp.cx10c_c8r32
500	13512	868	6.9	352.5	9.4	0.064	0.525	0.705	19.209	53452	13.8	3.956	82	154.6	190.0	23.4	0.028	13534	13022	pg18beta1_o2nofp.cx10d_c8r32
qp500.L4
qp500.L4: point queries with 500 insert/s per client. Graphs for performance per 1-second interval are here.
Average throughput:
Query response time histogram: each cell has the percentage of responses that take <= the time in the header and max is the max response time in seconds. For max values in the top 25% of the range have a red background and in the bottom 25% of the range have a green background. The red background is not used when the min value is within 80% of the max value.
| dbms | 256us | 1ms | 4ms | 16ms | 64ms | 256ms | 1s | 4s | 16s | gt | max |
|---|---|---|---|---|---|---|---|---|---|---|---|
| pg175_o2nofp.cx10a_c8r32 | 0.427 | 99.564 | 0.009 | 0.007 | |||||||
| pg18beta1_o2nofp.cx10b_c8r32 | 0.386 | 99.605 | 0.009 | 0.009 | |||||||
| pg18beta1_o2nofp.cx10c_c8r32 | 0.411 | 99.579 | 0.010 | 0.008 | |||||||
| pg18beta1_o2nofp.cx10d_c8r32 | 0.408 | 99.583 | 0.009 | 0.010 |
Insert response time histogram: each cell has the percentage of responses that take <= the time in the header and max is the max response time in seconds. For max values in the top 25% of the range have a red background and in the bottom 25% of the range have a green background. The red background is not used when the min value is within 80% of the max value.
| dbms | 256us | 1ms | 4ms | 16ms | 64ms | 256ms | 1s | 4s | 16s | gt | max |
|---|---|---|---|---|---|---|---|---|---|---|---|
| pg175_o2nofp.cx10a_c8r32 | 99.767 | 0.233 | 0.021 | ||||||||
| pg18beta1_o2nofp.cx10b_c8r32 | 99.739 | 0.261 | 0.020 | ||||||||
| pg18beta1_o2nofp.cx10c_c8r32 | 99.722 | 0.278 | 0.022 | ||||||||
| pg18beta1_o2nofp.cx10d_c8r32 | 99.728 | 0.272 | 0.020 |
Delete response time histogram: each cell has the percentage of responses that take <= the time in the header and max is the max response time in seconds. For max values in the top 25% of the range have a red background and in the bottom 25% of the range have a green background. The red background is not used when the min value is within 80% of the max value.
| dbms | 256us | 1ms | 4ms | 16ms | 64ms | 256ms | 1s | 4s | 16s | gt | max |
|---|---|---|---|---|---|---|---|---|---|---|---|
| pg175_o2nofp.cx10a_c8r32 | 91.678 | 8.322 | 0.042 | ||||||||
| pg18beta1_o2nofp.cx10b_c8r32 | 91.083 | 8.917 | 0.044 | ||||||||
| pg18beta1_o2nofp.cx10c_c8r32 | 89.611 | 10.389 | 0.043 | ||||||||
| pg18beta1_o2nofp.cx10d_c8r32 | 91.361 | 8.639 | 0.044 |
Performance metrics for the DBMS listed above. Some are normalized by throughput, others are not. Legend for results is here.
ips	qps	rps	rmbps	wps	wmbps	rpq	rkbpq	wpi	wkbpi	csps	cpups	cspq	cpupq	dbgb1	dbgb2	rss	maxop	p50	p99	tag
500	533	7852	61.6	1557.4	18.3	14.737	118.428	3.117	37.497	17327	5.2	32.521	781	154.6	189.0	23.4	0.007	544	432	pg175_o2nofp.cx10a_c8r32
500	528	7824	61.4	1544.6	18.2	14.822	119.133	3.089	37.264	17254	5.3	32.684	803	154.6	188.3	23.3	0.009	544	416	pg18beta1_o2nofp.cx10b_c8r32
500	531	7831	61.5	1544.2	18.2	14.742	118.460	3.090	37.277	17283	5.3	32.536	798	154.6	188.5	23.4	0.008	544	432	pg18beta1_o2nofp.cx10c_c8r32
500	532	7846	61.6	1545.2	18.2	14.737	118.423	3.092	37.287	17314	5.3	32.521	796	154.6	188.3	23.4	0.010	544	432	pg18beta1_o2nofp.cx10d_c8r32
qr1000.L5
qr1000.L5: range queries with 1000 insert/s per client. Graphs for performance per 1-second interval are here.
Average throughput:
Query response time histogram: each cell has the percentage of responses that take <= the time in the header and max is the max response time in seconds. For max values in the top 25% of the range have a red background and in the bottom 25% of the range have a green background. The red background is not used when the min value is within 80% of the max value.
| dbms | 256us | 1ms | 4ms | 16ms | 64ms | 256ms | 1s | 4s | 16s | gt | max |
|---|---|---|---|---|---|---|---|---|---|---|---|
| pg175_o2nofp.cx10a_c8r32 | 99.953 | 0.044 | 0.003 | 0.001 | nonzero | nonzero | 0.085 | ||||
| pg18beta1_o2nofp.cx10b_c8r32 | 99.950 | 0.046 | 0.003 | 0.001 | nonzero | nonzero | 0.093 | ||||
| pg18beta1_o2nofp.cx10c_c8r32 | 99.949 | 0.047 | 0.003 | 0.001 | nonzero | nonzero | 0.095 | ||||
| pg18beta1_o2nofp.cx10d_c8r32 | 99.949 | 0.047 | 0.003 | 0.001 | nonzero | nonzero | 0.099 |
Insert response time histogram: each cell has the percentage of responses that take <= the time in the header and max is the max response time in seconds. For max values in the top 25% of the range have a red background and in the bottom 25% of the range have a green background. The red background is not used when the min value is within 80% of the max value.
| dbms | 256us | 1ms | 4ms | 16ms | 64ms | 256ms | 1s | 4s | 16s | gt | max |
|---|---|---|---|---|---|---|---|---|---|---|---|
| pg175_o2nofp.cx10a_c8r32 | 96.836 | 3.164 | 0.023 | ||||||||
| pg18beta1_o2nofp.cx10b_c8r32 | 97.181 | 2.819 | 0.027 | ||||||||
| pg18beta1_o2nofp.cx10c_c8r32 | 97.033 | 2.967 | 0.027 | ||||||||
| pg18beta1_o2nofp.cx10d_c8r32 | 96.750 | 3.250 | 0.022 |
Delete response time histogram: each cell has the percentage of responses that take <= the time in the header and max is the max response time in seconds. For max values in the top 25% of the range have a red background and in the bottom 25% of the range have a green background. The red background is not used when the min value is within 80% of the max value.
| dbms | 256us | 1ms | 4ms | 16ms | 64ms | 256ms | 1s | 4s | 16s | gt | max |
|---|---|---|---|---|---|---|---|---|---|---|---|
| pg175_o2nofp.cx10a_c8r32 | 6.611 | 93.389 | 0.062 | ||||||||
| pg18beta1_o2nofp.cx10b_c8r32 | 1.133 | 98.864 | 0.003 | 0.066 | |||||||
| pg18beta1_o2nofp.cx10c_c8r32 | 5.194 | 94.803 | 0.003 | 0.065 | |||||||
| pg18beta1_o2nofp.cx10d_c8r32 | 8.083 | 91.914 | 0.003 | 0.066 |
Performance metrics for the DBMS listed above. Some are normalized by throughput, others are not. Legend for results is here.
ips	qps	rps	rmbps	wps	wmbps	rpq	rkbpq	wpi	wkbpi	csps	cpups	cspq	cpupq	dbgb1	dbgb2	rss	maxop	p50	p99	tag
999	11970	1488	11.9	944.4	19.1	0.124	1.022	0.945	19.599	48975	19.3	4.092	129	154.8	188.1	23.4	0.085	11982	11199	pg175_o2nofp.cx10a_c8r32
999	11830	1488	12.0	950.2	19.2	0.126	1.035	0.951	19.675	48444	19.6	4.095	133	154.8	187.5	23.3	0.093	11838	11086	pg18beta1_o2nofp.cx10b_c8r32
999	11753	1490	12.0	950.5	19.2	0.127	1.042	0.952	19.717	48177	19.4	4.099	132	154.8	187.6	23.4	0.095	11758	10990	pg18beta1_o2nofp.cx10c_c8r32
999	11647	1489	12.0	949.4	19.2	0.128	1.051	0.950	19.692	47764	19.3	4.101	133	154.8	187.5	23.4	0.099	11647	10830	pg18beta1_o2nofp.cx10d_c8r32
qp1000.L6
qp1000.L6: point queries with 1000 insert/s per client. Graphs for performance per 1-second interval are here.
Average throughput:
Query response time histogram: each cell has the percentage of responses that take <= the time in the header and max is the max response time in seconds. For max values in the top 25% of the range have a red background and in the bottom 25% of the range have a green background. The red background is not used when the min value is within 80% of the max value.
| dbms | 256us | 1ms | 4ms | 16ms | 64ms | 256ms | 1s | 4s | 16s | gt | max |
|---|---|---|---|---|---|---|---|---|---|---|---|
| pg175_o2nofp.cx10a_c8r32 | 0.186 | 98.941 | 0.871 | 0.003 | 0.041 | ||||||
| pg18beta1_o2nofp.cx10b_c8r32 | 0.149 | 98.997 | 0.852 | 0.002 | 0.039 | ||||||
| pg18beta1_o2nofp.cx10c_c8r32 | 0.168 | 98.907 | 0.923 | 0.002 | 0.043 | ||||||
| pg18beta1_o2nofp.cx10d_c8r32 | 0.165 | 98.908 | 0.924 | 0.003 | 0.040 |
Insert response time histogram: each cell has the percentage of responses that take <= the time in the header and max is the max response time in seconds. For max values in the top 25% of the range have a red background and in the bottom 25% of the range have a green background. The red background is not used when the min value is within 80% of the max value.
| dbms | 256us | 1ms | 4ms | 16ms | 64ms | 256ms | 1s | 4s | 16s | gt | max |
|---|---|---|---|---|---|---|---|---|---|---|---|
| pg175_o2nofp.cx10a_c8r32 | 98.508 | 1.492 | 0.051 | ||||||||
| pg18beta1_o2nofp.cx10b_c8r32 | 98.536 | 1.464 | 0.057 | ||||||||
| pg18beta1_o2nofp.cx10c_c8r32 | 98.353 | 1.647 | 0.045 | ||||||||
| pg18beta1_o2nofp.cx10d_c8r32 | 98.328 | 1.672 | 0.052 |
Delete response time histogram: each cell has the percentage of responses that take <= the time in the header and max is the max response time in seconds. For max values in the top 25% of the range have a red background and in the bottom 25% of the range have a green background. The red background is not used when the min value is within 80% of the max value.
| dbms | 256us | 1ms | 4ms | 16ms | 64ms | 256ms | 1s | 4s | 16s | gt | max |
|---|---|---|---|---|---|---|---|---|---|---|---|
| pg175_o2nofp.cx10a_c8r32 | 99.997 | 0.003 | 0.099 | ||||||||
| pg18beta1_o2nofp.cx10b_c8r32 | 99.997 | 0.003 | 0.108 | ||||||||
| pg18beta1_o2nofp.cx10c_c8r32 | 99.997 | 0.003 | 0.103 | ||||||||
| pg18beta1_o2nofp.cx10d_c8r32 | 99.997 | 0.003 | 0.105 |
Performance metrics for the DBMS listed above. Some are normalized by throughput, others are not. Legend for results is here.
ips	qps	rps	rmbps	wps	wmbps	rpq	rkbpq	wpi	wkbpi	csps	cpups	cspq	cpupq	dbgb1	dbgb2	rss	maxop	p50	p99	tag
999	492	8519	66.8	2721.4	33.7	17.319	139.132	2.723	34.544	18706	13.7	38.027	2228	155.0	191.2	23.4	0.041	512	368	pg175_o2nofp.cx10a_c8r32
999	486	8477	66.5	2717.7	33.9	17.445	140.169	2.719	34.698	18590	14.0	38.260	2305	155.0	190.9	23.3	0.039	496	368	pg18beta1_o2nofp.cx10b_c8r32
999	488	8474	66.5	2720.4	33.7	17.351	139.385	2.722	34.549	18600	13.8	38.083	2260	155.0	190.7	23.4	0.043	496	368	pg18beta1_o2nofp.cx10c_c8r32
999	489	8478	66.5	2720.7	33.8	17.344	139.343	2.722	34.646	18615	13.9	38.083	2275	155.0	190.7	23.4	0.040	496	368	pg18beta1_o2nofp.cx10d_c8r32
l.i0
l.i0: load without secondary indexes
Performance metrics for all DBMS, not just the ones listed above. Some are normalized by throughput, others are not. Legend for results is here.
ips	qps	rps	rmbps	wps	wmbps	rpq	rkbpq	wpi	wkbpi	csps	cpups	cspq	cpupq	dbgb1	dbgb2	rss	maxop	p50	p99	tag
143292	0	25	0.2	536.9	59.1	0.000	0.001	0.004	0.422	14293	20.4	0.100	11	76.5	116.6	18.9	0.054	144180	140280	pg175_o2nofp.cx10a_c8r32
142096	0	24	0.2	530.5	58.5	0.000	0.001	0.004	0.421	14382	20.5	0.101	12	76.5	116.6	18.8	0.048	142981	124583	pg18beta1_o2nofp.cx10b_c8r32
143781	0	26	0.2	539.4	59.3	0.000	0.001	0.004	0.422	14449	20.5	0.100	11	76.5	116.6	18.9	0.046	144684	140280	pg18beta1_o2nofp.cx10c_c8r32
143369	0	25	0.2	539.7	59.4	0.000	0.001	0.004	0.424	14383	20.4	0.100	11	76.5	116.6	18.3	0.046	144380	139878	pg18beta1_o2nofp.cx10d_c8r32
l.x
l.x: create secondary indexes
Performance metrics for all DBMS, not just the ones listed above. Some are normalized by throughput, others are not. Legend for results is here.
ips	qps	rps	rmbps	wps	wmbps	rpq	rkbpq	wpi	wkbpi	csps	cpups	cspq	cpupq	dbgb1	dbgb2	rss	maxop	p50	p99	tag
311891	0	845	105.0	989.8	116.4	0.003	0.345	0.003	0.382	423	13.0	0.001	3	153.6	193.7	23.4	0.004	NA	NA	pg175_o2nofp.cx10a_c8r32
314589	0	852	105.9	997.5	117.2	0.003	0.345	0.003	0.381	426	13.0	0.001	3	153.6	193.7	23.4	0.005	NA	NA	pg18beta1_o2nofp.cx10b_c8r32
318218	0	862	107.1	994.0	118.5	0.003	0.345	0.003	0.381	1258	13.5	0.004	3	153.6	193.7	23.4	0.005	NA	NA	pg18beta1_o2nofp.cx10c_c8r32
317334	0	860	106.8	1006.2	118.2	0.003	0.345	0.003	0.381	1010	13.4	0.003	3	153.6	193.7	23.4	0.005	NA	NA	pg18beta1_o2nofp.cx10d_c8r32
l.i1
l.i1: continue load after secondary indexes created with 50 inserts per transaction
Performance metrics for all DBMS, not just the ones listed above. Some are normalized by throughput, others are not. Legend for results is here.
ips	qps	rps	rmbps	wps	wmbps	rpq	rkbpq	wpi	wkbpi	csps	cpups	cspq	cpupq	dbgb1	dbgb2	rss	maxop	p50	p99	tag
3101	0	4484	35.5	3687.9	63.0	1.446	11.724	1.189	20.803	10040	14.8	3.238	382	154.3	194.3	22.7	0.051	2499	1800	pg175_o2nofp.cx10a_c8r32
3113	0	4482	35.5	3723.1	63.7	1.440	11.677	1.196	20.949	10086	15.0	3.240	386	154.3	194.3	22.8	0.058	2699	1750	pg18beta1_o2nofp.cx10b_c8r32
3056	0	4395	34.8	3638.7	62.2	1.438	11.659	1.191	20.837	9891	14.9	3.237	390	154.3	194.3	22.8	0.052	2750	1550	pg18beta1_o2nofp.cx10c_c8r32
3122	0	4488	35.5	3706.7	63.2	1.437	11.652	1.187	20.719	10135	14.9	3.246	382	154.3	194.3	23.1	0.053	2750	1800	pg18beta1_o2nofp.cx10d_c8r32
l.i2
l.i2: continue load after secondary indexes created with 5 inserts per transaction
Performance metrics for all DBMS, not just the ones listed above. Some are normalized by throughput, others are not. Legend for results is here.
ips	qps	rps	rmbps	wps	wmbps	rpq	rkbpq	wpi	wkbpi	csps	cpups	cspq	cpupq	dbgb1	dbgb2	rss	maxop	p50	p99	tag
161	0	173	1.4	477.5	6.6	1.072	8.770	2.958	42.056	1109	12.7	6.872	6295	154.4	194.5	23.4	0.024	160	125	pg175_o2nofp.cx10a_c8r32
154	0	165	1.3	448.5	6.3	1.074	8.789	2.918	41.840	1058	12.7	6.882	6610	154.5	191.5	23.3	0.029	155	120	pg18beta1_o2nofp.cx10b_c8r32
150	0	161	1.3	440.9	6.2	1.072	8.762	2.930	42.203	1047	12.7	6.954	6751	154.5	191.5	23.4	0.020	150	135	pg18beta1_o2nofp.cx10c_c8r32
152	0	163	1.3	443.6	6.2	1.072	8.767	2.924	41.936	1047	12.7	6.902	6697	154.5	191.6	23.4	0.020	150	120	pg18beta1_o2nofp.cx10d_c8r32
qr100.L1
qr100.L1: range queries with 100 insert/s per client
Performance metrics for all DBMS, not just the ones listed above. Some are normalized by throughput, others are not. Legend for results is here.
ips	qps	rps	rmbps	wps	wmbps	rpq	rkbpq	wpi	wkbpi	csps	cpups	cspq	cpupq	dbgb1	dbgb2	rss	maxop	p50	p99	tag
100	14537	112	0.9	61.8	1.9	0.008	0.065	0.618	18.992	55729	12.5	3.833	69	154.5	193.7	23.4	0.010	14510	14254	pg175_o2nofp.cx10a_c8r32
100	14471	112	0.9	65.1	1.9	0.008	0.064	0.652	19.293	55511	12.6	3.836	70	154.5	189.9	23.3	0.010	14493	14190	pg18beta1_o2nofp.cx10b_c8r32
100	14408	112	0.9	66.7	1.9	0.008	0.064	0.667	19.398	55238	12.6	3.834	70	154.5	191.3	23.4	0.009	14398	14142	pg18beta1_o2nofp.cx10c_c8r32
100	14375	111	0.9	66.4	1.9	0.008	0.065	0.665	19.412	55145	12.6	3.836	70	154.5	190.1	23.4	0.011	14398	14078	pg18beta1_o2nofp.cx10d_c8r32
qp100.L2
qp100.L2: point queries with 100 insert/s per client
Performance metrics for all DBMS, not just the ones listed above. Some are normalized by throughput, others are not. Legend for results is here.
ips	qps	rps	rmbps	wps	wmbps	rpq	rkbpq	wpi	wkbpi	csps	cpups	cspq	cpupq	dbgb1	dbgb2	rss	maxop	p50	p99	tag
100	554	7196	56.6	349.0	4.1	12.998	104.655	3.490	41.801	16000	3.5	28.902	506	154.5	193.7	23.4	0.007	576	368	pg175_o2nofp.cx10a_c8r32
100	544	7113	55.9	345.9	4.1	13.087	105.406	3.463	41.606	15805	3.6	29.079	530	154.5	189.9	23.3	0.014	576	352	pg18beta1_o2nofp.cx10b_c8r32
100	549	7138	56.1	344.1	4.0	13.002	104.667	3.441	41.414	15871	3.6	28.908	525	154.5	191.3	23.4	0.007	576	368	pg18beta1_o2nofp.cx10c_c8r32
100	548	7132	56.1	345.1	4.1	13.012	104.772	3.454	41.534	15861	3.6	28.939	525	154.5	190.1	23.4	0.015	576	368	pg18beta1_o2nofp.cx10d_c8r32
qr500.L3
qr500.L3: range queries with 500 insert/s per client
Performance metrics for all DBMS, not just the ones listed above. Some are normalized by throughput, others are not. Legend for results is here.
ips	qps	rps	rmbps	wps	wmbps	rpq	rkbpq	wpi	wkbpi	csps	cpups	cspq	cpupq	dbgb1	dbgb2	rss	maxop	p50	p99	tag
500	13638	870	6.9	338.0	9.2	0.064	0.521	0.676	18.909	53925	13.8	3.954	81	154.6	191.3	23.4	0.028	13662	13086	pg175_o2nofp.cx10a_c8r32
500	13730	868	6.9	351.2	9.4	0.063	0.516	0.703	19.163	54275	13.7	3.953	80	154.6	190.0	23.3	0.018	13758	13230	pg18beta1_o2nofp.cx10b_c8r32
500	13255	869	6.9	353.6	9.4	0.066	0.536	0.708	19.238	52466	13.8	3.958	83	154.6	190.2	23.4	0.031	13262	12798	pg18beta1_o2nofp.cx10c_c8r32
500	13512	868	6.9	352.5	9.4	0.064	0.525	0.705	19.209	53452	13.8	3.956	82	154.6	190.0	23.4	0.028	13534	13022	pg18beta1_o2nofp.cx10d_c8r32
qp500.L4
qp500.L4: point queries with 500 insert/s per client
Performance metrics for all DBMS, not just the ones listed above. Some are normalized by throughput, others are not. Legend for results is here.
ips	qps	rps	rmbps	wps	wmbps	rpq	rkbpq	wpi	wkbpi	csps	cpups	cspq	cpupq	dbgb1	dbgb2	rss	maxop	p50	p99	tag
500	533	7852	61.6	1557.4	18.3	14.737	118.428	3.117	37.497	17327	5.2	32.521	781	154.6	189.0	23.4	0.007	544	432	pg175_o2nofp.cx10a_c8r32
500	528	7824	61.4	1544.6	18.2	14.822	119.133	3.089	37.264	17254	5.3	32.684	803	154.6	188.3	23.3	0.009	544	416	pg18beta1_o2nofp.cx10b_c8r32
500	531	7831	61.5	1544.2	18.2	14.742	118.460	3.090	37.277	17283	5.3	32.536	798	154.6	188.5	23.4	0.008	544	432	pg18beta1_o2nofp.cx10c_c8r32
500	532	7846	61.6	1545.2	18.2	14.737	118.423	3.092	37.287	17314	5.3	32.521	796	154.6	188.3	23.4	0.010	544	432	pg18beta1_o2nofp.cx10d_c8r32
qr1000.L5
qr1000.L5: range queries with 1000 insert/s per client
Performance metrics for all DBMS, not just the ones listed above. Some are normalized by throughput, others are not. Legend for results is here.
ips	qps	rps	rmbps	wps	wmbps	rpq	rkbpq	wpi	wkbpi	csps	cpups	cspq	cpupq	dbgb1	dbgb2	rss	maxop	p50	p99	tag
999	11970	1488	11.9	944.4	19.1	0.124	1.022	0.945	19.599	48975	19.3	4.092	129	154.8	188.1	23.4	0.085	11982	11199	pg175_o2nofp.cx10a_c8r32
999	11830	1488	12.0	950.2	19.2	0.126	1.035	0.951	19.675	48444	19.6	4.095	133	154.8	187.5	23.3	0.093	11838	11086	pg18beta1_o2nofp.cx10b_c8r32
999	11753	1490	12.0	950.5	19.2	0.127	1.042	0.952	19.717	48177	19.4	4.099	132	154.8	187.6	23.4	0.095	11758	10990	pg18beta1_o2nofp.cx10c_c8r32
999	11647	1489	12.0	949.4	19.2	0.128	1.051	0.950	19.692	47764	19.3	4.101	133	154.8	187.5	23.4	0.099	11647	10830	pg18beta1_o2nofp.cx10d_c8r32
qp1000.L6
qp1000.L6: point queries with 1000 insert/s per client
Performance metrics for all DBMS, not just the ones listed above. Some are normalized by throughput, others are not. Legend for results is here.
ips	qps	rps	rmbps	wps	wmbps	rpq	rkbpq	wpi	wkbpi	csps	cpups	cspq	cpupq	dbgb1	dbgb2	rss	maxop	p50	p99	tag
999	492	8519	66.8	2721.4	33.7	17.319	139.132	2.723	34.544	18706	13.7	38.027	2228	155.0	191.2	23.4	0.041	512	368	pg175_o2nofp.cx10a_c8r32
999	486	8477	66.5	2717.7	33.9	17.445	140.169	2.719	34.698	18590	14.0	38.260	2305	155.0	190.9	23.3	0.039	496	368	pg18beta1_o2nofp.cx10b_c8r32
999	488	8474	66.5	2720.4	33.7	17.351	139.385	2.722	34.549	18600	13.8	38.083	2260	155.0	190.7	23.4	0.043	496	368	pg18beta1_o2nofp.cx10c_c8r32
999	489	8478	66.5	2720.7	33.8	17.344	139.343	2.722	34.646	18615	13.9	38.083	2275	155.0	190.7	23.4	0.040	496	368	pg18beta1_o2nofp.cx10d_c8r32
l.i0
- l.i0: load without secondary indexes
- Legend for results is here.
- Each entry lists the percentage of responses that fit in that bucket (slower than max time for previous bucket, faster than min time for next bucket).
Insert response time histogram
256us	1ms	4ms	16ms	64ms	256ms	1s	4s	16s	gt	max	tag
0.000	99.970	0.024	0.004	0.002	0.000	0.000	0.000	0.000	0.000	0.054	pg175_o2nofp.cx10a_c8r32
0.000	99.872	0.118	0.010	0.001	0.000	0.000	0.000	0.000	0.000	0.048	pg18beta1_o2nofp.cx10b_c8r32
0.000	99.968	0.026	0.005	0.001	0.000	0.000	0.000	0.000	0.000	0.046	pg18beta1_o2nofp.cx10c_c8r32
0.000	99.967	0.026	0.006	0.001	0.000	0.000	0.000	0.000	0.000	0.046	pg18beta1_o2nofp.cx10d_c8r32
l.x
- l.x: create secondary indexes
- Legend for results is here.
- Each entry lists the percentage of responses that fit in that bucket (slower than max time for previous bucket, faster than min time for next bucket).
TODO - determine whether there is data for create index response time
l.i1
- l.i1: continue load after secondary indexes created with 50 inserts per transaction
- Legend for results is here.
- Each entry lists the percentage of responses that fit in that bucket (slower than max time for previous bucket, faster than min time for next bucket).
Insert response time histogram
256us	1ms	4ms	16ms	64ms	256ms	1s	4s	16s	gt	max	tag
0.000	0.000	0.000	98.621	1.379	0.000	0.000	0.000	0.000	0.000	0.051	pg175_o2nofp.cx10a_c8r32
0.000	0.000	0.000	98.572	1.427	0.000	0.000	0.000	0.000	0.000	0.058	pg18beta1_o2nofp.cx10b_c8r32
0.000	0.000	0.000	98.595	1.405	0.000	0.000	0.000	0.000	0.000	0.052	pg18beta1_o2nofp.cx10c_c8r32
0.000	0.000	0.000	98.454	1.546	0.000	0.000	0.000	0.000	0.000	0.053	pg18beta1_o2nofp.cx10d_c8r32
Delete response time histogram
256us	1ms	4ms	16ms	64ms	256ms	1s	4s	16s	gt	max	tag
0.000	0.517	15.865	41.474	42.144	0.000	0.000	0.000	0.000	0.000	0.033	pg175_o2nofp.cx10a_c8r32
0.000	0.434	15.422	41.789	42.355	0.000	0.000	0.000	0.000	0.000	0.038	pg18beta1_o2nofp.cx10b_c8r32
0.000	0.407	15.585	41.459	42.549	0.000	0.000	0.000	0.000	0.000	0.037	pg18beta1_o2nofp.cx10c_c8r32
0.000	0.771	15.543	40.509	43.178	0.000	0.000	0.000	0.000	0.000	0.031	pg18beta1_o2nofp.cx10d_c8r32
l.i2
- l.i2: continue load after secondary indexes created with 5 inserts per transaction
- Legend for results is here.
- Each entry lists the percentage of responses that fit in that bucket (slower than max time for previous bucket, faster than min time for next bucket).
Insert response time histogram
256us	1ms	4ms	16ms	64ms	256ms	1s	4s	16s	gt	max	tag
0.000	10.543	89.402	0.052	0.003	0.000	0.000	0.000	0.000	0.000	0.024	pg175_o2nofp.cx10a_c8r32
0.000	10.913	89.043	0.040	0.003	0.000	0.000	0.000	0.000	0.000	0.029	pg18beta1_o2nofp.cx10b_c8r32
0.000	10.680	89.263	0.053	0.003	0.000	0.000	0.000	0.000	0.000	0.020	pg18beta1_o2nofp.cx10c_c8r32
0.000	10.260	89.691	0.046	0.003	0.000	0.000	0.000	0.000	0.000	0.020	pg18beta1_o2nofp.cx10d_c8r32
Delete response time histogram
256us	1ms	4ms	16ms	64ms	256ms	1s	4s	16s	gt	max	tag
0.000	0.000	0.000	0.000	99.999	0.001	0.000	0.000	0.000	0.000	0.098	pg175_o2nofp.cx10a_c8r32
0.000	0.000	0.000	0.000	99.999	0.001	0.000	0.000	0.000	0.000	0.108	pg18beta1_o2nofp.cx10b_c8r32
0.000	0.000	0.000	0.000	99.999	0.001	0.000	0.000	0.000	0.000	0.104	pg18beta1_o2nofp.cx10c_c8r32
0.000	0.000	0.000	0.000	99.999	0.001	0.000	0.000	0.000	0.000	0.105	pg18beta1_o2nofp.cx10d_c8r32
qr100.L1
- qr100.L1: range queries with 100 insert/s per client
- Legend for results is here.
- Each entry lists the percentage of responses that fit in that bucket (slower than max time for previous bucket, faster than min time for next bucket).
Query response time histogram
256us	1ms	4ms	16ms	64ms	256ms	1s	4s	16s	gt	max	tag
99.997	0.003	nonzero	nonzero	0.000	0.000	0.000	0.000	0.000	0.000	0.010	pg175_o2nofp.cx10a_c8r32
99.996	0.004	nonzero	nonzero	0.000	0.000	0.000	0.000	0.000	0.000	0.010	pg18beta1_o2nofp.cx10b_c8r32
99.996	0.003	nonzero	nonzero	0.000	0.000	0.000	0.000	0.000	0.000	0.009	pg18beta1_o2nofp.cx10c_c8r32
99.996	0.003	nonzero	nonzero	0.000	0.000	0.000	0.000	0.000	0.000	0.011	pg18beta1_o2nofp.cx10d_c8r32
Insert response time histogram
256us	1ms	4ms	16ms	64ms	256ms	1s	4s	16s	gt	max	tag
0.000	0.000	0.000	59.694	40.306	0.000	0.000	0.000	0.000	0.000	0.026	pg175_o2nofp.cx10a_c8r32
0.000	0.000	0.000	60.139	39.861	0.000	0.000	0.000	0.000	0.000	0.026	pg18beta1_o2nofp.cx10b_c8r32
0.000	0.000	0.000	59.861	40.139	0.000	0.000	0.000	0.000	0.000	0.027	pg18beta1_o2nofp.cx10c_c8r32
0.000	0.000	0.000	60.306	39.694	0.000	0.000	0.000	0.000	0.000	0.025	pg18beta1_o2nofp.cx10d_c8r32
Delete response time histogram
256us	1ms	4ms	16ms	64ms	256ms	1s	4s	16s	gt	max	tag
0.000	39.444	60.500	0.056	0.000	0.000	0.000	0.000	0.000	0.000	0.010	pg175_o2nofp.cx10a_c8r32
0.000	42.528	57.417	0.056	0.000	0.000	0.000	0.000	0.000	0.000	0.010	pg18beta1_o2nofp.cx10b_c8r32
0.000	40.889	59.056	0.056	0.000	0.000	0.000	0.000	0.000	0.000	0.010	pg18beta1_o2nofp.cx10c_c8r32
0.000	42.056	57.889	0.056	0.000	0.000	0.000	0.000	0.000	0.000	0.010	pg18beta1_o2nofp.cx10d_c8r32
qp100.L2
- qp100.L2: point queries with 100 insert/s per client
- Legend for results is here.
- Each entry lists the percentage of responses that fit in that bucket (slower than max time for previous bucket, faster than min time for next bucket).
Query response time histogram
256us	1ms	4ms	16ms	64ms	256ms	1s	4s	16s	gt	max	tag
0.000	0.820	99.169	0.010	0.000	0.000	0.000	0.000	0.000	0.000	0.007	pg175_o2nofp.cx10a_c8r32
0.000	0.736	99.252	0.012	0.000	0.000	0.000	0.000	0.000	0.000	0.014	pg18beta1_o2nofp.cx10b_c8r32
0.000	0.782	99.209	0.010	0.000	0.000	0.000	0.000	0.000	0.000	0.007	pg18beta1_o2nofp.cx10c_c8r32
0.000	0.752	99.238	0.010	0.000	0.000	0.000	0.000	0.000	0.000	0.015	pg18beta1_o2nofp.cx10d_c8r32
Insert response time histogram
256us	1ms	4ms	16ms	64ms	256ms	1s	4s	16s	gt	max	tag
0.000	0.000	0.000	99.528	0.472	0.000	0.000	0.000	0.000	0.000	0.019	pg175_o2nofp.cx10a_c8r32
0.000	0.000	0.000	99.278	0.722	0.000	0.000	0.000	0.000	0.000	0.025	pg18beta1_o2nofp.cx10b_c8r32
0.000	0.000	0.000	99.472	0.528	0.000	0.000	0.000	0.000	0.000	0.020	pg18beta1_o2nofp.cx10c_c8r32
0.000	0.000	0.000	99.361	0.639	0.000	0.000	0.000	0.000	0.000	0.024	pg18beta1_o2nofp.cx10d_c8r32
Delete response time histogram
256us	1ms	4ms	16ms	64ms	256ms	1s	4s	16s	gt	max	tag
0.000	0.000	99.972	0.028	0.000	0.000	0.000	0.000	0.000	0.000	0.009	pg175_o2nofp.cx10a_c8r32
0.000	0.000	98.583	1.417	0.000	0.000	0.000	0.000	0.000	0.000	0.009	pg18beta1_o2nofp.cx10b_c8r32
0.000	0.000	99.944	0.056	0.000	0.000	0.000	0.000	0.000	0.000	0.009	pg18beta1_o2nofp.cx10c_c8r32
0.000	0.000	99.944	0.056	0.000	0.000	0.000	0.000	0.000	0.000	0.009	pg18beta1_o2nofp.cx10d_c8r32
qr500.L3
- qr500.L3: range queries with 500 insert/s per client
- Legend for results is here.
- Each entry lists the percentage of responses that fit in that bucket (slower than max time for previous bucket, faster than min time for next bucket).
Query response time histogram
256us	1ms	4ms	16ms	64ms	256ms	1s	4s	16s	gt	max	tag
99.982	0.018	nonzero	nonzero	nonzero	0.000	0.000	0.000	0.000	0.000	0.028	pg175_o2nofp.cx10a_c8r32
99.984	0.016	nonzero	nonzero	nonzero	0.000	0.000	0.000	0.000	0.000	0.018	pg18beta1_o2nofp.cx10b_c8r32
99.982	0.017	nonzero	nonzero	nonzero	0.000	0.000	0.000	0.000	0.000	0.031	pg18beta1_o2nofp.cx10c_c8r32
99.983	0.017	nonzero	nonzero	nonzero	0.000	0.000	0.000	0.000	0.000	0.028	pg18beta1_o2nofp.cx10d_c8r32
Insert response time histogram
256us	1ms	4ms	16ms	64ms	256ms	1s	4s	16s	gt	max	tag
0.000	0.000	0.000	93.156	6.844	0.000	0.000	0.000	0.000	0.000	0.025	pg175_o2nofp.cx10a_c8r32
0.000	0.000	0.000	93.417	6.583	0.000	0.000	0.000	0.000	0.000	0.030	pg18beta1_o2nofp.cx10b_c8r32
0.000	0.000	0.000	93.733	6.267	0.000	0.000	0.000	0.000	0.000	0.030	pg18beta1_o2nofp.cx10c_c8r32
0.000	0.000	0.000	93.633	6.367	0.000	0.000	0.000	0.000	0.000	0.029	pg18beta1_o2nofp.cx10d_c8r32
Delete response time histogram
256us	1ms	4ms	16ms	64ms	256ms	1s	4s	16s	gt	max	tag
0.000	0.000	36.561	63.439	0.000	0.000	0.000	0.000	0.000	0.000	0.015	pg175_o2nofp.cx10a_c8r32
0.000	0.000	36.100	63.894	0.006	0.000	0.000	0.000	0.000	0.000	0.016	pg18beta1_o2nofp.cx10b_c8r32
0.000	0.000	36.222	63.778	0.000	0.000	0.000	0.000	0.000	0.000	0.016	pg18beta1_o2nofp.cx10c_c8r32
0.000	0.000	30.744	69.256	0.000	0.000	0.000	0.000	0.000	0.000	0.016	pg18beta1_o2nofp.cx10d_c8r32
qp500.L4
- qp500.L4: point queries with 500 insert/s per client
- Legend for results is here.
- Each entry lists the percentage of responses that fit in that bucket (slower than max time for previous bucket, faster than min time for next bucket).
Query response time histogram
256us	1ms	4ms	16ms	64ms	256ms	1s	4s	16s	gt	max	tag
0.000	0.427	99.564	0.009	0.000	0.000	0.000	0.000	0.000	0.000	0.007	pg175_o2nofp.cx10a_c8r32
0.000	0.386	99.605	0.009	0.000	0.000	0.000	0.000	0.000	0.000	0.009	pg18beta1_o2nofp.cx10b_c8r32
0.000	0.411	99.579	0.010	0.000	0.000	0.000	0.000	0.000	0.000	0.008	pg18beta1_o2nofp.cx10c_c8r32
0.000	0.408	99.583	0.009	0.000	0.000	0.000	0.000	0.000	0.000	0.010	pg18beta1_o2nofp.cx10d_c8r32
Insert response time histogram
256us	1ms	4ms	16ms	64ms	256ms	1s	4s	16s	gt	max	tag
0.000	0.000	0.000	99.767	0.233	0.000	0.000	0.000	0.000	0.000	0.021	pg175_o2nofp.cx10a_c8r32
0.000	0.000	0.000	99.739	0.261	0.000	0.000	0.000	0.000	0.000	0.020	pg18beta1_o2nofp.cx10b_c8r32
0.000	0.000	0.000	99.722	0.278	0.000	0.000	0.000	0.000	0.000	0.022	pg18beta1_o2nofp.cx10c_c8r32
0.000	0.000	0.000	99.728	0.272	0.000	0.000	0.000	0.000	0.000	0.020	pg18beta1_o2nofp.cx10d_c8r32
Delete response time histogram
256us	1ms	4ms	16ms	64ms	256ms	1s	4s	16s	gt	max	tag
0.000	0.000	0.000	91.678	8.322	0.000	0.000	0.000	0.000	0.000	0.042	pg175_o2nofp.cx10a_c8r32
0.000	0.000	0.000	91.083	8.917	0.000	0.000	0.000	0.000	0.000	0.044	pg18beta1_o2nofp.cx10b_c8r32
0.000	0.000	0.000	89.611	10.389	0.000	0.000	0.000	0.000	0.000	0.043	pg18beta1_o2nofp.cx10c_c8r32
0.000	0.000	0.000	91.361	8.639	0.000	0.000	0.000	0.000	0.000	0.044	pg18beta1_o2nofp.cx10d_c8r32
qr1000.L5
- qr1000.L5: range queries with 1000 insert/s per client
- Legend for results is here.
- Each entry lists the percentage of responses that fit in that bucket (slower than max time for previous bucket, faster than min time for next bucket).
Query response time histogram
256us	1ms	4ms	16ms	64ms	256ms	1s	4s	16s	gt	max	tag
99.953	0.044	0.003	0.001	nonzero	nonzero	0.000	0.000	0.000	0.000	0.085	pg175_o2nofp.cx10a_c8r32
99.950	0.046	0.003	0.001	nonzero	nonzero	0.000	0.000	0.000	0.000	0.093	pg18beta1_o2nofp.cx10b_c8r32
99.949	0.047	0.003	0.001	nonzero	nonzero	0.000	0.000	0.000	0.000	0.095	pg18beta1_o2nofp.cx10c_c8r32
99.949	0.047	0.003	0.001	nonzero	nonzero	0.000	0.000	0.000	0.000	0.099	pg18beta1_o2nofp.cx10d_c8r32
Insert response time histogram
256us	1ms	4ms	16ms	64ms	256ms	1s	4s	16s	gt	max	tag
0.000	0.000	0.000	96.836	3.164	0.000	0.000	0.000	0.000	0.000	0.023	pg175_o2nofp.cx10a_c8r32
0.000	0.000	0.000	97.181	2.819	0.000	0.000	0.000	0.000	0.000	0.027	pg18beta1_o2nofp.cx10b_c8r32
0.000	0.000	0.000	97.033	2.967	0.000	0.000	0.000	0.000	0.000	0.027	pg18beta1_o2nofp.cx10c_c8r32
0.000	0.000	0.000	96.750	3.250	0.000	0.000	0.000	0.000	0.000	0.022	pg18beta1_o2nofp.cx10d_c8r32
Delete response time histogram
256us	1ms	4ms	16ms	64ms	256ms	1s	4s	16s	gt	max	tag
0.000	0.000	0.000	6.611	93.389	0.000	0.000	0.000	0.000	0.000	0.062	pg175_o2nofp.cx10a_c8r32
0.000	0.000	0.000	1.133	98.864	0.003	0.000	0.000	0.000	0.000	0.066	pg18beta1_o2nofp.cx10b_c8r32
0.000	0.000	0.000	5.194	94.803	0.003	0.000	0.000	0.000	0.000	0.065	pg18beta1_o2nofp.cx10c_c8r32
0.000	0.000	0.000	8.083	91.914	0.003	0.000	0.000	0.000	0.000	0.066	pg18beta1_o2nofp.cx10d_c8r32
qp1000.L6
- qp1000.L6: point queries with 1000 insert/s per client
- Legend for results is here.
- Each entry lists the percentage of responses that fit in that bucket (slower than max time for previous bucket, faster than min time for next bucket).
Query response time histogram
256us	1ms	4ms	16ms	64ms	256ms	1s	4s	16s	gt	max	tag
0.000	0.186	98.941	0.871	0.003	0.000	0.000	0.000	0.000	0.000	0.041	pg175_o2nofp.cx10a_c8r32
0.000	0.149	98.997	0.852	0.002	0.000	0.000	0.000	0.000	0.000	0.039	pg18beta1_o2nofp.cx10b_c8r32
0.000	0.168	98.907	0.923	0.002	0.000	0.000	0.000	0.000	0.000	0.043	pg18beta1_o2nofp.cx10c_c8r32
0.000	0.165	98.908	0.924	0.003	0.000	0.000	0.000	0.000	0.000	0.040	pg18beta1_o2nofp.cx10d_c8r32
Insert response time histogram
256us	1ms	4ms	16ms	64ms	256ms	1s	4s	16s	gt	max	tag
0.000	0.000	0.000	98.508	1.492	0.000	0.000	0.000	0.000	0.000	0.051	pg175_o2nofp.cx10a_c8r32
0.000	0.000	0.000	98.536	1.464	0.000	0.000	0.000	0.000	0.000	0.057	pg18beta1_o2nofp.cx10b_c8r32
0.000	0.000	0.000	98.353	1.647	0.000	0.000	0.000	0.000	0.000	0.045	pg18beta1_o2nofp.cx10c_c8r32
0.000	0.000	0.000	98.328	1.672	0.000	0.000	0.000	0.000	0.000	0.052	pg18beta1_o2nofp.cx10d_c8r32
Delete response time histogram
256us	1ms	4ms	16ms	64ms	256ms	1s	4s	16s	gt	max	tag
0.000	0.000	0.000	0.000	99.997	0.003	0.000	0.000	0.000	0.000	0.099	pg175_o2nofp.cx10a_c8r32
0.000	0.000	0.000	0.000	99.997	0.003	0.000	0.000	0.000	0.000	0.108	pg18beta1_o2nofp.cx10b_c8r32
0.000	0.000	0.000	0.000	99.997	0.003	0.000	0.000	0.000	0.000	0.103	pg18beta1_o2nofp.cx10c_c8r32
0.000	0.000	0.000	0.000	99.997	0.003	0.000	0.000	0.000	0.000	0.105	pg18beta1_o2nofp.cx10d_c8r32