Introduction
This is a report for the insert benchmark with 20M docs and 1 client(s). It is generated by scripts (bash, awk, sed) and Tufte might not be impressed. An overview of the insert benchmark is here and a short update is here. Below, by DBMS, I mean DBMS+version.config. An example is my8020.c10b40 where my means MySQL, 8020 is version 8.0.20 and c10b40 is the name for the configuration file.
The test server has 8 AMD cores, 32G RAM and an NVMe SSD. It is described here as the PN53. The benchmark was run with 1 client and there were 1 or 3 connections per client (1 for queries or inserts without rate limits, 1+1 for rate limited inserts+deletes). It uses 1 table. It loads 20M rows per table without secondary indexes, creates 3 secondary indexes per table, then inserts 40m+10m rows per table with a delete per insert to avoid growing the table. It then does 6 read+write tests for 1800s each that do queries as fast as possible with 100,100,500,500,1000,1000 inserts/s and the same for deletes/s per client concurrent with the queries. The database is cached by Postgres. Clients and the DBMS share one server. The per-database configs are in the per-database subdirectories here.
The tested DBMS are:
- pg140_o2nofp.cx10a_c8r32 - Postgres 14.0 with the cx10a_c8r32 config
- pg1418_o2nofp.cx10a_c8r32 - Postgres 14.18 with the cx10a_c8r32 config
- pg150_o2nofp.cx10a_c8r32 - Postgres 15.0 with the cx10a_c8r32 config
- pg1513_o2nofp.cx10a_c8r32 - Postgres 15.13 with the cx10a_c8r32 config
- pg160_o2nofp.cx10a_c8r32 - Postgres 16.0 with the cx10a_c8r32 config
- pg169_o2nofp.cx10a_c8r32 - Postgres 16.9 with the cx10a_c8r32 config
- pg170_o2nofp.cx10a_c8r32 - Postgres 17.0 with the cx10a_c8r32 config
- pg175_o2nofp.cx10a_c8r32 - Postgres 17.5 with the cx10a_c8r32 config
- pg18beta1_o2nofp.cx10b_c8r32 - Postgres 18 beta1 with the cx10b_c8r32 config that uses io_method=sync
Contents
- Summary
- l.i0: load without secondary indexes
- l.x: create secondary indexes
- l.i1: continue load after secondary indexes created with 50 inserts per transaction
- l.i2: continue load after secondary indexes created with 5 inserts per transaction
- qr100.L1: range queries with 100 insert/s per client
- qp100.L2: point queries with 100 insert/s per client
- qr500.L3: range queries with 500 insert/s per client
- qp500.L4: point queries with 500 insert/s per client
- qr1000.L5: range queries with 1000 insert/s per client
- qp1000.L6: point queries with 1000 insert/s per client
Summary
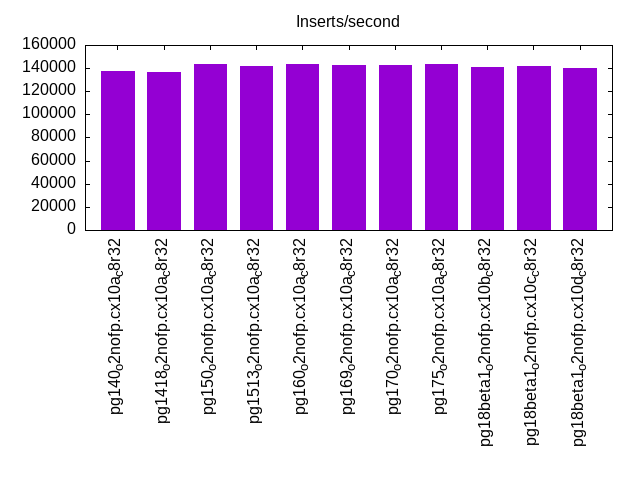
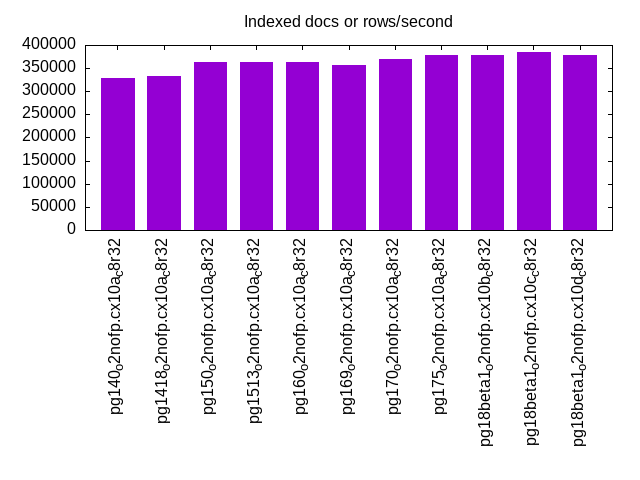
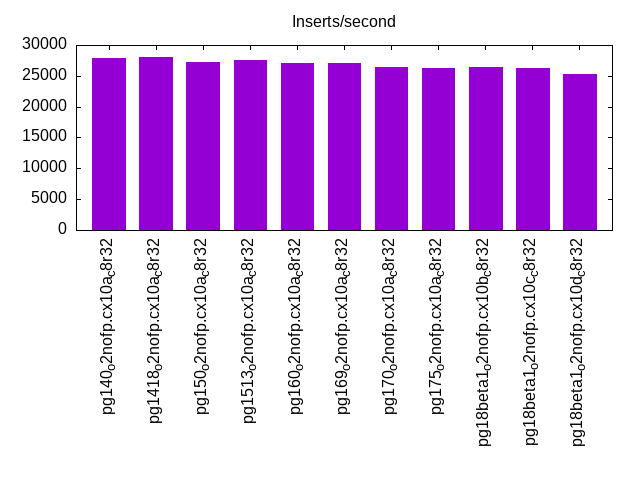
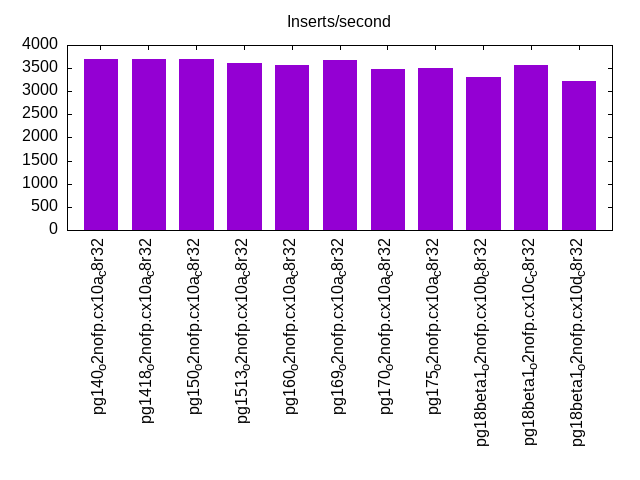
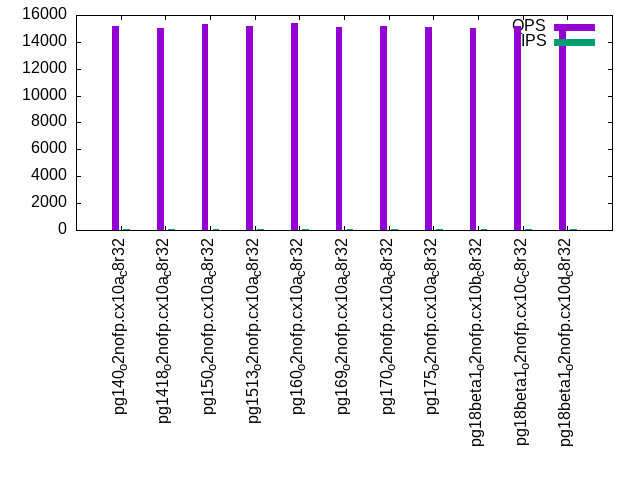
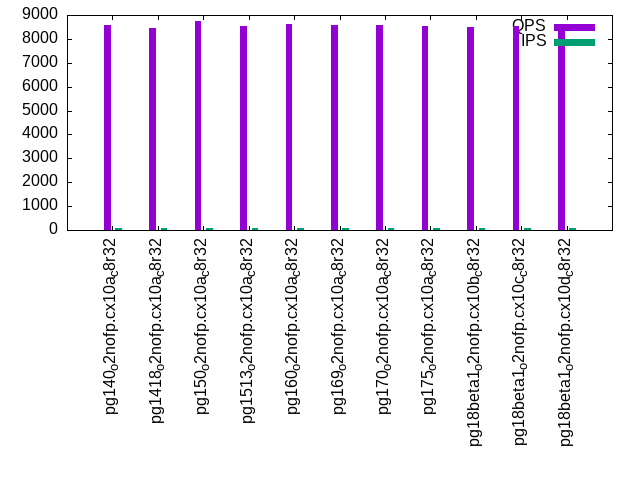
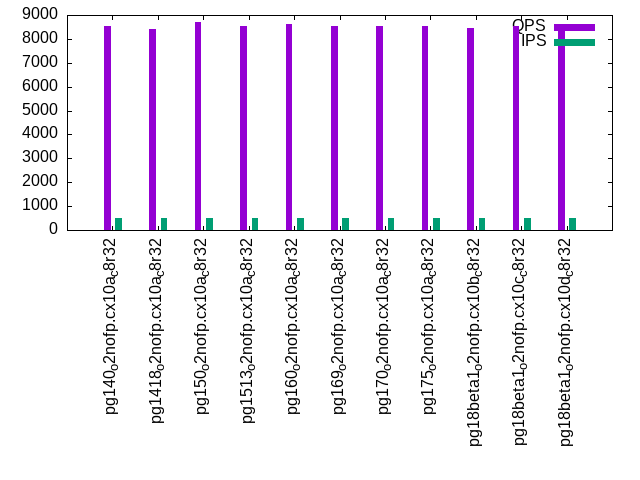
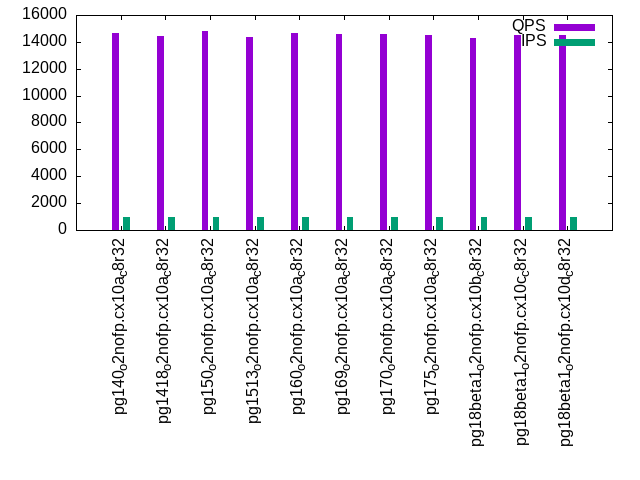
The numbers are inserts/s for l.i0, l.i1 and l.i2, indexed docs (or rows) /s for l.x and queries/s for qr100, qp100 thru qr1000, qp1000" The values are the average rate over the entire test for inserts (IPS) and queries (QPS). The range of values for IPS and QPS is split into 3 parts: bottom 25%, middle 50%, top 25%. Values in the bottom 25% have a red background, values in the top 25% have a green background and values in the middle have no color. A gray background is used for values that can be ignored because the DBMS did not sustain the target insert rate. Red backgrounds are not used when the minimum value is within 80% of the max value.
| dbms | l.i0 | l.x | l.i1 | l.i2 | qr100 | qp100 | qr500 | qp500 | qr1000 | qp1000 |
|---|---|---|---|---|---|---|---|---|---|---|
| pg140_o2nofp.cx10a_c8r32 | 137931 | 327870 | 27972 | 3693 | 15216 | 8571 | 14669 | 8548 | 14686 | 8514 |
| pg1418_o2nofp.cx10a_c8r32 | 136986 | 333335 | 28011 | 3708 | 15005 | 8464 | 14498 | 8403 | 14461 | 8393 |
| pg150_o2nofp.cx10a_c8r32 | 143885 | 363638 | 27174 | 3700 | 15334 | 8731 | 14739 | 8723 | 14810 | 8693 |
| pg1513_o2nofp.cx10a_c8r32 | 141844 | 363638 | 27491 | 3602 | 15167 | 8537 | 14451 | 8557 | 14353 | 8581 |
| pg160_o2nofp.cx10a_c8r32 | 143885 | 363638 | 27027 | 3571 | 15398 | 8640 | 14727 | 8606 | 14693 | 8625 |
| pg169_o2nofp.cx10a_c8r32 | 142857 | 357145 | 27027 | 3684 | 15140 | 8587 | 14616 | 8538 | 14599 | 8583 |
| pg170_o2nofp.cx10a_c8r32 | 142857 | 370372 | 26472 | 3487 | 15180 | 8564 | 14602 | 8529 | 14582 | 8575 |
| pg175_o2nofp.cx10a_c8r32 | 143885 | 377360 | 26230 | 3512 | 15099 | 8524 | 14502 | 8534 | 14506 | 8576 |
| pg18beta1_o2nofp.cx10b_c8r32 | 140845 | 377360 | 26420 | 3309 | 15000 | 8486 | 14315 | 8465 | 14313 | 8492 |
| pg18beta1_o2nofp.cx10c_c8r32 | 141844 | 384617 | 26333 | 3565 | 15159 | 8531 | 14610 | 8524 | 14499 | 8534 |
| pg18beta1_o2nofp.cx10d_c8r32 | 139860 | 377360 | 25284 | 3221 | 15091 | 8496 | 14524 | 8513 | 14478 | 8438 |
This table has relative throughput, throughput for the DBMS relative to the DBMS in the first line, using the absolute throughput from the previous table. Values less than 0.95 have a yellow background. Values greater than 1.05 have a blue background.
| dbms | l.i0 | l.x | l.i1 | l.i2 | qr100 | qp100 | qr500 | qp500 | qr1000 | qp1000 |
|---|---|---|---|---|---|---|---|---|---|---|
| pg140_o2nofp.cx10a_c8r32 | 1.00 | 1.00 | 1.00 | 1.00 | 1.00 | 1.00 | 1.00 | 1.00 | 1.00 | 1.00 |
| pg1418_o2nofp.cx10a_c8r32 | 0.99 | 1.02 | 1.00 | 1.00 | 0.99 | 0.99 | 0.99 | 0.98 | 0.98 | 0.99 |
| pg150_o2nofp.cx10a_c8r32 | 1.04 | 1.11 | 0.97 | 1.00 | 1.01 | 1.02 | 1.00 | 1.02 | 1.01 | 1.02 |
| pg1513_o2nofp.cx10a_c8r32 | 1.03 | 1.11 | 0.98 | 0.98 | 1.00 | 1.00 | 0.99 | 1.00 | 0.98 | 1.01 |
| pg160_o2nofp.cx10a_c8r32 | 1.04 | 1.11 | 0.97 | 0.97 | 1.01 | 1.01 | 1.00 | 1.01 | 1.00 | 1.01 |
| pg169_o2nofp.cx10a_c8r32 | 1.04 | 1.09 | 0.97 | 1.00 | 1.00 | 1.00 | 1.00 | 1.00 | 0.99 | 1.01 |
| pg170_o2nofp.cx10a_c8r32 | 1.04 | 1.13 | 0.95 | 0.94 | 1.00 | 1.00 | 1.00 | 1.00 | 0.99 | 1.01 |
| pg175_o2nofp.cx10a_c8r32 | 1.04 | 1.15 | 0.94 | 0.95 | 0.99 | 0.99 | 0.99 | 1.00 | 0.99 | 1.01 |
| pg18beta1_o2nofp.cx10b_c8r32 | 1.02 | 1.15 | 0.94 | 0.90 | 0.99 | 0.99 | 0.98 | 0.99 | 0.97 | 1.00 |
| pg18beta1_o2nofp.cx10c_c8r32 | 1.03 | 1.17 | 0.94 | 0.97 | 1.00 | 1.00 | 1.00 | 1.00 | 0.99 | 1.00 |
| pg18beta1_o2nofp.cx10d_c8r32 | 1.01 | 1.15 | 0.90 | 0.87 | 0.99 | 0.99 | 0.99 | 1.00 | 0.99 | 0.99 |
This lists the average rate of inserts/s for the tests that do inserts concurrent with queries. For such tests the query rate is listed in the table above. The read+write tests are setup so that the insert rate should match the target rate every second. Cells that are not at least 95% of the target have a red background to indicate a failure to satisfy the target.
| dbms | qr100.L1 | qp100.L2 | qr500.L3 | qp500.L4 | qr1000.L5 | qp1000.L6 |
|---|---|---|---|---|---|---|
| pg140_o2nofp.cx10a_c8r32 | 100 | 100 | 500 | 500 | 1000 | 1000 |
| pg1418_o2nofp.cx10a_c8r32 | 100 | 100 | 500 | 500 | 999 | 999 |
| pg150_o2nofp.cx10a_c8r32 | 100 | 100 | 500 | 500 | 1000 | 1000 |
| pg1513_o2nofp.cx10a_c8r32 | 100 | 100 | 500 | 500 | 1000 | 1000 |
| pg160_o2nofp.cx10a_c8r32 | 100 | 100 | 500 | 500 | 1000 | 1000 |
| pg169_o2nofp.cx10a_c8r32 | 100 | 100 | 500 | 500 | 999 | 999 |
| pg170_o2nofp.cx10a_c8r32 | 100 | 100 | 500 | 500 | 999 | 999 |
| pg175_o2nofp.cx10a_c8r32 | 100 | 100 | 500 | 500 | 1000 | 1000 |
| pg18beta1_o2nofp.cx10b_c8r32 | 100 | 100 | 500 | 500 | 1000 | 1000 |
| pg18beta1_o2nofp.cx10c_c8r32 | 100 | 100 | 500 | 500 | 1000 | 1000 |
| pg18beta1_o2nofp.cx10d_c8r32 | 100 | 100 | 500 | 500 | 1000 | 1000 |
| target | 100 | 100 | 500 | 500 | 1000 | 1000 |
l.i0
l.i0: load without secondary indexes. Graphs for performance per 1-second interval are here.
Average throughput:
Insert response time histogram: each cell has the percentage of responses that take <= the time in the header and max is the max response time in seconds. For the max column values in the top 25% of the range have a red background and in the bottom 25% of the range have a green background. The red background is not used when the min value is within 80% of the max value.
| dbms | 256us | 1ms | 4ms | 16ms | 64ms | 256ms | 1s | 4s | 16s | gt | max |
|---|---|---|---|---|---|---|---|---|---|---|---|
| pg140_o2nofp.cx10a_c8r32 | 99.983 | 0.016 | 0.001 | 0.006 | |||||||
| pg1418_o2nofp.cx10a_c8r32 | 99.981 | 0.018 | 0.001 | 0.006 | |||||||
| pg150_o2nofp.cx10a_c8r32 | 99.986 | 0.014 | 0.004 | ||||||||
| pg1513_o2nofp.cx10a_c8r32 | 99.987 | 0.013 | 0.002 | ||||||||
| pg160_o2nofp.cx10a_c8r32 | 99.987 | 0.013 | 0.002 | ||||||||
| pg169_o2nofp.cx10a_c8r32 | 99.987 | 0.013 | 0.002 | ||||||||
| pg170_o2nofp.cx10a_c8r32 | 99.988 | 0.012 | 0.002 | ||||||||
| pg175_o2nofp.cx10a_c8r32 | 99.992 | 0.007 | 0.002 | ||||||||
| pg18beta1_o2nofp.cx10b_c8r32 | 99.993 | 0.007 | 0.002 | ||||||||
| pg18beta1_o2nofp.cx10c_c8r32 | 99.991 | 0.009 | 0.002 | ||||||||
| pg18beta1_o2nofp.cx10d_c8r32 | 99.981 | 0.019 | 0.003 |
Performance metrics for the DBMS listed above. Some are normalized by throughput, others are not. Legend for results is here.
ips	qps	rps	rmbps	wps	wmbps	rpq	rkbpq	wpi	wkbpi	csps	cpups	cspq	cpupq	dbgb1	dbgb2	rss	maxop	p50	p99	tag
137931	0	0	0.0	512.9	58.0	0.000	0.000	0.004	0.431	16683	19.4	0.121	11	1.9	5.2	2.0	0.006	138575	131478	pg140_o2nofp.cx10a_c8r32
136986	0	0	0.0	512.1	57.9	0.000	0.000	0.004	0.433	16515	19.4	0.121	11	1.9	5.2	1.2	0.006	137482	131586	pg1418_o2nofp.cx10a_c8r32
143885	0	0	0.0	541.9	61.5	0.000	0.000	0.004	0.438	17227	19.8	0.120	11	1.9	5.2	1.7	0.004	144674	137586	pg150_o2nofp.cx10a_c8r32
141844	0	0	0.0	532.8	60.5	0.000	0.000	0.004	0.436	17084	19.8	0.120	11	1.9	5.2	1.2	0.002	143683	137486	pg1513_o2nofp.cx10a_c8r32
143885	0	0	0.0	542.1	61.5	0.000	0.000	0.004	0.438	17156	19.9	0.119	11	1.9	5.2	0.4	0.002	144884	137287	pg160_o2nofp.cx10a_c8r32
142857	0	0	0.0	541.8	61.5	0.000	0.000	0.004	0.441	17098	19.7	0.120	11	1.9	5.2	1.7	0.002	144783	137985	pg169_o2nofp.cx10a_c8r32
142857	0	0	0.0	532.2	60.4	0.000	0.000	0.004	0.433	14635	19.8	0.102	11	1.9	5.2	1.7	0.002	143781	136986	pg170_o2nofp.cx10a_c8r32
143885	0	0	0.0	538.9	61.1	0.000	0.000	0.004	0.435	14748	20.0	0.103	11	1.9	5.2	1.7	0.002	144680	137678	pg175_o2nofp.cx10a_c8r32
140845	0	0	0.0	528.8	60.0	0.000	0.000	0.004	0.436	14502	19.8	0.103	11	1.9	5.2	1.6	0.002	142080	135378	pg18beta1_o2nofp.cx10b_c8r32
141844	0	0	0.0	532.0	60.3	0.000	0.000	0.004	0.436	14552	20.0	0.103	11	1.9	5.2	1.7	0.002	142781	135988	pg18beta1_o2nofp.cx10c_c8r32
139860	0	0	0.0	527.5	59.8	0.000	0.000	0.004	0.438	14392	19.7	0.103	11	1.9	5.2	1.6	0.003	142081	133485	pg18beta1_o2nofp.cx10d_c8r32
l.x
l.x: create secondary indexes.
Average throughput:
Performance metrics for the DBMS listed above. Some are normalized by throughput, others are not. Legend for results is here.
ips	qps	rps	rmbps	wps	wmbps	rpq	rkbpq	wpi	wkbpi	csps	cpups	cspq	cpupq	dbgb1	dbgb2	rss	maxop	p50	p99	tag
327870	0	0	0.0	663.4	81.1	0.000	0.000	0.002	0.253	1968	11.5	0.006	3	3.9	8.9	2.1	0.002	NA	NA	pg140_o2nofp.cx10a_c8r32
333335	0	0	0.0	675.3	82.5	0.000	0.000	0.002	0.254	2072	11.5	0.006	3	3.9	8.9	2.1	0.002	NA	NA	pg1418_o2nofp.cx10a_c8r32
363638	0	0	0.0	719.7	88.3	0.000	0.000	0.002	0.249	2173	11.4	0.006	3	3.9	8.9	2.1	0.002	NA	NA	pg150_o2nofp.cx10a_c8r32
363638	0	0	0.0	611.8	75.2	0.000	0.000	0.002	0.212	1673	11.5	0.005	3	3.8	8.9	2.1	0.002	NA	NA	pg1513_o2nofp.cx10a_c8r32
363638	0	0	0.0	846.6	104.1	0.000	0.000	0.002	0.293	2240	11.3	0.006	2	3.9	8.9	2.1	0.002	NA	NA	pg160_o2nofp.cx10a_c8r32
357145	0	0	0.0	726.4	89.1	0.000	0.000	0.002	0.255	2204	11.3	0.006	3	3.9	8.9	2.1	0.002	NA	NA	pg169_o2nofp.cx10a_c8r32
370372	0	0	0.0	557.1	68.2	0.000	0.000	0.002	0.189	1745	11.2	0.005	2	3.9	8.9	2.1	0.002	NA	NA	pg170_o2nofp.cx10a_c8r32
377360	0	0	0.0	580.2	71.0	0.000	0.000	0.002	0.193	1841	11.5	0.005	2	3.9	8.9	2.1	0.002	NA	NA	pg175_o2nofp.cx10a_c8r32
377360	0	0	0.0	607.8	74.3	0.000	0.000	0.002	0.202	1916	11.5	0.005	2	3.9	8.9	2.1	0.002	NA	NA	pg18beta1_o2nofp.cx10b_c8r32
384617	0	0	0.0	606.1	74.2	0.000	0.000	0.002	0.197	1947	11.5	0.005	2	3.9	8.9	2.1	0.002	NA	NA	pg18beta1_o2nofp.cx10c_c8r32
377360	0	0	0.0	603.1	73.8	0.000	0.000	0.002	0.200	1958	11.4	0.005	2	3.9	8.9	2.1	0.002	NA	NA	pg18beta1_o2nofp.cx10d_c8r32
l.i1
l.i1: continue load after secondary indexes created with 50 inserts per transaction. Graphs for performance per 1-second interval are here.
Average throughput:
Insert response time histogram: each cell has the percentage of responses that take <= the time in the header and max is the max response time in seconds. For the max column values in the top 25% of the range have a red background and in the bottom 25% of the range have a green background. The red background is not used when the min value is within 80% of the max value.
| dbms | 256us | 1ms | 4ms | 16ms | 64ms | 256ms | 1s | 4s | 16s | gt | max |
|---|---|---|---|---|---|---|---|---|---|---|---|
| pg140_o2nofp.cx10a_c8r32 | 66.457 | 33.532 | 0.002 | 0.009 | 0.050 | ||||||
| pg1418_o2nofp.cx10a_c8r32 | 63.743 | 36.246 | 0.003 | 0.008 | 0.059 | ||||||
| pg150_o2nofp.cx10a_c8r32 | 58.452 | 41.544 | 0.003 | nonzero | 0.024 | ||||||
| pg1513_o2nofp.cx10a_c8r32 | 57.586 | 42.412 | 0.001 | nonzero | 0.029 | ||||||
| pg160_o2nofp.cx10a_c8r32 | 56.427 | 43.569 | 0.003 | nonzero | 0.027 | ||||||
| pg169_o2nofp.cx10a_c8r32 | 55.342 | 44.653 | 0.004 | 0.001 | 0.024 | ||||||
| pg170_o2nofp.cx10a_c8r32 | 62.170 | 37.828 | 0.001 | 0.001 | 0.052 | ||||||
| pg175_o2nofp.cx10a_c8r32 | 61.381 | 38.616 | 0.002 | 0.001 | 0.037 | ||||||
| pg18beta1_o2nofp.cx10b_c8r32 | 62.640 | 37.357 | 0.002 | 0.001 | 0.033 | ||||||
| pg18beta1_o2nofp.cx10c_c8r32 | 62.628 | 37.368 | 0.003 | 0.001 | 0.031 | ||||||
| pg18beta1_o2nofp.cx10d_c8r32 | 66.225 | 33.766 | 0.005 | 0.005 | 0.031 |
Delete response time histogram: each cell has the percentage of responses that take <= the time in the header and max is the max response time in seconds. For the max column values in the top 25% of the range have a red background and in the bottom 25% of the range have a green background. The red background is not used when the min value is within 80% of the max value.
| dbms | 256us | 1ms | 4ms | 16ms | 64ms | 256ms | 1s | 4s | 16s | gt | max |
|---|---|---|---|---|---|---|---|---|---|---|---|
| pg140_o2nofp.cx10a_c8r32 | 29.334 | 70.640 | 0.021 | 0.005 | 0.049 | ||||||
| pg1418_o2nofp.cx10a_c8r32 | 29.985 | 69.994 | 0.013 | 0.007 | 0.059 | ||||||
| pg150_o2nofp.cx10a_c8r32 | 29.553 | 70.430 | 0.016 | 0.001 | 0.023 | ||||||
| pg1513_o2nofp.cx10a_c8r32 | 29.776 | 70.131 | 0.093 | 0.001 | 0.040 | ||||||
| pg160_o2nofp.cx10a_c8r32 | 29.436 | 70.515 | 0.049 | nonzero | 0.026 | ||||||
| pg169_o2nofp.cx10a_c8r32 | 29.145 | 70.839 | 0.016 | 0.001 | 0.023 | ||||||
| pg170_o2nofp.cx10a_c8r32 | 27.639 | 72.136 | 0.225 | 0.001 | 0.051 | ||||||
| pg175_o2nofp.cx10a_c8r32 | 26.239 | 73.651 | 0.109 | 0.001 | 0.037 | ||||||
| pg18beta1_o2nofp.cx10b_c8r32 | 28.797 | 69.317 | 1.885 | 0.001 | 0.039 | ||||||
| pg18beta1_o2nofp.cx10c_c8r32 | 27.986 | 71.999 | 0.015 | 0.001 | 0.030 | ||||||
| pg18beta1_o2nofp.cx10d_c8r32 | 28.538 | 58.133 | 13.325 | 0.003 | 0.030 |
Performance metrics for the DBMS listed above. Some are normalized by throughput, others are not. Legend for results is here.
ips	qps	rps	rmbps	wps	wmbps	rpq	rkbpq	wpi	wkbpi	csps	cpups	cspq	cpupq	dbgb1	dbgb2	rss	maxop	p50	p99	tag
27972	0	0	0.0	309.5	33.3	0.000	0.000	0.011	1.220	13599	22.3	0.486	64	5.4	32.0	2.5	0.050	22147	15848	pg140_o2nofp.cx10a_c8r32
28011	0	0	0.0	312.0	33.6	0.000	0.000	0.011	1.229	13694	22.5	0.489	64	5.4	32.1	2.5	0.059	22297	15298	pg1418_o2nofp.cx10a_c8r32
27174	0	0	0.0	299.3	32.4	0.000	0.000	0.011	1.219	13787	22.1	0.507	65	5.4	32.0	4.3	0.024	21347	14998	pg150_o2nofp.cx10a_c8r32
27491	0	0	0.0	304.7	33.0	0.000	0.000	0.011	1.228	14001	22.2	0.509	65	5.4	32.1	3.6	0.029	21647	15148	pg1513_o2nofp.cx10a_c8r32
27027	0	0	0.0	297.0	32.1	0.000	0.000	0.011	1.217	13741	22.0	0.508	65	5.4	32.0	4.6	0.027	21247	14198	pg160_o2nofp.cx10a_c8r32
27027	0	0	0.0	297.6	32.2	0.000	0.000	0.011	1.219	13724	22.1	0.508	65	5.4	32.1	4.8	0.024	20947	14698	pg169_o2nofp.cx10a_c8r32
26472	0	0	0.0	295.6	32.5	0.000	0.000	0.011	1.259	11104	21.9	0.419	66	5.4	32.1	1.3	0.052	20298	13148	pg170_o2nofp.cx10a_c8r32
26230	0	0	0.0	292.2	32.2	0.000	0.000	0.011	1.257	11005	21.9	0.420	67	5.3	32.1	2.4	0.037	20547	13448	pg175_o2nofp.cx10a_c8r32
26420	0	0	0.0	297.1	32.8	0.000	0.000	0.011	1.273	11108	21.9	0.420	66	5.3	32.0	1.5	0.033	20347	10599	pg18beta1_o2nofp.cx10b_c8r32
26333	0	0	0.0	295.7	32.7	0.000	0.000	0.011	1.272	11174	21.9	0.424	67	5.4	32.0	1.5	0.031	20198	14098	pg18beta1_o2nofp.cx10c_c8r32
25284	0	0	0.0	284.7	31.6	0.000	0.000	0.011	1.279	10680	21.7	0.422	69	5.4	32.1	4.5	0.031	18598	9849	pg18beta1_o2nofp.cx10d_c8r32
l.i2
l.i2: continue load after secondary indexes created with 5 inserts per transaction. Graphs for performance per 1-second interval are here.
Average throughput:
Insert response time histogram: each cell has the percentage of responses that take <= the time in the header and max is the max response time in seconds. For the max column values in the top 25% of the range have a red background and in the bottom 25% of the range have a green background. The red background is not used when the min value is within 80% of the max value.
| dbms | 256us | 1ms | 4ms | 16ms | 64ms | 256ms | 1s | 4s | 16s | gt | max |
|---|---|---|---|---|---|---|---|---|---|---|---|
| pg140_o2nofp.cx10a_c8r32 | 73.028 | 26.972 | nonzero | nonzero | nonzero | 0.038 | |||||
| pg1418_o2nofp.cx10a_c8r32 | 73.926 | 26.074 | nonzero | nonzero | nonzero | 0.033 | |||||
| pg150_o2nofp.cx10a_c8r32 | 73.747 | 26.253 | nonzero | nonzero | nonzero | 0.028 | |||||
| pg1513_o2nofp.cx10a_c8r32 | 69.934 | 30.066 | nonzero | nonzero | nonzero | 0.028 | |||||
| pg160_o2nofp.cx10a_c8r32 | 69.276 | 30.724 | nonzero | nonzero | nonzero | 0.025 | |||||
| pg169_o2nofp.cx10a_c8r32 | 73.382 | 26.617 | nonzero | nonzero | nonzero | 0.051 | |||||
| pg170_o2nofp.cx10a_c8r32 | 67.938 | 32.061 | nonzero | nonzero | 0.011 | ||||||
| pg175_o2nofp.cx10a_c8r32 | 69.393 | 30.607 | nonzero | nonzero | nonzero | 0.036 | |||||
| pg18beta1_o2nofp.cx10b_c8r32 | 63.897 | 36.103 | nonzero | nonzero | nonzero | 0.021 | |||||
| pg18beta1_o2nofp.cx10c_c8r32 | 70.842 | 29.158 | nonzero | nonzero | nonzero | 0.017 | |||||
| pg18beta1_o2nofp.cx10d_c8r32 | 68.943 | 31.056 | nonzero | nonzero | 0.006 |
Delete response time histogram: each cell has the percentage of responses that take <= the time in the header and max is the max response time in seconds. For the max column values in the top 25% of the range have a red background and in the bottom 25% of the range have a green background. The red background is not used when the min value is within 80% of the max value.
| dbms | 256us | 1ms | 4ms | 16ms | 64ms | 256ms | 1s | 4s | 16s | gt | max |
|---|---|---|---|---|---|---|---|---|---|---|---|
| pg140_o2nofp.cx10a_c8r32 | 1.428 | 38.264 | 60.306 | 0.002 | nonzero | 0.039 | |||||
| pg1418_o2nofp.cx10a_c8r32 | 1.655 | 34.062 | 64.282 | 0.002 | nonzero | 0.033 | |||||
| pg150_o2nofp.cx10a_c8r32 | 1.567 | 31.687 | 66.744 | 0.002 | nonzero | 0.028 | |||||
| pg1513_o2nofp.cx10a_c8r32 | 1.382 | 40.610 | 58.006 | 0.002 | nonzero | 0.029 | |||||
| pg160_o2nofp.cx10a_c8r32 | 1.469 | 33.722 | 64.807 | 0.002 | nonzero | 0.025 | |||||
| pg169_o2nofp.cx10a_c8r32 | 1.302 | 27.643 | 71.053 | 0.002 | nonzero | 0.051 | |||||
| pg170_o2nofp.cx10a_c8r32 | 1.455 | 38.878 | 59.667 | nonzero | 0.009 | ||||||
| pg175_o2nofp.cx10a_c8r32 | 1.436 | 38.093 | 60.470 | nonzero | nonzero | 0.036 | |||||
| pg18beta1_o2nofp.cx10b_c8r32 | 1.300 | 38.653 | 59.253 | 0.794 | 0.006 | ||||||
| pg18beta1_o2nofp.cx10c_c8r32 | 1.506 | 39.275 | 59.219 | nonzero | nonzero | 0.017 | |||||
| pg18beta1_o2nofp.cx10d_c8r32 | 1.020 | 40.682 | 56.109 | 2.189 | 0.010 |
Performance metrics for the DBMS listed above. Some are normalized by throughput, others are not. Legend for results is here.
ips	qps	rps	rmbps	wps	wmbps	rpq	rkbpq	wpi	wkbpi	csps	cpups	cspq	cpupq	dbgb1	dbgb2	rss	maxop	p50	p99	tag
3693	0	0	0.0	65.2	6.3	0.000	0.000	0.018	1.753	17198	15.9	4.657	344	5.4	35.2	0.1	0.038	2755	1905	pg140_o2nofp.cx10a_c8r32
3708	0	0	0.0	65.2	6.3	0.000	0.000	0.018	1.748	17234	15.9	4.648	343	5.4	35.3	0.1	0.033	2830	1745	pg1418_o2nofp.cx10a_c8r32
3700	0	0	0.0	63.0	6.3	0.000	0.000	0.017	1.747	17175	15.9	4.642	344	5.4	35.2	0.3	0.028	2865	1905	pg150_o2nofp.cx10a_c8r32
3602	0	0	0.0	61.6	6.1	0.000	0.000	0.017	1.748	16731	15.8	4.645	351	5.4	35.3	0.1	0.028	2600	1840	pg1513_o2nofp.cx10a_c8r32
3571	0	0	0.0	61.5	6.1	0.000	0.000	0.017	1.755	16554	15.9	4.635	356	5.4	35.1	0.2	0.025	2705	1820	pg160_o2nofp.cx10a_c8r32
3684	0	0	0.0	63.4	6.3	0.000	0.000	0.017	1.762	17148	15.9	4.654	345	5.5	35.3	3.1	0.051	2950	1955	pg169_o2nofp.cx10a_c8r32
3487	0	0	0.0	59.2	6.0	0.000	0.000	0.017	1.757	13605	15.7	3.902	360	5.4	35.1	0.3	0.011	2525	1750	pg170_o2nofp.cx10a_c8r32
3512	0	0	0.0	59.7	6.0	0.000	0.000	0.017	1.758	13692	15.7	3.898	358	5.4	35.2	0.3	0.036	2595	1720	pg175_o2nofp.cx10a_c8r32
3309	0	0	0.0	56.1	5.6	0.000	0.000	0.017	1.743	12952	15.7	3.914	380	5.4	34.8	0.3	0.021	2320	1175	pg18beta1_o2nofp.cx10b_c8r32
3565	0	0	0.0	60.3	6.1	0.000	0.000	0.017	1.759	13897	15.7	3.898	352	5.4	35.1	1.5	0.017	2590	1865	pg18beta1_o2nofp.cx10c_c8r32
3221	0	0	0.0	56.0	5.5	0.000	0.000	0.017	1.760	12590	15.4	3.909	383	5.4	34.7	5.2	0.006	2205	1165	pg18beta1_o2nofp.cx10d_c8r32
qr100.L1
qr100.L1: range queries with 100 insert/s per client. Graphs for performance per 1-second interval are here.
Average throughput:
Query response time histogram: each cell has the percentage of responses that take <= the time in the header and max is the max response time in seconds. For max values in the top 25% of the range have a red background and in the bottom 25% of the range have a green background. The red background is not used when the min value is within 80% of the max value.
| dbms | 256us | 1ms | 4ms | 16ms | 64ms | 256ms | 1s | 4s | 16s | gt | max |
|---|---|---|---|---|---|---|---|---|---|---|---|
| pg140_o2nofp.cx10a_c8r32 | 100.000 | nonzero | nonzero | 0.010 | |||||||
| pg1418_o2nofp.cx10a_c8r32 | 100.000 | nonzero | nonzero | nonzero | 0.010 | ||||||
| pg150_o2nofp.cx10a_c8r32 | 100.000 | nonzero | nonzero | 0.001 | |||||||
| pg1513_o2nofp.cx10a_c8r32 | 100.000 | nonzero | 0.001 | ||||||||
| pg160_o2nofp.cx10a_c8r32 | 100.000 | nonzero | nonzero | 0.001 | |||||||
| pg169_o2nofp.cx10a_c8r32 | 100.000 | nonzero | nonzero | 0.001 | |||||||
| pg170_o2nofp.cx10a_c8r32 | 100.000 | nonzero | 0.001 | ||||||||
| pg175_o2nofp.cx10a_c8r32 | 100.000 | nonzero | 0.001 | ||||||||
| pg18beta1_o2nofp.cx10b_c8r32 | 100.000 | nonzero | 0.001 | ||||||||
| pg18beta1_o2nofp.cx10c_c8r32 | 100.000 | nonzero | nonzero | 0.001 | |||||||
| pg18beta1_o2nofp.cx10d_c8r32 | 100.000 | nonzero | 0.001 |
Insert response time histogram: each cell has the percentage of responses that take <= the time in the header and max is the max response time in seconds. For max values in the top 25% of the range have a red background and in the bottom 25% of the range have a green background. The red background is not used when the min value is within 80% of the max value.
| dbms | 256us | 1ms | 4ms | 16ms | 64ms | 256ms | 1s | 4s | 16s | gt | max |
|---|---|---|---|---|---|---|---|---|---|---|---|
| pg140_o2nofp.cx10a_c8r32 | 1.556 | 98.389 | 0.056 | 0.006 | |||||||
| pg1418_o2nofp.cx10a_c8r32 | 1.944 | 98.000 | 0.056 | 0.006 | |||||||
| pg150_o2nofp.cx10a_c8r32 | 5.000 | 94.944 | 0.056 | 0.006 | |||||||
| pg1513_o2nofp.cx10a_c8r32 | 3.333 | 96.639 | 0.028 | 0.006 | |||||||
| pg160_o2nofp.cx10a_c8r32 | 3.583 | 96.361 | 0.056 | 0.006 | |||||||
| pg169_o2nofp.cx10a_c8r32 | 5.194 | 94.778 | 0.028 | 0.006 | |||||||
| pg170_o2nofp.cx10a_c8r32 | 3.778 | 96.194 | 0.028 | 0.006 | |||||||
| pg175_o2nofp.cx10a_c8r32 | 1.278 | 98.667 | 0.056 | 0.005 | |||||||
| pg18beta1_o2nofp.cx10b_c8r32 | 4.389 | 95.583 | 0.028 | 0.006 | |||||||
| pg18beta1_o2nofp.cx10c_c8r32 | 4.444 | 95.500 | 0.056 | 0.006 | |||||||
| pg18beta1_o2nofp.cx10d_c8r32 | 1.028 | 98.917 | 0.056 | 0.006 |
Delete response time histogram: each cell has the percentage of responses that take <= the time in the header and max is the max response time in seconds. For max values in the top 25% of the range have a red background and in the bottom 25% of the range have a green background. The red background is not used when the min value is within 80% of the max value.
| dbms | 256us | 1ms | 4ms | 16ms | 64ms | 256ms | 1s | 4s | 16s | gt | max |
|---|---|---|---|---|---|---|---|---|---|---|---|
| pg140_o2nofp.cx10a_c8r32 | 51.833 | 48.167 | 0.002 | ||||||||
| pg1418_o2nofp.cx10a_c8r32 | 55.722 | 44.278 | 0.002 | ||||||||
| pg150_o2nofp.cx10a_c8r32 | 58.222 | 41.778 | 0.002 | ||||||||
| pg1513_o2nofp.cx10a_c8r32 | 55.167 | 44.833 | 0.002 | ||||||||
| pg160_o2nofp.cx10a_c8r32 | 58.556 | 41.444 | 0.002 | ||||||||
| pg169_o2nofp.cx10a_c8r32 | 58.250 | 41.750 | 0.002 | ||||||||
| pg170_o2nofp.cx10a_c8r32 | 55.778 | 44.222 | 0.002 | ||||||||
| pg175_o2nofp.cx10a_c8r32 | 52.472 | 47.528 | 0.002 | ||||||||
| pg18beta1_o2nofp.cx10b_c8r32 | 55.139 | 44.861 | 0.002 | ||||||||
| pg18beta1_o2nofp.cx10c_c8r32 | 50.139 | 49.861 | 0.002 | ||||||||
| pg18beta1_o2nofp.cx10d_c8r32 | 48.000 | 52.000 | 0.002 |
Performance metrics for the DBMS listed above. Some are normalized by throughput, others are not. Legend for results is here.
ips	qps	rps	rmbps	wps	wmbps	rpq	rkbpq	wpi	wkbpi	csps	cpups	cspq	cpupq	dbgb1	dbgb2	rss	maxop	p50	p99	tag
100	15216	0	0.0	13.4	0.6	0.000	0.000	0.134	6.434	58133	12.4	3.821	65	5.4	35.2	0.1	0.010	15214	15022	pg140_o2nofp.cx10a_c8r32
100	15005	0	0.0	13.5	0.6	0.000	0.000	0.135	6.458	57323	12.4	3.820	66	5.4	35.3	0.1	0.010	14990	14766	pg1418_o2nofp.cx10a_c8r32
100	15334	0	0.0	11.3	0.6	0.000	0.000	0.114	6.249	58582	12.4	3.821	65	5.4	35.2	0.1	0.001	15310	15102	pg150_o2nofp.cx10a_c8r32
100	15167	0	0.0	11.3	0.6	0.000	0.000	0.113	6.242	57927	12.4	3.819	65	5.4	35.3	0.1	0.001	15165	14958	pg1513_o2nofp.cx10a_c8r32
100	15398	0	0.0	11.3	0.6	0.000	0.000	0.113	6.241	58829	12.4	3.821	64	5.4	35.1	0.1	0.001	15421	15214	pg160_o2nofp.cx10a_c8r32
100	15140	0	0.0	11.3	0.6	0.000	0.000	0.113	6.223	57817	12.4	3.819	66	5.5	35.3	0.1	0.001	15134	14926	pg169_o2nofp.cx10a_c8r32
100	15180	0	0.0	10.4	0.6	0.000	0.000	0.104	6.246	57951	12.4	3.818	65	5.4	35.1	0.1	0.001	15198	14942	pg170_o2nofp.cx10a_c8r32
100	15099	0	0.0	10.4	0.6	0.000	0.000	0.104	6.259	57689	12.4	3.821	66	5.4	35.2	0.1	0.001	15102	14878	pg175_o2nofp.cx10a_c8r32
100	15000	0	0.0	10.5	0.6	0.000	0.000	0.105	6.262	57298	12.4	3.820	66	5.4	34.8	0.1	0.001	15006	14734	pg18beta1_o2nofp.cx10b_c8r32
100	15159	0	0.0	10.5	0.6	0.000	0.000	0.105	6.266	57904	12.4	3.820	65	5.4	35.1	0.1	0.001	15166	14958	pg18beta1_o2nofp.cx10c_c8r32
100	15091	0	0.0	10.5	0.6	0.000	0.000	0.105	6.265	57652	12.4	3.820	66	5.4	34.7	0.1	0.001	15102	14814	pg18beta1_o2nofp.cx10d_c8r32
qp100.L2
qp100.L2: point queries with 100 insert/s per client. Graphs for performance per 1-second interval are here.
Average throughput:
Query response time histogram: each cell has the percentage of responses that take <= the time in the header and max is the max response time in seconds. For max values in the top 25% of the range have a red background and in the bottom 25% of the range have a green background. The red background is not used when the min value is within 80% of the max value.
| dbms | 256us | 1ms | 4ms | 16ms | 64ms | 256ms | 1s | 4s | 16s | gt | max |
|---|---|---|---|---|---|---|---|---|---|---|---|
| pg140_o2nofp.cx10a_c8r32 | 99.993 | 0.007 | nonzero | nonzero | 0.010 | ||||||
| pg1418_o2nofp.cx10a_c8r32 | 99.992 | 0.008 | nonzero | 0.010 | |||||||
| pg150_o2nofp.cx10a_c8r32 | 99.994 | 0.006 | nonzero | 0.001 | |||||||
| pg1513_o2nofp.cx10a_c8r32 | 99.996 | 0.004 | 0.001 | ||||||||
| pg160_o2nofp.cx10a_c8r32 | 99.997 | 0.003 | 0.001 | ||||||||
| pg169_o2nofp.cx10a_c8r32 | 99.995 | 0.005 | nonzero | 0.002 | |||||||
| pg170_o2nofp.cx10a_c8r32 | 99.993 | 0.007 | nonzero | 0.001 | |||||||
| pg175_o2nofp.cx10a_c8r32 | 99.994 | 0.006 | 0.001 | ||||||||
| pg18beta1_o2nofp.cx10b_c8r32 | 99.995 | 0.005 | 0.001 | ||||||||
| pg18beta1_o2nofp.cx10c_c8r32 | 99.996 | 0.004 | 0.001 | ||||||||
| pg18beta1_o2nofp.cx10d_c8r32 | 99.993 | 0.007 | nonzero | 0.001 |
Insert response time histogram: each cell has the percentage of responses that take <= the time in the header and max is the max response time in seconds. For max values in the top 25% of the range have a red background and in the bottom 25% of the range have a green background. The red background is not used when the min value is within 80% of the max value.
| dbms | 256us | 1ms | 4ms | 16ms | 64ms | 256ms | 1s | 4s | 16s | gt | max |
|---|---|---|---|---|---|---|---|---|---|---|---|
| pg140_o2nofp.cx10a_c8r32 | 99.944 | 0.056 | 0.006 | ||||||||
| pg1418_o2nofp.cx10a_c8r32 | 99.944 | 0.056 | 0.005 | ||||||||
| pg150_o2nofp.cx10a_c8r32 | 99.944 | 0.056 | 0.009 | ||||||||
| pg1513_o2nofp.cx10a_c8r32 | 99.944 | 0.056 | 0.005 | ||||||||
| pg160_o2nofp.cx10a_c8r32 | 99.944 | 0.056 | 0.005 | ||||||||
| pg169_o2nofp.cx10a_c8r32 | 99.861 | 0.139 | 0.010 | ||||||||
| pg170_o2nofp.cx10a_c8r32 | 0.028 | 99.917 | 0.056 | 0.005 | |||||||
| pg175_o2nofp.cx10a_c8r32 | 99.750 | 0.250 | 0.010 | ||||||||
| pg18beta1_o2nofp.cx10b_c8r32 | 99.944 | 0.056 | 0.005 | ||||||||
| pg18beta1_o2nofp.cx10c_c8r32 | 99.972 | 0.028 | 0.006 | ||||||||
| pg18beta1_o2nofp.cx10d_c8r32 | 99.944 | 0.056 | 0.005 |
Delete response time histogram: each cell has the percentage of responses that take <= the time in the header and max is the max response time in seconds. For max values in the top 25% of the range have a red background and in the bottom 25% of the range have a green background. The red background is not used when the min value is within 80% of the max value.
| dbms | 256us | 1ms | 4ms | 16ms | 64ms | 256ms | 1s | 4s | 16s | gt | max |
|---|---|---|---|---|---|---|---|---|---|---|---|
| pg140_o2nofp.cx10a_c8r32 | 20.583 | 79.389 | 0.028 | 0.004 | |||||||
| pg1418_o2nofp.cx10a_c8r32 | 4.861 | 95.111 | 0.028 | 0.004 | |||||||
| pg150_o2nofp.cx10a_c8r32 | 14.611 | 85.361 | 0.028 | 0.004 | |||||||
| pg1513_o2nofp.cx10a_c8r32 | 14.778 | 85.194 | 0.028 | 0.004 | |||||||
| pg160_o2nofp.cx10a_c8r32 | 23.806 | 76.167 | 0.028 | 0.004 | |||||||
| pg169_o2nofp.cx10a_c8r32 | 30.056 | 69.889 | 0.056 | 0.010 | |||||||
| pg170_o2nofp.cx10a_c8r32 | 25.000 | 75.000 | 0.004 | ||||||||
| pg175_o2nofp.cx10a_c8r32 | 14.944 | 85.028 | 0.028 | 0.005 | |||||||
| pg18beta1_o2nofp.cx10b_c8r32 | 12.611 | 87.361 | 0.028 | 0.005 | |||||||
| pg18beta1_o2nofp.cx10c_c8r32 | 4.083 | 95.889 | 0.028 | 0.004 | |||||||
| pg18beta1_o2nofp.cx10d_c8r32 | 19.056 | 80.917 | 0.028 | 0.004 |
Performance metrics for the DBMS listed above. Some are normalized by throughput, others are not. Legend for results is here.
ips	qps	rps	rmbps	wps	wmbps	rpq	rkbpq	wpi	wkbpi	csps	cpups	cspq	cpupq	dbgb1	dbgb2	rss	maxop	p50	p99	tag
100	8571	0	0.0	42.8	1.4	0.000	0.000	0.428	14.322	33173	12.4	3.870	116	5.4	35.2	0.2	0.010	8575	8495	pg140_o2nofp.cx10a_c8r32
100	8464	0	0.0	42.8	1.4	0.000	0.000	0.428	14.341	32766	12.4	3.871	117	5.4	35.3	0.1	0.010	8463	8399	pg1418_o2nofp.cx10a_c8r32
100	8731	0	0.0	40.7	1.4	0.000	0.000	0.407	14.143	33766	12.4	3.867	114	5.4	35.2	0.1	0.001	8735	8671	pg150_o2nofp.cx10a_c8r32
100	8537	0	0.0	40.7	1.4	0.000	0.000	0.407	14.115	32999	12.4	3.865	116	5.4	35.3	0.1	0.001	8527	8495	pg1513_o2nofp.cx10a_c8r32
100	8640	0	0.0	40.6	1.4	0.000	0.000	0.407	14.123	33414	12.4	3.868	115	5.4	35.1	0.1	0.001	8639	8575	pg160_o2nofp.cx10a_c8r32
100	8587	0	0.0	40.7	1.4	0.000	0.000	0.407	14.135	33204	12.4	3.867	116	5.5	35.3	0.1	0.002	8591	8527	pg169_o2nofp.cx10a_c8r32
100	8564	0	0.0	39.4	1.4	0.000	0.000	0.394	14.107	33091	12.4	3.864	116	5.4	35.1	0.1	0.001	8559	8495	pg170_o2nofp.cx10a_c8r32
100	8524	0	0.0	39.3	1.4	0.000	0.000	0.393	14.169	32959	12.4	3.867	116	5.4	35.2	0.2	0.001	8527	8463	pg175_o2nofp.cx10a_c8r32
100	8486	0	0.0	39.2	1.4	0.000	0.000	0.392	14.103	32792	12.4	3.864	117	5.4	34.8	0.1	0.001	8495	8415	pg18beta1_o2nofp.cx10b_c8r32
100	8531	0	0.0	39.3	1.4	0.000	0.000	0.393	14.121	32983	12.4	3.866	116	5.4	35.1	0.1	0.001	8542	8463	pg18beta1_o2nofp.cx10c_c8r32
100	8496	0	0.0	39.3	1.4	0.000	0.000	0.393	14.122	32849	12.4	3.867	117	5.4	34.7	0.1	0.001	8495	8431	pg18beta1_o2nofp.cx10d_c8r32
qr500.L3
qr500.L3: range queries with 500 insert/s per client. Graphs for performance per 1-second interval are here.
Average throughput:

Query response time histogram: each cell has the percentage of responses that take <= the time in the header and max is the max response time in seconds. For max values in the top 25% of the range have a red background and in the bottom 25% of the range have a green background. The red background is not used when the min value is within 80% of the max value.
| dbms | 256us | 1ms | 4ms | 16ms | 64ms | 256ms | 1s | 4s | 16s | gt | max |
|---|---|---|---|---|---|---|---|---|---|---|---|
| pg140_o2nofp.cx10a_c8r32 | 99.998 | 0.002 | nonzero | nonzero | 0.031 | ||||||
| pg1418_o2nofp.cx10a_c8r32 | 99.999 | 0.001 | nonzero | nonzero | 0.007 | ||||||
| pg150_o2nofp.cx10a_c8r32 | 99.999 | 0.001 | nonzero | 0.002 | |||||||
| pg1513_o2nofp.cx10a_c8r32 | 99.999 | 0.001 | nonzero | 0.002 | |||||||
| pg160_o2nofp.cx10a_c8r32 | 99.999 | 0.001 | nonzero | 0.002 | |||||||
| pg169_o2nofp.cx10a_c8r32 | 99.999 | 0.001 | nonzero | 0.002 | |||||||
| pg170_o2nofp.cx10a_c8r32 | 99.999 | 0.001 | nonzero | 0.002 | |||||||
| pg175_o2nofp.cx10a_c8r32 | 99.999 | 0.001 | nonzero | 0.002 | |||||||
| pg18beta1_o2nofp.cx10b_c8r32 | 99.999 | 0.001 | nonzero | 0.002 | |||||||
| pg18beta1_o2nofp.cx10c_c8r32 | 99.999 | 0.001 | nonzero | 0.003 | |||||||
| pg18beta1_o2nofp.cx10d_c8r32 | 99.999 | 0.001 | nonzero | nonzero | 0.008 |
Insert response time histogram: each cell has the percentage of responses that take <= the time in the header and max is the max response time in seconds. For max values in the top 25% of the range have a red background and in the bottom 25% of the range have a green background. The red background is not used when the min value is within 80% of the max value.
| dbms | 256us | 1ms | 4ms | 16ms | 64ms | 256ms | 1s | 4s | 16s | gt | max |
|---|---|---|---|---|---|---|---|---|---|---|---|
| pg140_o2nofp.cx10a_c8r32 | 46.067 | 53.833 | 0.094 | 0.006 | 0.036 | ||||||
| pg1418_o2nofp.cx10a_c8r32 | 44.494 | 55.478 | 0.028 | 0.009 | |||||||
| pg150_o2nofp.cx10a_c8r32 | 45.728 | 54.044 | 0.228 | 0.016 | |||||||
| pg1513_o2nofp.cx10a_c8r32 | 41.228 | 58.639 | 0.133 | 0.010 | |||||||
| pg160_o2nofp.cx10a_c8r32 | 41.422 | 58.439 | 0.139 | 0.010 | |||||||
| pg169_o2nofp.cx10a_c8r32 | 46.344 | 53.583 | 0.072 | 0.009 | |||||||
| pg170_o2nofp.cx10a_c8r32 | 49.667 | 50.194 | 0.139 | 0.011 | |||||||
| pg175_o2nofp.cx10a_c8r32 | 42.294 | 57.478 | 0.228 | 0.011 | |||||||
| pg18beta1_o2nofp.cx10b_c8r32 | 53.678 | 46.289 | 0.033 | 0.010 | |||||||
| pg18beta1_o2nofp.cx10c_c8r32 | 56.161 | 43.811 | 0.028 | 0.009 | |||||||
| pg18beta1_o2nofp.cx10d_c8r32 | 50.967 | 48.839 | 0.194 | 0.010 |
Delete response time histogram: each cell has the percentage of responses that take <= the time in the header and max is the max response time in seconds. For max values in the top 25% of the range have a red background and in the bottom 25% of the range have a green background. The red background is not used when the min value is within 80% of the max value.
| dbms | 256us | 1ms | 4ms | 16ms | 64ms | 256ms | 1s | 4s | 16s | gt | max |
|---|---|---|---|---|---|---|---|---|---|---|---|
| pg140_o2nofp.cx10a_c8r32 | 27.667 | 72.272 | 0.056 | 0.006 | 0.034 | ||||||
| pg1418_o2nofp.cx10a_c8r32 | 26.133 | 73.811 | 0.056 | 0.010 | |||||||
| pg150_o2nofp.cx10a_c8r32 | 23.061 | 76.833 | 0.100 | 0.006 | 0.026 | ||||||
| pg1513_o2nofp.cx10a_c8r32 | 25.339 | 74.594 | 0.067 | 0.010 | |||||||
| pg160_o2nofp.cx10a_c8r32 | 25.711 | 74.211 | 0.078 | 0.010 | |||||||
| pg169_o2nofp.cx10a_c8r32 | 26.167 | 73.744 | 0.089 | 0.010 | |||||||
| pg170_o2nofp.cx10a_c8r32 | 21.406 | 77.361 | 1.233 | 0.011 | |||||||
| pg175_o2nofp.cx10a_c8r32 | 21.400 | 77.417 | 1.183 | 0.012 | |||||||
| pg18beta1_o2nofp.cx10b_c8r32 | 21.939 | 77.272 | 0.789 | 0.013 | |||||||
| pg18beta1_o2nofp.cx10c_c8r32 | 24.533 | 74.967 | 0.500 | 0.006 | |||||||
| pg18beta1_o2nofp.cx10d_c8r32 | 22.956 | 76.617 | 0.428 | 0.011 |
Performance metrics for the DBMS listed above. Some are normalized by throughput, others are not. Legend for results is here.
ips	qps	rps	rmbps	wps	wmbps	rpq	rkbpq	wpi	wkbpi	csps	cpups	cspq	cpupq	dbgb1	dbgb2	rss	maxop	p50	p99	tag
500	14669	0	0.0	52.5	1.8	0.000	0.000	0.105	3.736	56209	13.0	3.832	71	5.4	35.2	0.3	0.031	14622	14046	pg140_o2nofp.cx10a_c8r32
500	14498	0	0.0	52.6	1.8	0.000	0.000	0.105	3.744	55560	13.1	3.832	72	5.4	35.3	0.3	0.007	14462	13902	pg1418_o2nofp.cx10a_c8r32
500	14739	0	0.0	50.4	1.8	0.000	0.000	0.101	3.742	56448	13.1	3.830	71	5.5	35.2	0.3	0.002	14685	14062	pg150_o2nofp.cx10a_c8r32
500	14451	0	0.0	50.2	1.8	0.000	0.000	0.100	3.713	55335	12.9	3.829	71	5.4	35.3	0.3	0.002	14414	13790	pg1513_o2nofp.cx10a_c8r32
500	14727	0	0.0	50.2	1.8	0.000	0.000	0.101	3.721	56425	13.0	3.831	71	5.4	35.1	2.7	0.002	14654	14078	pg160_o2nofp.cx10a_c8r32
500	14616	0	0.0	50.2	1.8	0.000	0.000	0.100	3.692	56002	13.0	3.831	71	5.5	35.3	2.7	0.002	14574	13950	pg169_o2nofp.cx10a_c8r32
500	14602	0	0.0	49.6	1.8	0.000	0.000	0.099	3.712	55882	13.0	3.827	71	5.4	35.2	0.3	0.002	14526	13854	pg170_o2nofp.cx10a_c8r32
500	14502	0	0.0	49.6	1.8	0.000	0.000	0.099	3.749	55534	13.0	3.829	72	5.5	35.2	0.3	0.002	14446	13806	pg175_o2nofp.cx10a_c8r32
500	14315	0	0.0	49.5	1.8	0.000	0.000	0.099	3.669	54784	12.9	3.827	72	5.4	34.8	0.3	0.002	14286	13582	pg18beta1_o2nofp.cx10b_c8r32
500	14610	0	0.0	49.5	1.8	0.000	0.000	0.099	3.680	55939	13.0	3.829	71	5.4	35.1	4.6	0.003	14558	13822	pg18beta1_o2nofp.cx10c_c8r32
500	14524	0	0.0	49.4	1.8	0.000	0.000	0.099	3.729	55585	12.9	3.827	71	5.5	34.8	0.3	0.008	14477	13758	pg18beta1_o2nofp.cx10d_c8r32
qp500.L4
qp500.L4: point queries with 500 insert/s per client. Graphs for performance per 1-second interval are here.
Average throughput:
Query response time histogram: each cell has the percentage of responses that take <= the time in the header and max is the max response time in seconds. For max values in the top 25% of the range have a red background and in the bottom 25% of the range have a green background. The red background is not used when the min value is within 80% of the max value.
| dbms | 256us | 1ms | 4ms | 16ms | 64ms | 256ms | 1s | 4s | 16s | gt | max |
|---|---|---|---|---|---|---|---|---|---|---|---|
| pg140_o2nofp.cx10a_c8r32 | 99.988 | 0.012 | nonzero | 0.002 | |||||||
| pg1418_o2nofp.cx10a_c8r32 | 99.987 | 0.013 | nonzero | 0.002 | |||||||
| pg150_o2nofp.cx10a_c8r32 | 99.990 | 0.010 | nonzero | 0.002 | |||||||
| pg1513_o2nofp.cx10a_c8r32 | 99.990 | 0.010 | nonzero | 0.002 | |||||||
| pg160_o2nofp.cx10a_c8r32 | 99.989 | 0.011 | nonzero | 0.002 | |||||||
| pg169_o2nofp.cx10a_c8r32 | 99.990 | 0.010 | nonzero | 0.002 | |||||||
| pg170_o2nofp.cx10a_c8r32 | 99.991 | 0.009 | nonzero | 0.002 | |||||||
| pg175_o2nofp.cx10a_c8r32 | 99.991 | 0.009 | nonzero | 0.002 | |||||||
| pg18beta1_o2nofp.cx10b_c8r32 | 99.991 | 0.009 | nonzero | nonzero | 0.022 | ||||||
| pg18beta1_o2nofp.cx10c_c8r32 | 99.990 | 0.010 | nonzero | 0.002 | |||||||
| pg18beta1_o2nofp.cx10d_c8r32 | 99.991 | 0.009 | nonzero | 0.002 |
Insert response time histogram: each cell has the percentage of responses that take <= the time in the header and max is the max response time in seconds. For max values in the top 25% of the range have a red background and in the bottom 25% of the range have a green background. The red background is not used when the min value is within 80% of the max value.
| dbms | 256us | 1ms | 4ms | 16ms | 64ms | 256ms | 1s | 4s | 16s | gt | max |
|---|---|---|---|---|---|---|---|---|---|---|---|
| pg140_o2nofp.cx10a_c8r32 | 26.672 | 73.306 | 0.022 | 0.008 | |||||||
| pg1418_o2nofp.cx10a_c8r32 | 26.133 | 73.778 | 0.089 | 0.011 | |||||||
| pg150_o2nofp.cx10a_c8r32 | 27.700 | 72.278 | 0.022 | 0.009 | |||||||
| pg1513_o2nofp.cx10a_c8r32 | 26.306 | 73.683 | 0.011 | 0.007 | |||||||
| pg160_o2nofp.cx10a_c8r32 | 26.067 | 73.867 | 0.067 | 0.010 | |||||||
| pg169_o2nofp.cx10a_c8r32 | 24.256 | 75.739 | 0.006 | 0.005 | |||||||
| pg170_o2nofp.cx10a_c8r32 | 30.206 | 69.689 | 0.106 | 0.010 | |||||||
| pg175_o2nofp.cx10a_c8r32 | 35.150 | 64.806 | 0.044 | 0.010 | |||||||
| pg18beta1_o2nofp.cx10b_c8r32 | 30.678 | 69.233 | 0.089 | 0.011 | |||||||
| pg18beta1_o2nofp.cx10c_c8r32 | 36.544 | 63.289 | 0.167 | 0.011 | |||||||
| pg18beta1_o2nofp.cx10d_c8r32 | 34.850 | 65.139 | 0.011 | 0.005 |
Delete response time histogram: each cell has the percentage of responses that take <= the time in the header and max is the max response time in seconds. For max values in the top 25% of the range have a red background and in the bottom 25% of the range have a green background. The red background is not used when the min value is within 80% of the max value.
| dbms | 256us | 1ms | 4ms | 16ms | 64ms | 256ms | 1s | 4s | 16s | gt | max |
|---|---|---|---|---|---|---|---|---|---|---|---|
| pg140_o2nofp.cx10a_c8r32 | 24.500 | 75.461 | 0.039 | 0.005 | |||||||
| pg1418_o2nofp.cx10a_c8r32 | 26.389 | 73.544 | 0.067 | 0.010 | |||||||
| pg150_o2nofp.cx10a_c8r32 | 18.550 | 80.861 | 0.589 | 0.007 | |||||||
| pg1513_o2nofp.cx10a_c8r32 | 20.933 | 79.022 | 0.044 | 0.005 | |||||||
| pg160_o2nofp.cx10a_c8r32 | 22.506 | 77.411 | 0.083 | 0.005 | |||||||
| pg169_o2nofp.cx10a_c8r32 | 24.861 | 75.067 | 0.072 | 0.005 | |||||||
| pg170_o2nofp.cx10a_c8r32 | 21.722 | 77.078 | 1.200 | 0.011 | |||||||
| pg175_o2nofp.cx10a_c8r32 | 20.233 | 78.811 | 0.956 | 0.005 | |||||||
| pg18beta1_o2nofp.cx10b_c8r32 | 21.061 | 78.272 | 0.667 | 0.011 | |||||||
| pg18beta1_o2nofp.cx10c_c8r32 | 20.750 | 78.694 | 0.556 | 0.011 | |||||||
| pg18beta1_o2nofp.cx10d_c8r32 | 17.978 | 81.661 | 0.361 | 0.006 |
Performance metrics for the DBMS listed above. Some are normalized by throughput, others are not. Legend for results is here.
ips	qps	rps	rmbps	wps	wmbps	rpq	rkbpq	wpi	wkbpi	csps	cpups	cspq	cpupq	dbgb1	dbgb2	rss	maxop	p50	p99	tag
500	8548	0	0.0	30.8	2.3	0.000	0.000	0.062	4.637	33208	12.5	3.885	117	5.4	34.0	0.3	0.002	8543	8479	pg140_o2nofp.cx10a_c8r32
500	8403	0	0.0	31.1	2.3	0.000	0.000	0.062	4.696	32660	12.5	3.887	119	5.5	34.1	0.3	0.002	8399	8335	pg1418_o2nofp.cx10a_c8r32
500	8723	0	0.0	28.7	2.2	0.000	0.000	0.057	4.579	33845	12.4	3.880	114	5.5	34.0	0.3	0.002	8719	8639	pg150_o2nofp.cx10a_c8r32
500	8557	0	0.0	28.7	2.2	0.000	0.000	0.057	4.582	33203	12.4	3.880	116	5.4	34.0	0.3	0.002	8559	8479	pg1513_o2nofp.cx10a_c8r32
500	8606	0	0.0	28.8	2.3	0.000	0.000	0.058	4.623	33392	12.4	3.880	115	5.5	34.0	4.6	0.002	8607	8542	pg160_o2nofp.cx10a_c8r32
500	8538	0	0.0	28.6	2.2	0.000	0.000	0.057	4.578	33152	12.5	3.883	117	5.5	34.1	2.8	0.002	8543	8463	pg169_o2nofp.cx10a_c8r32
500	8529	0	0.0	27.6	2.3	0.000	0.000	0.055	4.645	33092	12.5	3.880	117	5.5	34.1	0.3	0.002	8527	8463	pg170_o2nofp.cx10a_c8r32
500	8534	0	0.0	27.4	2.2	0.000	0.000	0.055	4.598	33103	12.5	3.879	117	5.5	34.0	0.3	0.002	8543	8463	pg175_o2nofp.cx10a_c8r32
500	8465	0	0.0	28.2	2.2	0.000	0.000	0.056	4.597	32828	12.4	3.878	117	5.4	34.0	0.3	0.022	8463	8383	pg18beta1_o2nofp.cx10b_c8r32
500	8524	0	0.0	28.4	2.3	0.000	0.000	0.057	4.639	33051	12.4	3.877	116	5.5	34.0	0.3	0.002	8526	8463	pg18beta1_o2nofp.cx10c_c8r32
500	8513	0	0.0	28.3	2.2	0.000	0.000	0.057	4.571	33002	12.4	3.877	117	5.5	34.1	0.3	0.002	8511	8431	pg18beta1_o2nofp.cx10d_c8r32
qr1000.L5
qr1000.L5: range queries with 1000 insert/s per client. Graphs for performance per 1-second interval are here.
Average throughput:
Query response time histogram: each cell has the percentage of responses that take <= the time in the header and max is the max response time in seconds. For max values in the top 25% of the range have a red background and in the bottom 25% of the range have a green background. The red background is not used when the min value is within 80% of the max value.
| dbms | 256us | 1ms | 4ms | 16ms | 64ms | 256ms | 1s | 4s | 16s | gt | max |
|---|---|---|---|---|---|---|---|---|---|---|---|
| pg140_o2nofp.cx10a_c8r32 | 99.999 | 0.001 | nonzero | 0.002 | |||||||
| pg1418_o2nofp.cx10a_c8r32 | 99.999 | 0.001 | nonzero | 0.002 | |||||||
| pg150_o2nofp.cx10a_c8r32 | 99.999 | 0.001 | nonzero | 0.002 | |||||||
| pg1513_o2nofp.cx10a_c8r32 | 99.999 | 0.001 | nonzero | 0.002 | |||||||
| pg160_o2nofp.cx10a_c8r32 | 99.999 | 0.001 | nonzero | 0.002 | |||||||
| pg169_o2nofp.cx10a_c8r32 | 99.999 | 0.001 | nonzero | 0.002 | |||||||
| pg170_o2nofp.cx10a_c8r32 | 99.999 | 0.001 | nonzero | 0.002 | |||||||
| pg175_o2nofp.cx10a_c8r32 | 99.999 | 0.001 | nonzero | 0.002 | |||||||
| pg18beta1_o2nofp.cx10b_c8r32 | 99.997 | 0.003 | nonzero | nonzero | 0.007 | ||||||
| pg18beta1_o2nofp.cx10c_c8r32 | 99.997 | 0.003 | nonzero | 0.003 | |||||||
| pg18beta1_o2nofp.cx10d_c8r32 | 99.997 | 0.003 | nonzero | 0.003 |
Insert response time histogram: each cell has the percentage of responses that take <= the time in the header and max is the max response time in seconds. For max values in the top 25% of the range have a red background and in the bottom 25% of the range have a green background. The red background is not used when the min value is within 80% of the max value.
| dbms | 256us | 1ms | 4ms | 16ms | 64ms | 256ms | 1s | 4s | 16s | gt | max |
|---|---|---|---|---|---|---|---|---|---|---|---|
| pg140_o2nofp.cx10a_c8r32 | 64.422 | 35.558 | 0.019 | 0.010 | |||||||
| pg1418_o2nofp.cx10a_c8r32 | 63.242 | 36.750 | 0.008 | 0.005 | |||||||
| pg150_o2nofp.cx10a_c8r32 | 62.014 | 37.975 | 0.011 | 0.010 | |||||||
| pg1513_o2nofp.cx10a_c8r32 | 56.847 | 43.131 | 0.022 | 0.010 | |||||||
| pg160_o2nofp.cx10a_c8r32 | 61.956 | 38.036 | 0.008 | 0.009 | |||||||
| pg169_o2nofp.cx10a_c8r32 | 65.069 | 34.922 | 0.008 | 0.007 | |||||||
| pg170_o2nofp.cx10a_c8r32 | 67.875 | 32.108 | 0.017 | 0.010 | |||||||
| pg175_o2nofp.cx10a_c8r32 | 66.511 | 33.478 | 0.011 | 0.010 | |||||||
| pg18beta1_o2nofp.cx10b_c8r32 | 69.519 | 30.456 | 0.025 | 0.010 | |||||||
| pg18beta1_o2nofp.cx10c_c8r32 | 70.344 | 29.647 | 0.008 | 0.009 | |||||||
| pg18beta1_o2nofp.cx10d_c8r32 | 69.528 | 30.469 | 0.003 | 0.005 |
Delete response time histogram: each cell has the percentage of responses that take <= the time in the header and max is the max response time in seconds. For max values in the top 25% of the range have a red background and in the bottom 25% of the range have a green background. The red background is not used when the min value is within 80% of the max value.
| dbms | 256us | 1ms | 4ms | 16ms | 64ms | 256ms | 1s | 4s | 16s | gt | max |
|---|---|---|---|---|---|---|---|---|---|---|---|
| pg140_o2nofp.cx10a_c8r32 | 26.133 | 73.822 | 0.044 | 0.007 | |||||||
| pg1418_o2nofp.cx10a_c8r32 | 24.208 | 75.783 | 0.008 | 0.004 | |||||||
| pg150_o2nofp.cx10a_c8r32 | 23.267 | 73.950 | 2.783 | 0.007 | |||||||
| pg1513_o2nofp.cx10a_c8r32 | 24.767 | 75.214 | 0.019 | 0.010 | |||||||
| pg160_o2nofp.cx10a_c8r32 | 23.403 | 76.550 | 0.047 | 0.004 | |||||||
| pg169_o2nofp.cx10a_c8r32 | 26.011 | 73.944 | 0.044 | 0.004 | |||||||
| pg170_o2nofp.cx10a_c8r32 | 24.314 | 75.203 | 0.483 | 0.005 | |||||||
| pg175_o2nofp.cx10a_c8r32 | 21.022 | 78.506 | 0.472 | 0.005 | |||||||
| pg18beta1_o2nofp.cx10b_c8r32 | 22.733 | 76.831 | 0.436 | 0.005 | |||||||
| pg18beta1_o2nofp.cx10c_c8r32 | 18.953 | 80.700 | 0.347 | 0.005 | |||||||
| pg18beta1_o2nofp.cx10d_c8r32 | 19.319 | 80.375 | 0.306 | 0.006 |
Performance metrics for the DBMS listed above. Some are normalized by throughput, others are not. Legend for results is here.
ips	qps	rps	rmbps	wps	wmbps	rpq	rkbpq	wpi	wkbpi	csps	cpups	cspq	cpupq	dbgb1	dbgb2	rss	maxop	p50	p99	tag
1000	14686	0	0.0	32.9	2.7	0.000	0.000	0.033	2.782	56503	13.4	3.847	73	5.5	32.4	0.3	0.002	14654	14078	pg140_o2nofp.cx10a_c8r32
999	14461	0	0.0	32.8	2.7	0.000	0.000	0.033	2.772	55679	13.3	3.850	74	5.5	32.4	0.3	0.002	14462	13902	pg1418_o2nofp.cx10a_c8r32
1000	14810	0	0.0	30.7	2.7	0.000	0.000	0.031	2.734	56930	13.3	3.844	72	5.5	32.4	1.1	0.002	14766	14126	pg150_o2nofp.cx10a_c8r32
1000	14353	0	0.0	30.9	2.7	0.000	0.000	0.031	2.755	55192	13.3	3.845	74	5.5	32.4	0.3	0.002	14334	13726	pg1513_o2nofp.cx10a_c8r32
1000	14693	0	0.0	30.7	2.7	0.000	0.000	0.031	2.740	56486	13.4	3.844	73	5.5	32.4	3.0	0.002	14670	14030	pg160_o2nofp.cx10a_c8r32
999	14599	0	0.0	30.6	2.7	0.000	0.000	0.031	2.725	56163	13.3	3.847	73	5.5	32.4	2.9	0.002	14606	13934	pg169_o2nofp.cx10a_c8r32
999	14582	0	0.0	30.0	2.7	0.000	0.000	0.030	2.746	56021	13.3	3.842	73	5.5	32.4	0.3	0.002	14574	13853	pg170_o2nofp.cx10a_c8r32
1000	14506	0	0.0	30.1	2.7	0.000	0.000	0.030	2.745	55697	13.3	3.839	73	5.5	32.4	0.3	0.002	14494	13790	pg175_o2nofp.cx10a_c8r32
1000	14313	0	0.0	33.0	2.6	0.000	0.000	0.033	2.713	54963	13.2	3.840	74	5.5	32.4	0.3	0.007	14302	13582	pg18beta1_o2nofp.cx10b_c8r32
1000	14499	0	0.0	33.2	2.6	0.000	0.000	0.033	2.697	55668	13.2	3.839	73	5.5	32.4	0.3	0.003	14478	13678	pg18beta1_o2nofp.cx10c_c8r32
1000	14478	0	0.0	33.7	2.6	0.000	0.000	0.034	2.684	55591	13.3	3.840	73	5.5	32.4	0.3	0.003	14446	13726	pg18beta1_o2nofp.cx10d_c8r32
qp1000.L6
qp1000.L6: point queries with 1000 insert/s per client. Graphs for performance per 1-second interval are here.
Average throughput:

Query response time histogram: each cell has the percentage of responses that take <= the time in the header and max is the max response time in seconds. For max values in the top 25% of the range have a red background and in the bottom 25% of the range have a green background. The red background is not used when the min value is within 80% of the max value.
| dbms | 256us | 1ms | 4ms | 16ms | 64ms | 256ms | 1s | 4s | 16s | gt | max |
|---|---|---|---|---|---|---|---|---|---|---|---|
| pg140_o2nofp.cx10a_c8r32 | 99.985 | 0.015 | nonzero | 0.002 | |||||||
| pg1418_o2nofp.cx10a_c8r32 | 99.984 | 0.016 | nonzero | 0.002 | |||||||
| pg150_o2nofp.cx10a_c8r32 | 99.988 | 0.012 | nonzero | 0.002 | |||||||
| pg1513_o2nofp.cx10a_c8r32 | 99.986 | 0.014 | nonzero | 0.002 | |||||||
| pg160_o2nofp.cx10a_c8r32 | 99.987 | 0.013 | nonzero | 0.002 | |||||||
| pg169_o2nofp.cx10a_c8r32 | 99.986 | 0.014 | nonzero | 0.001 | |||||||
| pg170_o2nofp.cx10a_c8r32 | 99.988 | 0.012 | nonzero | 0.002 | |||||||
| pg175_o2nofp.cx10a_c8r32 | 99.988 | 0.012 | nonzero | 0.002 | |||||||
| pg18beta1_o2nofp.cx10b_c8r32 | 99.987 | 0.013 | nonzero | nonzero | 0.050 | ||||||
| pg18beta1_o2nofp.cx10c_c8r32 | 99.988 | 0.012 | nonzero | 0.002 | |||||||
| pg18beta1_o2nofp.cx10d_c8r32 | 99.986 | 0.014 | nonzero | 0.003 |
Insert response time histogram: each cell has the percentage of responses that take <= the time in the header and max is the max response time in seconds. For max values in the top 25% of the range have a red background and in the bottom 25% of the range have a green background. The red background is not used when the min value is within 80% of the max value.
| dbms | 256us | 1ms | 4ms | 16ms | 64ms | 256ms | 1s | 4s | 16s | gt | max |
|---|---|---|---|---|---|---|---|---|---|---|---|
| pg140_o2nofp.cx10a_c8r32 | 51.261 | 48.725 | 0.011 | 0.003 | 0.026 | ||||||
| pg1418_o2nofp.cx10a_c8r32 | 54.078 | 45.908 | 0.011 | 0.003 | 0.019 | ||||||
| pg150_o2nofp.cx10a_c8r32 | 55.156 | 44.833 | 0.003 | 0.008 | 0.021 | ||||||
| pg1513_o2nofp.cx10a_c8r32 | 55.242 | 44.742 | 0.006 | 0.011 | 0.027 | ||||||
| pg160_o2nofp.cx10a_c8r32 | 52.933 | 47.056 | 0.003 | 0.008 | 0.022 | ||||||
| pg169_o2nofp.cx10a_c8r32 | 52.525 | 47.450 | 0.019 | 0.006 | 0.019 | ||||||
| pg170_o2nofp.cx10a_c8r32 | 60.369 | 39.614 | 0.014 | 0.003 | 0.022 | ||||||
| pg175_o2nofp.cx10a_c8r32 | 58.842 | 41.142 | 0.008 | 0.008 | 0.023 | ||||||
| pg18beta1_o2nofp.cx10b_c8r32 | 59.936 | 40.031 | 0.025 | 0.008 | 0.018 | ||||||
| pg18beta1_o2nofp.cx10c_c8r32 | 53.361 | 46.625 | 0.011 | 0.003 | 0.022 | ||||||
| pg18beta1_o2nofp.cx10d_c8r32 | 50.136 | 49.856 | 0.008 | 0.010 |
Delete response time histogram: each cell has the percentage of responses that take <= the time in the header and max is the max response time in seconds. For max values in the top 25% of the range have a red background and in the bottom 25% of the range have a green background. The red background is not used when the min value is within 80% of the max value.
| dbms | 256us | 1ms | 4ms | 16ms | 64ms | 256ms | 1s | 4s | 16s | gt | max |
|---|---|---|---|---|---|---|---|---|---|---|---|
| pg140_o2nofp.cx10a_c8r32 | 31.583 | 68.392 | 0.022 | 0.003 | 0.024 | ||||||
| pg1418_o2nofp.cx10a_c8r32 | 33.767 | 66.200 | 0.031 | 0.003 | 0.017 | ||||||
| pg150_o2nofp.cx10a_c8r32 | 32.078 | 61.300 | 6.614 | 0.008 | 0.020 | ||||||
| pg1513_o2nofp.cx10a_c8r32 | 29.256 | 70.719 | 0.014 | 0.011 | 0.023 | ||||||
| pg160_o2nofp.cx10a_c8r32 | 31.328 | 68.611 | 0.053 | 0.008 | 0.021 | ||||||
| pg169_o2nofp.cx10a_c8r32 | 27.992 | 71.944 | 0.058 | 0.006 | 0.018 | ||||||
| pg170_o2nofp.cx10a_c8r32 | 28.433 | 71.125 | 0.439 | 0.003 | 0.021 | ||||||
| pg175_o2nofp.cx10a_c8r32 | 29.111 | 70.411 | 0.469 | 0.008 | 0.022 | ||||||
| pg18beta1_o2nofp.cx10b_c8r32 | 14.969 | 84.478 | 0.547 | 0.006 | 0.017 | ||||||
| pg18beta1_o2nofp.cx10c_c8r32 | 19.461 | 80.231 | 0.306 | 0.003 | 0.020 | ||||||
| pg18beta1_o2nofp.cx10d_c8r32 | 25.586 | 74.133 | 0.281 | 0.006 |
Performance metrics for the DBMS listed above. Some are normalized by throughput, others are not. Legend for results is here.
ips	qps	rps	rmbps	wps	wmbps	rpq	rkbpq	wpi	wkbpi	csps	cpups	cspq	cpupq	dbgb1	dbgb2	rss	maxop	p50	p99	tag
1000	8514	0	0.0	33.2	2.7	0.000	0.000	0.033	2.782	33299	13.1	3.911	123	5.5	30.2	0.2	0.002	8511	8431	pg140_o2nofp.cx10a_c8r32
999	8393	0	0.0	33.2	2.7	0.000	0.000	0.033	2.777	32853	13.1	3.914	125	5.5	30.3	5.4	0.002	8399	8319	pg1418_o2nofp.cx10a_c8r32
1000	8693	0	0.0	31.2	2.7	0.000	0.000	0.031	2.759	33944	13.1	3.905	121	5.5	30.2	3.6	0.002	8687	8575	pg150_o2nofp.cx10a_c8r32
1000	8581	0	0.0	31.3	2.7	0.000	0.000	0.031	2.756	33512	13.0	3.905	121	5.5	30.2	4.0	0.002	8575	8495	pg1513_o2nofp.cx10a_c8r32
1000	8625	0	0.0	31.1	2.7	0.000	0.000	0.031	2.759	33679	12.9	3.905	120	5.5	30.2	2.1	0.002	8623	8542	pg160_o2nofp.cx10a_c8r32
999	8583	0	0.0	31.3	2.7	0.000	0.000	0.031	2.758	33540	13.1	3.908	122	5.5	30.3	2.1	0.001	8591	8511	pg169_o2nofp.cx10a_c8r32
999	8575	0	0.0	29.7	2.7	0.000	0.000	0.030	2.751	33439	13.1	3.900	122	5.5	30.3	0.2	0.002	8575	8495	pg170_o2nofp.cx10a_c8r32
1000	8576	0	0.0	29.7	2.7	0.000	0.000	0.030	2.753	33431	13.1	3.898	122	5.5	30.2	0.4	0.002	8575	8495	pg175_o2nofp.cx10a_c8r32
1000	8492	0	0.0	31.0	3.1	0.000	0.000	0.031	3.126	33108	13.1	3.899	123	5.5	30.2	0.3	0.050	8495	8415	pg18beta1_o2nofp.cx10b_c8r32
1000	8534	0	0.0	28.1	2.7	0.000	0.000	0.028	2.733	33271	13.1	3.899	123	5.5	30.2	0.3	0.002	8527	8463	pg18beta1_o2nofp.cx10c_c8r32
1000	8438	0	0.0	28.1	2.7	0.000	0.000	0.028	2.732	32905	13.1	3.899	124	5.5	30.2	1.5	0.003	8431	8367	pg18beta1_o2nofp.cx10d_c8r32
l.i0
l.i0: load without secondary indexes
Performance metrics for all DBMS, not just the ones listed above. Some are normalized by throughput, others are not. Legend for results is here.
ips	qps	rps	rmbps	wps	wmbps	rpq	rkbpq	wpi	wkbpi	csps	cpups	cspq	cpupq	dbgb1	dbgb2	rss	maxop	p50	p99	tag
137931	0	0	0.0	512.9	58.0	0.000	0.000	0.004	0.431	16683	19.4	0.121	11	1.9	5.2	2.0	0.006	138575	131478	pg140_o2nofp.cx10a_c8r32
136986	0	0	0.0	512.1	57.9	0.000	0.000	0.004	0.433	16515	19.4	0.121	11	1.9	5.2	1.2	0.006	137482	131586	pg1418_o2nofp.cx10a_c8r32
143885	0	0	0.0	541.9	61.5	0.000	0.000	0.004	0.438	17227	19.8	0.120	11	1.9	5.2	1.7	0.004	144674	137586	pg150_o2nofp.cx10a_c8r32
141844	0	0	0.0	532.8	60.5	0.000	0.000	0.004	0.436	17084	19.8	0.120	11	1.9	5.2	1.2	0.002	143683	137486	pg1513_o2nofp.cx10a_c8r32
143885	0	0	0.0	542.1	61.5	0.000	0.000	0.004	0.438	17156	19.9	0.119	11	1.9	5.2	0.4	0.002	144884	137287	pg160_o2nofp.cx10a_c8r32
142857	0	0	0.0	541.8	61.5	0.000	0.000	0.004	0.441	17098	19.7	0.120	11	1.9	5.2	1.7	0.002	144783	137985	pg169_o2nofp.cx10a_c8r32
142857	0	0	0.0	532.2	60.4	0.000	0.000	0.004	0.433	14635	19.8	0.102	11	1.9	5.2	1.7	0.002	143781	136986	pg170_o2nofp.cx10a_c8r32
143885	0	0	0.0	538.9	61.1	0.000	0.000	0.004	0.435	14748	20.0	0.103	11	1.9	5.2	1.7	0.002	144680	137678	pg175_o2nofp.cx10a_c8r32
140845	0	0	0.0	528.8	60.0	0.000	0.000	0.004	0.436	14502	19.8	0.103	11	1.9	5.2	1.6	0.002	142080	135378	pg18beta1_o2nofp.cx10b_c8r32
141844	0	0	0.0	532.0	60.3	0.000	0.000	0.004	0.436	14552	20.0	0.103	11	1.9	5.2	1.7	0.002	142781	135988	pg18beta1_o2nofp.cx10c_c8r32
139860	0	0	0.0	527.5	59.8	0.000	0.000	0.004	0.438	14392	19.7	0.103	11	1.9	5.2	1.6	0.003	142081	133485	pg18beta1_o2nofp.cx10d_c8r32
l.x
l.x: create secondary indexes
Performance metrics for all DBMS, not just the ones listed above. Some are normalized by throughput, others are not. Legend for results is here.
ips	qps	rps	rmbps	wps	wmbps	rpq	rkbpq	wpi	wkbpi	csps	cpups	cspq	cpupq	dbgb1	dbgb2	rss	maxop	p50	p99	tag
327870	0	0	0.0	663.4	81.1	0.000	0.000	0.002	0.253	1968	11.5	0.006	3	3.9	8.9	2.1	0.002	NA	NA	pg140_o2nofp.cx10a_c8r32
333335	0	0	0.0	675.3	82.5	0.000	0.000	0.002	0.254	2072	11.5	0.006	3	3.9	8.9	2.1	0.002	NA	NA	pg1418_o2nofp.cx10a_c8r32
363638	0	0	0.0	719.7	88.3	0.000	0.000	0.002	0.249	2173	11.4	0.006	3	3.9	8.9	2.1	0.002	NA	NA	pg150_o2nofp.cx10a_c8r32
363638	0	0	0.0	611.8	75.2	0.000	0.000	0.002	0.212	1673	11.5	0.005	3	3.8	8.9	2.1	0.002	NA	NA	pg1513_o2nofp.cx10a_c8r32
363638	0	0	0.0	846.6	104.1	0.000	0.000	0.002	0.293	2240	11.3	0.006	2	3.9	8.9	2.1	0.002	NA	NA	pg160_o2nofp.cx10a_c8r32
357145	0	0	0.0	726.4	89.1	0.000	0.000	0.002	0.255	2204	11.3	0.006	3	3.9	8.9	2.1	0.002	NA	NA	pg169_o2nofp.cx10a_c8r32
370372	0	0	0.0	557.1	68.2	0.000	0.000	0.002	0.189	1745	11.2	0.005	2	3.9	8.9	2.1	0.002	NA	NA	pg170_o2nofp.cx10a_c8r32
377360	0	0	0.0	580.2	71.0	0.000	0.000	0.002	0.193	1841	11.5	0.005	2	3.9	8.9	2.1	0.002	NA	NA	pg175_o2nofp.cx10a_c8r32
377360	0	0	0.0	607.8	74.3	0.000	0.000	0.002	0.202	1916	11.5	0.005	2	3.9	8.9	2.1	0.002	NA	NA	pg18beta1_o2nofp.cx10b_c8r32
384617	0	0	0.0	606.1	74.2	0.000	0.000	0.002	0.197	1947	11.5	0.005	2	3.9	8.9	2.1	0.002	NA	NA	pg18beta1_o2nofp.cx10c_c8r32
377360	0	0	0.0	603.1	73.8	0.000	0.000	0.002	0.200	1958	11.4	0.005	2	3.9	8.9	2.1	0.002	NA	NA	pg18beta1_o2nofp.cx10d_c8r32
l.i1
l.i1: continue load after secondary indexes created with 50 inserts per transaction
Performance metrics for all DBMS, not just the ones listed above. Some are normalized by throughput, others are not. Legend for results is here.
ips	qps	rps	rmbps	wps	wmbps	rpq	rkbpq	wpi	wkbpi	csps	cpups	cspq	cpupq	dbgb1	dbgb2	rss	maxop	p50	p99	tag
27972	0	0	0.0	309.5	33.3	0.000	0.000	0.011	1.220	13599	22.3	0.486	64	5.4	32.0	2.5	0.050	22147	15848	pg140_o2nofp.cx10a_c8r32
28011	0	0	0.0	312.0	33.6	0.000	0.000	0.011	1.229	13694	22.5	0.489	64	5.4	32.1	2.5	0.059	22297	15298	pg1418_o2nofp.cx10a_c8r32
27174	0	0	0.0	299.3	32.4	0.000	0.000	0.011	1.219	13787	22.1	0.507	65	5.4	32.0	4.3	0.024	21347	14998	pg150_o2nofp.cx10a_c8r32
27491	0	0	0.0	304.7	33.0	0.000	0.000	0.011	1.228	14001	22.2	0.509	65	5.4	32.1	3.6	0.029	21647	15148	pg1513_o2nofp.cx10a_c8r32
27027	0	0	0.0	297.0	32.1	0.000	0.000	0.011	1.217	13741	22.0	0.508	65	5.4	32.0	4.6	0.027	21247	14198	pg160_o2nofp.cx10a_c8r32
27027	0	0	0.0	297.6	32.2	0.000	0.000	0.011	1.219	13724	22.1	0.508	65	5.4	32.1	4.8	0.024	20947	14698	pg169_o2nofp.cx10a_c8r32
26472	0	0	0.0	295.6	32.5	0.000	0.000	0.011	1.259	11104	21.9	0.419	66	5.4	32.1	1.3	0.052	20298	13148	pg170_o2nofp.cx10a_c8r32
26230	0	0	0.0	292.2	32.2	0.000	0.000	0.011	1.257	11005	21.9	0.420	67	5.3	32.1	2.4	0.037	20547	13448	pg175_o2nofp.cx10a_c8r32
26420	0	0	0.0	297.1	32.8	0.000	0.000	0.011	1.273	11108	21.9	0.420	66	5.3	32.0	1.5	0.033	20347	10599	pg18beta1_o2nofp.cx10b_c8r32
26333	0	0	0.0	295.7	32.7	0.000	0.000	0.011	1.272	11174	21.9	0.424	67	5.4	32.0	1.5	0.031	20198	14098	pg18beta1_o2nofp.cx10c_c8r32
25284	0	0	0.0	284.7	31.6	0.000	0.000	0.011	1.279	10680	21.7	0.422	69	5.4	32.1	4.5	0.031	18598	9849	pg18beta1_o2nofp.cx10d_c8r32
l.i2
l.i2: continue load after secondary indexes created with 5 inserts per transaction
Performance metrics for all DBMS, not just the ones listed above. Some are normalized by throughput, others are not. Legend for results is here.
ips	qps	rps	rmbps	wps	wmbps	rpq	rkbpq	wpi	wkbpi	csps	cpups	cspq	cpupq	dbgb1	dbgb2	rss	maxop	p50	p99	tag
3693	0	0	0.0	65.2	6.3	0.000	0.000	0.018	1.753	17198	15.9	4.657	344	5.4	35.2	0.1	0.038	2755	1905	pg140_o2nofp.cx10a_c8r32
3708	0	0	0.0	65.2	6.3	0.000	0.000	0.018	1.748	17234	15.9	4.648	343	5.4	35.3	0.1	0.033	2830	1745	pg1418_o2nofp.cx10a_c8r32
3700	0	0	0.0	63.0	6.3	0.000	0.000	0.017	1.747	17175	15.9	4.642	344	5.4	35.2	0.3	0.028	2865	1905	pg150_o2nofp.cx10a_c8r32
3602	0	0	0.0	61.6	6.1	0.000	0.000	0.017	1.748	16731	15.8	4.645	351	5.4	35.3	0.1	0.028	2600	1840	pg1513_o2nofp.cx10a_c8r32
3571	0	0	0.0	61.5	6.1	0.000	0.000	0.017	1.755	16554	15.9	4.635	356	5.4	35.1	0.2	0.025	2705	1820	pg160_o2nofp.cx10a_c8r32
3684	0	0	0.0	63.4	6.3	0.000	0.000	0.017	1.762	17148	15.9	4.654	345	5.5	35.3	3.1	0.051	2950	1955	pg169_o2nofp.cx10a_c8r32
3487	0	0	0.0	59.2	6.0	0.000	0.000	0.017	1.757	13605	15.7	3.902	360	5.4	35.1	0.3	0.011	2525	1750	pg170_o2nofp.cx10a_c8r32
3512	0	0	0.0	59.7	6.0	0.000	0.000	0.017	1.758	13692	15.7	3.898	358	5.4	35.2	0.3	0.036	2595	1720	pg175_o2nofp.cx10a_c8r32
3309	0	0	0.0	56.1	5.6	0.000	0.000	0.017	1.743	12952	15.7	3.914	380	5.4	34.8	0.3	0.021	2320	1175	pg18beta1_o2nofp.cx10b_c8r32
3565	0	0	0.0	60.3	6.1	0.000	0.000	0.017	1.759	13897	15.7	3.898	352	5.4	35.1	1.5	0.017	2590	1865	pg18beta1_o2nofp.cx10c_c8r32
3221	0	0	0.0	56.0	5.5	0.000	0.000	0.017	1.760	12590	15.4	3.909	383	5.4	34.7	5.2	0.006	2205	1165	pg18beta1_o2nofp.cx10d_c8r32
qr100.L1
qr100.L1: range queries with 100 insert/s per client
Performance metrics for all DBMS, not just the ones listed above. Some are normalized by throughput, others are not. Legend for results is here.
ips	qps	rps	rmbps	wps	wmbps	rpq	rkbpq	wpi	wkbpi	csps	cpups	cspq	cpupq	dbgb1	dbgb2	rss	maxop	p50	p99	tag
100	15216	0	0.0	13.4	0.6	0.000	0.000	0.134	6.434	58133	12.4	3.821	65	5.4	35.2	0.1	0.010	15214	15022	pg140_o2nofp.cx10a_c8r32
100	15005	0	0.0	13.5	0.6	0.000	0.000	0.135	6.458	57323	12.4	3.820	66	5.4	35.3	0.1	0.010	14990	14766	pg1418_o2nofp.cx10a_c8r32
100	15334	0	0.0	11.3	0.6	0.000	0.000	0.114	6.249	58582	12.4	3.821	65	5.4	35.2	0.1	0.001	15310	15102	pg150_o2nofp.cx10a_c8r32
100	15167	0	0.0	11.3	0.6	0.000	0.000	0.113	6.242	57927	12.4	3.819	65	5.4	35.3	0.1	0.001	15165	14958	pg1513_o2nofp.cx10a_c8r32
100	15398	0	0.0	11.3	0.6	0.000	0.000	0.113	6.241	58829	12.4	3.821	64	5.4	35.1	0.1	0.001	15421	15214	pg160_o2nofp.cx10a_c8r32
100	15140	0	0.0	11.3	0.6	0.000	0.000	0.113	6.223	57817	12.4	3.819	66	5.5	35.3	0.1	0.001	15134	14926	pg169_o2nofp.cx10a_c8r32
100	15180	0	0.0	10.4	0.6	0.000	0.000	0.104	6.246	57951	12.4	3.818	65	5.4	35.1	0.1	0.001	15198	14942	pg170_o2nofp.cx10a_c8r32
100	15099	0	0.0	10.4	0.6	0.000	0.000	0.104	6.259	57689	12.4	3.821	66	5.4	35.2	0.1	0.001	15102	14878	pg175_o2nofp.cx10a_c8r32
100	15000	0	0.0	10.5	0.6	0.000	0.000	0.105	6.262	57298	12.4	3.820	66	5.4	34.8	0.1	0.001	15006	14734	pg18beta1_o2nofp.cx10b_c8r32
100	15159	0	0.0	10.5	0.6	0.000	0.000	0.105	6.266	57904	12.4	3.820	65	5.4	35.1	0.1	0.001	15166	14958	pg18beta1_o2nofp.cx10c_c8r32
100	15091	0	0.0	10.5	0.6	0.000	0.000	0.105	6.265	57652	12.4	3.820	66	5.4	34.7	0.1	0.001	15102	14814	pg18beta1_o2nofp.cx10d_c8r32
qp100.L2
qp100.L2: point queries with 100 insert/s per client
Performance metrics for all DBMS, not just the ones listed above. Some are normalized by throughput, others are not. Legend for results is here.
ips	qps	rps	rmbps	wps	wmbps	rpq	rkbpq	wpi	wkbpi	csps	cpups	cspq	cpupq	dbgb1	dbgb2	rss	maxop	p50	p99	tag
100	8571	0	0.0	42.8	1.4	0.000	0.000	0.428	14.322	33173	12.4	3.870	116	5.4	35.2	0.2	0.010	8575	8495	pg140_o2nofp.cx10a_c8r32
100	8464	0	0.0	42.8	1.4	0.000	0.000	0.428	14.341	32766	12.4	3.871	117	5.4	35.3	0.1	0.010	8463	8399	pg1418_o2nofp.cx10a_c8r32
100	8731	0	0.0	40.7	1.4	0.000	0.000	0.407	14.143	33766	12.4	3.867	114	5.4	35.2	0.1	0.001	8735	8671	pg150_o2nofp.cx10a_c8r32
100	8537	0	0.0	40.7	1.4	0.000	0.000	0.407	14.115	32999	12.4	3.865	116	5.4	35.3	0.1	0.001	8527	8495	pg1513_o2nofp.cx10a_c8r32
100	8640	0	0.0	40.6	1.4	0.000	0.000	0.407	14.123	33414	12.4	3.868	115	5.4	35.1	0.1	0.001	8639	8575	pg160_o2nofp.cx10a_c8r32
100	8587	0	0.0	40.7	1.4	0.000	0.000	0.407	14.135	33204	12.4	3.867	116	5.5	35.3	0.1	0.002	8591	8527	pg169_o2nofp.cx10a_c8r32
100	8564	0	0.0	39.4	1.4	0.000	0.000	0.394	14.107	33091	12.4	3.864	116	5.4	35.1	0.1	0.001	8559	8495	pg170_o2nofp.cx10a_c8r32
100	8524	0	0.0	39.3	1.4	0.000	0.000	0.393	14.169	32959	12.4	3.867	116	5.4	35.2	0.2	0.001	8527	8463	pg175_o2nofp.cx10a_c8r32
100	8486	0	0.0	39.2	1.4	0.000	0.000	0.392	14.103	32792	12.4	3.864	117	5.4	34.8	0.1	0.001	8495	8415	pg18beta1_o2nofp.cx10b_c8r32
100	8531	0	0.0	39.3	1.4	0.000	0.000	0.393	14.121	32983	12.4	3.866	116	5.4	35.1	0.1	0.001	8542	8463	pg18beta1_o2nofp.cx10c_c8r32
100	8496	0	0.0	39.3	1.4	0.000	0.000	0.393	14.122	32849	12.4	3.867	117	5.4	34.7	0.1	0.001	8495	8431	pg18beta1_o2nofp.cx10d_c8r32
qr500.L3
qr500.L3: range queries with 500 insert/s per client
Performance metrics for all DBMS, not just the ones listed above. Some are normalized by throughput, others are not. Legend for results is here.
ips	qps	rps	rmbps	wps	wmbps	rpq	rkbpq	wpi	wkbpi	csps	cpups	cspq	cpupq	dbgb1	dbgb2	rss	maxop	p50	p99	tag
500	14669	0	0.0	52.5	1.8	0.000	0.000	0.105	3.736	56209	13.0	3.832	71	5.4	35.2	0.3	0.031	14622	14046	pg140_o2nofp.cx10a_c8r32
500	14498	0	0.0	52.6	1.8	0.000	0.000	0.105	3.744	55560	13.1	3.832	72	5.4	35.3	0.3	0.007	14462	13902	pg1418_o2nofp.cx10a_c8r32
500	14739	0	0.0	50.4	1.8	0.000	0.000	0.101	3.742	56448	13.1	3.830	71	5.5	35.2	0.3	0.002	14685	14062	pg150_o2nofp.cx10a_c8r32
500	14451	0	0.0	50.2	1.8	0.000	0.000	0.100	3.713	55335	12.9	3.829	71	5.4	35.3	0.3	0.002	14414	13790	pg1513_o2nofp.cx10a_c8r32
500	14727	0	0.0	50.2	1.8	0.000	0.000	0.101	3.721	56425	13.0	3.831	71	5.4	35.1	2.7	0.002	14654	14078	pg160_o2nofp.cx10a_c8r32
500	14616	0	0.0	50.2	1.8	0.000	0.000	0.100	3.692	56002	13.0	3.831	71	5.5	35.3	2.7	0.002	14574	13950	pg169_o2nofp.cx10a_c8r32
500	14602	0	0.0	49.6	1.8	0.000	0.000	0.099	3.712	55882	13.0	3.827	71	5.4	35.2	0.3	0.002	14526	13854	pg170_o2nofp.cx10a_c8r32
500	14502	0	0.0	49.6	1.8	0.000	0.000	0.099	3.749	55534	13.0	3.829	72	5.5	35.2	0.3	0.002	14446	13806	pg175_o2nofp.cx10a_c8r32
500	14315	0	0.0	49.5	1.8	0.000	0.000	0.099	3.669	54784	12.9	3.827	72	5.4	34.8	0.3	0.002	14286	13582	pg18beta1_o2nofp.cx10b_c8r32
500	14610	0	0.0	49.5	1.8	0.000	0.000	0.099	3.680	55939	13.0	3.829	71	5.4	35.1	4.6	0.003	14558	13822	pg18beta1_o2nofp.cx10c_c8r32
500	14524	0	0.0	49.4	1.8	0.000	0.000	0.099	3.729	55585	12.9	3.827	71	5.5	34.8	0.3	0.008	14477	13758	pg18beta1_o2nofp.cx10d_c8r32
qp500.L4
qp500.L4: point queries with 500 insert/s per client
Performance metrics for all DBMS, not just the ones listed above. Some are normalized by throughput, others are not. Legend for results is here.
ips	qps	rps	rmbps	wps	wmbps	rpq	rkbpq	wpi	wkbpi	csps	cpups	cspq	cpupq	dbgb1	dbgb2	rss	maxop	p50	p99	tag
500	8548	0	0.0	30.8	2.3	0.000	0.000	0.062	4.637	33208	12.5	3.885	117	5.4	34.0	0.3	0.002	8543	8479	pg140_o2nofp.cx10a_c8r32
500	8403	0	0.0	31.1	2.3	0.000	0.000	0.062	4.696	32660	12.5	3.887	119	5.5	34.1	0.3	0.002	8399	8335	pg1418_o2nofp.cx10a_c8r32
500	8723	0	0.0	28.7	2.2	0.000	0.000	0.057	4.579	33845	12.4	3.880	114	5.5	34.0	0.3	0.002	8719	8639	pg150_o2nofp.cx10a_c8r32
500	8557	0	0.0	28.7	2.2	0.000	0.000	0.057	4.582	33203	12.4	3.880	116	5.4	34.0	0.3	0.002	8559	8479	pg1513_o2nofp.cx10a_c8r32
500	8606	0	0.0	28.8	2.3	0.000	0.000	0.058	4.623	33392	12.4	3.880	115	5.5	34.0	4.6	0.002	8607	8542	pg160_o2nofp.cx10a_c8r32
500	8538	0	0.0	28.6	2.2	0.000	0.000	0.057	4.578	33152	12.5	3.883	117	5.5	34.1	2.8	0.002	8543	8463	pg169_o2nofp.cx10a_c8r32
500	8529	0	0.0	27.6	2.3	0.000	0.000	0.055	4.645	33092	12.5	3.880	117	5.5	34.1	0.3	0.002	8527	8463	pg170_o2nofp.cx10a_c8r32
500	8534	0	0.0	27.4	2.2	0.000	0.000	0.055	4.598	33103	12.5	3.879	117	5.5	34.0	0.3	0.002	8543	8463	pg175_o2nofp.cx10a_c8r32
500	8465	0	0.0	28.2	2.2	0.000	0.000	0.056	4.597	32828	12.4	3.878	117	5.4	34.0	0.3	0.022	8463	8383	pg18beta1_o2nofp.cx10b_c8r32
500	8524	0	0.0	28.4	2.3	0.000	0.000	0.057	4.639	33051	12.4	3.877	116	5.5	34.0	0.3	0.002	8526	8463	pg18beta1_o2nofp.cx10c_c8r32
500	8513	0	0.0	28.3	2.2	0.000	0.000	0.057	4.571	33002	12.4	3.877	117	5.5	34.1	0.3	0.002	8511	8431	pg18beta1_o2nofp.cx10d_c8r32
qr1000.L5
qr1000.L5: range queries with 1000 insert/s per client
Performance metrics for all DBMS, not just the ones listed above. Some are normalized by throughput, others are not. Legend for results is here.
ips	qps	rps	rmbps	wps	wmbps	rpq	rkbpq	wpi	wkbpi	csps	cpups	cspq	cpupq	dbgb1	dbgb2	rss	maxop	p50	p99	tag
1000	14686	0	0.0	32.9	2.7	0.000	0.000	0.033	2.782	56503	13.4	3.847	73	5.5	32.4	0.3	0.002	14654	14078	pg140_o2nofp.cx10a_c8r32
999	14461	0	0.0	32.8	2.7	0.000	0.000	0.033	2.772	55679	13.3	3.850	74	5.5	32.4	0.3	0.002	14462	13902	pg1418_o2nofp.cx10a_c8r32
1000	14810	0	0.0	30.7	2.7	0.000	0.000	0.031	2.734	56930	13.3	3.844	72	5.5	32.4	1.1	0.002	14766	14126	pg150_o2nofp.cx10a_c8r32
1000	14353	0	0.0	30.9	2.7	0.000	0.000	0.031	2.755	55192	13.3	3.845	74	5.5	32.4	0.3	0.002	14334	13726	pg1513_o2nofp.cx10a_c8r32
1000	14693	0	0.0	30.7	2.7	0.000	0.000	0.031	2.740	56486	13.4	3.844	73	5.5	32.4	3.0	0.002	14670	14030	pg160_o2nofp.cx10a_c8r32
999	14599	0	0.0	30.6	2.7	0.000	0.000	0.031	2.725	56163	13.3	3.847	73	5.5	32.4	2.9	0.002	14606	13934	pg169_o2nofp.cx10a_c8r32
999	14582	0	0.0	30.0	2.7	0.000	0.000	0.030	2.746	56021	13.3	3.842	73	5.5	32.4	0.3	0.002	14574	13853	pg170_o2nofp.cx10a_c8r32
1000	14506	0	0.0	30.1	2.7	0.000	0.000	0.030	2.745	55697	13.3	3.839	73	5.5	32.4	0.3	0.002	14494	13790	pg175_o2nofp.cx10a_c8r32
1000	14313	0	0.0	33.0	2.6	0.000	0.000	0.033	2.713	54963	13.2	3.840	74	5.5	32.4	0.3	0.007	14302	13582	pg18beta1_o2nofp.cx10b_c8r32
1000	14499	0	0.0	33.2	2.6	0.000	0.000	0.033	2.697	55668	13.2	3.839	73	5.5	32.4	0.3	0.003	14478	13678	pg18beta1_o2nofp.cx10c_c8r32
1000	14478	0	0.0	33.7	2.6	0.000	0.000	0.034	2.684	55591	13.3	3.840	73	5.5	32.4	0.3	0.003	14446	13726	pg18beta1_o2nofp.cx10d_c8r32
qp1000.L6
qp1000.L6: point queries with 1000 insert/s per client
Performance metrics for all DBMS, not just the ones listed above. Some are normalized by throughput, others are not. Legend for results is here.
ips	qps	rps	rmbps	wps	wmbps	rpq	rkbpq	wpi	wkbpi	csps	cpups	cspq	cpupq	dbgb1	dbgb2	rss	maxop	p50	p99	tag
1000	8514	0	0.0	33.2	2.7	0.000	0.000	0.033	2.782	33299	13.1	3.911	123	5.5	30.2	0.2	0.002	8511	8431	pg140_o2nofp.cx10a_c8r32
999	8393	0	0.0	33.2	2.7	0.000	0.000	0.033	2.777	32853	13.1	3.914	125	5.5	30.3	5.4	0.002	8399	8319	pg1418_o2nofp.cx10a_c8r32
1000	8693	0	0.0	31.2	2.7	0.000	0.000	0.031	2.759	33944	13.1	3.905	121	5.5	30.2	3.6	0.002	8687	8575	pg150_o2nofp.cx10a_c8r32
1000	8581	0	0.0	31.3	2.7	0.000	0.000	0.031	2.756	33512	13.0	3.905	121	5.5	30.2	4.0	0.002	8575	8495	pg1513_o2nofp.cx10a_c8r32
1000	8625	0	0.0	31.1	2.7	0.000	0.000	0.031	2.759	33679	12.9	3.905	120	5.5	30.2	2.1	0.002	8623	8542	pg160_o2nofp.cx10a_c8r32
999	8583	0	0.0	31.3	2.7	0.000	0.000	0.031	2.758	33540	13.1	3.908	122	5.5	30.3	2.1	0.001	8591	8511	pg169_o2nofp.cx10a_c8r32
999	8575	0	0.0	29.7	2.7	0.000	0.000	0.030	2.751	33439	13.1	3.900	122	5.5	30.3	0.2	0.002	8575	8495	pg170_o2nofp.cx10a_c8r32
1000	8576	0	0.0	29.7	2.7	0.000	0.000	0.030	2.753	33431	13.1	3.898	122	5.5	30.2	0.4	0.002	8575	8495	pg175_o2nofp.cx10a_c8r32
1000	8492	0	0.0	31.0	3.1	0.000	0.000	0.031	3.126	33108	13.1	3.899	123	5.5	30.2	0.3	0.050	8495	8415	pg18beta1_o2nofp.cx10b_c8r32
1000	8534	0	0.0	28.1	2.7	0.000	0.000	0.028	2.733	33271	13.1	3.899	123	5.5	30.2	0.3	0.002	8527	8463	pg18beta1_o2nofp.cx10c_c8r32
1000	8438	0	0.0	28.1	2.7	0.000	0.000	0.028	2.732	32905	13.1	3.899	124	5.5	30.2	1.5	0.003	8431	8367	pg18beta1_o2nofp.cx10d_c8r32
l.i0
- l.i0: load without secondary indexes
- Legend for results is here.
- Each entry lists the percentage of responses that fit in that bucket (slower than max time for previous bucket, faster than min time for next bucket).
Insert response time histogram
256us	1ms	4ms	16ms	64ms	256ms	1s	4s	16s	gt	max	tag
0.000	99.983	0.016	0.001	0.000	0.000	0.000	0.000	0.000	0.000	0.006	pg140_o2nofp.cx10a_c8r32
0.000	99.981	0.018	0.001	0.000	0.000	0.000	0.000	0.000	0.000	0.006	pg1418_o2nofp.cx10a_c8r32
0.000	99.986	0.014	0.000	0.000	0.000	0.000	0.000	0.000	0.000	0.004	pg150_o2nofp.cx10a_c8r32
0.000	99.987	0.013	0.000	0.000	0.000	0.000	0.000	0.000	0.000	0.002	pg1513_o2nofp.cx10a_c8r32
0.000	99.987	0.013	0.000	0.000	0.000	0.000	0.000	0.000	0.000	0.002	pg160_o2nofp.cx10a_c8r32
0.000	99.987	0.013	0.000	0.000	0.000	0.000	0.000	0.000	0.000	0.002	pg169_o2nofp.cx10a_c8r32
0.000	99.988	0.012	0.000	0.000	0.000	0.000	0.000	0.000	0.000	0.002	pg170_o2nofp.cx10a_c8r32
0.000	99.992	0.007	0.000	0.000	0.000	0.000	0.000	0.000	0.000	0.002	pg175_o2nofp.cx10a_c8r32
0.000	99.993	0.007	0.000	0.000	0.000	0.000	0.000	0.000	0.000	0.002	pg18beta1_o2nofp.cx10b_c8r32
0.000	99.991	0.009	0.000	0.000	0.000	0.000	0.000	0.000	0.000	0.002	pg18beta1_o2nofp.cx10c_c8r32
0.000	99.981	0.019	0.000	0.000	0.000	0.000	0.000	0.000	0.000	0.003	pg18beta1_o2nofp.cx10d_c8r32
l.x
- l.x: create secondary indexes
- Legend for results is here.
- Each entry lists the percentage of responses that fit in that bucket (slower than max time for previous bucket, faster than min time for next bucket).
TODO - determine whether there is data for create index response time
l.i1
- l.i1: continue load after secondary indexes created with 50 inserts per transaction
- Legend for results is here.
- Each entry lists the percentage of responses that fit in that bucket (slower than max time for previous bucket, faster than min time for next bucket).
Insert response time histogram
256us	1ms	4ms	16ms	64ms	256ms	1s	4s	16s	gt	max	tag
0.000	66.457	33.532	0.002	0.009	0.000	0.000	0.000	0.000	0.000	0.050	pg140_o2nofp.cx10a_c8r32
0.000	63.743	36.246	0.003	0.008	0.000	0.000	0.000	0.000	0.000	0.059	pg1418_o2nofp.cx10a_c8r32
0.000	58.452	41.544	0.003	nonzero	0.000	0.000	0.000	0.000	0.000	0.024	pg150_o2nofp.cx10a_c8r32
0.000	57.586	42.412	0.001	nonzero	0.000	0.000	0.000	0.000	0.000	0.029	pg1513_o2nofp.cx10a_c8r32
0.000	56.427	43.569	0.003	nonzero	0.000	0.000	0.000	0.000	0.000	0.027	pg160_o2nofp.cx10a_c8r32
0.000	55.342	44.653	0.004	0.001	0.000	0.000	0.000	0.000	0.000	0.024	pg169_o2nofp.cx10a_c8r32
0.000	62.170	37.828	0.001	0.001	0.000	0.000	0.000	0.000	0.000	0.052	pg170_o2nofp.cx10a_c8r32
0.000	61.381	38.616	0.002	0.001	0.000	0.000	0.000	0.000	0.000	0.037	pg175_o2nofp.cx10a_c8r32
0.000	62.640	37.357	0.002	0.001	0.000	0.000	0.000	0.000	0.000	0.033	pg18beta1_o2nofp.cx10b_c8r32
0.000	62.628	37.368	0.003	0.001	0.000	0.000	0.000	0.000	0.000	0.031	pg18beta1_o2nofp.cx10c_c8r32
0.000	66.225	33.766	0.005	0.005	0.000	0.000	0.000	0.000	0.000	0.031	pg18beta1_o2nofp.cx10d_c8r32
Delete response time histogram
256us	1ms	4ms	16ms	64ms	256ms	1s	4s	16s	gt	max	tag
0.000	29.334	70.640	0.021	0.005	0.000	0.000	0.000	0.000	0.000	0.049	pg140_o2nofp.cx10a_c8r32
0.000	29.985	69.994	0.013	0.007	0.000	0.000	0.000	0.000	0.000	0.059	pg1418_o2nofp.cx10a_c8r32
0.000	29.553	70.430	0.016	0.001	0.000	0.000	0.000	0.000	0.000	0.023	pg150_o2nofp.cx10a_c8r32
0.000	29.776	70.131	0.093	0.001	0.000	0.000	0.000	0.000	0.000	0.040	pg1513_o2nofp.cx10a_c8r32
0.000	29.436	70.515	0.049	nonzero	0.000	0.000	0.000	0.000	0.000	0.026	pg160_o2nofp.cx10a_c8r32
0.000	29.145	70.839	0.016	0.001	0.000	0.000	0.000	0.000	0.000	0.023	pg169_o2nofp.cx10a_c8r32
0.000	27.639	72.136	0.225	0.001	0.000	0.000	0.000	0.000	0.000	0.051	pg170_o2nofp.cx10a_c8r32
0.000	26.239	73.651	0.109	0.001	0.000	0.000	0.000	0.000	0.000	0.037	pg175_o2nofp.cx10a_c8r32
0.000	28.797	69.317	1.885	0.001	0.000	0.000	0.000	0.000	0.000	0.039	pg18beta1_o2nofp.cx10b_c8r32
0.000	27.986	71.999	0.015	0.001	0.000	0.000	0.000	0.000	0.000	0.030	pg18beta1_o2nofp.cx10c_c8r32
0.000	28.538	58.133	13.325	0.003	0.000	0.000	0.000	0.000	0.000	0.030	pg18beta1_o2nofp.cx10d_c8r32
l.i2
- l.i2: continue load after secondary indexes created with 5 inserts per transaction
- Legend for results is here.
- Each entry lists the percentage of responses that fit in that bucket (slower than max time for previous bucket, faster than min time for next bucket).
Insert response time histogram
256us	1ms	4ms	16ms	64ms	256ms	1s	4s	16s	gt	max	tag
73.028	26.972	nonzero	nonzero	nonzero	0.000	0.000	0.000	0.000	0.000	0.038	pg140_o2nofp.cx10a_c8r32
73.926	26.074	nonzero	nonzero	nonzero	0.000	0.000	0.000	0.000	0.000	0.033	pg1418_o2nofp.cx10a_c8r32
73.747	26.253	nonzero	nonzero	nonzero	0.000	0.000	0.000	0.000	0.000	0.028	pg150_o2nofp.cx10a_c8r32
69.934	30.066	nonzero	nonzero	nonzero	0.000	0.000	0.000	0.000	0.000	0.028	pg1513_o2nofp.cx10a_c8r32
69.276	30.724	nonzero	nonzero	nonzero	0.000	0.000	0.000	0.000	0.000	0.025	pg160_o2nofp.cx10a_c8r32
73.382	26.617	nonzero	nonzero	nonzero	0.000	0.000	0.000	0.000	0.000	0.051	pg169_o2nofp.cx10a_c8r32
67.938	32.061	nonzero	nonzero	0.000	0.000	0.000	0.000	0.000	0.000	0.011	pg170_o2nofp.cx10a_c8r32
69.393	30.607	nonzero	nonzero	nonzero	0.000	0.000	0.000	0.000	0.000	0.036	pg175_o2nofp.cx10a_c8r32
63.897	36.103	nonzero	nonzero	nonzero	0.000	0.000	0.000	0.000	0.000	0.021	pg18beta1_o2nofp.cx10b_c8r32
70.842	29.158	nonzero	nonzero	nonzero	0.000	0.000	0.000	0.000	0.000	0.017	pg18beta1_o2nofp.cx10c_c8r32
68.943	31.056	nonzero	nonzero	0.000	0.000	0.000	0.000	0.000	0.000	0.006	pg18beta1_o2nofp.cx10d_c8r32
Delete response time histogram
256us	1ms	4ms	16ms	64ms	256ms	1s	4s	16s	gt	max	tag
1.428	38.264	60.306	0.002	nonzero	0.000	0.000	0.000	0.000	0.000	0.039	pg140_o2nofp.cx10a_c8r32
1.655	34.062	64.282	0.002	nonzero	0.000	0.000	0.000	0.000	0.000	0.033	pg1418_o2nofp.cx10a_c8r32
1.567	31.687	66.744	0.002	nonzero	0.000	0.000	0.000	0.000	0.000	0.028	pg150_o2nofp.cx10a_c8r32
1.382	40.610	58.006	0.002	nonzero	0.000	0.000	0.000	0.000	0.000	0.029	pg1513_o2nofp.cx10a_c8r32
1.469	33.722	64.807	0.002	nonzero	0.000	0.000	0.000	0.000	0.000	0.025	pg160_o2nofp.cx10a_c8r32
1.302	27.643	71.053	0.002	nonzero	0.000	0.000	0.000	0.000	0.000	0.051	pg169_o2nofp.cx10a_c8r32
1.455	38.878	59.667	nonzero	0.000	0.000	0.000	0.000	0.000	0.000	0.009	pg170_o2nofp.cx10a_c8r32
1.436	38.093	60.470	nonzero	nonzero	0.000	0.000	0.000	0.000	0.000	0.036	pg175_o2nofp.cx10a_c8r32
1.300	38.653	59.253	0.794	0.000	0.000	0.000	0.000	0.000	0.000	0.006	pg18beta1_o2nofp.cx10b_c8r32
1.506	39.275	59.219	nonzero	nonzero	0.000	0.000	0.000	0.000	0.000	0.017	pg18beta1_o2nofp.cx10c_c8r32
1.020	40.682	56.109	2.189	0.000	0.000	0.000	0.000	0.000	0.000	0.010	pg18beta1_o2nofp.cx10d_c8r32
qr100.L1
- qr100.L1: range queries with 100 insert/s per client
- Legend for results is here.
- Each entry lists the percentage of responses that fit in that bucket (slower than max time for previous bucket, faster than min time for next bucket).
Query response time histogram
256us	1ms	4ms	16ms	64ms	256ms	1s	4s	16s	gt	max	tag
100.000	nonzero	0.000	nonzero	0.000	0.000	0.000	0.000	0.000	0.000	0.010	pg140_o2nofp.cx10a_c8r32
100.000	nonzero	nonzero	nonzero	0.000	0.000	0.000	0.000	0.000	0.000	0.010	pg1418_o2nofp.cx10a_c8r32
100.000	nonzero	nonzero	0.000	0.000	0.000	0.000	0.000	0.000	0.000	0.001	pg150_o2nofp.cx10a_c8r32
100.000	nonzero	0.000	0.000	0.000	0.000	0.000	0.000	0.000	0.000	0.001	pg1513_o2nofp.cx10a_c8r32
100.000	nonzero	nonzero	0.000	0.000	0.000	0.000	0.000	0.000	0.000	0.001	pg160_o2nofp.cx10a_c8r32
100.000	nonzero	nonzero	0.000	0.000	0.000	0.000	0.000	0.000	0.000	0.001	pg169_o2nofp.cx10a_c8r32
100.000	nonzero	0.000	0.000	0.000	0.000	0.000	0.000	0.000	0.000	0.001	pg170_o2nofp.cx10a_c8r32
100.000	nonzero	0.000	0.000	0.000	0.000	0.000	0.000	0.000	0.000	0.001	pg175_o2nofp.cx10a_c8r32
100.000	nonzero	0.000	0.000	0.000	0.000	0.000	0.000	0.000	0.000	0.001	pg18beta1_o2nofp.cx10b_c8r32
100.000	nonzero	nonzero	0.000	0.000	0.000	0.000	0.000	0.000	0.000	0.001	pg18beta1_o2nofp.cx10c_c8r32
100.000	nonzero	0.000	0.000	0.000	0.000	0.000	0.000	0.000	0.000	0.001	pg18beta1_o2nofp.cx10d_c8r32
Insert response time histogram
256us	1ms	4ms	16ms	64ms	256ms	1s	4s	16s	gt	max	tag
0.000	1.556	98.389	0.056	0.000	0.000	0.000	0.000	0.000	0.000	0.006	pg140_o2nofp.cx10a_c8r32
0.000	1.944	98.000	0.056	0.000	0.000	0.000	0.000	0.000	0.000	0.006	pg1418_o2nofp.cx10a_c8r32
0.000	5.000	94.944	0.056	0.000	0.000	0.000	0.000	0.000	0.000	0.006	pg150_o2nofp.cx10a_c8r32
0.000	3.333	96.639	0.028	0.000	0.000	0.000	0.000	0.000	0.000	0.006	pg1513_o2nofp.cx10a_c8r32
0.000	3.583	96.361	0.056	0.000	0.000	0.000	0.000	0.000	0.000	0.006	pg160_o2nofp.cx10a_c8r32
0.000	5.194	94.778	0.028	0.000	0.000	0.000	0.000	0.000	0.000	0.006	pg169_o2nofp.cx10a_c8r32
0.000	3.778	96.194	0.028	0.000	0.000	0.000	0.000	0.000	0.000	0.006	pg170_o2nofp.cx10a_c8r32
0.000	1.278	98.667	0.056	0.000	0.000	0.000	0.000	0.000	0.000	0.005	pg175_o2nofp.cx10a_c8r32
0.000	4.389	95.583	0.028	0.000	0.000	0.000	0.000	0.000	0.000	0.006	pg18beta1_o2nofp.cx10b_c8r32
0.000	4.444	95.500	0.056	0.000	0.000	0.000	0.000	0.000	0.000	0.006	pg18beta1_o2nofp.cx10c_c8r32
0.000	1.028	98.917	0.056	0.000	0.000	0.000	0.000	0.000	0.000	0.006	pg18beta1_o2nofp.cx10d_c8r32
Delete response time histogram
256us	1ms	4ms	16ms	64ms	256ms	1s	4s	16s	gt	max	tag
0.000	51.833	48.167	0.000	0.000	0.000	0.000	0.000	0.000	0.000	0.002	pg140_o2nofp.cx10a_c8r32
0.000	55.722	44.278	0.000	0.000	0.000	0.000	0.000	0.000	0.000	0.002	pg1418_o2nofp.cx10a_c8r32
0.000	58.222	41.778	0.000	0.000	0.000	0.000	0.000	0.000	0.000	0.002	pg150_o2nofp.cx10a_c8r32
0.000	55.167	44.833	0.000	0.000	0.000	0.000	0.000	0.000	0.000	0.002	pg1513_o2nofp.cx10a_c8r32
0.000	58.556	41.444	0.000	0.000	0.000	0.000	0.000	0.000	0.000	0.002	pg160_o2nofp.cx10a_c8r32
0.000	58.250	41.750	0.000	0.000	0.000	0.000	0.000	0.000	0.000	0.002	pg169_o2nofp.cx10a_c8r32
0.000	55.778	44.222	0.000	0.000	0.000	0.000	0.000	0.000	0.000	0.002	pg170_o2nofp.cx10a_c8r32
0.000	52.472	47.528	0.000	0.000	0.000	0.000	0.000	0.000	0.000	0.002	pg175_o2nofp.cx10a_c8r32
0.000	55.139	44.861	0.000	0.000	0.000	0.000	0.000	0.000	0.000	0.002	pg18beta1_o2nofp.cx10b_c8r32
0.000	50.139	49.861	0.000	0.000	0.000	0.000	0.000	0.000	0.000	0.002	pg18beta1_o2nofp.cx10c_c8r32
0.000	48.000	52.000	0.000	0.000	0.000	0.000	0.000	0.000	0.000	0.002	pg18beta1_o2nofp.cx10d_c8r32
qp100.L2
- qp100.L2: point queries with 100 insert/s per client
- Legend for results is here.
- Each entry lists the percentage of responses that fit in that bucket (slower than max time for previous bucket, faster than min time for next bucket).
Query response time histogram
256us	1ms	4ms	16ms	64ms	256ms	1s	4s	16s	gt	max	tag
99.993	0.007	nonzero	nonzero	0.000	0.000	0.000	0.000	0.000	0.000	0.010	pg140_o2nofp.cx10a_c8r32
99.992	0.008	0.000	nonzero	0.000	0.000	0.000	0.000	0.000	0.000	0.010	pg1418_o2nofp.cx10a_c8r32
99.994	0.006	nonzero	0.000	0.000	0.000	0.000	0.000	0.000	0.000	0.001	pg150_o2nofp.cx10a_c8r32
99.996	0.004	0.000	0.000	0.000	0.000	0.000	0.000	0.000	0.000	0.001	pg1513_o2nofp.cx10a_c8r32
99.997	0.003	0.000	0.000	0.000	0.000	0.000	0.000	0.000	0.000	0.001	pg160_o2nofp.cx10a_c8r32
99.995	0.005	nonzero	0.000	0.000	0.000	0.000	0.000	0.000	0.000	0.002	pg169_o2nofp.cx10a_c8r32
99.993	0.007	nonzero	0.000	0.000	0.000	0.000	0.000	0.000	0.000	0.001	pg170_o2nofp.cx10a_c8r32
99.994	0.006	0.000	0.000	0.000	0.000	0.000	0.000	0.000	0.000	0.001	pg175_o2nofp.cx10a_c8r32
99.995	0.005	0.000	0.000	0.000	0.000	0.000	0.000	0.000	0.000	0.001	pg18beta1_o2nofp.cx10b_c8r32
99.996	0.004	0.000	0.000	0.000	0.000	0.000	0.000	0.000	0.000	0.001	pg18beta1_o2nofp.cx10c_c8r32
99.993	0.007	nonzero	0.000	0.000	0.000	0.000	0.000	0.000	0.000	0.001	pg18beta1_o2nofp.cx10d_c8r32
Insert response time histogram
256us	1ms	4ms	16ms	64ms	256ms	1s	4s	16s	gt	max	tag
0.000	0.000	99.944	0.056	0.000	0.000	0.000	0.000	0.000	0.000	0.006	pg140_o2nofp.cx10a_c8r32
0.000	0.000	99.944	0.056	0.000	0.000	0.000	0.000	0.000	0.000	0.005	pg1418_o2nofp.cx10a_c8r32
0.000	0.000	99.944	0.056	0.000	0.000	0.000	0.000	0.000	0.000	0.009	pg150_o2nofp.cx10a_c8r32
0.000	0.000	99.944	0.056	0.000	0.000	0.000	0.000	0.000	0.000	0.005	pg1513_o2nofp.cx10a_c8r32
0.000	0.000	99.944	0.056	0.000	0.000	0.000	0.000	0.000	0.000	0.005	pg160_o2nofp.cx10a_c8r32
0.000	0.000	99.861	0.139	0.000	0.000	0.000	0.000	0.000	0.000	0.010	pg169_o2nofp.cx10a_c8r32
0.000	0.028	99.917	0.056	0.000	0.000	0.000	0.000	0.000	0.000	0.005	pg170_o2nofp.cx10a_c8r32
0.000	0.000	99.750	0.250	0.000	0.000	0.000	0.000	0.000	0.000	0.010	pg175_o2nofp.cx10a_c8r32
0.000	0.000	99.944	0.056	0.000	0.000	0.000	0.000	0.000	0.000	0.005	pg18beta1_o2nofp.cx10b_c8r32
0.000	0.000	99.972	0.028	0.000	0.000	0.000	0.000	0.000	0.000	0.006	pg18beta1_o2nofp.cx10c_c8r32
0.000	0.000	99.944	0.056	0.000	0.000	0.000	0.000	0.000	0.000	0.005	pg18beta1_o2nofp.cx10d_c8r32
Delete response time histogram
256us	1ms	4ms	16ms	64ms	256ms	1s	4s	16s	gt	max	tag
0.000	20.583	79.389	0.028	0.000	0.000	0.000	0.000	0.000	0.000	0.004	pg140_o2nofp.cx10a_c8r32
0.000	4.861	95.111	0.028	0.000	0.000	0.000	0.000	0.000	0.000	0.004	pg1418_o2nofp.cx10a_c8r32
0.000	14.611	85.361	0.028	0.000	0.000	0.000	0.000	0.000	0.000	0.004	pg150_o2nofp.cx10a_c8r32
0.000	14.778	85.194	0.028	0.000	0.000	0.000	0.000	0.000	0.000	0.004	pg1513_o2nofp.cx10a_c8r32
0.000	23.806	76.167	0.028	0.000	0.000	0.000	0.000	0.000	0.000	0.004	pg160_o2nofp.cx10a_c8r32
0.000	30.056	69.889	0.056	0.000	0.000	0.000	0.000	0.000	0.000	0.010	pg169_o2nofp.cx10a_c8r32
0.000	25.000	75.000	0.000	0.000	0.000	0.000	0.000	0.000	0.000	0.004	pg170_o2nofp.cx10a_c8r32
0.000	14.944	85.028	0.028	0.000	0.000	0.000	0.000	0.000	0.000	0.005	pg175_o2nofp.cx10a_c8r32
0.000	12.611	87.361	0.028	0.000	0.000	0.000	0.000	0.000	0.000	0.005	pg18beta1_o2nofp.cx10b_c8r32
0.000	4.083	95.889	0.028	0.000	0.000	0.000	0.000	0.000	0.000	0.004	pg18beta1_o2nofp.cx10c_c8r32
0.000	19.056	80.917	0.028	0.000	0.000	0.000	0.000	0.000	0.000	0.004	pg18beta1_o2nofp.cx10d_c8r32
qr500.L3
- qr500.L3: range queries with 500 insert/s per client
- Legend for results is here.
- Each entry lists the percentage of responses that fit in that bucket (slower than max time for previous bucket, faster than min time for next bucket).
Query response time histogram
256us	1ms	4ms	16ms	64ms	256ms	1s	4s	16s	gt	max	tag
99.998	0.002	nonzero	0.000	nonzero	0.000	0.000	0.000	0.000	0.000	0.031	pg140_o2nofp.cx10a_c8r32
99.999	0.001	nonzero	nonzero	0.000	0.000	0.000	0.000	0.000	0.000	0.007	pg1418_o2nofp.cx10a_c8r32
99.999	0.001	nonzero	0.000	0.000	0.000	0.000	0.000	0.000	0.000	0.002	pg150_o2nofp.cx10a_c8r32
99.999	0.001	nonzero	0.000	0.000	0.000	0.000	0.000	0.000	0.000	0.002	pg1513_o2nofp.cx10a_c8r32
99.999	0.001	nonzero	0.000	0.000	0.000	0.000	0.000	0.000	0.000	0.002	pg160_o2nofp.cx10a_c8r32
99.999	0.001	nonzero	0.000	0.000	0.000	0.000	0.000	0.000	0.000	0.002	pg169_o2nofp.cx10a_c8r32
99.999	0.001	nonzero	0.000	0.000	0.000	0.000	0.000	0.000	0.000	0.002	pg170_o2nofp.cx10a_c8r32
99.999	0.001	nonzero	0.000	0.000	0.000	0.000	0.000	0.000	0.000	0.002	pg175_o2nofp.cx10a_c8r32
99.999	0.001	nonzero	0.000	0.000	0.000	0.000	0.000	0.000	0.000	0.002	pg18beta1_o2nofp.cx10b_c8r32
99.999	0.001	nonzero	0.000	0.000	0.000	0.000	0.000	0.000	0.000	0.003	pg18beta1_o2nofp.cx10c_c8r32
99.999	0.001	nonzero	nonzero	0.000	0.000	0.000	0.000	0.000	0.000	0.008	pg18beta1_o2nofp.cx10d_c8r32
Insert response time histogram
256us	1ms	4ms	16ms	64ms	256ms	1s	4s	16s	gt	max	tag
0.000	46.067	53.833	0.094	0.006	0.000	0.000	0.000	0.000	0.000	0.036	pg140_o2nofp.cx10a_c8r32
0.000	44.494	55.478	0.028	0.000	0.000	0.000	0.000	0.000	0.000	0.009	pg1418_o2nofp.cx10a_c8r32
0.000	45.728	54.044	0.228	0.000	0.000	0.000	0.000	0.000	0.000	0.016	pg150_o2nofp.cx10a_c8r32
0.000	41.228	58.639	0.133	0.000	0.000	0.000	0.000	0.000	0.000	0.010	pg1513_o2nofp.cx10a_c8r32
0.000	41.422	58.439	0.139	0.000	0.000	0.000	0.000	0.000	0.000	0.010	pg160_o2nofp.cx10a_c8r32
0.000	46.344	53.583	0.072	0.000	0.000	0.000	0.000	0.000	0.000	0.009	pg169_o2nofp.cx10a_c8r32
0.000	49.667	50.194	0.139	0.000	0.000	0.000	0.000	0.000	0.000	0.011	pg170_o2nofp.cx10a_c8r32
0.000	42.294	57.478	0.228	0.000	0.000	0.000	0.000	0.000	0.000	0.011	pg175_o2nofp.cx10a_c8r32
0.000	53.678	46.289	0.033	0.000	0.000	0.000	0.000	0.000	0.000	0.010	pg18beta1_o2nofp.cx10b_c8r32
0.000	56.161	43.811	0.028	0.000	0.000	0.000	0.000	0.000	0.000	0.009	pg18beta1_o2nofp.cx10c_c8r32
0.000	50.967	48.839	0.194	0.000	0.000	0.000	0.000	0.000	0.000	0.010	pg18beta1_o2nofp.cx10d_c8r32
Delete response time histogram
256us	1ms	4ms	16ms	64ms	256ms	1s	4s	16s	gt	max	tag
0.000	27.667	72.272	0.056	0.006	0.000	0.000	0.000	0.000	0.000	0.034	pg140_o2nofp.cx10a_c8r32
0.000	26.133	73.811	0.056	0.000	0.000	0.000	0.000	0.000	0.000	0.010	pg1418_o2nofp.cx10a_c8r32
0.000	23.061	76.833	0.100	0.006	0.000	0.000	0.000	0.000	0.000	0.026	pg150_o2nofp.cx10a_c8r32
0.000	25.339	74.594	0.067	0.000	0.000	0.000	0.000	0.000	0.000	0.010	pg1513_o2nofp.cx10a_c8r32
0.000	25.711	74.211	0.078	0.000	0.000	0.000	0.000	0.000	0.000	0.010	pg160_o2nofp.cx10a_c8r32
0.000	26.167	73.744	0.089	0.000	0.000	0.000	0.000	0.000	0.000	0.010	pg169_o2nofp.cx10a_c8r32
0.000	21.406	77.361	1.233	0.000	0.000	0.000	0.000	0.000	0.000	0.011	pg170_o2nofp.cx10a_c8r32
0.000	21.400	77.417	1.183	0.000	0.000	0.000	0.000	0.000	0.000	0.012	pg175_o2nofp.cx10a_c8r32
0.000	21.939	77.272	0.789	0.000	0.000	0.000	0.000	0.000	0.000	0.013	pg18beta1_o2nofp.cx10b_c8r32
0.000	24.533	74.967	0.500	0.000	0.000	0.000	0.000	0.000	0.000	0.006	pg18beta1_o2nofp.cx10c_c8r32
0.000	22.956	76.617	0.428	0.000	0.000	0.000	0.000	0.000	0.000	0.011	pg18beta1_o2nofp.cx10d_c8r32
qp500.L4
- qp500.L4: point queries with 500 insert/s per client
- Legend for results is here.
- Each entry lists the percentage of responses that fit in that bucket (slower than max time for previous bucket, faster than min time for next bucket).
Query response time histogram
256us	1ms	4ms	16ms	64ms	256ms	1s	4s	16s	gt	max	tag
99.988	0.012	nonzero	0.000	0.000	0.000	0.000	0.000	0.000	0.000	0.002	pg140_o2nofp.cx10a_c8r32
99.987	0.013	nonzero	0.000	0.000	0.000	0.000	0.000	0.000	0.000	0.002	pg1418_o2nofp.cx10a_c8r32
99.990	0.010	nonzero	0.000	0.000	0.000	0.000	0.000	0.000	0.000	0.002	pg150_o2nofp.cx10a_c8r32
99.990	0.010	nonzero	0.000	0.000	0.000	0.000	0.000	0.000	0.000	0.002	pg1513_o2nofp.cx10a_c8r32
99.989	0.011	nonzero	0.000	0.000	0.000	0.000	0.000	0.000	0.000	0.002	pg160_o2nofp.cx10a_c8r32
99.990	0.010	nonzero	0.000	0.000	0.000	0.000	0.000	0.000	0.000	0.002	pg169_o2nofp.cx10a_c8r32
99.991	0.009	nonzero	0.000	0.000	0.000	0.000	0.000	0.000	0.000	0.002	pg170_o2nofp.cx10a_c8r32
99.991	0.009	nonzero	0.000	0.000	0.000	0.000	0.000	0.000	0.000	0.002	pg175_o2nofp.cx10a_c8r32
99.991	0.009	nonzero	0.000	nonzero	0.000	0.000	0.000	0.000	0.000	0.022	pg18beta1_o2nofp.cx10b_c8r32
99.990	0.010	nonzero	0.000	0.000	0.000	0.000	0.000	0.000	0.000	0.002	pg18beta1_o2nofp.cx10c_c8r32
99.991	0.009	nonzero	0.000	0.000	0.000	0.000	0.000	0.000	0.000	0.002	pg18beta1_o2nofp.cx10d_c8r32
Insert response time histogram
256us	1ms	4ms	16ms	64ms	256ms	1s	4s	16s	gt	max	tag
0.000	26.672	73.306	0.022	0.000	0.000	0.000	0.000	0.000	0.000	0.008	pg140_o2nofp.cx10a_c8r32
0.000	26.133	73.778	0.089	0.000	0.000	0.000	0.000	0.000	0.000	0.011	pg1418_o2nofp.cx10a_c8r32
0.000	27.700	72.278	0.022	0.000	0.000	0.000	0.000	0.000	0.000	0.009	pg150_o2nofp.cx10a_c8r32
0.000	26.306	73.683	0.011	0.000	0.000	0.000	0.000	0.000	0.000	0.007	pg1513_o2nofp.cx10a_c8r32
0.000	26.067	73.867	0.067	0.000	0.000	0.000	0.000	0.000	0.000	0.010	pg160_o2nofp.cx10a_c8r32
0.000	24.256	75.739	0.006	0.000	0.000	0.000	0.000	0.000	0.000	0.005	pg169_o2nofp.cx10a_c8r32
0.000	30.206	69.689	0.106	0.000	0.000	0.000	0.000	0.000	0.000	0.010	pg170_o2nofp.cx10a_c8r32
0.000	35.150	64.806	0.044	0.000	0.000	0.000	0.000	0.000	0.000	0.010	pg175_o2nofp.cx10a_c8r32
0.000	30.678	69.233	0.089	0.000	0.000	0.000	0.000	0.000	0.000	0.011	pg18beta1_o2nofp.cx10b_c8r32
0.000	36.544	63.289	0.167	0.000	0.000	0.000	0.000	0.000	0.000	0.011	pg18beta1_o2nofp.cx10c_c8r32
0.000	34.850	65.139	0.011	0.000	0.000	0.000	0.000	0.000	0.000	0.005	pg18beta1_o2nofp.cx10d_c8r32
Delete response time histogram
256us	1ms	4ms	16ms	64ms	256ms	1s	4s	16s	gt	max	tag
0.000	24.500	75.461	0.039	0.000	0.000	0.000	0.000	0.000	0.000	0.005	pg140_o2nofp.cx10a_c8r32
0.000	26.389	73.544	0.067	0.000	0.000	0.000	0.000	0.000	0.000	0.010	pg1418_o2nofp.cx10a_c8r32
0.000	18.550	80.861	0.589	0.000	0.000	0.000	0.000	0.000	0.000	0.007	pg150_o2nofp.cx10a_c8r32
0.000	20.933	79.022	0.044	0.000	0.000	0.000	0.000	0.000	0.000	0.005	pg1513_o2nofp.cx10a_c8r32
0.000	22.506	77.411	0.083	0.000	0.000	0.000	0.000	0.000	0.000	0.005	pg160_o2nofp.cx10a_c8r32
0.000	24.861	75.067	0.072	0.000	0.000	0.000	0.000	0.000	0.000	0.005	pg169_o2nofp.cx10a_c8r32
0.000	21.722	77.078	1.200	0.000	0.000	0.000	0.000	0.000	0.000	0.011	pg170_o2nofp.cx10a_c8r32
0.000	20.233	78.811	0.956	0.000	0.000	0.000	0.000	0.000	0.000	0.005	pg175_o2nofp.cx10a_c8r32
0.000	21.061	78.272	0.667	0.000	0.000	0.000	0.000	0.000	0.000	0.011	pg18beta1_o2nofp.cx10b_c8r32
0.000	20.750	78.694	0.556	0.000	0.000	0.000	0.000	0.000	0.000	0.011	pg18beta1_o2nofp.cx10c_c8r32
0.000	17.978	81.661	0.361	0.000	0.000	0.000	0.000	0.000	0.000	0.006	pg18beta1_o2nofp.cx10d_c8r32
qr1000.L5
- qr1000.L5: range queries with 1000 insert/s per client
- Legend for results is here.
- Each entry lists the percentage of responses that fit in that bucket (slower than max time for previous bucket, faster than min time for next bucket).
Query response time histogram
256us	1ms	4ms	16ms	64ms	256ms	1s	4s	16s	gt	max	tag
99.999	0.001	nonzero	0.000	0.000	0.000	0.000	0.000	0.000	0.000	0.002	pg140_o2nofp.cx10a_c8r32
99.999	0.001	nonzero	0.000	0.000	0.000	0.000	0.000	0.000	0.000	0.002	pg1418_o2nofp.cx10a_c8r32
99.999	0.001	nonzero	0.000	0.000	0.000	0.000	0.000	0.000	0.000	0.002	pg150_o2nofp.cx10a_c8r32
99.999	0.001	nonzero	0.000	0.000	0.000	0.000	0.000	0.000	0.000	0.002	pg1513_o2nofp.cx10a_c8r32
99.999	0.001	nonzero	0.000	0.000	0.000	0.000	0.000	0.000	0.000	0.002	pg160_o2nofp.cx10a_c8r32
99.999	0.001	nonzero	0.000	0.000	0.000	0.000	0.000	0.000	0.000	0.002	pg169_o2nofp.cx10a_c8r32
99.999	0.001	nonzero	0.000	0.000	0.000	0.000	0.000	0.000	0.000	0.002	pg170_o2nofp.cx10a_c8r32
99.999	0.001	nonzero	0.000	0.000	0.000	0.000	0.000	0.000	0.000	0.002	pg175_o2nofp.cx10a_c8r32
99.997	0.003	nonzero	nonzero	0.000	0.000	0.000	0.000	0.000	0.000	0.007	pg18beta1_o2nofp.cx10b_c8r32
99.997	0.003	nonzero	0.000	0.000	0.000	0.000	0.000	0.000	0.000	0.003	pg18beta1_o2nofp.cx10c_c8r32
99.997	0.003	nonzero	0.000	0.000	0.000	0.000	0.000	0.000	0.000	0.003	pg18beta1_o2nofp.cx10d_c8r32
Insert response time histogram
256us	1ms	4ms	16ms	64ms	256ms	1s	4s	16s	gt	max	tag
0.000	64.422	35.558	0.019	0.000	0.000	0.000	0.000	0.000	0.000	0.010	pg140_o2nofp.cx10a_c8r32
0.000	63.242	36.750	0.008	0.000	0.000	0.000	0.000	0.000	0.000	0.005	pg1418_o2nofp.cx10a_c8r32
0.000	62.014	37.975	0.011	0.000	0.000	0.000	0.000	0.000	0.000	0.010	pg150_o2nofp.cx10a_c8r32
0.000	56.847	43.131	0.022	0.000	0.000	0.000	0.000	0.000	0.000	0.010	pg1513_o2nofp.cx10a_c8r32
0.000	61.956	38.036	0.008	0.000	0.000	0.000	0.000	0.000	0.000	0.009	pg160_o2nofp.cx10a_c8r32
0.000	65.069	34.922	0.008	0.000	0.000	0.000	0.000	0.000	0.000	0.007	pg169_o2nofp.cx10a_c8r32
0.000	67.875	32.108	0.017	0.000	0.000	0.000	0.000	0.000	0.000	0.010	pg170_o2nofp.cx10a_c8r32
0.000	66.511	33.478	0.011	0.000	0.000	0.000	0.000	0.000	0.000	0.010	pg175_o2nofp.cx10a_c8r32
0.000	69.519	30.456	0.025	0.000	0.000	0.000	0.000	0.000	0.000	0.010	pg18beta1_o2nofp.cx10b_c8r32
0.000	70.344	29.647	0.008	0.000	0.000	0.000	0.000	0.000	0.000	0.009	pg18beta1_o2nofp.cx10c_c8r32
0.000	69.528	30.469	0.003	0.000	0.000	0.000	0.000	0.000	0.000	0.005	pg18beta1_o2nofp.cx10d_c8r32
Delete response time histogram
256us	1ms	4ms	16ms	64ms	256ms	1s	4s	16s	gt	max	tag
0.000	26.133	73.822	0.044	0.000	0.000	0.000	0.000	0.000	0.000	0.007	pg140_o2nofp.cx10a_c8r32
0.000	24.208	75.783	0.008	0.000	0.000	0.000	0.000	0.000	0.000	0.004	pg1418_o2nofp.cx10a_c8r32
0.000	23.267	73.950	2.783	0.000	0.000	0.000	0.000	0.000	0.000	0.007	pg150_o2nofp.cx10a_c8r32
0.000	24.767	75.214	0.019	0.000	0.000	0.000	0.000	0.000	0.000	0.010	pg1513_o2nofp.cx10a_c8r32
0.000	23.403	76.550	0.047	0.000	0.000	0.000	0.000	0.000	0.000	0.004	pg160_o2nofp.cx10a_c8r32
0.000	26.011	73.944	0.044	0.000	0.000	0.000	0.000	0.000	0.000	0.004	pg169_o2nofp.cx10a_c8r32
0.000	24.314	75.203	0.483	0.000	0.000	0.000	0.000	0.000	0.000	0.005	pg170_o2nofp.cx10a_c8r32
0.000	21.022	78.506	0.472	0.000	0.000	0.000	0.000	0.000	0.000	0.005	pg175_o2nofp.cx10a_c8r32
0.000	22.733	76.831	0.436	0.000	0.000	0.000	0.000	0.000	0.000	0.005	pg18beta1_o2nofp.cx10b_c8r32
0.000	18.953	80.700	0.347	0.000	0.000	0.000	0.000	0.000	0.000	0.005	pg18beta1_o2nofp.cx10c_c8r32
0.000	19.319	80.375	0.306	0.000	0.000	0.000	0.000	0.000	0.000	0.006	pg18beta1_o2nofp.cx10d_c8r32
qp1000.L6
- qp1000.L6: point queries with 1000 insert/s per client
- Legend for results is here.
- Each entry lists the percentage of responses that fit in that bucket (slower than max time for previous bucket, faster than min time for next bucket).
Query response time histogram
256us	1ms	4ms	16ms	64ms	256ms	1s	4s	16s	gt	max	tag
99.985	0.015	nonzero	0.000	0.000	0.000	0.000	0.000	0.000	0.000	0.002	pg140_o2nofp.cx10a_c8r32
99.984	0.016	nonzero	0.000	0.000	0.000	0.000	0.000	0.000	0.000	0.002	pg1418_o2nofp.cx10a_c8r32
99.988	0.012	nonzero	0.000	0.000	0.000	0.000	0.000	0.000	0.000	0.002	pg150_o2nofp.cx10a_c8r32
99.986	0.014	nonzero	0.000	0.000	0.000	0.000	0.000	0.000	0.000	0.002	pg1513_o2nofp.cx10a_c8r32
99.987	0.013	nonzero	0.000	0.000	0.000	0.000	0.000	0.000	0.000	0.002	pg160_o2nofp.cx10a_c8r32
99.986	0.014	nonzero	0.000	0.000	0.000	0.000	0.000	0.000	0.000	0.001	pg169_o2nofp.cx10a_c8r32
99.988	0.012	nonzero	0.000	0.000	0.000	0.000	0.000	0.000	0.000	0.002	pg170_o2nofp.cx10a_c8r32
99.988	0.012	nonzero	0.000	0.000	0.000	0.000	0.000	0.000	0.000	0.002	pg175_o2nofp.cx10a_c8r32
99.987	0.013	nonzero	0.000	nonzero	0.000	0.000	0.000	0.000	0.000	0.050	pg18beta1_o2nofp.cx10b_c8r32
99.988	0.012	nonzero	0.000	0.000	0.000	0.000	0.000	0.000	0.000	0.002	pg18beta1_o2nofp.cx10c_c8r32
99.986	0.014	nonzero	0.000	0.000	0.000	0.000	0.000	0.000	0.000	0.003	pg18beta1_o2nofp.cx10d_c8r32
Insert response time histogram
256us	1ms	4ms	16ms	64ms	256ms	1s	4s	16s	gt	max	tag
0.000	51.261	48.725	0.011	0.003	0.000	0.000	0.000	0.000	0.000	0.026	pg140_o2nofp.cx10a_c8r32
0.000	54.078	45.908	0.011	0.003	0.000	0.000	0.000	0.000	0.000	0.019	pg1418_o2nofp.cx10a_c8r32
0.000	55.156	44.833	0.003	0.008	0.000	0.000	0.000	0.000	0.000	0.021	pg150_o2nofp.cx10a_c8r32
0.000	55.242	44.742	0.006	0.011	0.000	0.000	0.000	0.000	0.000	0.027	pg1513_o2nofp.cx10a_c8r32
0.000	52.933	47.056	0.003	0.008	0.000	0.000	0.000	0.000	0.000	0.022	pg160_o2nofp.cx10a_c8r32
0.000	52.525	47.450	0.019	0.006	0.000	0.000	0.000	0.000	0.000	0.019	pg169_o2nofp.cx10a_c8r32
0.000	60.369	39.614	0.014	0.003	0.000	0.000	0.000	0.000	0.000	0.022	pg170_o2nofp.cx10a_c8r32
0.000	58.842	41.142	0.008	0.008	0.000	0.000	0.000	0.000	0.000	0.023	pg175_o2nofp.cx10a_c8r32
0.000	59.936	40.031	0.025	0.008	0.000	0.000	0.000	0.000	0.000	0.018	pg18beta1_o2nofp.cx10b_c8r32
0.000	53.361	46.625	0.011	0.003	0.000	0.000	0.000	0.000	0.000	0.022	pg18beta1_o2nofp.cx10c_c8r32
0.000	50.136	49.856	0.008	0.000	0.000	0.000	0.000	0.000	0.000	0.010	pg18beta1_o2nofp.cx10d_c8r32
Delete response time histogram
256us	1ms	4ms	16ms	64ms	256ms	1s	4s	16s	gt	max	tag
0.000	31.583	68.392	0.022	0.003	0.000	0.000	0.000	0.000	0.000	0.024	pg140_o2nofp.cx10a_c8r32
0.000	33.767	66.200	0.031	0.003	0.000	0.000	0.000	0.000	0.000	0.017	pg1418_o2nofp.cx10a_c8r32
0.000	32.078	61.300	6.614	0.008	0.000	0.000	0.000	0.000	0.000	0.020	pg150_o2nofp.cx10a_c8r32
0.000	29.256	70.719	0.014	0.011	0.000	0.000	0.000	0.000	0.000	0.023	pg1513_o2nofp.cx10a_c8r32
0.000	31.328	68.611	0.053	0.008	0.000	0.000	0.000	0.000	0.000	0.021	pg160_o2nofp.cx10a_c8r32
0.000	27.992	71.944	0.058	0.006	0.000	0.000	0.000	0.000	0.000	0.018	pg169_o2nofp.cx10a_c8r32
0.000	28.433	71.125	0.439	0.003	0.000	0.000	0.000	0.000	0.000	0.021	pg170_o2nofp.cx10a_c8r32
0.000	29.111	70.411	0.469	0.008	0.000	0.000	0.000	0.000	0.000	0.022	pg175_o2nofp.cx10a_c8r32
0.000	14.969	84.478	0.547	0.006	0.000	0.000	0.000	0.000	0.000	0.017	pg18beta1_o2nofp.cx10b_c8r32
0.000	19.461	80.231	0.306	0.003	0.000	0.000	0.000	0.000	0.000	0.020	pg18beta1_o2nofp.cx10c_c8r32
0.000	25.586	74.133	0.281	0.000	0.000	0.000	0.000	0.000	0.000	0.006	pg18beta1_o2nofp.cx10d_c8r32