Introduction
This is a report for the insert benchmark with 20M docs and 1 client(s). It is generated by scripts (bash, awk, sed) and Tufte might not be impressed. An overview of the insert benchmark is here and a short update is here. Below, by DBMS, I mean DBMS+version.config. An example is my8020.c10b40 where my means MySQL, 8020 is version 8.0.20 and c10b40 is the name for the configuration file.
The test server has 8 AMD cores, 32G RAM and an NVMe SSD. It is described here as the PN53. The benchmark was run with 1 client and there were 1 or 3 connections per client (1 for queries or inserts without rate limits, 1+1 for rate limited inserts+deletes). It uses 1 table. It loads 20M rows per table without secondary indexes, creates 3 secondary indexes per table, then inserts 40m+10m rows per table with a delete per insert to avoid growing the table. It then does 6 read+write tests for 1800s each that do queries as fast as possible with 100,100,500,500,1000,1000 inserts/s and the same for deletes/s per client concurrent with the queries. The database is cached by Postgres. Clients and the DBMS share one server. The per-database configs are in the per-database subdirectories here.
The tested DBMS are:
- pg175_o2nofp.cx10a_c8r32 - Postgres 17.5 with the cx10a_c8r32 config
- pg18beta1_o2nofp.cx10b_c8r32 - Postgres 18 beta1 with the cx10b_c8r32 config that uses io_method=sync
- pg18beta1_o2nofp.cx10c_c8r32 - Postgres 18 beta1 with the cx10b_c8r32 config that uses io_method=worker and io_workers=16
- pg18beta1_o2nofp.cx10d_c8r32 - Postgres 18 beta1 with the cx10b_c8r32 config that uses io_method=io_uring
Contents
- Summary
- l.i0: load without secondary indexes
- l.x: create secondary indexes
- l.i1: continue load after secondary indexes created with 50 inserts per transaction
- l.i2: continue load after secondary indexes created with 5 inserts per transaction
- qr100.L1: range queries with 100 insert/s per client
- qp100.L2: point queries with 100 insert/s per client
- qr500.L3: range queries with 500 insert/s per client
- qp500.L4: point queries with 500 insert/s per client
- qr1000.L5: range queries with 1000 insert/s per client
- qp1000.L6: point queries with 1000 insert/s per client
Summary
The numbers are inserts/s for l.i0, l.i1 and l.i2, indexed docs (or rows) /s for l.x and queries/s for qr100, qp100 thru qr1000, qp1000" The values are the average rate over the entire test for inserts (IPS) and queries (QPS). The range of values for IPS and QPS is split into 3 parts: bottom 25%, middle 50%, top 25%. Values in the bottom 25% have a red background, values in the top 25% have a green background and values in the middle have no color. A gray background is used for values that can be ignored because the DBMS did not sustain the target insert rate. Red backgrounds are not used when the minimum value is within 80% of the max value.
| dbms | l.i0 | l.x | l.i1 | l.i2 | qr100 | qp100 | qr500 | qp500 | qr1000 | qp1000 |
|---|---|---|---|---|---|---|---|---|---|---|
| pg175_o2nofp.cx10a_c8r32 | 143885 | 377360 | 26230 | 3512 | 15099 | 8524 | 14502 | 8534 | 14506 | 8576 |
| pg18beta1_o2nofp.cx10b_c8r32 | 140845 | 377360 | 26420 | 3309 | 15000 | 8486 | 14315 | 8465 | 14313 | 8492 |
| pg18beta1_o2nofp.cx10c_c8r32 | 141844 | 384617 | 26333 | 3565 | 15159 | 8531 | 14610 | 8524 | 14499 | 8534 |
| pg18beta1_o2nofp.cx10d_c8r32 | 139860 | 377360 | 25284 | 3221 | 15091 | 8496 | 14524 | 8513 | 14478 | 8438 |
This table has relative throughput, throughput for the DBMS relative to the DBMS in the first line, using the absolute throughput from the previous table. Values less than 0.95 have a yellow background. Values greater than 1.05 have a blue background.
| dbms | l.i0 | l.x | l.i1 | l.i2 | qr100 | qp100 | qr500 | qp500 | qr1000 | qp1000 |
|---|---|---|---|---|---|---|---|---|---|---|
| pg175_o2nofp.cx10a_c8r32 | 1.00 | 1.00 | 1.00 | 1.00 | 1.00 | 1.00 | 1.00 | 1.00 | 1.00 | 1.00 |
| pg18beta1_o2nofp.cx10b_c8r32 | 0.98 | 1.00 | 1.01 | 0.94 | 0.99 | 1.00 | 0.99 | 0.99 | 0.99 | 0.99 |
| pg18beta1_o2nofp.cx10c_c8r32 | 0.99 | 1.02 | 1.00 | 1.02 | 1.00 | 1.00 | 1.01 | 1.00 | 1.00 | 1.00 |
| pg18beta1_o2nofp.cx10d_c8r32 | 0.97 | 1.00 | 0.96 | 0.92 | 1.00 | 1.00 | 1.00 | 1.00 | 1.00 | 0.98 |
This lists the average rate of inserts/s for the tests that do inserts concurrent with queries. For such tests the query rate is listed in the table above. The read+write tests are setup so that the insert rate should match the target rate every second. Cells that are not at least 95% of the target have a red background to indicate a failure to satisfy the target.
| dbms | qr100.L1 | qp100.L2 | qr500.L3 | qp500.L4 | qr1000.L5 | qp1000.L6 |
|---|---|---|---|---|---|---|
| pg175_o2nofp.cx10a_c8r32 | 100 | 100 | 500 | 500 | 1000 | 1000 |
| pg18beta1_o2nofp.cx10b_c8r32 | 100 | 100 | 500 | 500 | 1000 | 1000 |
| pg18beta1_o2nofp.cx10c_c8r32 | 100 | 100 | 500 | 500 | 1000 | 1000 |
| pg18beta1_o2nofp.cx10d_c8r32 | 100 | 100 | 500 | 500 | 1000 | 1000 |
| target | 100 | 100 | 500 | 500 | 1000 | 1000 |
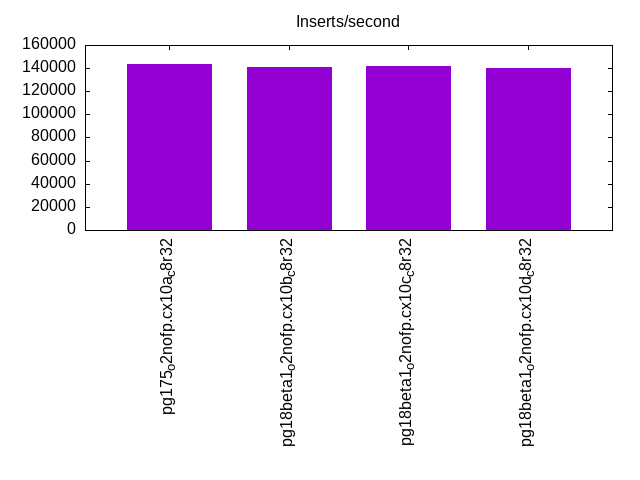
l.i0
l.i0: load without secondary indexes. Graphs for performance per 1-second interval are here.
Average throughput:
Insert response time histogram: each cell has the percentage of responses that take <= the time in the header and max is the max response time in seconds. For the max column values in the top 25% of the range have a red background and in the bottom 25% of the range have a green background. The red background is not used when the min value is within 80% of the max value.
| dbms | 256us | 1ms | 4ms | 16ms | 64ms | 256ms | 1s | 4s | 16s | gt | max |
|---|---|---|---|---|---|---|---|---|---|---|---|
| pg175_o2nofp.cx10a_c8r32 | 99.992 | 0.007 | 0.002 | ||||||||
| pg18beta1_o2nofp.cx10b_c8r32 | 99.993 | 0.007 | 0.002 | ||||||||
| pg18beta1_o2nofp.cx10c_c8r32 | 99.991 | 0.009 | 0.002 | ||||||||
| pg18beta1_o2nofp.cx10d_c8r32 | 99.981 | 0.019 | 0.003 |
Performance metrics for the DBMS listed above. Some are normalized by throughput, others are not. Legend for results is here.
ips	qps	rps	rmbps	wps	wmbps	rpq	rkbpq	wpi	wkbpi	csps	cpups	cspq	cpupq	dbgb1	dbgb2	rss	maxop	p50	p99	tag
143885	0	0	0.0	538.9	61.1	0.000	0.000	0.004	0.435	14748	20.0	0.103	11	1.9	5.2	1.7	0.002	144680	137678	pg175_o2nofp.cx10a_c8r32
140845	0	0	0.0	528.8	60.0	0.000	0.000	0.004	0.436	14502	19.8	0.103	11	1.9	5.2	1.6	0.002	142080	135378	pg18beta1_o2nofp.cx10b_c8r32
141844	0	0	0.0	532.0	60.3	0.000	0.000	0.004	0.436	14552	20.0	0.103	11	1.9	5.2	1.7	0.002	142781	135988	pg18beta1_o2nofp.cx10c_c8r32
139860	0	0	0.0	527.5	59.8	0.000	0.000	0.004	0.438	14392	19.7	0.103	11	1.9	5.2	1.6	0.003	142081	133485	pg18beta1_o2nofp.cx10d_c8r32
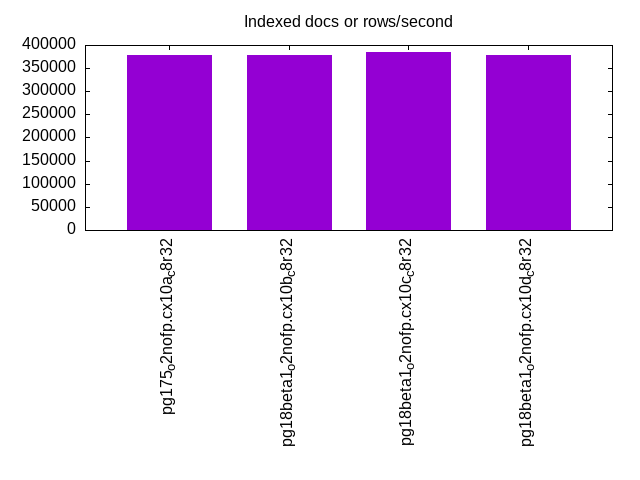
l.x
l.x: create secondary indexes.
Average throughput:
Performance metrics for the DBMS listed above. Some are normalized by throughput, others are not. Legend for results is here.
ips	qps	rps	rmbps	wps	wmbps	rpq	rkbpq	wpi	wkbpi	csps	cpups	cspq	cpupq	dbgb1	dbgb2	rss	maxop	p50	p99	tag
377360	0	0	0.0	580.2	71.0	0.000	0.000	0.002	0.193	1841	11.5	0.005	2	3.9	8.9	2.1	0.002	NA	NA	pg175_o2nofp.cx10a_c8r32
377360	0	0	0.0	607.8	74.3	0.000	0.000	0.002	0.202	1916	11.5	0.005	2	3.9	8.9	2.1	0.002	NA	NA	pg18beta1_o2nofp.cx10b_c8r32
384617	0	0	0.0	606.1	74.2	0.000	0.000	0.002	0.197	1947	11.5	0.005	2	3.9	8.9	2.1	0.002	NA	NA	pg18beta1_o2nofp.cx10c_c8r32
377360	0	0	0.0	603.1	73.8	0.000	0.000	0.002	0.200	1958	11.4	0.005	2	3.9	8.9	2.1	0.002	NA	NA	pg18beta1_o2nofp.cx10d_c8r32
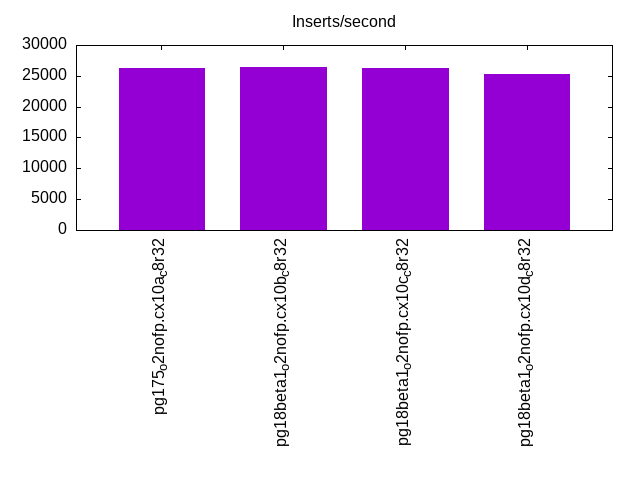
l.i1
l.i1: continue load after secondary indexes created with 50 inserts per transaction. Graphs for performance per 1-second interval are here.
Average throughput:
Insert response time histogram: each cell has the percentage of responses that take <= the time in the header and max is the max response time in seconds. For the max column values in the top 25% of the range have a red background and in the bottom 25% of the range have a green background. The red background is not used when the min value is within 80% of the max value.
| dbms | 256us | 1ms | 4ms | 16ms | 64ms | 256ms | 1s | 4s | 16s | gt | max |
|---|---|---|---|---|---|---|---|---|---|---|---|
| pg175_o2nofp.cx10a_c8r32 | 61.381 | 38.616 | 0.002 | 0.001 | 0.037 | ||||||
| pg18beta1_o2nofp.cx10b_c8r32 | 62.640 | 37.357 | 0.002 | 0.001 | 0.033 | ||||||
| pg18beta1_o2nofp.cx10c_c8r32 | 62.628 | 37.368 | 0.003 | 0.001 | 0.031 | ||||||
| pg18beta1_o2nofp.cx10d_c8r32 | 66.225 | 33.766 | 0.005 | 0.005 | 0.031 |
Delete response time histogram: each cell has the percentage of responses that take <= the time in the header and max is the max response time in seconds. For the max column values in the top 25% of the range have a red background and in the bottom 25% of the range have a green background. The red background is not used when the min value is within 80% of the max value.
| dbms | 256us | 1ms | 4ms | 16ms | 64ms | 256ms | 1s | 4s | 16s | gt | max |
|---|---|---|---|---|---|---|---|---|---|---|---|
| pg175_o2nofp.cx10a_c8r32 | 26.239 | 73.651 | 0.109 | 0.001 | 0.037 | ||||||
| pg18beta1_o2nofp.cx10b_c8r32 | 28.797 | 69.317 | 1.885 | 0.001 | 0.039 | ||||||
| pg18beta1_o2nofp.cx10c_c8r32 | 27.986 | 71.999 | 0.015 | 0.001 | 0.030 | ||||||
| pg18beta1_o2nofp.cx10d_c8r32 | 28.538 | 58.133 | 13.325 | 0.003 | 0.030 |
Performance metrics for the DBMS listed above. Some are normalized by throughput, others are not. Legend for results is here.
ips	qps	rps	rmbps	wps	wmbps	rpq	rkbpq	wpi	wkbpi	csps	cpups	cspq	cpupq	dbgb1	dbgb2	rss	maxop	p50	p99	tag
26230	0	0	0.0	292.2	32.2	0.000	0.000	0.011	1.257	11005	21.9	0.420	67	5.3	32.1	2.4	0.037	20547	13448	pg175_o2nofp.cx10a_c8r32
26420	0	0	0.0	297.1	32.8	0.000	0.000	0.011	1.273	11108	21.9	0.420	66	5.3	32.0	1.5	0.033	20347	10599	pg18beta1_o2nofp.cx10b_c8r32
26333	0	0	0.0	295.7	32.7	0.000	0.000	0.011	1.272	11174	21.9	0.424	67	5.4	32.0	1.5	0.031	20198	14098	pg18beta1_o2nofp.cx10c_c8r32
25284	0	0	0.0	284.7	31.6	0.000	0.000	0.011	1.279	10680	21.7	0.422	69	5.4	32.1	4.5	0.031	18598	9849	pg18beta1_o2nofp.cx10d_c8r32
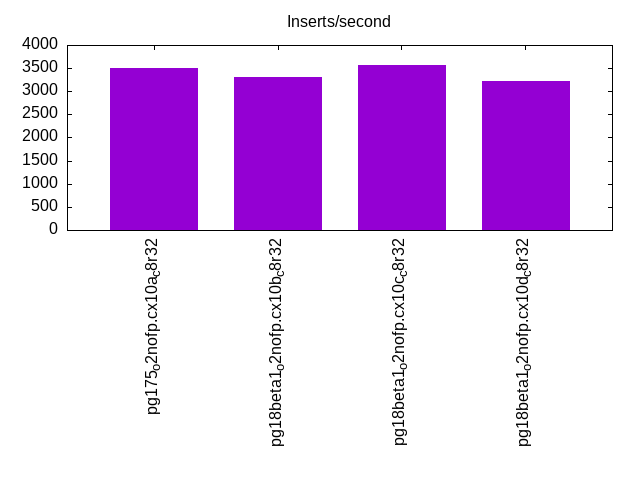
l.i2
l.i2: continue load after secondary indexes created with 5 inserts per transaction. Graphs for performance per 1-second interval are here.
Average throughput:
Insert response time histogram: each cell has the percentage of responses that take <= the time in the header and max is the max response time in seconds. For the max column values in the top 25% of the range have a red background and in the bottom 25% of the range have a green background. The red background is not used when the min value is within 80% of the max value.
| dbms | 256us | 1ms | 4ms | 16ms | 64ms | 256ms | 1s | 4s | 16s | gt | max |
|---|---|---|---|---|---|---|---|---|---|---|---|
| pg175_o2nofp.cx10a_c8r32 | 69.393 | 30.607 | nonzero | nonzero | nonzero | 0.036 | |||||
| pg18beta1_o2nofp.cx10b_c8r32 | 63.897 | 36.103 | nonzero | nonzero | nonzero | 0.021 | |||||
| pg18beta1_o2nofp.cx10c_c8r32 | 70.842 | 29.158 | nonzero | nonzero | nonzero | 0.017 | |||||
| pg18beta1_o2nofp.cx10d_c8r32 | 68.943 | 31.056 | nonzero | nonzero | 0.006 |
Delete response time histogram: each cell has the percentage of responses that take <= the time in the header and max is the max response time in seconds. For the max column values in the top 25% of the range have a red background and in the bottom 25% of the range have a green background. The red background is not used when the min value is within 80% of the max value.
| dbms | 256us | 1ms | 4ms | 16ms | 64ms | 256ms | 1s | 4s | 16s | gt | max |
|---|---|---|---|---|---|---|---|---|---|---|---|
| pg175_o2nofp.cx10a_c8r32 | 1.436 | 38.093 | 60.470 | nonzero | nonzero | 0.036 | |||||
| pg18beta1_o2nofp.cx10b_c8r32 | 1.300 | 38.653 | 59.253 | 0.794 | 0.006 | ||||||
| pg18beta1_o2nofp.cx10c_c8r32 | 1.506 | 39.275 | 59.219 | nonzero | nonzero | 0.017 | |||||
| pg18beta1_o2nofp.cx10d_c8r32 | 1.020 | 40.682 | 56.109 | 2.189 | 0.010 |
Performance metrics for the DBMS listed above. Some are normalized by throughput, others are not. Legend for results is here.
ips	qps	rps	rmbps	wps	wmbps	rpq	rkbpq	wpi	wkbpi	csps	cpups	cspq	cpupq	dbgb1	dbgb2	rss	maxop	p50	p99	tag
3512	0	0	0.0	59.7	6.0	0.000	0.000	0.017	1.758	13692	15.7	3.898	358	5.4	35.2	0.3	0.036	2595	1720	pg175_o2nofp.cx10a_c8r32
3309	0	0	0.0	56.1	5.6	0.000	0.000	0.017	1.743	12952	15.7	3.914	380	5.4	34.8	0.3	0.021	2320	1175	pg18beta1_o2nofp.cx10b_c8r32
3565	0	0	0.0	60.3	6.1	0.000	0.000	0.017	1.759	13897	15.7	3.898	352	5.4	35.1	1.5	0.017	2590	1865	pg18beta1_o2nofp.cx10c_c8r32
3221	0	0	0.0	56.0	5.5	0.000	0.000	0.017	1.760	12590	15.4	3.909	383	5.4	34.7	5.2	0.006	2205	1165	pg18beta1_o2nofp.cx10d_c8r32
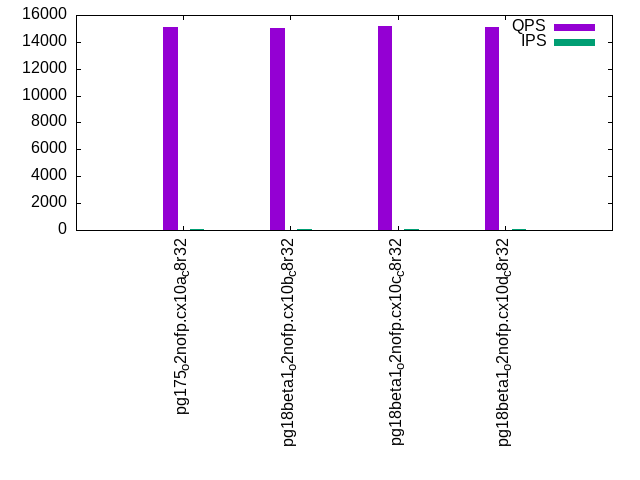
qr100.L1
qr100.L1: range queries with 100 insert/s per client. Graphs for performance per 1-second interval are here.
Average throughput:
Query response time histogram: each cell has the percentage of responses that take <= the time in the header and max is the max response time in seconds. For max values in the top 25% of the range have a red background and in the bottom 25% of the range have a green background. The red background is not used when the min value is within 80% of the max value.
| dbms | 256us | 1ms | 4ms | 16ms | 64ms | 256ms | 1s | 4s | 16s | gt | max |
|---|---|---|---|---|---|---|---|---|---|---|---|
| pg175_o2nofp.cx10a_c8r32 | 100.000 | nonzero | 0.001 | ||||||||
| pg18beta1_o2nofp.cx10b_c8r32 | 100.000 | nonzero | 0.001 | ||||||||
| pg18beta1_o2nofp.cx10c_c8r32 | 100.000 | nonzero | nonzero | 0.001 | |||||||
| pg18beta1_o2nofp.cx10d_c8r32 | 100.000 | nonzero | 0.001 |
Insert response time histogram: each cell has the percentage of responses that take <= the time in the header and max is the max response time in seconds. For max values in the top 25% of the range have a red background and in the bottom 25% of the range have a green background. The red background is not used when the min value is within 80% of the max value.
| dbms | 256us | 1ms | 4ms | 16ms | 64ms | 256ms | 1s | 4s | 16s | gt | max |
|---|---|---|---|---|---|---|---|---|---|---|---|
| pg175_o2nofp.cx10a_c8r32 | 1.278 | 98.667 | 0.056 | 0.005 | |||||||
| pg18beta1_o2nofp.cx10b_c8r32 | 4.389 | 95.583 | 0.028 | 0.006 | |||||||
| pg18beta1_o2nofp.cx10c_c8r32 | 4.444 | 95.500 | 0.056 | 0.006 | |||||||
| pg18beta1_o2nofp.cx10d_c8r32 | 1.028 | 98.917 | 0.056 | 0.006 |
Delete response time histogram: each cell has the percentage of responses that take <= the time in the header and max is the max response time in seconds. For max values in the top 25% of the range have a red background and in the bottom 25% of the range have a green background. The red background is not used when the min value is within 80% of the max value.
| dbms | 256us | 1ms | 4ms | 16ms | 64ms | 256ms | 1s | 4s | 16s | gt | max |
|---|---|---|---|---|---|---|---|---|---|---|---|
| pg175_o2nofp.cx10a_c8r32 | 52.472 | 47.528 | 0.002 | ||||||||
| pg18beta1_o2nofp.cx10b_c8r32 | 55.139 | 44.861 | 0.002 | ||||||||
| pg18beta1_o2nofp.cx10c_c8r32 | 50.139 | 49.861 | 0.002 | ||||||||
| pg18beta1_o2nofp.cx10d_c8r32 | 48.000 | 52.000 | 0.002 |
Performance metrics for the DBMS listed above. Some are normalized by throughput, others are not. Legend for results is here.
ips	qps	rps	rmbps	wps	wmbps	rpq	rkbpq	wpi	wkbpi	csps	cpups	cspq	cpupq	dbgb1	dbgb2	rss	maxop	p50	p99	tag
100	15099	0	0.0	10.4	0.6	0.000	0.000	0.104	6.259	57689	12.4	3.821	66	5.4	35.2	0.1	0.001	15102	14878	pg175_o2nofp.cx10a_c8r32
100	15000	0	0.0	10.5	0.6	0.000	0.000	0.105	6.262	57298	12.4	3.820	66	5.4	34.8	0.1	0.001	15006	14734	pg18beta1_o2nofp.cx10b_c8r32
100	15159	0	0.0	10.5	0.6	0.000	0.000	0.105	6.266	57904	12.4	3.820	65	5.4	35.1	0.1	0.001	15166	14958	pg18beta1_o2nofp.cx10c_c8r32
100	15091	0	0.0	10.5	0.6	0.000	0.000	0.105	6.265	57652	12.4	3.820	66	5.4	34.7	0.1	0.001	15102	14814	pg18beta1_o2nofp.cx10d_c8r32
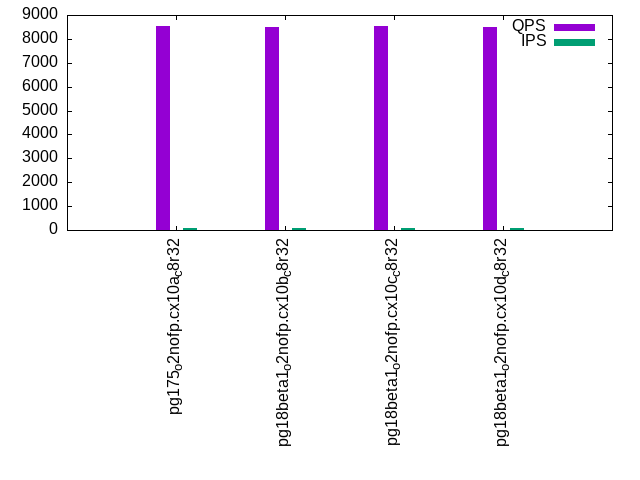
qp100.L2
qp100.L2: point queries with 100 insert/s per client. Graphs for performance per 1-second interval are here.
Average throughput:
Query response time histogram: each cell has the percentage of responses that take <= the time in the header and max is the max response time in seconds. For max values in the top 25% of the range have a red background and in the bottom 25% of the range have a green background. The red background is not used when the min value is within 80% of the max value.
| dbms | 256us | 1ms | 4ms | 16ms | 64ms | 256ms | 1s | 4s | 16s | gt | max |
|---|---|---|---|---|---|---|---|---|---|---|---|
| pg175_o2nofp.cx10a_c8r32 | 99.994 | 0.006 | 0.001 | ||||||||
| pg18beta1_o2nofp.cx10b_c8r32 | 99.995 | 0.005 | 0.001 | ||||||||
| pg18beta1_o2nofp.cx10c_c8r32 | 99.996 | 0.004 | 0.001 | ||||||||
| pg18beta1_o2nofp.cx10d_c8r32 | 99.993 | 0.007 | nonzero | 0.001 |
Insert response time histogram: each cell has the percentage of responses that take <= the time in the header and max is the max response time in seconds. For max values in the top 25% of the range have a red background and in the bottom 25% of the range have a green background. The red background is not used when the min value is within 80% of the max value.
| dbms | 256us | 1ms | 4ms | 16ms | 64ms | 256ms | 1s | 4s | 16s | gt | max |
|---|---|---|---|---|---|---|---|---|---|---|---|
| pg175_o2nofp.cx10a_c8r32 | 99.750 | 0.250 | 0.010 | ||||||||
| pg18beta1_o2nofp.cx10b_c8r32 | 99.944 | 0.056 | 0.005 | ||||||||
| pg18beta1_o2nofp.cx10c_c8r32 | 99.972 | 0.028 | 0.006 | ||||||||
| pg18beta1_o2nofp.cx10d_c8r32 | 99.944 | 0.056 | 0.005 |
Delete response time histogram: each cell has the percentage of responses that take <= the time in the header and max is the max response time in seconds. For max values in the top 25% of the range have a red background and in the bottom 25% of the range have a green background. The red background is not used when the min value is within 80% of the max value.
| dbms | 256us | 1ms | 4ms | 16ms | 64ms | 256ms | 1s | 4s | 16s | gt | max |
|---|---|---|---|---|---|---|---|---|---|---|---|
| pg175_o2nofp.cx10a_c8r32 | 14.944 | 85.028 | 0.028 | 0.005 | |||||||
| pg18beta1_o2nofp.cx10b_c8r32 | 12.611 | 87.361 | 0.028 | 0.005 | |||||||
| pg18beta1_o2nofp.cx10c_c8r32 | 4.083 | 95.889 | 0.028 | 0.004 | |||||||
| pg18beta1_o2nofp.cx10d_c8r32 | 19.056 | 80.917 | 0.028 | 0.004 |
Performance metrics for the DBMS listed above. Some are normalized by throughput, others are not. Legend for results is here.
ips	qps	rps	rmbps	wps	wmbps	rpq	rkbpq	wpi	wkbpi	csps	cpups	cspq	cpupq	dbgb1	dbgb2	rss	maxop	p50	p99	tag
100	8524	0	0.0	39.3	1.4	0.000	0.000	0.393	14.169	32959	12.4	3.867	116	5.4	35.2	0.2	0.001	8527	8463	pg175_o2nofp.cx10a_c8r32
100	8486	0	0.0	39.2	1.4	0.000	0.000	0.392	14.103	32792	12.4	3.864	117	5.4	34.8	0.1	0.001	8495	8415	pg18beta1_o2nofp.cx10b_c8r32
100	8531	0	0.0	39.3	1.4	0.000	0.000	0.393	14.121	32983	12.4	3.866	116	5.4	35.1	0.1	0.001	8542	8463	pg18beta1_o2nofp.cx10c_c8r32
100	8496	0	0.0	39.3	1.4	0.000	0.000	0.393	14.122	32849	12.4	3.867	117	5.4	34.7	0.1	0.001	8495	8431	pg18beta1_o2nofp.cx10d_c8r32
qr500.L3
qr500.L3: range queries with 500 insert/s per client. Graphs for performance per 1-second interval are here.
Average throughput:
Query response time histogram: each cell has the percentage of responses that take <= the time in the header and max is the max response time in seconds. For max values in the top 25% of the range have a red background and in the bottom 25% of the range have a green background. The red background is not used when the min value is within 80% of the max value.
| dbms | 256us | 1ms | 4ms | 16ms | 64ms | 256ms | 1s | 4s | 16s | gt | max |
|---|---|---|---|---|---|---|---|---|---|---|---|
| pg175_o2nofp.cx10a_c8r32 | 99.999 | 0.001 | nonzero | 0.002 | |||||||
| pg18beta1_o2nofp.cx10b_c8r32 | 99.999 | 0.001 | nonzero | 0.002 | |||||||
| pg18beta1_o2nofp.cx10c_c8r32 | 99.999 | 0.001 | nonzero | 0.003 | |||||||
| pg18beta1_o2nofp.cx10d_c8r32 | 99.999 | 0.001 | nonzero | nonzero | 0.008 |
Insert response time histogram: each cell has the percentage of responses that take <= the time in the header and max is the max response time in seconds. For max values in the top 25% of the range have a red background and in the bottom 25% of the range have a green background. The red background is not used when the min value is within 80% of the max value.
| dbms | 256us | 1ms | 4ms | 16ms | 64ms | 256ms | 1s | 4s | 16s | gt | max |
|---|---|---|---|---|---|---|---|---|---|---|---|
| pg175_o2nofp.cx10a_c8r32 | 42.294 | 57.478 | 0.228 | 0.011 | |||||||
| pg18beta1_o2nofp.cx10b_c8r32 | 53.678 | 46.289 | 0.033 | 0.010 | |||||||
| pg18beta1_o2nofp.cx10c_c8r32 | 56.161 | 43.811 | 0.028 | 0.009 | |||||||
| pg18beta1_o2nofp.cx10d_c8r32 | 50.967 | 48.839 | 0.194 | 0.010 |
Delete response time histogram: each cell has the percentage of responses that take <= the time in the header and max is the max response time in seconds. For max values in the top 25% of the range have a red background and in the bottom 25% of the range have a green background. The red background is not used when the min value is within 80% of the max value.
| dbms | 256us | 1ms | 4ms | 16ms | 64ms | 256ms | 1s | 4s | 16s | gt | max |
|---|---|---|---|---|---|---|---|---|---|---|---|
| pg175_o2nofp.cx10a_c8r32 | 21.400 | 77.417 | 1.183 | 0.012 | |||||||
| pg18beta1_o2nofp.cx10b_c8r32 | 21.939 | 77.272 | 0.789 | 0.013 | |||||||
| pg18beta1_o2nofp.cx10c_c8r32 | 24.533 | 74.967 | 0.500 | 0.006 | |||||||
| pg18beta1_o2nofp.cx10d_c8r32 | 22.956 | 76.617 | 0.428 | 0.011 |
Performance metrics for the DBMS listed above. Some are normalized by throughput, others are not. Legend for results is here.
ips	qps	rps	rmbps	wps	wmbps	rpq	rkbpq	wpi	wkbpi	csps	cpups	cspq	cpupq	dbgb1	dbgb2	rss	maxop	p50	p99	tag
500	14502	0	0.0	49.6	1.8	0.000	0.000	0.099	3.749	55534	13.0	3.829	72	5.5	35.2	0.3	0.002	14446	13806	pg175_o2nofp.cx10a_c8r32
500	14315	0	0.0	49.5	1.8	0.000	0.000	0.099	3.669	54784	12.9	3.827	72	5.4	34.8	0.3	0.002	14286	13582	pg18beta1_o2nofp.cx10b_c8r32
500	14610	0	0.0	49.5	1.8	0.000	0.000	0.099	3.680	55939	13.0	3.829	71	5.4	35.1	4.6	0.003	14558	13822	pg18beta1_o2nofp.cx10c_c8r32
500	14524	0	0.0	49.4	1.8	0.000	0.000	0.099	3.729	55585	12.9	3.827	71	5.5	34.8	0.3	0.008	14477	13758	pg18beta1_o2nofp.cx10d_c8r32
qp500.L4
qp500.L4: point queries with 500 insert/s per client. Graphs for performance per 1-second interval are here.
Average throughput:
Query response time histogram: each cell has the percentage of responses that take <= the time in the header and max is the max response time in seconds. For max values in the top 25% of the range have a red background and in the bottom 25% of the range have a green background. The red background is not used when the min value is within 80% of the max value.
| dbms | 256us | 1ms | 4ms | 16ms | 64ms | 256ms | 1s | 4s | 16s | gt | max |
|---|---|---|---|---|---|---|---|---|---|---|---|
| pg175_o2nofp.cx10a_c8r32 | 99.991 | 0.009 | nonzero | 0.002 | |||||||
| pg18beta1_o2nofp.cx10b_c8r32 | 99.991 | 0.009 | nonzero | nonzero | 0.022 | ||||||
| pg18beta1_o2nofp.cx10c_c8r32 | 99.990 | 0.010 | nonzero | 0.002 | |||||||
| pg18beta1_o2nofp.cx10d_c8r32 | 99.991 | 0.009 | nonzero | 0.002 |
Insert response time histogram: each cell has the percentage of responses that take <= the time in the header and max is the max response time in seconds. For max values in the top 25% of the range have a red background and in the bottom 25% of the range have a green background. The red background is not used when the min value is within 80% of the max value.
| dbms | 256us | 1ms | 4ms | 16ms | 64ms | 256ms | 1s | 4s | 16s | gt | max |
|---|---|---|---|---|---|---|---|---|---|---|---|
| pg175_o2nofp.cx10a_c8r32 | 35.150 | 64.806 | 0.044 | 0.010 | |||||||
| pg18beta1_o2nofp.cx10b_c8r32 | 30.678 | 69.233 | 0.089 | 0.011 | |||||||
| pg18beta1_o2nofp.cx10c_c8r32 | 36.544 | 63.289 | 0.167 | 0.011 | |||||||
| pg18beta1_o2nofp.cx10d_c8r32 | 34.850 | 65.139 | 0.011 | 0.005 |
Delete response time histogram: each cell has the percentage of responses that take <= the time in the header and max is the max response time in seconds. For max values in the top 25% of the range have a red background and in the bottom 25% of the range have a green background. The red background is not used when the min value is within 80% of the max value.
| dbms | 256us | 1ms | 4ms | 16ms | 64ms | 256ms | 1s | 4s | 16s | gt | max |
|---|---|---|---|---|---|---|---|---|---|---|---|
| pg175_o2nofp.cx10a_c8r32 | 20.233 | 78.811 | 0.956 | 0.005 | |||||||
| pg18beta1_o2nofp.cx10b_c8r32 | 21.061 | 78.272 | 0.667 | 0.011 | |||||||
| pg18beta1_o2nofp.cx10c_c8r32 | 20.750 | 78.694 | 0.556 | 0.011 | |||||||
| pg18beta1_o2nofp.cx10d_c8r32 | 17.978 | 81.661 | 0.361 | 0.006 |
Performance metrics for the DBMS listed above. Some are normalized by throughput, others are not. Legend for results is here.
ips	qps	rps	rmbps	wps	wmbps	rpq	rkbpq	wpi	wkbpi	csps	cpups	cspq	cpupq	dbgb1	dbgb2	rss	maxop	p50	p99	tag
500	8534	0	0.0	27.4	2.2	0.000	0.000	0.055	4.598	33103	12.5	3.879	117	5.5	34.0	0.3	0.002	8543	8463	pg175_o2nofp.cx10a_c8r32
500	8465	0	0.0	28.2	2.2	0.000	0.000	0.056	4.597	32828	12.4	3.878	117	5.4	34.0	0.3	0.022	8463	8383	pg18beta1_o2nofp.cx10b_c8r32
500	8524	0	0.0	28.4	2.3	0.000	0.000	0.057	4.639	33051	12.4	3.877	116	5.5	34.0	0.3	0.002	8526	8463	pg18beta1_o2nofp.cx10c_c8r32
500	8513	0	0.0	28.3	2.2	0.000	0.000	0.057	4.571	33002	12.4	3.877	117	5.5	34.1	0.3	0.002	8511	8431	pg18beta1_o2nofp.cx10d_c8r32
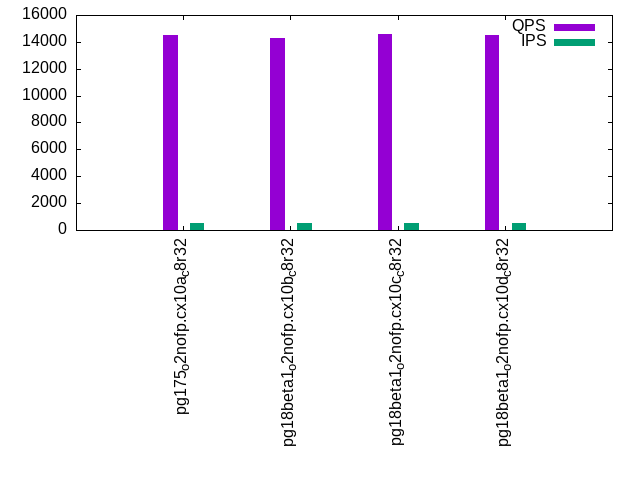
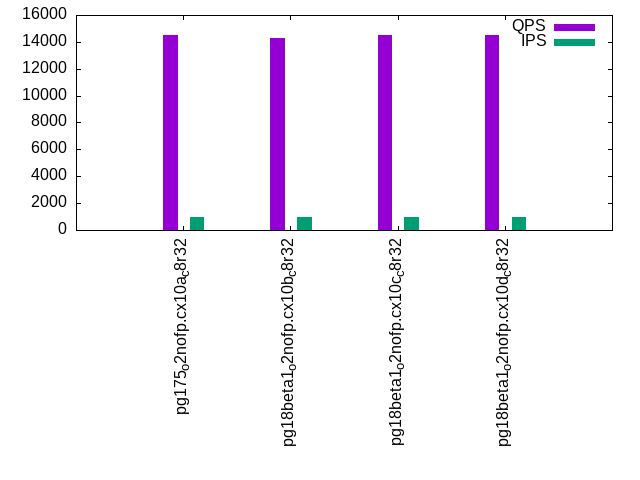
qr1000.L5
qr1000.L5: range queries with 1000 insert/s per client. Graphs for performance per 1-second interval are here.
Average throughput:
Query response time histogram: each cell has the percentage of responses that take <= the time in the header and max is the max response time in seconds. For max values in the top 25% of the range have a red background and in the bottom 25% of the range have a green background. The red background is not used when the min value is within 80% of the max value.
| dbms | 256us | 1ms | 4ms | 16ms | 64ms | 256ms | 1s | 4s | 16s | gt | max |
|---|---|---|---|---|---|---|---|---|---|---|---|
| pg175_o2nofp.cx10a_c8r32 | 99.999 | 0.001 | nonzero | 0.002 | |||||||
| pg18beta1_o2nofp.cx10b_c8r32 | 99.997 | 0.003 | nonzero | nonzero | 0.007 | ||||||
| pg18beta1_o2nofp.cx10c_c8r32 | 99.997 | 0.003 | nonzero | 0.003 | |||||||
| pg18beta1_o2nofp.cx10d_c8r32 | 99.997 | 0.003 | nonzero | 0.003 |
Insert response time histogram: each cell has the percentage of responses that take <= the time in the header and max is the max response time in seconds. For max values in the top 25% of the range have a red background and in the bottom 25% of the range have a green background. The red background is not used when the min value is within 80% of the max value.
| dbms | 256us | 1ms | 4ms | 16ms | 64ms | 256ms | 1s | 4s | 16s | gt | max |
|---|---|---|---|---|---|---|---|---|---|---|---|
| pg175_o2nofp.cx10a_c8r32 | 66.511 | 33.478 | 0.011 | 0.010 | |||||||
| pg18beta1_o2nofp.cx10b_c8r32 | 69.519 | 30.456 | 0.025 | 0.010 | |||||||
| pg18beta1_o2nofp.cx10c_c8r32 | 70.344 | 29.647 | 0.008 | 0.009 | |||||||
| pg18beta1_o2nofp.cx10d_c8r32 | 69.528 | 30.469 | 0.003 | 0.005 |
Delete response time histogram: each cell has the percentage of responses that take <= the time in the header and max is the max response time in seconds. For max values in the top 25% of the range have a red background and in the bottom 25% of the range have a green background. The red background is not used when the min value is within 80% of the max value.
| dbms | 256us | 1ms | 4ms | 16ms | 64ms | 256ms | 1s | 4s | 16s | gt | max |
|---|---|---|---|---|---|---|---|---|---|---|---|
| pg175_o2nofp.cx10a_c8r32 | 21.022 | 78.506 | 0.472 | 0.005 | |||||||
| pg18beta1_o2nofp.cx10b_c8r32 | 22.733 | 76.831 | 0.436 | 0.005 | |||||||
| pg18beta1_o2nofp.cx10c_c8r32 | 18.953 | 80.700 | 0.347 | 0.005 | |||||||
| pg18beta1_o2nofp.cx10d_c8r32 | 19.319 | 80.375 | 0.306 | 0.006 |
Performance metrics for the DBMS listed above. Some are normalized by throughput, others are not. Legend for results is here.
ips	qps	rps	rmbps	wps	wmbps	rpq	rkbpq	wpi	wkbpi	csps	cpups	cspq	cpupq	dbgb1	dbgb2	rss	maxop	p50	p99	tag
1000	14506	0	0.0	30.1	2.7	0.000	0.000	0.030	2.745	55697	13.3	3.839	73	5.5	32.4	0.3	0.002	14494	13790	pg175_o2nofp.cx10a_c8r32
1000	14313	0	0.0	33.0	2.6	0.000	0.000	0.033	2.713	54963	13.2	3.840	74	5.5	32.4	0.3	0.007	14302	13582	pg18beta1_o2nofp.cx10b_c8r32
1000	14499	0	0.0	33.2	2.6	0.000	0.000	0.033	2.697	55668	13.2	3.839	73	5.5	32.4	0.3	0.003	14478	13678	pg18beta1_o2nofp.cx10c_c8r32
1000	14478	0	0.0	33.7	2.6	0.000	0.000	0.034	2.684	55591	13.3	3.840	73	5.5	32.4	0.3	0.003	14446	13726	pg18beta1_o2nofp.cx10d_c8r32
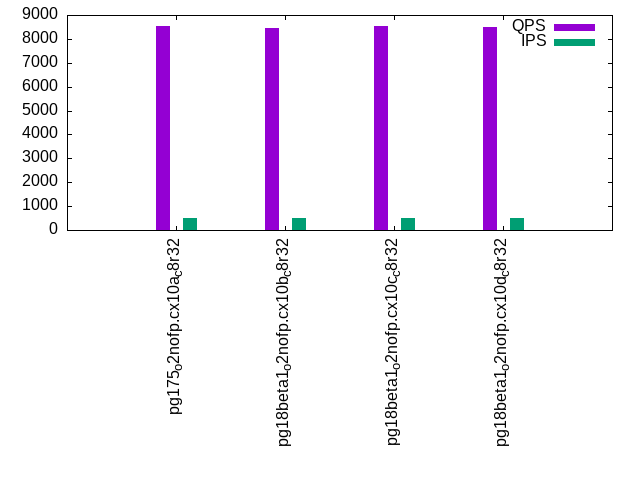
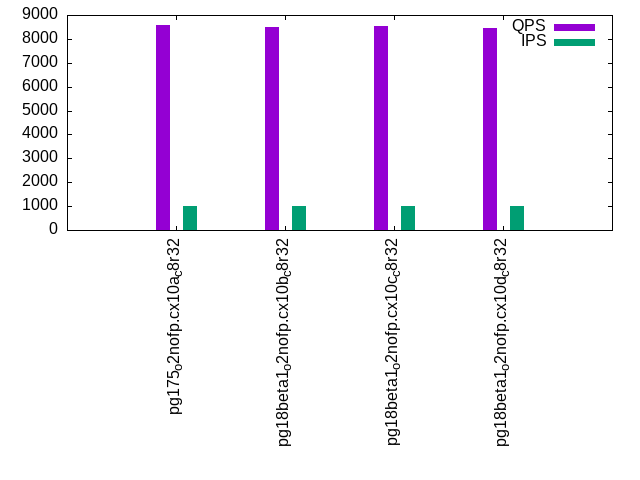
qp1000.L6
qp1000.L6: point queries with 1000 insert/s per client. Graphs for performance per 1-second interval are here.
Average throughput:
Query response time histogram: each cell has the percentage of responses that take <= the time in the header and max is the max response time in seconds. For max values in the top 25% of the range have a red background and in the bottom 25% of the range have a green background. The red background is not used when the min value is within 80% of the max value.
| dbms | 256us | 1ms | 4ms | 16ms | 64ms | 256ms | 1s | 4s | 16s | gt | max |
|---|---|---|---|---|---|---|---|---|---|---|---|
| pg175_o2nofp.cx10a_c8r32 | 99.988 | 0.012 | nonzero | 0.002 | |||||||
| pg18beta1_o2nofp.cx10b_c8r32 | 99.987 | 0.013 | nonzero | nonzero | 0.050 | ||||||
| pg18beta1_o2nofp.cx10c_c8r32 | 99.988 | 0.012 | nonzero | 0.002 | |||||||
| pg18beta1_o2nofp.cx10d_c8r32 | 99.986 | 0.014 | nonzero | 0.003 |
Insert response time histogram: each cell has the percentage of responses that take <= the time in the header and max is the max response time in seconds. For max values in the top 25% of the range have a red background and in the bottom 25% of the range have a green background. The red background is not used when the min value is within 80% of the max value.
| dbms | 256us | 1ms | 4ms | 16ms | 64ms | 256ms | 1s | 4s | 16s | gt | max |
|---|---|---|---|---|---|---|---|---|---|---|---|
| pg175_o2nofp.cx10a_c8r32 | 58.842 | 41.142 | 0.008 | 0.008 | 0.023 | ||||||
| pg18beta1_o2nofp.cx10b_c8r32 | 59.936 | 40.031 | 0.025 | 0.008 | 0.018 | ||||||
| pg18beta1_o2nofp.cx10c_c8r32 | 53.361 | 46.625 | 0.011 | 0.003 | 0.022 | ||||||
| pg18beta1_o2nofp.cx10d_c8r32 | 50.136 | 49.856 | 0.008 | 0.010 |
Delete response time histogram: each cell has the percentage of responses that take <= the time in the header and max is the max response time in seconds. For max values in the top 25% of the range have a red background and in the bottom 25% of the range have a green background. The red background is not used when the min value is within 80% of the max value.
| dbms | 256us | 1ms | 4ms | 16ms | 64ms | 256ms | 1s | 4s | 16s | gt | max |
|---|---|---|---|---|---|---|---|---|---|---|---|
| pg175_o2nofp.cx10a_c8r32 | 29.111 | 70.411 | 0.469 | 0.008 | 0.022 | ||||||
| pg18beta1_o2nofp.cx10b_c8r32 | 14.969 | 84.478 | 0.547 | 0.006 | 0.017 | ||||||
| pg18beta1_o2nofp.cx10c_c8r32 | 19.461 | 80.231 | 0.306 | 0.003 | 0.020 | ||||||
| pg18beta1_o2nofp.cx10d_c8r32 | 25.586 | 74.133 | 0.281 | 0.006 |
Performance metrics for the DBMS listed above. Some are normalized by throughput, others are not. Legend for results is here.
ips	qps	rps	rmbps	wps	wmbps	rpq	rkbpq	wpi	wkbpi	csps	cpups	cspq	cpupq	dbgb1	dbgb2	rss	maxop	p50	p99	tag
1000	8576	0	0.0	29.7	2.7	0.000	0.000	0.030	2.753	33431	13.1	3.898	122	5.5	30.2	0.4	0.002	8575	8495	pg175_o2nofp.cx10a_c8r32
1000	8492	0	0.0	31.0	3.1	0.000	0.000	0.031	3.126	33108	13.1	3.899	123	5.5	30.2	0.3	0.050	8495	8415	pg18beta1_o2nofp.cx10b_c8r32
1000	8534	0	0.0	28.1	2.7	0.000	0.000	0.028	2.733	33271	13.1	3.899	123	5.5	30.2	0.3	0.002	8527	8463	pg18beta1_o2nofp.cx10c_c8r32
1000	8438	0	0.0	28.1	2.7	0.000	0.000	0.028	2.732	32905	13.1	3.899	124	5.5	30.2	1.5	0.003	8431	8367	pg18beta1_o2nofp.cx10d_c8r32
l.i0
l.i0: load without secondary indexes
Performance metrics for all DBMS, not just the ones listed above. Some are normalized by throughput, others are not. Legend for results is here.
ips	qps	rps	rmbps	wps	wmbps	rpq	rkbpq	wpi	wkbpi	csps	cpups	cspq	cpupq	dbgb1	dbgb2	rss	maxop	p50	p99	tag
143885	0	0	0.0	538.9	61.1	0.000	0.000	0.004	0.435	14748	20.0	0.103	11	1.9	5.2	1.7	0.002	144680	137678	pg175_o2nofp.cx10a_c8r32
140845	0	0	0.0	528.8	60.0	0.000	0.000	0.004	0.436	14502	19.8	0.103	11	1.9	5.2	1.6	0.002	142080	135378	pg18beta1_o2nofp.cx10b_c8r32
141844	0	0	0.0	532.0	60.3	0.000	0.000	0.004	0.436	14552	20.0	0.103	11	1.9	5.2	1.7	0.002	142781	135988	pg18beta1_o2nofp.cx10c_c8r32
139860	0	0	0.0	527.5	59.8	0.000	0.000	0.004	0.438	14392	19.7	0.103	11	1.9	5.2	1.6	0.003	142081	133485	pg18beta1_o2nofp.cx10d_c8r32
l.x
l.x: create secondary indexes
Performance metrics for all DBMS, not just the ones listed above. Some are normalized by throughput, others are not. Legend for results is here.
ips	qps	rps	rmbps	wps	wmbps	rpq	rkbpq	wpi	wkbpi	csps	cpups	cspq	cpupq	dbgb1	dbgb2	rss	maxop	p50	p99	tag
377360	0	0	0.0	580.2	71.0	0.000	0.000	0.002	0.193	1841	11.5	0.005	2	3.9	8.9	2.1	0.002	NA	NA	pg175_o2nofp.cx10a_c8r32
377360	0	0	0.0	607.8	74.3	0.000	0.000	0.002	0.202	1916	11.5	0.005	2	3.9	8.9	2.1	0.002	NA	NA	pg18beta1_o2nofp.cx10b_c8r32
384617	0	0	0.0	606.1	74.2	0.000	0.000	0.002	0.197	1947	11.5	0.005	2	3.9	8.9	2.1	0.002	NA	NA	pg18beta1_o2nofp.cx10c_c8r32
377360	0	0	0.0	603.1	73.8	0.000	0.000	0.002	0.200	1958	11.4	0.005	2	3.9	8.9	2.1	0.002	NA	NA	pg18beta1_o2nofp.cx10d_c8r32
l.i1
l.i1: continue load after secondary indexes created with 50 inserts per transaction
Performance metrics for all DBMS, not just the ones listed above. Some are normalized by throughput, others are not. Legend for results is here.
ips	qps	rps	rmbps	wps	wmbps	rpq	rkbpq	wpi	wkbpi	csps	cpups	cspq	cpupq	dbgb1	dbgb2	rss	maxop	p50	p99	tag
26230	0	0	0.0	292.2	32.2	0.000	0.000	0.011	1.257	11005	21.9	0.420	67	5.3	32.1	2.4	0.037	20547	13448	pg175_o2nofp.cx10a_c8r32
26420	0	0	0.0	297.1	32.8	0.000	0.000	0.011	1.273	11108	21.9	0.420	66	5.3	32.0	1.5	0.033	20347	10599	pg18beta1_o2nofp.cx10b_c8r32
26333	0	0	0.0	295.7	32.7	0.000	0.000	0.011	1.272	11174	21.9	0.424	67	5.4	32.0	1.5	0.031	20198	14098	pg18beta1_o2nofp.cx10c_c8r32
25284	0	0	0.0	284.7	31.6	0.000	0.000	0.011	1.279	10680	21.7	0.422	69	5.4	32.1	4.5	0.031	18598	9849	pg18beta1_o2nofp.cx10d_c8r32
l.i2
l.i2: continue load after secondary indexes created with 5 inserts per transaction
Performance metrics for all DBMS, not just the ones listed above. Some are normalized by throughput, others are not. Legend for results is here.
ips	qps	rps	rmbps	wps	wmbps	rpq	rkbpq	wpi	wkbpi	csps	cpups	cspq	cpupq	dbgb1	dbgb2	rss	maxop	p50	p99	tag
3512	0	0	0.0	59.7	6.0	0.000	0.000	0.017	1.758	13692	15.7	3.898	358	5.4	35.2	0.3	0.036	2595	1720	pg175_o2nofp.cx10a_c8r32
3309	0	0	0.0	56.1	5.6	0.000	0.000	0.017	1.743	12952	15.7	3.914	380	5.4	34.8	0.3	0.021	2320	1175	pg18beta1_o2nofp.cx10b_c8r32
3565	0	0	0.0	60.3	6.1	0.000	0.000	0.017	1.759	13897	15.7	3.898	352	5.4	35.1	1.5	0.017	2590	1865	pg18beta1_o2nofp.cx10c_c8r32
3221	0	0	0.0	56.0	5.5	0.000	0.000	0.017	1.760	12590	15.4	3.909	383	5.4	34.7	5.2	0.006	2205	1165	pg18beta1_o2nofp.cx10d_c8r32
qr100.L1
qr100.L1: range queries with 100 insert/s per client
Performance metrics for all DBMS, not just the ones listed above. Some are normalized by throughput, others are not. Legend for results is here.
ips	qps	rps	rmbps	wps	wmbps	rpq	rkbpq	wpi	wkbpi	csps	cpups	cspq	cpupq	dbgb1	dbgb2	rss	maxop	p50	p99	tag
100	15099	0	0.0	10.4	0.6	0.000	0.000	0.104	6.259	57689	12.4	3.821	66	5.4	35.2	0.1	0.001	15102	14878	pg175_o2nofp.cx10a_c8r32
100	15000	0	0.0	10.5	0.6	0.000	0.000	0.105	6.262	57298	12.4	3.820	66	5.4	34.8	0.1	0.001	15006	14734	pg18beta1_o2nofp.cx10b_c8r32
100	15159	0	0.0	10.5	0.6	0.000	0.000	0.105	6.266	57904	12.4	3.820	65	5.4	35.1	0.1	0.001	15166	14958	pg18beta1_o2nofp.cx10c_c8r32
100	15091	0	0.0	10.5	0.6	0.000	0.000	0.105	6.265	57652	12.4	3.820	66	5.4	34.7	0.1	0.001	15102	14814	pg18beta1_o2nofp.cx10d_c8r32
qp100.L2
qp100.L2: point queries with 100 insert/s per client
Performance metrics for all DBMS, not just the ones listed above. Some are normalized by throughput, others are not. Legend for results is here.
ips	qps	rps	rmbps	wps	wmbps	rpq	rkbpq	wpi	wkbpi	csps	cpups	cspq	cpupq	dbgb1	dbgb2	rss	maxop	p50	p99	tag
100	8524	0	0.0	39.3	1.4	0.000	0.000	0.393	14.169	32959	12.4	3.867	116	5.4	35.2	0.2	0.001	8527	8463	pg175_o2nofp.cx10a_c8r32
100	8486	0	0.0	39.2	1.4	0.000	0.000	0.392	14.103	32792	12.4	3.864	117	5.4	34.8	0.1	0.001	8495	8415	pg18beta1_o2nofp.cx10b_c8r32
100	8531	0	0.0	39.3	1.4	0.000	0.000	0.393	14.121	32983	12.4	3.866	116	5.4	35.1	0.1	0.001	8542	8463	pg18beta1_o2nofp.cx10c_c8r32
100	8496	0	0.0	39.3	1.4	0.000	0.000	0.393	14.122	32849	12.4	3.867	117	5.4	34.7	0.1	0.001	8495	8431	pg18beta1_o2nofp.cx10d_c8r32
qr500.L3
qr500.L3: range queries with 500 insert/s per client
Performance metrics for all DBMS, not just the ones listed above. Some are normalized by throughput, others are not. Legend for results is here.
ips	qps	rps	rmbps	wps	wmbps	rpq	rkbpq	wpi	wkbpi	csps	cpups	cspq	cpupq	dbgb1	dbgb2	rss	maxop	p50	p99	tag
500	14502	0	0.0	49.6	1.8	0.000	0.000	0.099	3.749	55534	13.0	3.829	72	5.5	35.2	0.3	0.002	14446	13806	pg175_o2nofp.cx10a_c8r32
500	14315	0	0.0	49.5	1.8	0.000	0.000	0.099	3.669	54784	12.9	3.827	72	5.4	34.8	0.3	0.002	14286	13582	pg18beta1_o2nofp.cx10b_c8r32
500	14610	0	0.0	49.5	1.8	0.000	0.000	0.099	3.680	55939	13.0	3.829	71	5.4	35.1	4.6	0.003	14558	13822	pg18beta1_o2nofp.cx10c_c8r32
500	14524	0	0.0	49.4	1.8	0.000	0.000	0.099	3.729	55585	12.9	3.827	71	5.5	34.8	0.3	0.008	14477	13758	pg18beta1_o2nofp.cx10d_c8r32
qp500.L4
qp500.L4: point queries with 500 insert/s per client
Performance metrics for all DBMS, not just the ones listed above. Some are normalized by throughput, others are not. Legend for results is here.
ips	qps	rps	rmbps	wps	wmbps	rpq	rkbpq	wpi	wkbpi	csps	cpups	cspq	cpupq	dbgb1	dbgb2	rss	maxop	p50	p99	tag
500	8534	0	0.0	27.4	2.2	0.000	0.000	0.055	4.598	33103	12.5	3.879	117	5.5	34.0	0.3	0.002	8543	8463	pg175_o2nofp.cx10a_c8r32
500	8465	0	0.0	28.2	2.2	0.000	0.000	0.056	4.597	32828	12.4	3.878	117	5.4	34.0	0.3	0.022	8463	8383	pg18beta1_o2nofp.cx10b_c8r32
500	8524	0	0.0	28.4	2.3	0.000	0.000	0.057	4.639	33051	12.4	3.877	116	5.5	34.0	0.3	0.002	8526	8463	pg18beta1_o2nofp.cx10c_c8r32
500	8513	0	0.0	28.3	2.2	0.000	0.000	0.057	4.571	33002	12.4	3.877	117	5.5	34.1	0.3	0.002	8511	8431	pg18beta1_o2nofp.cx10d_c8r32
qr1000.L5
qr1000.L5: range queries with 1000 insert/s per client
Performance metrics for all DBMS, not just the ones listed above. Some are normalized by throughput, others are not. Legend for results is here.
ips	qps	rps	rmbps	wps	wmbps	rpq	rkbpq	wpi	wkbpi	csps	cpups	cspq	cpupq	dbgb1	dbgb2	rss	maxop	p50	p99	tag
1000	14506	0	0.0	30.1	2.7	0.000	0.000	0.030	2.745	55697	13.3	3.839	73	5.5	32.4	0.3	0.002	14494	13790	pg175_o2nofp.cx10a_c8r32
1000	14313	0	0.0	33.0	2.6	0.000	0.000	0.033	2.713	54963	13.2	3.840	74	5.5	32.4	0.3	0.007	14302	13582	pg18beta1_o2nofp.cx10b_c8r32
1000	14499	0	0.0	33.2	2.6	0.000	0.000	0.033	2.697	55668	13.2	3.839	73	5.5	32.4	0.3	0.003	14478	13678	pg18beta1_o2nofp.cx10c_c8r32
1000	14478	0	0.0	33.7	2.6	0.000	0.000	0.034	2.684	55591	13.3	3.840	73	5.5	32.4	0.3	0.003	14446	13726	pg18beta1_o2nofp.cx10d_c8r32
qp1000.L6
qp1000.L6: point queries with 1000 insert/s per client
Performance metrics for all DBMS, not just the ones listed above. Some are normalized by throughput, others are not. Legend for results is here.
ips	qps	rps	rmbps	wps	wmbps	rpq	rkbpq	wpi	wkbpi	csps	cpups	cspq	cpupq	dbgb1	dbgb2	rss	maxop	p50	p99	tag
1000	8576	0	0.0	29.7	2.7	0.000	0.000	0.030	2.753	33431	13.1	3.898	122	5.5	30.2	0.4	0.002	8575	8495	pg175_o2nofp.cx10a_c8r32
1000	8492	0	0.0	31.0	3.1	0.000	0.000	0.031	3.126	33108	13.1	3.899	123	5.5	30.2	0.3	0.050	8495	8415	pg18beta1_o2nofp.cx10b_c8r32
1000	8534	0	0.0	28.1	2.7	0.000	0.000	0.028	2.733	33271	13.1	3.899	123	5.5	30.2	0.3	0.002	8527	8463	pg18beta1_o2nofp.cx10c_c8r32
1000	8438	0	0.0	28.1	2.7	0.000	0.000	0.028	2.732	32905	13.1	3.899	124	5.5	30.2	1.5	0.003	8431	8367	pg18beta1_o2nofp.cx10d_c8r32
l.i0
- l.i0: load without secondary indexes
- Legend for results is here.
- Each entry lists the percentage of responses that fit in that bucket (slower than max time for previous bucket, faster than min time for next bucket).
Insert response time histogram
256us	1ms	4ms	16ms	64ms	256ms	1s	4s	16s	gt	max	tag
0.000	99.992	0.007	0.000	0.000	0.000	0.000	0.000	0.000	0.000	0.002	pg175_o2nofp.cx10a_c8r32
0.000	99.993	0.007	0.000	0.000	0.000	0.000	0.000	0.000	0.000	0.002	pg18beta1_o2nofp.cx10b_c8r32
0.000	99.991	0.009	0.000	0.000	0.000	0.000	0.000	0.000	0.000	0.002	pg18beta1_o2nofp.cx10c_c8r32
0.000	99.981	0.019	0.000	0.000	0.000	0.000	0.000	0.000	0.000	0.003	pg18beta1_o2nofp.cx10d_c8r32
l.x
- l.x: create secondary indexes
- Legend for results is here.
- Each entry lists the percentage of responses that fit in that bucket (slower than max time for previous bucket, faster than min time for next bucket).
TODO - determine whether there is data for create index response time
l.i1
- l.i1: continue load after secondary indexes created with 50 inserts per transaction
- Legend for results is here.
- Each entry lists the percentage of responses that fit in that bucket (slower than max time for previous bucket, faster than min time for next bucket).
Insert response time histogram
256us	1ms	4ms	16ms	64ms	256ms	1s	4s	16s	gt	max	tag
0.000	61.381	38.616	0.002	0.001	0.000	0.000	0.000	0.000	0.000	0.037	pg175_o2nofp.cx10a_c8r32
0.000	62.640	37.357	0.002	0.001	0.000	0.000	0.000	0.000	0.000	0.033	pg18beta1_o2nofp.cx10b_c8r32
0.000	62.628	37.368	0.003	0.001	0.000	0.000	0.000	0.000	0.000	0.031	pg18beta1_o2nofp.cx10c_c8r32
0.000	66.225	33.766	0.005	0.005	0.000	0.000	0.000	0.000	0.000	0.031	pg18beta1_o2nofp.cx10d_c8r32
Delete response time histogram
256us	1ms	4ms	16ms	64ms	256ms	1s	4s	16s	gt	max	tag
0.000	26.239	73.651	0.109	0.001	0.000	0.000	0.000	0.000	0.000	0.037	pg175_o2nofp.cx10a_c8r32
0.000	28.797	69.317	1.885	0.001	0.000	0.000	0.000	0.000	0.000	0.039	pg18beta1_o2nofp.cx10b_c8r32
0.000	27.986	71.999	0.015	0.001	0.000	0.000	0.000	0.000	0.000	0.030	pg18beta1_o2nofp.cx10c_c8r32
0.000	28.538	58.133	13.325	0.003	0.000	0.000	0.000	0.000	0.000	0.030	pg18beta1_o2nofp.cx10d_c8r32
l.i2
- l.i2: continue load after secondary indexes created with 5 inserts per transaction
- Legend for results is here.
- Each entry lists the percentage of responses that fit in that bucket (slower than max time for previous bucket, faster than min time for next bucket).
Insert response time histogram
256us	1ms	4ms	16ms	64ms	256ms	1s	4s	16s	gt	max	tag
69.393	30.607	nonzero	nonzero	nonzero	0.000	0.000	0.000	0.000	0.000	0.036	pg175_o2nofp.cx10a_c8r32
63.897	36.103	nonzero	nonzero	nonzero	0.000	0.000	0.000	0.000	0.000	0.021	pg18beta1_o2nofp.cx10b_c8r32
70.842	29.158	nonzero	nonzero	nonzero	0.000	0.000	0.000	0.000	0.000	0.017	pg18beta1_o2nofp.cx10c_c8r32
68.943	31.056	nonzero	nonzero	0.000	0.000	0.000	0.000	0.000	0.000	0.006	pg18beta1_o2nofp.cx10d_c8r32
Delete response time histogram
256us	1ms	4ms	16ms	64ms	256ms	1s	4s	16s	gt	max	tag
1.436	38.093	60.470	nonzero	nonzero	0.000	0.000	0.000	0.000	0.000	0.036	pg175_o2nofp.cx10a_c8r32
1.300	38.653	59.253	0.794	0.000	0.000	0.000	0.000	0.000	0.000	0.006	pg18beta1_o2nofp.cx10b_c8r32
1.506	39.275	59.219	nonzero	nonzero	0.000	0.000	0.000	0.000	0.000	0.017	pg18beta1_o2nofp.cx10c_c8r32
1.020	40.682	56.109	2.189	0.000	0.000	0.000	0.000	0.000	0.000	0.010	pg18beta1_o2nofp.cx10d_c8r32
qr100.L1
- qr100.L1: range queries with 100 insert/s per client
- Legend for results is here.
- Each entry lists the percentage of responses that fit in that bucket (slower than max time for previous bucket, faster than min time for next bucket).
Query response time histogram
256us	1ms	4ms	16ms	64ms	256ms	1s	4s	16s	gt	max	tag
100.000	nonzero	0.000	0.000	0.000	0.000	0.000	0.000	0.000	0.000	0.001	pg175_o2nofp.cx10a_c8r32
100.000	nonzero	0.000	0.000	0.000	0.000	0.000	0.000	0.000	0.000	0.001	pg18beta1_o2nofp.cx10b_c8r32
100.000	nonzero	nonzero	0.000	0.000	0.000	0.000	0.000	0.000	0.000	0.001	pg18beta1_o2nofp.cx10c_c8r32
100.000	nonzero	0.000	0.000	0.000	0.000	0.000	0.000	0.000	0.000	0.001	pg18beta1_o2nofp.cx10d_c8r32
Insert response time histogram
256us	1ms	4ms	16ms	64ms	256ms	1s	4s	16s	gt	max	tag
0.000	1.278	98.667	0.056	0.000	0.000	0.000	0.000	0.000	0.000	0.005	pg175_o2nofp.cx10a_c8r32
0.000	4.389	95.583	0.028	0.000	0.000	0.000	0.000	0.000	0.000	0.006	pg18beta1_o2nofp.cx10b_c8r32
0.000	4.444	95.500	0.056	0.000	0.000	0.000	0.000	0.000	0.000	0.006	pg18beta1_o2nofp.cx10c_c8r32
0.000	1.028	98.917	0.056	0.000	0.000	0.000	0.000	0.000	0.000	0.006	pg18beta1_o2nofp.cx10d_c8r32
Delete response time histogram
256us	1ms	4ms	16ms	64ms	256ms	1s	4s	16s	gt	max	tag
0.000	52.472	47.528	0.000	0.000	0.000	0.000	0.000	0.000	0.000	0.002	pg175_o2nofp.cx10a_c8r32
0.000	55.139	44.861	0.000	0.000	0.000	0.000	0.000	0.000	0.000	0.002	pg18beta1_o2nofp.cx10b_c8r32
0.000	50.139	49.861	0.000	0.000	0.000	0.000	0.000	0.000	0.000	0.002	pg18beta1_o2nofp.cx10c_c8r32
0.000	48.000	52.000	0.000	0.000	0.000	0.000	0.000	0.000	0.000	0.002	pg18beta1_o2nofp.cx10d_c8r32
qp100.L2
- qp100.L2: point queries with 100 insert/s per client
- Legend for results is here.
- Each entry lists the percentage of responses that fit in that bucket (slower than max time for previous bucket, faster than min time for next bucket).
Query response time histogram
256us	1ms	4ms	16ms	64ms	256ms	1s	4s	16s	gt	max	tag
99.994	0.006	0.000	0.000	0.000	0.000	0.000	0.000	0.000	0.000	0.001	pg175_o2nofp.cx10a_c8r32
99.995	0.005	0.000	0.000	0.000	0.000	0.000	0.000	0.000	0.000	0.001	pg18beta1_o2nofp.cx10b_c8r32
99.996	0.004	0.000	0.000	0.000	0.000	0.000	0.000	0.000	0.000	0.001	pg18beta1_o2nofp.cx10c_c8r32
99.993	0.007	nonzero	0.000	0.000	0.000	0.000	0.000	0.000	0.000	0.001	pg18beta1_o2nofp.cx10d_c8r32
Insert response time histogram
256us	1ms	4ms	16ms	64ms	256ms	1s	4s	16s	gt	max	tag
0.000	0.000	99.750	0.250	0.000	0.000	0.000	0.000	0.000	0.000	0.010	pg175_o2nofp.cx10a_c8r32
0.000	0.000	99.944	0.056	0.000	0.000	0.000	0.000	0.000	0.000	0.005	pg18beta1_o2nofp.cx10b_c8r32
0.000	0.000	99.972	0.028	0.000	0.000	0.000	0.000	0.000	0.000	0.006	pg18beta1_o2nofp.cx10c_c8r32
0.000	0.000	99.944	0.056	0.000	0.000	0.000	0.000	0.000	0.000	0.005	pg18beta1_o2nofp.cx10d_c8r32
Delete response time histogram
256us	1ms	4ms	16ms	64ms	256ms	1s	4s	16s	gt	max	tag
0.000	14.944	85.028	0.028	0.000	0.000	0.000	0.000	0.000	0.000	0.005	pg175_o2nofp.cx10a_c8r32
0.000	12.611	87.361	0.028	0.000	0.000	0.000	0.000	0.000	0.000	0.005	pg18beta1_o2nofp.cx10b_c8r32
0.000	4.083	95.889	0.028	0.000	0.000	0.000	0.000	0.000	0.000	0.004	pg18beta1_o2nofp.cx10c_c8r32
0.000	19.056	80.917	0.028	0.000	0.000	0.000	0.000	0.000	0.000	0.004	pg18beta1_o2nofp.cx10d_c8r32
qr500.L3
- qr500.L3: range queries with 500 insert/s per client
- Legend for results is here.
- Each entry lists the percentage of responses that fit in that bucket (slower than max time for previous bucket, faster than min time for next bucket).
Query response time histogram
256us	1ms	4ms	16ms	64ms	256ms	1s	4s	16s	gt	max	tag
99.999	0.001	nonzero	0.000	0.000	0.000	0.000	0.000	0.000	0.000	0.002	pg175_o2nofp.cx10a_c8r32
99.999	0.001	nonzero	0.000	0.000	0.000	0.000	0.000	0.000	0.000	0.002	pg18beta1_o2nofp.cx10b_c8r32
99.999	0.001	nonzero	0.000	0.000	0.000	0.000	0.000	0.000	0.000	0.003	pg18beta1_o2nofp.cx10c_c8r32
99.999	0.001	nonzero	nonzero	0.000	0.000	0.000	0.000	0.000	0.000	0.008	pg18beta1_o2nofp.cx10d_c8r32
Insert response time histogram
256us	1ms	4ms	16ms	64ms	256ms	1s	4s	16s	gt	max	tag
0.000	42.294	57.478	0.228	0.000	0.000	0.000	0.000	0.000	0.000	0.011	pg175_o2nofp.cx10a_c8r32
0.000	53.678	46.289	0.033	0.000	0.000	0.000	0.000	0.000	0.000	0.010	pg18beta1_o2nofp.cx10b_c8r32
0.000	56.161	43.811	0.028	0.000	0.000	0.000	0.000	0.000	0.000	0.009	pg18beta1_o2nofp.cx10c_c8r32
0.000	50.967	48.839	0.194	0.000	0.000	0.000	0.000	0.000	0.000	0.010	pg18beta1_o2nofp.cx10d_c8r32
Delete response time histogram
256us	1ms	4ms	16ms	64ms	256ms	1s	4s	16s	gt	max	tag
0.000	21.400	77.417	1.183	0.000	0.000	0.000	0.000	0.000	0.000	0.012	pg175_o2nofp.cx10a_c8r32
0.000	21.939	77.272	0.789	0.000	0.000	0.000	0.000	0.000	0.000	0.013	pg18beta1_o2nofp.cx10b_c8r32
0.000	24.533	74.967	0.500	0.000	0.000	0.000	0.000	0.000	0.000	0.006	pg18beta1_o2nofp.cx10c_c8r32
0.000	22.956	76.617	0.428	0.000	0.000	0.000	0.000	0.000	0.000	0.011	pg18beta1_o2nofp.cx10d_c8r32
qp500.L4
- qp500.L4: point queries with 500 insert/s per client
- Legend for results is here.
- Each entry lists the percentage of responses that fit in that bucket (slower than max time for previous bucket, faster than min time for next bucket).
Query response time histogram
256us	1ms	4ms	16ms	64ms	256ms	1s	4s	16s	gt	max	tag
99.991	0.009	nonzero	0.000	0.000	0.000	0.000	0.000	0.000	0.000	0.002	pg175_o2nofp.cx10a_c8r32
99.991	0.009	nonzero	0.000	nonzero	0.000	0.000	0.000	0.000	0.000	0.022	pg18beta1_o2nofp.cx10b_c8r32
99.990	0.010	nonzero	0.000	0.000	0.000	0.000	0.000	0.000	0.000	0.002	pg18beta1_o2nofp.cx10c_c8r32
99.991	0.009	nonzero	0.000	0.000	0.000	0.000	0.000	0.000	0.000	0.002	pg18beta1_o2nofp.cx10d_c8r32
Insert response time histogram
256us	1ms	4ms	16ms	64ms	256ms	1s	4s	16s	gt	max	tag
0.000	35.150	64.806	0.044	0.000	0.000	0.000	0.000	0.000	0.000	0.010	pg175_o2nofp.cx10a_c8r32
0.000	30.678	69.233	0.089	0.000	0.000	0.000	0.000	0.000	0.000	0.011	pg18beta1_o2nofp.cx10b_c8r32
0.000	36.544	63.289	0.167	0.000	0.000	0.000	0.000	0.000	0.000	0.011	pg18beta1_o2nofp.cx10c_c8r32
0.000	34.850	65.139	0.011	0.000	0.000	0.000	0.000	0.000	0.000	0.005	pg18beta1_o2nofp.cx10d_c8r32
Delete response time histogram
256us	1ms	4ms	16ms	64ms	256ms	1s	4s	16s	gt	max	tag
0.000	20.233	78.811	0.956	0.000	0.000	0.000	0.000	0.000	0.000	0.005	pg175_o2nofp.cx10a_c8r32
0.000	21.061	78.272	0.667	0.000	0.000	0.000	0.000	0.000	0.000	0.011	pg18beta1_o2nofp.cx10b_c8r32
0.000	20.750	78.694	0.556	0.000	0.000	0.000	0.000	0.000	0.000	0.011	pg18beta1_o2nofp.cx10c_c8r32
0.000	17.978	81.661	0.361	0.000	0.000	0.000	0.000	0.000	0.000	0.006	pg18beta1_o2nofp.cx10d_c8r32
qr1000.L5
- qr1000.L5: range queries with 1000 insert/s per client
- Legend for results is here.
- Each entry lists the percentage of responses that fit in that bucket (slower than max time for previous bucket, faster than min time for next bucket).
Query response time histogram
256us	1ms	4ms	16ms	64ms	256ms	1s	4s	16s	gt	max	tag
99.999	0.001	nonzero	0.000	0.000	0.000	0.000	0.000	0.000	0.000	0.002	pg175_o2nofp.cx10a_c8r32
99.997	0.003	nonzero	nonzero	0.000	0.000	0.000	0.000	0.000	0.000	0.007	pg18beta1_o2nofp.cx10b_c8r32
99.997	0.003	nonzero	0.000	0.000	0.000	0.000	0.000	0.000	0.000	0.003	pg18beta1_o2nofp.cx10c_c8r32
99.997	0.003	nonzero	0.000	0.000	0.000	0.000	0.000	0.000	0.000	0.003	pg18beta1_o2nofp.cx10d_c8r32
Insert response time histogram
256us	1ms	4ms	16ms	64ms	256ms	1s	4s	16s	gt	max	tag
0.000	66.511	33.478	0.011	0.000	0.000	0.000	0.000	0.000	0.000	0.010	pg175_o2nofp.cx10a_c8r32
0.000	69.519	30.456	0.025	0.000	0.000	0.000	0.000	0.000	0.000	0.010	pg18beta1_o2nofp.cx10b_c8r32
0.000	70.344	29.647	0.008	0.000	0.000	0.000	0.000	0.000	0.000	0.009	pg18beta1_o2nofp.cx10c_c8r32
0.000	69.528	30.469	0.003	0.000	0.000	0.000	0.000	0.000	0.000	0.005	pg18beta1_o2nofp.cx10d_c8r32
Delete response time histogram
256us	1ms	4ms	16ms	64ms	256ms	1s	4s	16s	gt	max	tag
0.000	21.022	78.506	0.472	0.000	0.000	0.000	0.000	0.000	0.000	0.005	pg175_o2nofp.cx10a_c8r32
0.000	22.733	76.831	0.436	0.000	0.000	0.000	0.000	0.000	0.000	0.005	pg18beta1_o2nofp.cx10b_c8r32
0.000	18.953	80.700	0.347	0.000	0.000	0.000	0.000	0.000	0.000	0.005	pg18beta1_o2nofp.cx10c_c8r32
0.000	19.319	80.375	0.306	0.000	0.000	0.000	0.000	0.000	0.000	0.006	pg18beta1_o2nofp.cx10d_c8r32
qp1000.L6
- qp1000.L6: point queries with 1000 insert/s per client
- Legend for results is here.
- Each entry lists the percentage of responses that fit in that bucket (slower than max time for previous bucket, faster than min time for next bucket).
Query response time histogram
256us	1ms	4ms	16ms	64ms	256ms	1s	4s	16s	gt	max	tag
99.988	0.012	nonzero	0.000	0.000	0.000	0.000	0.000	0.000	0.000	0.002	pg175_o2nofp.cx10a_c8r32
99.987	0.013	nonzero	0.000	nonzero	0.000	0.000	0.000	0.000	0.000	0.050	pg18beta1_o2nofp.cx10b_c8r32
99.988	0.012	nonzero	0.000	0.000	0.000	0.000	0.000	0.000	0.000	0.002	pg18beta1_o2nofp.cx10c_c8r32
99.986	0.014	nonzero	0.000	0.000	0.000	0.000	0.000	0.000	0.000	0.003	pg18beta1_o2nofp.cx10d_c8r32
Insert response time histogram
256us	1ms	4ms	16ms	64ms	256ms	1s	4s	16s	gt	max	tag
0.000	58.842	41.142	0.008	0.008	0.000	0.000	0.000	0.000	0.000	0.023	pg175_o2nofp.cx10a_c8r32
0.000	59.936	40.031	0.025	0.008	0.000	0.000	0.000	0.000	0.000	0.018	pg18beta1_o2nofp.cx10b_c8r32
0.000	53.361	46.625	0.011	0.003	0.000	0.000	0.000	0.000	0.000	0.022	pg18beta1_o2nofp.cx10c_c8r32
0.000	50.136	49.856	0.008	0.000	0.000	0.000	0.000	0.000	0.000	0.010	pg18beta1_o2nofp.cx10d_c8r32
Delete response time histogram
256us	1ms	4ms	16ms	64ms	256ms	1s	4s	16s	gt	max	tag
0.000	29.111	70.411	0.469	0.008	0.000	0.000	0.000	0.000	0.000	0.022	pg175_o2nofp.cx10a_c8r32
0.000	14.969	84.478	0.547	0.006	0.000	0.000	0.000	0.000	0.000	0.017	pg18beta1_o2nofp.cx10b_c8r32
0.000	19.461	80.231	0.306	0.003	0.000	0.000	0.000	0.000	0.000	0.020	pg18beta1_o2nofp.cx10c_c8r32
0.000	25.586	74.133	0.281	0.000	0.000	0.000	0.000	0.000	0.000	0.006	pg18beta1_o2nofp.cx10d_c8r32