Introduction
This is a report for the insert benchmark with 4000M docs and 20 client(s). It is generated by scripts (bash, awk, sed) and Tufte might not be impressed. An overview of the insert benchmark is here and a short update is here. Below, by DBMS, I mean DBMS+version.config. An example is my8020.c10b40 where my means MySQL, 8020 is version 8.0.20 and c10b40 is the name for the configuration file.
The test server has 48 AMD cores, 128G RAM and RAID 10 with 2 NVMe devices. It is described here. The benchmark was run with 20 clients and there were 1 or 3 connections per client (1 for queries or inserts without rate limits, 1+1 for rate limited inserts+deletes). It uses 20 tables with a table per client. It loads 200M rows per table without secondary indexes, creates 3 secondary indexes per table, then inserts 4m+1m rows per table with a delete per insert to avoid growing the table. It then does 6 read+write tests for 1800s each that do queries as fast as possible with 100,100,500,500,1000,1000 inserts/s and the same for deletes/s per client concurrent with the queries. The database is larger than memory. Clients and the DBMS share one server. The per-database configs are in the per-database subdirectories here.
The tested DBMS are:
- pg174_o2nofp.cx10a_c32r128 - Postgres 17.4 with the cx10a_c32r128 config
- pg18beta1_o2nofp.cx10b_c32r128 - Postgres 18 beta1 with the cx10b_c32r128 config
- pg18beta1_o2nofp.cx10cw4_c32r128 - Postgres 18 beta1 with the cx10cw4_c32r128 config
- pg18beta1_o2nofp.cx10d_c32r128 - Postgres 18 beta1 with the cx10d_c32r128 config
Contents
- Summary
- l.i0: load without secondary indexes
- l.x: create secondary indexes
- l.i1: continue load after secondary indexes created with 50 inserts per transaction
- l.i2: continue load after secondary indexes created with 5 inserts per transaction
- qr100.L1: range queries with 100 insert/s per client
- qp100.L2: point queries with 100 insert/s per client
- qr500.L3: range queries with 500 insert/s per client
- qp500.L4: point queries with 500 insert/s per client
- qr1000.L5: range queries with 1000 insert/s per client
- qp1000.L6: point queries with 1000 insert/s per client
Summary
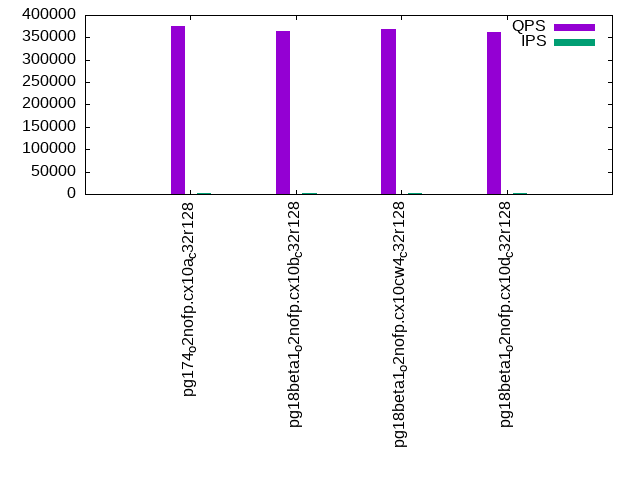
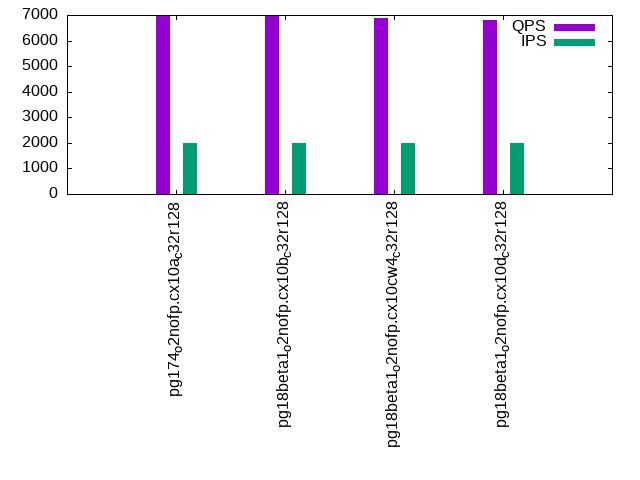
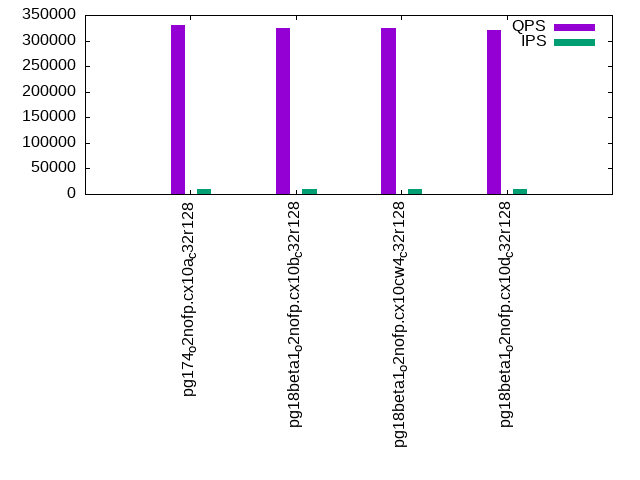
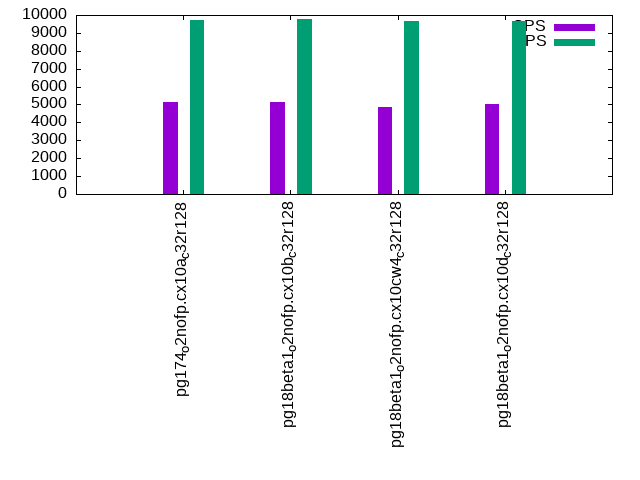
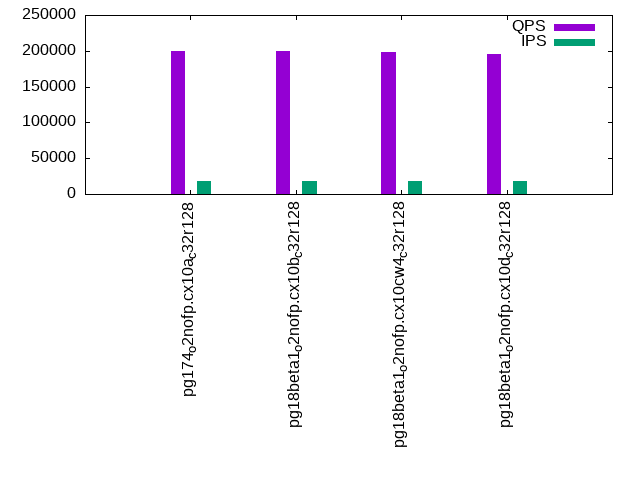
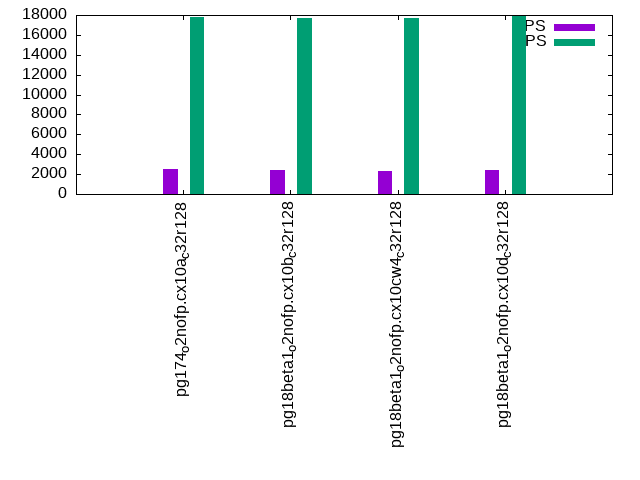
The numbers are inserts/s for l.i0, l.i1 and l.i2, indexed docs (or rows) /s for l.x and queries/s for qr100, qp100 thru qr1000, qp1000" The values are the average rate over the entire test for inserts (IPS) and queries (QPS). The range of values for IPS and QPS is split into 3 parts: bottom 25%, middle 50%, top 25%. Values in the bottom 25% have a red background, values in the top 25% have a green background and values in the middle have no color. A gray background is used for values that can be ignored because the DBMS did not sustain the target insert rate. Red backgrounds are not used when the minimum value is within 80% of the max value.
| dbms | l.i0 | l.x | l.i1 | l.i2 | qr100 | qp100 | qr500 | qp500 | qr1000 | qp1000 |
|---|---|---|---|---|---|---|---|---|---|---|
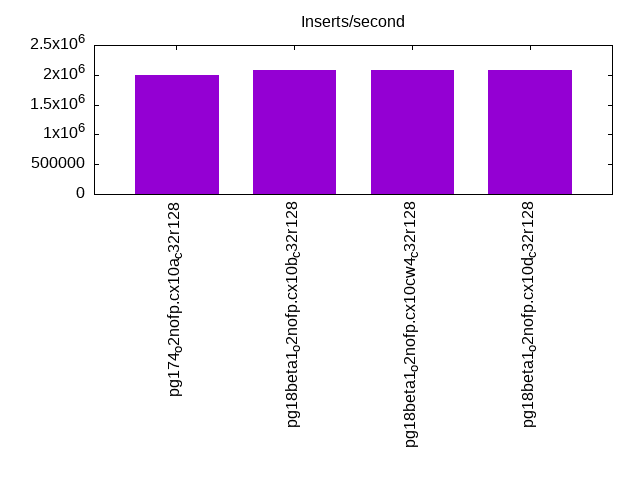
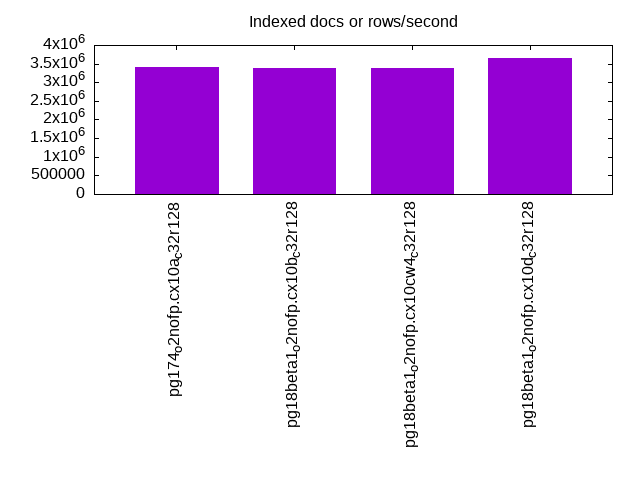
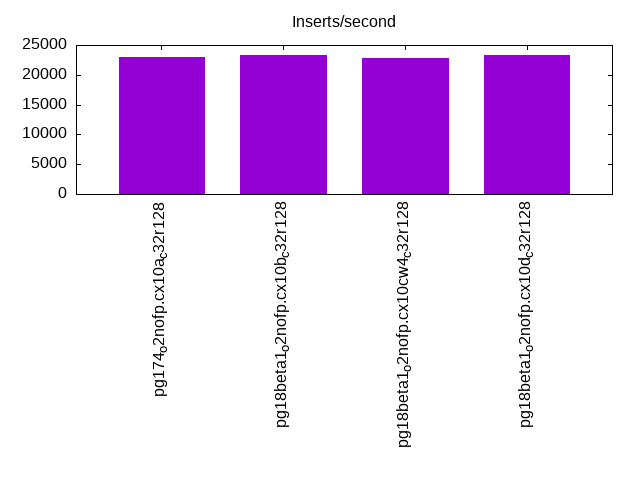
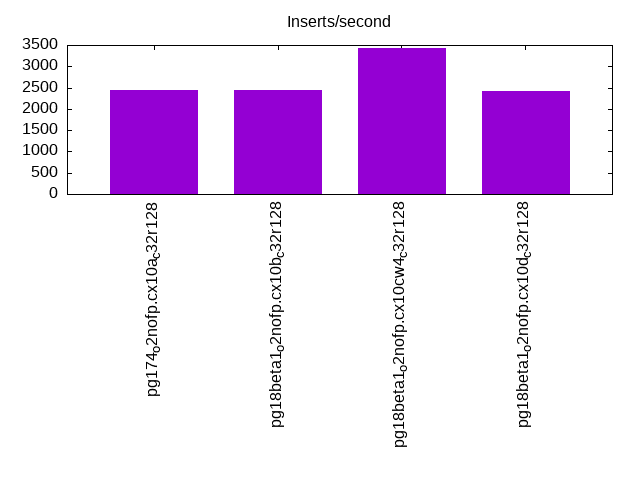
| pg174_o2nofp.cx10a_c32r128 | 2000000 | 3418804 | 23028 | 2454 | 374394 | 6943 | 330556 | 5135 | 199432 | 2480 |
| pg18beta1_o2nofp.cx10b_c32r128 | 2076843 | 3384095 | 23317 | 2444 | 364237 | 6972 | 325536 | 5119 | 200372 | 2406 |
| pg18beta1_o2nofp.cx10cw4_c32r128 | 2088773 | 3372681 | 22851 | 3424 | 367823 | 6899 | 325168 | 4866 | 197728 | 2361 |
| pg18beta1_o2nofp.cx10d_c32r128 | 2077922 | 3652968 | 23399 | 2428 | 362434 | 6798 | 321441 | 5011 | 195264 | 2443 |
This table has relative throughput, throughput for the DBMS relative to the DBMS in the first line, using the absolute throughput from the previous table. Values less than 0.95 have a yellow background. Values greater than 1.05 have a blue background.
| dbms | l.i0 | l.x | l.i1 | l.i2 | qr100 | qp100 | qr500 | qp500 | qr1000 | qp1000 |
|---|---|---|---|---|---|---|---|---|---|---|
| pg174_o2nofp.cx10a_c32r128 | 1.00 | 1.00 | 1.00 | 1.00 | 1.00 | 1.00 | 1.00 | 1.00 | 1.00 | 1.00 |
| pg18beta1_o2nofp.cx10b_c32r128 | 1.04 | 0.99 | 1.01 | 1.00 | 0.97 | 1.00 | 0.98 | 1.00 | 1.00 | 0.97 |
| pg18beta1_o2nofp.cx10cw4_c32r128 | 1.04 | 0.99 | 0.99 | 1.40 | 0.98 | 0.99 | 0.98 | 0.95 | 0.99 | 0.95 |
| pg18beta1_o2nofp.cx10d_c32r128 | 1.04 | 1.07 | 1.02 | 0.99 | 0.97 | 0.98 | 0.97 | 0.98 | 0.98 | 0.99 |
This lists the average rate of inserts/s for the tests that do inserts concurrent with queries. For such tests the query rate is listed in the table above. The read+write tests are setup so that the insert rate should match the target rate every second. Cells that are not at least 95% of the target have a red background to indicate a failure to satisfy the target.
| dbms | qr100.L1 | qp100.L2 | qr500.L3 | qp500.L4 | qr1000.L5 | qp1000.L6 |
|---|---|---|---|---|---|---|
| pg174_o2nofp.cx10a_c32r128 | 1977 | 1976 | 9863 | 9719 | 17786 | 17778 |
| pg18beta1_o2nofp.cx10b_c32r128 | 1977 | 1977 | 9879 | 9793 | 18063 | 17699 |
| pg18beta1_o2nofp.cx10cw4_c32r128 | 1977 | 1977 | 9879 | 9641 | 17831 | 17690 |
| pg18beta1_o2nofp.cx10d_c32r128 | 1977 | 1977 | 9863 | 9672 | 18009 | 17910 |
| target | 2000 | 2000 | 10000 | 10000 | 20000 | 20000 |
l.i0
l.i0: load without secondary indexes. Graphs for performance per 1-second interval are here.
Average throughput:
Insert response time histogram: each cell has the percentage of responses that take <= the time in the header and max is the max response time in seconds. For the max column values in the top 25% of the range have a red background and in the bottom 25% of the range have a green background. The red background is not used when the min value is within 80% of the max value.
| dbms | 256us | 1ms | 4ms | 16ms | 64ms | 256ms | 1s | 4s | 16s | gt | max |
|---|---|---|---|---|---|---|---|---|---|---|---|
| pg174_o2nofp.cx10a_c32r128 | 88.301 | 11.362 | 0.245 | 0.071 | 0.014 | 0.006 | nonzero | 1.354 | |||
| pg18beta1_o2nofp.cx10b_c32r128 | 91.700 | 7.920 | 0.283 | 0.086 | 0.005 | 0.006 | nonzero | 1.447 | |||
| pg18beta1_o2nofp.cx10cw4_c32r128 | 91.716 | 7.942 | 0.240 | 0.091 | 0.005 | 0.006 | nonzero | 1.393 | |||
| pg18beta1_o2nofp.cx10d_c32r128 | 91.639 | 7.990 | 0.273 | 0.087 | 0.006 | 0.005 | 0.912 |
Performance metrics for the DBMS listed above. Some are normalized by throughput, others are not. Legend for results is here.
ips	qps	rps	rmbps	wps	wmbps	rpq	rkbpq	wpi	wkbpi	csps	cpups	cspq	cpupq	dbgb1	dbgb2	rss	maxop	p50	p99	tag
2000000	0	1711	13.7	8354.8	799.3	0.001	0.007	0.004	0.409	367628	55.9	0.184	13	382.7	478.8	95.3	1.354	109164	29968	pg174_o2nofp.cx10a_c32r128
2076843	0	1798	14.4	8733.1	829.2	0.001	0.007	0.004	0.409	336844	57.4	0.162	13	382.7	478.8	96.3	1.447	113078	33164	pg18beta1_o2nofp.cx10b_c32r128
2088773	0	1792	14.4	8768.8	836.4	0.001	0.007	0.004	0.410	348668	57.7	0.167	13	382.7	478.8	95.1	1.393	112971	41068	pg18beta1_o2nofp.cx10cw4_c32r128
2077922	0	1744	14.0	8756.5	837.6	0.001	0.007	0.004	0.413	349296	57.5	0.168	13	382.7	478.8	96.2	0.912	112879	34762	pg18beta1_o2nofp.cx10d_c32r128
l.x
l.x: create secondary indexes.
Average throughput:
Performance metrics for the DBMS listed above. Some are normalized by throughput, others are not. Legend for results is here.
ips	qps	rps	rmbps	wps	wmbps	rpq	rkbpq	wpi	wkbpi	csps	cpups	cspq	cpupq	dbgb1	dbgb2	rss	maxop	p50	p99	tag
3418804	0	11156	1086.6	8808.2	981.7	0.003	0.325	0.003	0.294	90230	23.6	0.026	3	768.4	864.0	30.8	0.003	NA	NA	pg174_o2nofp.cx10a_c32r128
3384095	0	11067	1077.4	8752.4	967.2	0.003	0.326	0.003	0.293	89669	23.5	0.026	3	768.4	863.7	31.4	0.031	NA	NA	pg18beta1_o2nofp.cx10b_c32r128
3372681	0	11350	1072.9	8676.6	964.7	0.003	0.326	0.003	0.293	94078	24.0	0.028	3	768.4	863.7	56.3	0.089	NA	NA	pg18beta1_o2nofp.cx10cw4_c32r128
3652968	0	12255	1160.9	9141.5	1038.2	0.003	0.325	0.003	0.291	117144	26.0	0.032	3	768.4	863.7	30.2	0.164	NA	NA	pg18beta1_o2nofp.cx10d_c32r128
l.i1
l.i1: continue load after secondary indexes created with 50 inserts per transaction. Graphs for performance per 1-second interval are here.
Average throughput:
Insert response time histogram: each cell has the percentage of responses that take <= the time in the header and max is the max response time in seconds. For the max column values in the top 25% of the range have a red background and in the bottom 25% of the range have a green background. The red background is not used when the min value is within 80% of the max value.
| dbms | 256us | 1ms | 4ms | 16ms | 64ms | 256ms | 1s | 4s | 16s | gt | max |
|---|---|---|---|---|---|---|---|---|---|---|---|
| pg174_o2nofp.cx10a_c32r128 | 18.717 | 65.203 | 15.887 | 0.086 | 0.107 | nonzero | 4.128 | ||||
| pg18beta1_o2nofp.cx10b_c32r128 | 16.205 | 69.102 | 14.494 | 0.089 | 0.110 | 3.620 | |||||
| pg18beta1_o2nofp.cx10cw4_c32r128 | 15.646 | 68.291 | 15.866 | 0.075 | 0.122 | nonzero | 4.752 | ||||
| pg18beta1_o2nofp.cx10d_c32r128 | 17.086 | 68.770 | 13.955 | 0.081 | 0.108 | 3.840 |
Delete response time histogram: each cell has the percentage of responses that take <= the time in the header and max is the max response time in seconds. For the max column values in the top 25% of the range have a red background and in the bottom 25% of the range have a green background. The red background is not used when the min value is within 80% of the max value.
| dbms | 256us | 1ms | 4ms | 16ms | 64ms | 256ms | 1s | 4s | 16s | gt | max |
|---|---|---|---|---|---|---|---|---|---|---|---|
| pg174_o2nofp.cx10a_c32r128 | 2.494 | 8.433 | 22.667 | 61.593 | 4.712 | 0.033 | 0.068 | 2.462 | |||
| pg18beta1_o2nofp.cx10b_c32r128 | 2.476 | 8.387 | 24.205 | 62.697 | 2.142 | 0.032 | 0.061 | 2.792 | |||
| pg18beta1_o2nofp.cx10cw4_c32r128 | 2.383 | 8.212 | 23.889 | 62.700 | 2.710 | 0.042 | 0.064 | 2.312 | |||
| pg18beta1_o2nofp.cx10d_c32r128 | 2.423 | 9.168 | 22.239 | 63.393 | 2.677 | 0.037 | 0.062 | 2.478 |
Performance metrics for the DBMS listed above. Some are normalized by throughput, others are not. Legend for results is here.
ips	qps	rps	rmbps	wps	wmbps	rpq	rkbpq	wpi	wkbpi	csps	cpups	cspq	cpupq	dbgb1	dbgb2	rss	maxop	p50	p99	tag
23028	0	29117	232.4	33725.2	751.8	1.264	10.335	1.465	33.428	80104	31.4	3.479	655	781.5	877.6	79.1	4.128	1099	0	pg174_o2nofp.cx10a_c32r128
23317	0	29436	234.3	34821.3	761.9	1.262	10.290	1.493	33.462	83004	30.5	3.560	628	781.5	912.1	85.3	3.620	1149	0	pg18beta1_o2nofp.cx10b_c32r128
22851	0	28896	230.7	33504.8	746.3	1.265	10.340	1.466	33.442	81801	31.1	3.580	653	781.5	877.6	77.6	4.752	1099	0	pg18beta1_o2nofp.cx10cw4_c32r128
23399	0	29606	235.7	34626.3	760.7	1.265	10.316	1.480	33.291	84107	31.9	3.595	654	781.5	877.6	84.6	3.840	1149	0	pg18beta1_o2nofp.cx10d_c32r128
l.i2
l.i2: continue load after secondary indexes created with 5 inserts per transaction. Graphs for performance per 1-second interval are here.
Average throughput:
Insert response time histogram: each cell has the percentage of responses that take <= the time in the header and max is the max response time in seconds. For the max column values in the top 25% of the range have a red background and in the bottom 25% of the range have a green background. The red background is not used when the min value is within 80% of the max value.
| dbms | 256us | 1ms | 4ms | 16ms | 64ms | 256ms | 1s | 4s | 16s | gt | max |
|---|---|---|---|---|---|---|---|---|---|---|---|
| pg174_o2nofp.cx10a_c32r128 | 0.001 | 36.989 | 62.758 | 0.047 | 0.068 | 0.032 | 0.075 | 0.031 | 3.831 | ||
| pg18beta1_o2nofp.cx10b_c32r128 | 0.093 | 36.916 | 62.598 | 0.085 | 0.193 | 0.029 | 0.062 | 0.023 | nonzero | 6.641 | |
| pg18beta1_o2nofp.cx10cw4_c32r128 | 0.093 | 36.787 | 62.558 | 0.082 | 0.357 | 0.029 | 0.067 | 0.028 | nonzero | 6.641 | |
| pg18beta1_o2nofp.cx10d_c32r128 | 0.015 | 36.931 | 62.789 | 0.041 | 0.103 | 0.029 | 0.066 | 0.026 | nonzero | 4.244 |
Delete response time histogram: each cell has the percentage of responses that take <= the time in the header and max is the max response time in seconds. For the max column values in the top 25% of the range have a red background and in the bottom 25% of the range have a green background. The red background is not used when the min value is within 80% of the max value.
| dbms | 256us | 1ms | 4ms | 16ms | 64ms | 256ms | 1s | 4s | 16s | gt | max |
|---|---|---|---|---|---|---|---|---|---|---|---|
| pg174_o2nofp.cx10a_c32r128 | 0.145 | 0.311 | 0.001 | 0.055 | 99.486 | 0.001 | 0.001 | nonzero | 1.792 | ||
| pg18beta1_o2nofp.cx10b_c32r128 | 0.136 | 2.005 | 1.572 | 0.036 | 96.246 | 0.003 | 0.001 | nonzero | 2.747 | ||
| pg18beta1_o2nofp.cx10cw4_c32r128 | 0.189 | 3.324 | 2.338 | 0.085 | 94.058 | 0.003 | 0.002 | nonzero | 1.775 | ||
| pg18beta1_o2nofp.cx10d_c32r128 | 0.054 | 0.792 | 0.003 | 0.074 | 99.073 | 0.002 | 0.001 | nonzero | 1.438 |
Performance metrics for the DBMS listed above. Some are normalized by throughput, others are not. Legend for results is here.
ips	qps	rps	rmbps	wps	wmbps	rpq	rkbpq	wpi	wkbpi	csps	cpups	cspq	cpupq	dbgb1	dbgb2	rss	maxop	p50	p99	tag
2454	0	3063	26.8	4854.2	76.2	1.248	11.179	1.978	31.785	18857	28.4	7.685	5555	784.9	880.9	78.6	3.831	120	80	pg174_o2nofp.cx10a_c32r128
2444	0	3116	28.5	4757.5	74.3	1.275	11.945	1.947	31.121	18668	27.1	7.638	5322	784.8	880.9	75.9	6.641	120	85	pg18beta1_o2nofp.cx10b_c32r128
3424	0	4420	43.7	6727.9	108.2	1.291	13.055	1.965	32.362	26545	33.8	7.753	4738	784.7	880.8	76.6	6.641	120	75	pg18beta1_o2nofp.cx10cw4_c32r128
2428	0	3022	26.1	4724.0	74.6	1.245	11.016	1.946	31.482	18817	29.9	7.750	5911	784.9	880.9	78.8	4.244	120	60	pg18beta1_o2nofp.cx10d_c32r128
qr100.L1
qr100.L1: range queries with 100 insert/s per client. Graphs for performance per 1-second interval are here.
Average throughput:
Query response time histogram: each cell has the percentage of responses that take <= the time in the header and max is the max response time in seconds. For max values in the top 25% of the range have a red background and in the bottom 25% of the range have a green background. The red background is not used when the min value is within 80% of the max value.
| dbms | 256us | 1ms | 4ms | 16ms | 64ms | 256ms | 1s | 4s | 16s | gt | max |
|---|---|---|---|---|---|---|---|---|---|---|---|
| pg174_o2nofp.cx10a_c32r128 | 99.993 | 0.006 | 0.001 | nonzero | nonzero | nonzero | nonzero | 0.422 | |||
| pg18beta1_o2nofp.cx10b_c32r128 | 99.993 | 0.006 | 0.001 | nonzero | nonzero | nonzero | 0.247 | ||||
| pg18beta1_o2nofp.cx10cw4_c32r128 | 99.993 | 0.006 | 0.001 | nonzero | nonzero | 0.017 | |||||
| pg18beta1_o2nofp.cx10d_c32r128 | 99.992 | 0.007 | 0.001 | nonzero | nonzero | nonzero | nonzero | 0.771 |
Insert response time histogram: each cell has the percentage of responses that take <= the time in the header and max is the max response time in seconds. For max values in the top 25% of the range have a red background and in the bottom 25% of the range have a green background. The red background is not used when the min value is within 80% of the max value.
| dbms | 256us | 1ms | 4ms | 16ms | 64ms | 256ms | 1s | 4s | 16s | gt | max |
|---|---|---|---|---|---|---|---|---|---|---|---|
| pg174_o2nofp.cx10a_c32r128 | 98.513 | 1.449 | 0.033 | 0.006 | 0.363 | ||||||
| pg18beta1_o2nofp.cx10b_c32r128 | 99.107 | 0.882 | 0.010 | 0.001 | 0.262 | ||||||
| pg18beta1_o2nofp.cx10cw4_c32r128 | 99.258 | 0.714 | 0.013 | 0.015 | 0.639 | ||||||
| pg18beta1_o2nofp.cx10d_c32r128 | 99.362 | 0.585 | 0.042 | 0.011 | 0.416 |
Delete response time histogram: each cell has the percentage of responses that take <= the time in the header and max is the max response time in seconds. For max values in the top 25% of the range have a red background and in the bottom 25% of the range have a green background. The red background is not used when the min value is within 80% of the max value.
| dbms | 256us | 1ms | 4ms | 16ms | 64ms | 256ms | 1s | 4s | 16s | gt | max |
|---|---|---|---|---|---|---|---|---|---|---|---|
| pg174_o2nofp.cx10a_c32r128 | 44.542 | 55.383 | 0.075 | 0.014 | |||||||
| pg18beta1_o2nofp.cx10b_c32r128 | 47.386 | 52.568 | 0.044 | 0.001 | 0.021 | ||||||
| pg18beta1_o2nofp.cx10cw4_c32r128 | 47.149 | 52.793 | 0.058 | 0.014 | |||||||
| pg18beta1_o2nofp.cx10d_c32r128 | 46.617 | 53.325 | 0.058 | 0.011 |
Performance metrics for the DBMS listed above. Some are normalized by throughput, others are not. Legend for results is here.
ips	qps	rps	rmbps	wps	wmbps	rpq	rkbpq	wpi	wkbpi	csps	cpups	cspq	cpupq	dbgb1	dbgb2	rss	maxop	p50	p99	tag
1977	374394	2722	21.9	1230.1	36.0	0.007	0.060	0.622	18.673	1424704	42.9	3.805	55	785.0	881.0	93.8	0.422	19165	17070	pg174_o2nofp.cx10a_c32r128
1977	364237	2672	21.5	1290.1	36.6	0.007	0.061	0.653	18.963	1385103	43.2	3.803	57	784.9	881.0	95.6	0.247	18604	16836	pg18beta1_o2nofp.cx10b_c32r128
1977	367823	2664	21.4	1261.0	36.4	0.007	0.060	0.638	18.841	1399310	43.0	3.804	56	784.9	881.0	95.0	0.017	18748	17022	pg18beta1_o2nofp.cx10cw4_c32r128
1977	362434	2667	21.4	1291.8	36.6	0.007	0.061	0.653	18.957	1378989	43.1	3.805	57	785.0	881.0	95.1	0.771	18428	16507	pg18beta1_o2nofp.cx10d_c32r128
qp100.L2
qp100.L2: point queries with 100 insert/s per client. Graphs for performance per 1-second interval are here.
Average throughput:
Query response time histogram: each cell has the percentage of responses that take <= the time in the header and max is the max response time in seconds. For max values in the top 25% of the range have a red background and in the bottom 25% of the range have a green background. The red background is not used when the min value is within 80% of the max value.
| dbms | 256us | 1ms | 4ms | 16ms | 64ms | 256ms | 1s | 4s | 16s | gt | max |
|---|---|---|---|---|---|---|---|---|---|---|---|
| pg174_o2nofp.cx10a_c32r128 | nonzero | 2.631 | 94.342 | 0.304 | 2.594 | 0.061 | 0.050 | 0.017 | 0.001 | 5.745 | |
| pg18beta1_o2nofp.cx10b_c32r128 | nonzero | 2.458 | 94.503 | 0.322 | 2.594 | 0.062 | 0.045 | 0.016 | 0.001 | 5.202 | |
| pg18beta1_o2nofp.cx10cw4_c32r128 | nonzero | 2.411 | 94.404 | 0.356 | 2.705 | 0.064 | 0.046 | 0.014 | 0.002 | 5.486 | |
| pg18beta1_o2nofp.cx10d_c32r128 | nonzero | 2.464 | 94.508 | 0.306 | 2.587 | 0.064 | 0.053 | 0.016 | 0.002 | 5.065 |
Insert response time histogram: each cell has the percentage of responses that take <= the time in the header and max is the max response time in seconds. For max values in the top 25% of the range have a red background and in the bottom 25% of the range have a green background. The red background is not used when the min value is within 80% of the max value.
| dbms | 256us | 1ms | 4ms | 16ms | 64ms | 256ms | 1s | 4s | 16s | gt | max |
|---|---|---|---|---|---|---|---|---|---|---|---|
| pg174_o2nofp.cx10a_c32r128 | 62.411 | 34.217 | 1.031 | 1.214 | 1.096 | 0.032 | 5.028 | ||||
| pg18beta1_o2nofp.cx10b_c32r128 | 62.325 | 34.196 | 1.024 | 1.085 | 1.314 | 0.057 | 4.711 | ||||
| pg18beta1_o2nofp.cx10cw4_c32r128 | 61.725 | 34.847 | 1.335 | 0.881 | 1.140 | 0.072 | 4.777 | ||||
| pg18beta1_o2nofp.cx10d_c32r128 | 63.436 | 32.769 | 1.247 | 1.426 | 1.104 | 0.017 | 4.610 |
Delete response time histogram: each cell has the percentage of responses that take <= the time in the header and max is the max response time in seconds. For max values in the top 25% of the range have a red background and in the bottom 25% of the range have a green background. The red background is not used when the min value is within 80% of the max value.
| dbms | 256us | 1ms | 4ms | 16ms | 64ms | 256ms | 1s | 4s | 16s | gt | max |
|---|---|---|---|---|---|---|---|---|---|---|---|
| pg174_o2nofp.cx10a_c32r128 | 94.215 | 1.974 | 3.690 | 0.010 | 0.093 | 0.018 | 3.137 | ||||
| pg18beta1_o2nofp.cx10b_c32r128 | 95.812 | 0.465 | 3.594 | 0.057 | 0.040 | 0.031 | 3.169 | ||||
| pg18beta1_o2nofp.cx10cw4_c32r128 | 95.153 | 0.851 | 3.888 | 0.011 | 0.056 | 0.042 | 3.924 | ||||
| pg18beta1_o2nofp.cx10d_c32r128 | 94.537 | 1.525 | 3.807 | 0.050 | 0.044 | 0.036 | 3.930 |
Performance metrics for the DBMS listed above. Some are normalized by throughput, others are not. Legend for results is here.
ips	qps	rps	rmbps	wps	wmbps	rpq	rkbpq	wpi	wkbpi	csps	cpups	cspq	cpupq	dbgb1	dbgb2	rss	maxop	p50	p99	tag
1976	6943	98326	771.8	6650.7	76.6	14.162	113.840	3.366	39.699	219131	19.2	31.563	1327	785.1	881.1	90.2	5.745	400	0	pg174_o2nofp.cx10a_c32r128
1977	6972	98657	774.4	6632.4	76.3	14.151	113.748	3.355	39.540	220020	19.3	31.559	1329	785.0	881.1	91.2	5.202	400	0	pg18beta1_o2nofp.cx10b_c32r128
1977	6899	97707	766.7	6596.5	76.2	14.163	113.799	3.337	39.487	218147	19.7	31.621	1371	785.1	881.2	90.7	5.486	400	0	pg18beta1_o2nofp.cx10cw4_c32r128
1977	6798	96345	756.3	6644.8	76.4	14.174	113.935	3.361	39.561	214764	19.1	31.595	1349	785.1	881.1	90.6	5.065	400	0	pg18beta1_o2nofp.cx10d_c32r128
qr500.L3
qr500.L3: range queries with 500 insert/s per client. Graphs for performance per 1-second interval are here.
Average throughput:
Query response time histogram: each cell has the percentage of responses that take <= the time in the header and max is the max response time in seconds. For max values in the top 25% of the range have a red background and in the bottom 25% of the range have a green background. The red background is not used when the min value is within 80% of the max value.
| dbms | 256us | 1ms | 4ms | 16ms | 64ms | 256ms | 1s | 4s | 16s | gt | max |
|---|---|---|---|---|---|---|---|---|---|---|---|
| pg174_o2nofp.cx10a_c32r128 | 99.963 | 0.028 | 0.006 | 0.001 | 0.001 | nonzero | nonzero | nonzero | nonzero | 4.016 | |
| pg18beta1_o2nofp.cx10b_c32r128 | 99.967 | 0.026 | 0.006 | 0.001 | 0.001 | nonzero | nonzero | nonzero | 1.549 | ||
| pg18beta1_o2nofp.cx10cw4_c32r128 | 99.966 | 0.026 | 0.006 | 0.001 | 0.001 | nonzero | nonzero | nonzero | 1.908 | ||
| pg18beta1_o2nofp.cx10d_c32r128 | 99.964 | 0.027 | 0.006 | 0.001 | 0.001 | nonzero | nonzero | nonzero | 1.509 |
Insert response time histogram: each cell has the percentage of responses that take <= the time in the header and max is the max response time in seconds. For max values in the top 25% of the range have a red background and in the bottom 25% of the range have a green background. The red background is not used when the min value is within 80% of the max value.
| dbms | 256us | 1ms | 4ms | 16ms | 64ms | 256ms | 1s | 4s | 16s | gt | max |
|---|---|---|---|---|---|---|---|---|---|---|---|
| pg174_o2nofp.cx10a_c32r128 | 83.832 | 15.364 | 0.415 | 0.314 | 0.071 | 0.003 | 4.311 | ||||
| pg18beta1_o2nofp.cx10b_c32r128 | 86.453 | 12.668 | 0.396 | 0.426 | 0.058 | 2.602 | |||||
| pg18beta1_o2nofp.cx10cw4_c32r128 | 85.461 | 13.723 | 0.410 | 0.351 | 0.056 | 2.413 | |||||
| pg18beta1_o2nofp.cx10d_c32r128 | 85.776 | 13.481 | 0.363 | 0.316 | 0.063 | 0.003 | 4.791 |
Delete response time histogram: each cell has the percentage of responses that take <= the time in the header and max is the max response time in seconds. For max values in the top 25% of the range have a red background and in the bottom 25% of the range have a green background. The red background is not used when the min value is within 80% of the max value.
| dbms | 256us | 1ms | 4ms | 16ms | 64ms | 256ms | 1s | 4s | 16s | gt | max |
|---|---|---|---|---|---|---|---|---|---|---|---|
| pg174_o2nofp.cx10a_c32r128 | 36.081 | 62.212 | 1.685 | 0.009 | 0.009 | 0.002 | 0.001 | 4.224 | |||
| pg18beta1_o2nofp.cx10b_c32r128 | 41.577 | 57.215 | 1.184 | 0.007 | 0.017 | 0.001 | 1.687 | ||||
| pg18beta1_o2nofp.cx10cw4_c32r128 | 40.642 | 57.980 | 1.364 | 0.007 | 0.005 | 0.001 | 1.324 | ||||
| pg18beta1_o2nofp.cx10d_c32r128 | 40.708 | 57.928 | 1.341 | 0.009 | 0.012 | 0.002 | nonzero | 4.253 |
Performance metrics for the DBMS listed above. Some are normalized by throughput, others are not. Legend for results is here.
ips	qps	rps	rmbps	wps	wmbps	rpq	rkbpq	wpi	wkbpi	csps	cpups	cspq	cpupq	dbgb1	dbgb2	rss	maxop	p50	p99	tag
9863	330556	13800	111.3	14471.4	242.7	0.042	0.345	1.467	25.198	1240444	49.2	3.753	71	785.6	881.6	87.6	4.016	16798	14172	pg174_o2nofp.cx10a_c32r128
9879	325536	13838	111.6	14510.6	243.2	0.043	0.351	1.469	25.213	1230667	49.1	3.780	72	785.6	881.6	86.9	1.549	16638	14065	pg18beta1_o2nofp.cx10b_c32r128
9879	325168	13818	111.1	14520.7	243.6	0.042	0.350	1.470	25.249	1225683	49.3	3.769	73	786.0	882.1	85.7	1.908	16606	14166	pg18beta1_o2nofp.cx10cw4_c32r128
9863	321441	13798	111.3	14458.1	242.5	0.043	0.354	1.466	25.174	1211118	49.0	3.768	73	785.6	881.7	85.9	1.509	16430	13889	pg18beta1_o2nofp.cx10d_c32r128
qp500.L4
qp500.L4: point queries with 500 insert/s per client. Graphs for performance per 1-second interval are here.
Average throughput:
Query response time histogram: each cell has the percentage of responses that take <= the time in the header and max is the max response time in seconds. For max values in the top 25% of the range have a red background and in the bottom 25% of the range have a green background. The red background is not used when the min value is within 80% of the max value.
| dbms | 256us | 1ms | 4ms | 16ms | 64ms | 256ms | 1s | 4s | 16s | gt | max |
|---|---|---|---|---|---|---|---|---|---|---|---|
| pg174_o2nofp.cx10a_c32r128 | 0.212 | 93.672 | 1.354 | 4.706 | 0.030 | 0.018 | 0.006 | 0.001 | 6.969 | ||
| pg18beta1_o2nofp.cx10b_c32r128 | 0.186 | 93.819 | 1.131 | 4.810 | 0.029 | 0.018 | 0.006 | 0.001 | 5.981 | ||
| pg18beta1_o2nofp.cx10cw4_c32r128 | 0.183 | 93.257 | 1.489 | 5.002 | 0.039 | 0.019 | 0.008 | 0.002 | 6.503 | ||
| pg18beta1_o2nofp.cx10d_c32r128 | 0.190 | 93.665 | 1.298 | 4.793 | 0.031 | 0.014 | 0.008 | 0.001 | 6.688 |
Insert response time histogram: each cell has the percentage of responses that take <= the time in the header and max is the max response time in seconds. For max values in the top 25% of the range have a red background and in the bottom 25% of the range have a green background. The red background is not used when the min value is within 80% of the max value.
| dbms | 256us | 1ms | 4ms | 16ms | 64ms | 256ms | 1s | 4s | 16s | gt | max |
|---|---|---|---|---|---|---|---|---|---|---|---|
| pg174_o2nofp.cx10a_c32r128 | 37.035 | 61.715 | 0.827 | 0.278 | 0.118 | 0.027 | 6.695 | ||||
| pg18beta1_o2nofp.cx10b_c32r128 | 43.968 | 54.959 | 0.658 | 0.274 | 0.125 | 0.016 | 6.034 | ||||
| pg18beta1_o2nofp.cx10cw4_c32r128 | 35.013 | 63.234 | 1.198 | 0.329 | 0.184 | 0.042 | 7.136 | ||||
| pg18beta1_o2nofp.cx10d_c32r128 | 39.792 | 58.796 | 1.001 | 0.218 | 0.176 | 0.016 | 6.742 |
Delete response time histogram: each cell has the percentage of responses that take <= the time in the header and max is the max response time in seconds. For max values in the top 25% of the range have a red background and in the bottom 25% of the range have a green background. The red background is not used when the min value is within 80% of the max value.
| dbms | 256us | 1ms | 4ms | 16ms | 64ms | 256ms | 1s | 4s | 16s | gt | max |
|---|---|---|---|---|---|---|---|---|---|---|---|
| pg174_o2nofp.cx10a_c32r128 | 72.939 | 26.839 | 0.099 | 0.100 | 0.023 | 0.001 | 5.504 | ||||
| pg18beta1_o2nofp.cx10b_c32r128 | 66.959 | 32.798 | 0.102 | 0.101 | 0.041 | 3.867 | |||||
| pg18beta1_o2nofp.cx10cw4_c32r128 | 66.701 | 32.950 | 0.157 | 0.146 | 0.039 | 0.007 | 5.622 | ||||
| pg18beta1_o2nofp.cx10d_c32r128 | 66.916 | 32.862 | 0.108 | 0.076 | 0.038 | 3.712 |
Performance metrics for the DBMS listed above. Some are normalized by throughput, others are not. Legend for results is here.
ips	qps	rps	rmbps	wps	wmbps	rpq	rkbpq	wpi	wkbpi	csps	cpups	cspq	cpupq	dbgb1	dbgb2	rss	maxop	p50	p99	tag
9719	5135	92758	728.6	21752.7	294.5	18.064	145.298	2.238	31.033	211938	37.1	41.273	3468	786.0	882.1	30.1	6.969	272	0	pg174_o2nofp.cx10a_c32r128
9793	5119	92517	726.8	21970.3	296.5	18.073	145.386	2.243	31.003	211964	37.7	41.407	3535	786.1	882.1	33.4	5.981	272	0	pg18beta1_o2nofp.cx10b_c32r128
9641	4866	88836	697.3	21602.7	292.1	18.258	146.758	2.241	31.023	203013	37.4	41.725	3690	787.2	883.3	40.3	6.503	272	0	pg18beta1_o2nofp.cx10cw4_c32r128
9672	5011	90896	713.9	21652.7	293.1	18.138	145.881	2.239	31.029	206943	37.2	41.294	3563	786.2	882.2	33.6	6.688	272	0	pg18beta1_o2nofp.cx10d_c32r128
qr1000.L5
qr1000.L5: range queries with 1000 insert/s per client. Graphs for performance per 1-second interval are here.
Average throughput:
Query response time histogram: each cell has the percentage of responses that take <= the time in the header and max is the max response time in seconds. For max values in the top 25% of the range have a red background and in the bottom 25% of the range have a green background. The red background is not used when the min value is within 80% of the max value.
| dbms | 256us | 1ms | 4ms | 16ms | 64ms | 256ms | 1s | 4s | 16s | gt | max |
|---|---|---|---|---|---|---|---|---|---|---|---|
| pg174_o2nofp.cx10a_c32r128 | 99.534 | 0.345 | 0.042 | 0.050 | 0.028 | 0.001 | nonzero | nonzero | nonzero | 6.237 | |
| pg18beta1_o2nofp.cx10b_c32r128 | 99.539 | 0.355 | 0.041 | 0.042 | 0.023 | nonzero | nonzero | nonzero | 2.454 | ||
| pg18beta1_o2nofp.cx10cw4_c32r128 | 99.519 | 0.366 | 0.043 | 0.046 | 0.025 | nonzero | nonzero | nonzero | 3.378 | ||
| pg18beta1_o2nofp.cx10d_c32r128 | 99.506 | 0.380 | 0.043 | 0.045 | 0.025 | 0.001 | nonzero | nonzero | 1.991 |
Insert response time histogram: each cell has the percentage of responses that take <= the time in the header and max is the max response time in seconds. For max values in the top 25% of the range have a red background and in the bottom 25% of the range have a green background. The red background is not used when the min value is within 80% of the max value.
| dbms | 256us | 1ms | 4ms | 16ms | 64ms | 256ms | 1s | 4s | 16s | gt | max |
|---|---|---|---|---|---|---|---|---|---|---|---|
| pg174_o2nofp.cx10a_c32r128 | 33.214 | 46.519 | 20.067 | 0.083 | 0.099 | 0.017 | 6.785 | ||||
| pg18beta1_o2nofp.cx10b_c32r128 | 36.698 | 43.745 | 19.339 | 0.115 | 0.102 | nonzero | 5.029 | ||||
| pg18beta1_o2nofp.cx10cw4_c32r128 | 31.791 | 46.720 | 21.260 | 0.100 | 0.122 | 0.007 | 7.900 | ||||
| pg18beta1_o2nofp.cx10d_c32r128 | 32.964 | 46.438 | 20.381 | 0.112 | 0.099 | 0.006 | 7.172 |
Delete response time histogram: each cell has the percentage of responses that take <= the time in the header and max is the max response time in seconds. For max values in the top 25% of the range have a red background and in the bottom 25% of the range have a green background. The red background is not used when the min value is within 80% of the max value.
| dbms | 256us | 1ms | 4ms | 16ms | 64ms | 256ms | 1s | 4s | 16s | gt | max |
|---|---|---|---|---|---|---|---|---|---|---|---|
| pg174_o2nofp.cx10a_c32r128 | 32.391 | 61.715 | 5.821 | 0.026 | 0.046 | nonzero | 6.605 | ||||
| pg18beta1_o2nofp.cx10b_c32r128 | 34.065 | 61.667 | 4.173 | 0.048 | 0.047 | 2.508 | |||||
| pg18beta1_o2nofp.cx10cw4_c32r128 | 32.089 | 63.265 | 4.548 | 0.042 | 0.056 | 3.395 | |||||
| pg18beta1_o2nofp.cx10d_c32r128 | 32.159 | 63.256 | 4.486 | 0.045 | 0.054 | 1.987 |
Performance metrics for the DBMS listed above. Some are normalized by throughput, others are not. Legend for results is here.
ips	qps	rps	rmbps	wps	wmbps	rpq	rkbpq	wpi	wkbpi	csps	cpups	cspq	cpupq	dbgb1	dbgb2	rss	maxop	p50	p99	tag
17786	199432	23653	190.4	25855.7	545.7	0.119	0.978	1.454	31.420	652531	63.2	3.272	152	788.9	928.9	77.6	6.237	10340	416	pg174_o2nofp.cx10a_c32r128
18063	200372	24061	193.8	26413.8	557.7	0.120	0.990	1.462	31.619	653648	65.0	3.262	156	788.7	925.9	78.7	2.454	10309	1918	pg18beta1_o2nofp.cx10b_c32r128
17831	197728	23698	190.5	25832.8	548.2	0.120	0.987	1.449	31.483	642676	64.4	3.250	156	790.3	928.3	77.0	3.378	10268	1023	pg18beta1_o2nofp.cx10cw4_c32r128
18009	195264	23944	192.8	26400.6	554.0	0.123	1.011	1.466	31.500	635162	64.3	3.253	158	789.0	929.4	77.1	1.991	10117	1295	pg18beta1_o2nofp.cx10d_c32r128
qp1000.L6
qp1000.L6: point queries with 1000 insert/s per client. Graphs for performance per 1-second interval are here.
Average throughput:
Query response time histogram: each cell has the percentage of responses that take <= the time in the header and max is the max response time in seconds. For max values in the top 25% of the range have a red background and in the bottom 25% of the range have a green background. The red background is not used when the min value is within 80% of the max value.
| dbms | 256us | 1ms | 4ms | 16ms | 64ms | 256ms | 1s | 4s | 16s | gt | max |
|---|---|---|---|---|---|---|---|---|---|---|---|
| pg174_o2nofp.cx10a_c32r128 | 0.001 | 69.644 | 20.855 | 9.110 | 0.305 | 0.056 | 0.024 | 0.005 | 10.150 | ||
| pg18beta1_o2nofp.cx10b_c32r128 | 0.001 | 67.856 | 22.399 | 9.329 | 0.331 | 0.051 | 0.028 | 0.005 | 9.886 | ||
| pg18beta1_o2nofp.cx10cw4_c32r128 | 0.001 | 67.144 | 22.383 | 10.035 | 0.354 | 0.055 | 0.024 | 0.004 | 10.822 | ||
| pg18beta1_o2nofp.cx10d_c32r128 | 0.001 | 68.432 | 21.835 | 9.309 | 0.344 | 0.051 | 0.024 | 0.004 | 10.573 |
Insert response time histogram: each cell has the percentage of responses that take <= the time in the header and max is the max response time in seconds. For max values in the top 25% of the range have a red background and in the bottom 25% of the range have a green background. The red background is not used when the min value is within 80% of the max value.
| dbms | 256us | 1ms | 4ms | 16ms | 64ms | 256ms | 1s | 4s | 16s | gt | max |
|---|---|---|---|---|---|---|---|---|---|---|---|
| pg174_o2nofp.cx10a_c32r128 | 10.286 | 72.209 | 16.899 | 0.386 | 0.185 | 0.035 | 11.435 | ||||
| pg18beta1_o2nofp.cx10b_c32r128 | 9.455 | 71.945 | 18.011 | 0.352 | 0.203 | 0.034 | 9.952 | ||||
| pg18beta1_o2nofp.cx10cw4_c32r128 | 8.939 | 70.124 | 20.357 | 0.374 | 0.177 | 0.029 | 10.841 | ||||
| pg18beta1_o2nofp.cx10d_c32r128 | 9.945 | 71.688 | 17.812 | 0.351 | 0.175 | 0.030 | 10.549 |
Delete response time histogram: each cell has the percentage of responses that take <= the time in the header and max is the max response time in seconds. For max values in the top 25% of the range have a red background and in the bottom 25% of the range have a green background. The red background is not used when the min value is within 80% of the max value.
| dbms | 256us | 1ms | 4ms | 16ms | 64ms | 256ms | 1s | 4s | 16s | gt | max |
|---|---|---|---|---|---|---|---|---|---|---|---|
| pg174_o2nofp.cx10a_c32r128 | 0.041 | 96.208 | 3.444 | 0.209 | 0.096 | 0.002 | 6.005 | ||||
| pg18beta1_o2nofp.cx10b_c32r128 | 0.037 | 96.319 | 3.372 | 0.184 | 0.088 | 3.058 | |||||
| pg18beta1_o2nofp.cx10cw4_c32r128 | 0.030 | 96.046 | 3.629 | 0.205 | 0.089 | nonzero | 5.224 | ||||
| pg18beta1_o2nofp.cx10d_c32r128 | 0.021 | 96.181 | 3.514 | 0.190 | 0.094 | 0.001 | 7.745 |
Performance metrics for the DBMS listed above. Some are normalized by throughput, others are not. Legend for results is here.
ips	qps	rps	rmbps	wps	wmbps	rpq	rkbpq	wpi	wkbpi	csps	cpups	cspq	cpupq	dbgb1	dbgb2	rss	maxop	p50	p99	tag
17778	2480	69599	546.7	35357.2	523.3	28.062	225.735	1.989	30.141	163001	60.8	65.721	11767	793.2	889.2	60.1	10.150	128	0	pg174_o2nofp.cx10a_c32r128
17699	2406	68246	536.1	35405.3	525.9	28.363	228.157	2.000	30.425	160283	61.0	66.612	12169	793.0	889.1	53.0	9.886	128	0	pg18beta1_o2nofp.cx10b_c32r128
17690	2361	67556	530.7	35024.6	523.4	28.616	230.199	1.980	30.296	157302	62.5	66.631	12708	794.6	890.7	49.3	10.822	128	0	pg18beta1_o2nofp.cx10cw4_c32r128
17910	2443	69231	543.9	35466.6	524.9	28.339	227.968	1.980	30.012	161659	62.0	66.172	12182	793.3	889.3	52.6	10.573	128	0	pg18beta1_o2nofp.cx10d_c32r128
l.i0
l.i0: load without secondary indexes
Performance metrics for all DBMS, not just the ones listed above. Some are normalized by throughput, others are not. Legend for results is here.
ips	qps	rps	rmbps	wps	wmbps	rpq	rkbpq	wpi	wkbpi	csps	cpups	cspq	cpupq	dbgb1	dbgb2	rss	maxop	p50	p99	tag
2000000	0	1711	13.7	8354.8	799.3	0.001	0.007	0.004	0.409	367628	55.9	0.184	13	382.7	478.8	95.3	1.354	109164	29968	pg174_o2nofp.cx10a_c32r128
2076843	0	1798	14.4	8733.1	829.2	0.001	0.007	0.004	0.409	336844	57.4	0.162	13	382.7	478.8	96.3	1.447	113078	33164	pg18beta1_o2nofp.cx10b_c32r128
2088773	0	1792	14.4	8768.8	836.4	0.001	0.007	0.004	0.410	348668	57.7	0.167	13	382.7	478.8	95.1	1.393	112971	41068	pg18beta1_o2nofp.cx10cw4_c32r128
2077922	0	1744	14.0	8756.5	837.6	0.001	0.007	0.004	0.413	349296	57.5	0.168	13	382.7	478.8	96.2	0.912	112879	34762	pg18beta1_o2nofp.cx10d_c32r128
l.x
l.x: create secondary indexes
Performance metrics for all DBMS, not just the ones listed above. Some are normalized by throughput, others are not. Legend for results is here.
ips	qps	rps	rmbps	wps	wmbps	rpq	rkbpq	wpi	wkbpi	csps	cpups	cspq	cpupq	dbgb1	dbgb2	rss	maxop	p50	p99	tag
3418804	0	11156	1086.6	8808.2	981.7	0.003	0.325	0.003	0.294	90230	23.6	0.026	3	768.4	864.0	30.8	0.003	NA	NA	pg174_o2nofp.cx10a_c32r128
3384095	0	11067	1077.4	8752.4	967.2	0.003	0.326	0.003	0.293	89669	23.5	0.026	3	768.4	863.7	31.4	0.031	NA	NA	pg18beta1_o2nofp.cx10b_c32r128
3372681	0	11350	1072.9	8676.6	964.7	0.003	0.326	0.003	0.293	94078	24.0	0.028	3	768.4	863.7	56.3	0.089	NA	NA	pg18beta1_o2nofp.cx10cw4_c32r128
3652968	0	12255	1160.9	9141.5	1038.2	0.003	0.325	0.003	0.291	117144	26.0	0.032	3	768.4	863.7	30.2	0.164	NA	NA	pg18beta1_o2nofp.cx10d_c32r128
l.i1
l.i1: continue load after secondary indexes created with 50 inserts per transaction
Performance metrics for all DBMS, not just the ones listed above. Some are normalized by throughput, others are not. Legend for results is here.
ips	qps	rps	rmbps	wps	wmbps	rpq	rkbpq	wpi	wkbpi	csps	cpups	cspq	cpupq	dbgb1	dbgb2	rss	maxop	p50	p99	tag
23028	0	29117	232.4	33725.2	751.8	1.264	10.335	1.465	33.428	80104	31.4	3.479	655	781.5	877.6	79.1	4.128	1099	0	pg174_o2nofp.cx10a_c32r128
23317	0	29436	234.3	34821.3	761.9	1.262	10.290	1.493	33.462	83004	30.5	3.560	628	781.5	912.1	85.3	3.620	1149	0	pg18beta1_o2nofp.cx10b_c32r128
22851	0	28896	230.7	33504.8	746.3	1.265	10.340	1.466	33.442	81801	31.1	3.580	653	781.5	877.6	77.6	4.752	1099	0	pg18beta1_o2nofp.cx10cw4_c32r128
23399	0	29606	235.7	34626.3	760.7	1.265	10.316	1.480	33.291	84107	31.9	3.595	654	781.5	877.6	84.6	3.840	1149	0	pg18beta1_o2nofp.cx10d_c32r128
l.i2
l.i2: continue load after secondary indexes created with 5 inserts per transaction
Performance metrics for all DBMS, not just the ones listed above. Some are normalized by throughput, others are not. Legend for results is here.
ips	qps	rps	rmbps	wps	wmbps	rpq	rkbpq	wpi	wkbpi	csps	cpups	cspq	cpupq	dbgb1	dbgb2	rss	maxop	p50	p99	tag
2454	0	3063	26.8	4854.2	76.2	1.248	11.179	1.978	31.785	18857	28.4	7.685	5555	784.9	880.9	78.6	3.831	120	80	pg174_o2nofp.cx10a_c32r128
2444	0	3116	28.5	4757.5	74.3	1.275	11.945	1.947	31.121	18668	27.1	7.638	5322	784.8	880.9	75.9	6.641	120	85	pg18beta1_o2nofp.cx10b_c32r128
3424	0	4420	43.7	6727.9	108.2	1.291	13.055	1.965	32.362	26545	33.8	7.753	4738	784.7	880.8	76.6	6.641	120	75	pg18beta1_o2nofp.cx10cw4_c32r128
2428	0	3022	26.1	4724.0	74.6	1.245	11.016	1.946	31.482	18817	29.9	7.750	5911	784.9	880.9	78.8	4.244	120	60	pg18beta1_o2nofp.cx10d_c32r128
qr100.L1
qr100.L1: range queries with 100 insert/s per client
Performance metrics for all DBMS, not just the ones listed above. Some are normalized by throughput, others are not. Legend for results is here.
ips	qps	rps	rmbps	wps	wmbps	rpq	rkbpq	wpi	wkbpi	csps	cpups	cspq	cpupq	dbgb1	dbgb2	rss	maxop	p50	p99	tag
1977	374394	2722	21.9	1230.1	36.0	0.007	0.060	0.622	18.673	1424704	42.9	3.805	55	785.0	881.0	93.8	0.422	19165	17070	pg174_o2nofp.cx10a_c32r128
1977	364237	2672	21.5	1290.1	36.6	0.007	0.061	0.653	18.963	1385103	43.2	3.803	57	784.9	881.0	95.6	0.247	18604	16836	pg18beta1_o2nofp.cx10b_c32r128
1977	367823	2664	21.4	1261.0	36.4	0.007	0.060	0.638	18.841	1399310	43.0	3.804	56	784.9	881.0	95.0	0.017	18748	17022	pg18beta1_o2nofp.cx10cw4_c32r128
1977	362434	2667	21.4	1291.8	36.6	0.007	0.061	0.653	18.957	1378989	43.1	3.805	57	785.0	881.0	95.1	0.771	18428	16507	pg18beta1_o2nofp.cx10d_c32r128
qp100.L2
qp100.L2: point queries with 100 insert/s per client
Performance metrics for all DBMS, not just the ones listed above. Some are normalized by throughput, others are not. Legend for results is here.
ips	qps	rps	rmbps	wps	wmbps	rpq	rkbpq	wpi	wkbpi	csps	cpups	cspq	cpupq	dbgb1	dbgb2	rss	maxop	p50	p99	tag
1976	6943	98326	771.8	6650.7	76.6	14.162	113.840	3.366	39.699	219131	19.2	31.563	1327	785.1	881.1	90.2	5.745	400	0	pg174_o2nofp.cx10a_c32r128
1977	6972	98657	774.4	6632.4	76.3	14.151	113.748	3.355	39.540	220020	19.3	31.559	1329	785.0	881.1	91.2	5.202	400	0	pg18beta1_o2nofp.cx10b_c32r128
1977	6899	97707	766.7	6596.5	76.2	14.163	113.799	3.337	39.487	218147	19.7	31.621	1371	785.1	881.2	90.7	5.486	400	0	pg18beta1_o2nofp.cx10cw4_c32r128
1977	6798	96345	756.3	6644.8	76.4	14.174	113.935	3.361	39.561	214764	19.1	31.595	1349	785.1	881.1	90.6	5.065	400	0	pg18beta1_o2nofp.cx10d_c32r128
qr500.L3
qr500.L3: range queries with 500 insert/s per client
Performance metrics for all DBMS, not just the ones listed above. Some are normalized by throughput, others are not. Legend for results is here.
ips	qps	rps	rmbps	wps	wmbps	rpq	rkbpq	wpi	wkbpi	csps	cpups	cspq	cpupq	dbgb1	dbgb2	rss	maxop	p50	p99	tag
9863	330556	13800	111.3	14471.4	242.7	0.042	0.345	1.467	25.198	1240444	49.2	3.753	71	785.6	881.6	87.6	4.016	16798	14172	pg174_o2nofp.cx10a_c32r128
9879	325536	13838	111.6	14510.6	243.2	0.043	0.351	1.469	25.213	1230667	49.1	3.780	72	785.6	881.6	86.9	1.549	16638	14065	pg18beta1_o2nofp.cx10b_c32r128
9879	325168	13818	111.1	14520.7	243.6	0.042	0.350	1.470	25.249	1225683	49.3	3.769	73	786.0	882.1	85.7	1.908	16606	14166	pg18beta1_o2nofp.cx10cw4_c32r128
9863	321441	13798	111.3	14458.1	242.5	0.043	0.354	1.466	25.174	1211118	49.0	3.768	73	785.6	881.7	85.9	1.509	16430	13889	pg18beta1_o2nofp.cx10d_c32r128
qp500.L4
qp500.L4: point queries with 500 insert/s per client
Performance metrics for all DBMS, not just the ones listed above. Some are normalized by throughput, others are not. Legend for results is here.
ips	qps	rps	rmbps	wps	wmbps	rpq	rkbpq	wpi	wkbpi	csps	cpups	cspq	cpupq	dbgb1	dbgb2	rss	maxop	p50	p99	tag
9719	5135	92758	728.6	21752.7	294.5	18.064	145.298	2.238	31.033	211938	37.1	41.273	3468	786.0	882.1	30.1	6.969	272	0	pg174_o2nofp.cx10a_c32r128
9793	5119	92517	726.8	21970.3	296.5	18.073	145.386	2.243	31.003	211964	37.7	41.407	3535	786.1	882.1	33.4	5.981	272	0	pg18beta1_o2nofp.cx10b_c32r128
9641	4866	88836	697.3	21602.7	292.1	18.258	146.758	2.241	31.023	203013	37.4	41.725	3690	787.2	883.3	40.3	6.503	272	0	pg18beta1_o2nofp.cx10cw4_c32r128
9672	5011	90896	713.9	21652.7	293.1	18.138	145.881	2.239	31.029	206943	37.2	41.294	3563	786.2	882.2	33.6	6.688	272	0	pg18beta1_o2nofp.cx10d_c32r128
qr1000.L5
qr1000.L5: range queries with 1000 insert/s per client
Performance metrics for all DBMS, not just the ones listed above. Some are normalized by throughput, others are not. Legend for results is here.
ips	qps	rps	rmbps	wps	wmbps	rpq	rkbpq	wpi	wkbpi	csps	cpups	cspq	cpupq	dbgb1	dbgb2	rss	maxop	p50	p99	tag
17786	199432	23653	190.4	25855.7	545.7	0.119	0.978	1.454	31.420	652531	63.2	3.272	152	788.9	928.9	77.6	6.237	10340	416	pg174_o2nofp.cx10a_c32r128
18063	200372	24061	193.8	26413.8	557.7	0.120	0.990	1.462	31.619	653648	65.0	3.262	156	788.7	925.9	78.7	2.454	10309	1918	pg18beta1_o2nofp.cx10b_c32r128
17831	197728	23698	190.5	25832.8	548.2	0.120	0.987	1.449	31.483	642676	64.4	3.250	156	790.3	928.3	77.0	3.378	10268	1023	pg18beta1_o2nofp.cx10cw4_c32r128
18009	195264	23944	192.8	26400.6	554.0	0.123	1.011	1.466	31.500	635162	64.3	3.253	158	789.0	929.4	77.1	1.991	10117	1295	pg18beta1_o2nofp.cx10d_c32r128
qp1000.L6
qp1000.L6: point queries with 1000 insert/s per client
Performance metrics for all DBMS, not just the ones listed above. Some are normalized by throughput, others are not. Legend for results is here.
ips	qps	rps	rmbps	wps	wmbps	rpq	rkbpq	wpi	wkbpi	csps	cpups	cspq	cpupq	dbgb1	dbgb2	rss	maxop	p50	p99	tag
17778	2480	69599	546.7	35357.2	523.3	28.062	225.735	1.989	30.141	163001	60.8	65.721	11767	793.2	889.2	60.1	10.150	128	0	pg174_o2nofp.cx10a_c32r128
17699	2406	68246	536.1	35405.3	525.9	28.363	228.157	2.000	30.425	160283	61.0	66.612	12169	793.0	889.1	53.0	9.886	128	0	pg18beta1_o2nofp.cx10b_c32r128
17690	2361	67556	530.7	35024.6	523.4	28.616	230.199	1.980	30.296	157302	62.5	66.631	12708	794.6	890.7	49.3	10.822	128	0	pg18beta1_o2nofp.cx10cw4_c32r128
17910	2443	69231	543.9	35466.6	524.9	28.339	227.968	1.980	30.012	161659	62.0	66.172	12182	793.3	889.3	52.6	10.573	128	0	pg18beta1_o2nofp.cx10d_c32r128
l.i0
- l.i0: load without secondary indexes
- Legend for results is here.
- Each entry lists the percentage of responses that fit in that bucket (slower than max time for previous bucket, faster than min time for next bucket).
Insert response time histogram
256us	1ms	4ms	16ms	64ms	256ms	1s	4s	16s	gt	max	tag
0.000	88.301	11.362	0.245	0.071	0.014	0.006	nonzero	0.000	0.000	1.354	pg174_o2nofp.cx10a_c32r128
0.000	91.700	7.920	0.283	0.086	0.005	0.006	nonzero	0.000	0.000	1.447	pg18beta1_o2nofp.cx10b_c32r128
0.000	91.716	7.942	0.240	0.091	0.005	0.006	nonzero	0.000	0.000	1.393	pg18beta1_o2nofp.cx10cw4_c32r128
0.000	91.639	7.990	0.273	0.087	0.006	0.005	0.000	0.000	0.000	0.912	pg18beta1_o2nofp.cx10d_c32r128
l.x
- l.x: create secondary indexes
- Legend for results is here.
- Each entry lists the percentage of responses that fit in that bucket (slower than max time for previous bucket, faster than min time for next bucket).
TODO - determine whether there is data for create index response time
l.i1
- l.i1: continue load after secondary indexes created with 50 inserts per transaction
- Legend for results is here.
- Each entry lists the percentage of responses that fit in that bucket (slower than max time for previous bucket, faster than min time for next bucket).
Insert response time histogram
256us	1ms	4ms	16ms	64ms	256ms	1s	4s	16s	gt	max	tag
0.000	0.000	0.000	18.717	65.203	15.887	0.086	0.107	nonzero	0.000	4.128	pg174_o2nofp.cx10a_c32r128
0.000	0.000	0.000	16.205	69.102	14.494	0.089	0.110	0.000	0.000	3.620	pg18beta1_o2nofp.cx10b_c32r128
0.000	0.000	0.000	15.646	68.291	15.866	0.075	0.122	nonzero	0.000	4.752	pg18beta1_o2nofp.cx10cw4_c32r128
0.000	0.000	0.000	17.086	68.770	13.955	0.081	0.108	0.000	0.000	3.840	pg18beta1_o2nofp.cx10d_c32r128
Delete response time histogram
256us	1ms	4ms	16ms	64ms	256ms	1s	4s	16s	gt	max	tag
0.000	2.494	8.433	22.667	61.593	4.712	0.033	0.068	0.000	0.000	2.462	pg174_o2nofp.cx10a_c32r128
0.000	2.476	8.387	24.205	62.697	2.142	0.032	0.061	0.000	0.000	2.792	pg18beta1_o2nofp.cx10b_c32r128
0.000	2.383	8.212	23.889	62.700	2.710	0.042	0.064	0.000	0.000	2.312	pg18beta1_o2nofp.cx10cw4_c32r128
0.000	2.423	9.168	22.239	63.393	2.677	0.037	0.062	0.000	0.000	2.478	pg18beta1_o2nofp.cx10d_c32r128
l.i2
- l.i2: continue load after secondary indexes created with 5 inserts per transaction
- Legend for results is here.
- Each entry lists the percentage of responses that fit in that bucket (slower than max time for previous bucket, faster than min time for next bucket).
Insert response time histogram
256us	1ms	4ms	16ms	64ms	256ms	1s	4s	16s	gt	max	tag
0.001	36.989	62.758	0.047	0.068	0.032	0.075	0.031	0.000	0.000	3.831	pg174_o2nofp.cx10a_c32r128
0.093	36.916	62.598	0.085	0.193	0.029	0.062	0.023	nonzero	0.000	6.641	pg18beta1_o2nofp.cx10b_c32r128
0.093	36.787	62.558	0.082	0.357	0.029	0.067	0.028	nonzero	0.000	6.641	pg18beta1_o2nofp.cx10cw4_c32r128
0.015	36.931	62.789	0.041	0.103	0.029	0.066	0.026	nonzero	0.000	4.244	pg18beta1_o2nofp.cx10d_c32r128
Delete response time histogram
256us	1ms	4ms	16ms	64ms	256ms	1s	4s	16s	gt	max	tag
0.145	0.311	0.001	0.055	99.486	0.001	0.001	nonzero	0.000	0.000	1.792	pg174_o2nofp.cx10a_c32r128
0.136	2.005	1.572	0.036	96.246	0.003	0.001	nonzero	0.000	0.000	2.747	pg18beta1_o2nofp.cx10b_c32r128
0.189	3.324	2.338	0.085	94.058	0.003	0.002	nonzero	0.000	0.000	1.775	pg18beta1_o2nofp.cx10cw4_c32r128
0.054	0.792	0.003	0.074	99.073	0.002	0.001	nonzero	0.000	0.000	1.438	pg18beta1_o2nofp.cx10d_c32r128
qr100.L1
- qr100.L1: range queries with 100 insert/s per client
- Legend for results is here.
- Each entry lists the percentage of responses that fit in that bucket (slower than max time for previous bucket, faster than min time for next bucket).
Query response time histogram
256us	1ms	4ms	16ms	64ms	256ms	1s	4s	16s	gt	max	tag
99.993	0.006	0.001	nonzero	nonzero	nonzero	nonzero	0.000	0.000	0.000	0.422	pg174_o2nofp.cx10a_c32r128
99.993	0.006	0.001	nonzero	nonzero	nonzero	0.000	0.000	0.000	0.000	0.247	pg18beta1_o2nofp.cx10b_c32r128
99.993	0.006	0.001	nonzero	nonzero	0.000	0.000	0.000	0.000	0.000	0.017	pg18beta1_o2nofp.cx10cw4_c32r128
99.992	0.007	0.001	nonzero	nonzero	nonzero	nonzero	0.000	0.000	0.000	0.771	pg18beta1_o2nofp.cx10d_c32r128
Insert response time histogram
256us	1ms	4ms	16ms	64ms	256ms	1s	4s	16s	gt	max	tag
0.000	0.000	0.000	98.513	1.449	0.033	0.006	0.000	0.000	0.000	0.363	pg174_o2nofp.cx10a_c32r128
0.000	0.000	0.000	99.107	0.882	0.010	0.001	0.000	0.000	0.000	0.262	pg18beta1_o2nofp.cx10b_c32r128
0.000	0.000	0.000	99.258	0.714	0.013	0.015	0.000	0.000	0.000	0.639	pg18beta1_o2nofp.cx10cw4_c32r128
0.000	0.000	0.000	99.362	0.585	0.042	0.011	0.000	0.000	0.000	0.416	pg18beta1_o2nofp.cx10d_c32r128
Delete response time histogram
256us	1ms	4ms	16ms	64ms	256ms	1s	4s	16s	gt	max	tag
0.000	44.542	55.383	0.075	0.000	0.000	0.000	0.000	0.000	0.000	0.014	pg174_o2nofp.cx10a_c32r128
0.000	47.386	52.568	0.044	0.001	0.000	0.000	0.000	0.000	0.000	0.021	pg18beta1_o2nofp.cx10b_c32r128
0.000	47.149	52.793	0.058	0.000	0.000	0.000	0.000	0.000	0.000	0.014	pg18beta1_o2nofp.cx10cw4_c32r128
0.000	46.617	53.325	0.058	0.000	0.000	0.000	0.000	0.000	0.000	0.011	pg18beta1_o2nofp.cx10d_c32r128
qp100.L2
- qp100.L2: point queries with 100 insert/s per client
- Legend for results is here.
- Each entry lists the percentage of responses that fit in that bucket (slower than max time for previous bucket, faster than min time for next bucket).
Query response time histogram
256us	1ms	4ms	16ms	64ms	256ms	1s	4s	16s	gt	max	tag
nonzero	2.631	94.342	0.304	2.594	0.061	0.050	0.017	0.001	0.000	5.745	pg174_o2nofp.cx10a_c32r128
nonzero	2.458	94.503	0.322	2.594	0.062	0.045	0.016	0.001	0.000	5.202	pg18beta1_o2nofp.cx10b_c32r128
nonzero	2.411	94.404	0.356	2.705	0.064	0.046	0.014	0.002	0.000	5.486	pg18beta1_o2nofp.cx10cw4_c32r128
nonzero	2.464	94.508	0.306	2.587	0.064	0.053	0.016	0.002	0.000	5.065	pg18beta1_o2nofp.cx10d_c32r128
Insert response time histogram
256us	1ms	4ms	16ms	64ms	256ms	1s	4s	16s	gt	max	tag
0.000	0.000	0.000	62.411	34.217	1.031	1.214	1.096	0.032	0.000	5.028	pg174_o2nofp.cx10a_c32r128
0.000	0.000	0.000	62.325	34.196	1.024	1.085	1.314	0.057	0.000	4.711	pg18beta1_o2nofp.cx10b_c32r128
0.000	0.000	0.000	61.725	34.847	1.335	0.881	1.140	0.072	0.000	4.777	pg18beta1_o2nofp.cx10cw4_c32r128
0.000	0.000	0.000	63.436	32.769	1.247	1.426	1.104	0.017	0.000	4.610	pg18beta1_o2nofp.cx10d_c32r128
Delete response time histogram
256us	1ms	4ms	16ms	64ms	256ms	1s	4s	16s	gt	max	tag
0.000	0.000	94.215	1.974	3.690	0.010	0.093	0.018	0.000	0.000	3.137	pg174_o2nofp.cx10a_c32r128
0.000	0.000	95.812	0.465	3.594	0.057	0.040	0.031	0.000	0.000	3.169	pg18beta1_o2nofp.cx10b_c32r128
0.000	0.000	95.153	0.851	3.888	0.011	0.056	0.042	0.000	0.000	3.924	pg18beta1_o2nofp.cx10cw4_c32r128
0.000	0.000	94.537	1.525	3.807	0.050	0.044	0.036	0.000	0.000	3.930	pg18beta1_o2nofp.cx10d_c32r128
qr500.L3
- qr500.L3: range queries with 500 insert/s per client
- Legend for results is here.
- Each entry lists the percentage of responses that fit in that bucket (slower than max time for previous bucket, faster than min time for next bucket).
Query response time histogram
256us	1ms	4ms	16ms	64ms	256ms	1s	4s	16s	gt	max	tag
99.963	0.028	0.006	0.001	0.001	nonzero	nonzero	nonzero	nonzero	0.000	4.016	pg174_o2nofp.cx10a_c32r128
99.967	0.026	0.006	0.001	0.001	nonzero	nonzero	nonzero	0.000	0.000	1.549	pg18beta1_o2nofp.cx10b_c32r128
99.966	0.026	0.006	0.001	0.001	nonzero	nonzero	nonzero	0.000	0.000	1.908	pg18beta1_o2nofp.cx10cw4_c32r128
99.964	0.027	0.006	0.001	0.001	nonzero	nonzero	nonzero	0.000	0.000	1.509	pg18beta1_o2nofp.cx10d_c32r128
Insert response time histogram
256us	1ms	4ms	16ms	64ms	256ms	1s	4s	16s	gt	max	tag
0.000	0.000	0.000	83.832	15.364	0.415	0.314	0.071	0.003	0.000	4.311	pg174_o2nofp.cx10a_c32r128
0.000	0.000	0.000	86.453	12.668	0.396	0.426	0.058	0.000	0.000	2.602	pg18beta1_o2nofp.cx10b_c32r128
0.000	0.000	0.000	85.461	13.723	0.410	0.351	0.056	0.000	0.000	2.413	pg18beta1_o2nofp.cx10cw4_c32r128
0.000	0.000	0.000	85.776	13.481	0.363	0.316	0.063	0.003	0.000	4.791	pg18beta1_o2nofp.cx10d_c32r128
Delete response time histogram
256us	1ms	4ms	16ms	64ms	256ms	1s	4s	16s	gt	max	tag
0.000	0.000	36.081	62.212	1.685	0.009	0.009	0.002	0.001	0.000	4.224	pg174_o2nofp.cx10a_c32r128
0.000	0.000	41.577	57.215	1.184	0.007	0.017	0.001	0.000	0.000	1.687	pg18beta1_o2nofp.cx10b_c32r128
0.000	0.000	40.642	57.980	1.364	0.007	0.005	0.001	0.000	0.000	1.324	pg18beta1_o2nofp.cx10cw4_c32r128
0.000	0.000	40.708	57.928	1.341	0.009	0.012	0.002	nonzero	0.000	4.253	pg18beta1_o2nofp.cx10d_c32r128
qp500.L4
- qp500.L4: point queries with 500 insert/s per client
- Legend for results is here.
- Each entry lists the percentage of responses that fit in that bucket (slower than max time for previous bucket, faster than min time for next bucket).
Query response time histogram
256us	1ms	4ms	16ms	64ms	256ms	1s	4s	16s	gt	max	tag
0.000	0.212	93.672	1.354	4.706	0.030	0.018	0.006	0.001	0.000	6.969	pg174_o2nofp.cx10a_c32r128
0.000	0.186	93.819	1.131	4.810	0.029	0.018	0.006	0.001	0.000	5.981	pg18beta1_o2nofp.cx10b_c32r128
0.000	0.183	93.257	1.489	5.002	0.039	0.019	0.008	0.002	0.000	6.503	pg18beta1_o2nofp.cx10cw4_c32r128
0.000	0.190	93.665	1.298	4.793	0.031	0.014	0.008	0.001	0.000	6.688	pg18beta1_o2nofp.cx10d_c32r128
Insert response time histogram
256us	1ms	4ms	16ms	64ms	256ms	1s	4s	16s	gt	max	tag
0.000	0.000	0.000	37.035	61.715	0.827	0.278	0.118	0.027	0.000	6.695	pg174_o2nofp.cx10a_c32r128
0.000	0.000	0.000	43.968	54.959	0.658	0.274	0.125	0.016	0.000	6.034	pg18beta1_o2nofp.cx10b_c32r128
0.000	0.000	0.000	35.013	63.234	1.198	0.329	0.184	0.042	0.000	7.136	pg18beta1_o2nofp.cx10cw4_c32r128
0.000	0.000	0.000	39.792	58.796	1.001	0.218	0.176	0.016	0.000	6.742	pg18beta1_o2nofp.cx10d_c32r128
Delete response time histogram
256us	1ms	4ms	16ms	64ms	256ms	1s	4s	16s	gt	max	tag
0.000	0.000	0.000	72.939	26.839	0.099	0.100	0.023	0.001	0.000	5.504	pg174_o2nofp.cx10a_c32r128
0.000	0.000	0.000	66.959	32.798	0.102	0.101	0.041	0.000	0.000	3.867	pg18beta1_o2nofp.cx10b_c32r128
0.000	0.000	0.000	66.701	32.950	0.157	0.146	0.039	0.007	0.000	5.622	pg18beta1_o2nofp.cx10cw4_c32r128
0.000	0.000	0.000	66.916	32.862	0.108	0.076	0.038	0.000	0.000	3.712	pg18beta1_o2nofp.cx10d_c32r128
qr1000.L5
- qr1000.L5: range queries with 1000 insert/s per client
- Legend for results is here.
- Each entry lists the percentage of responses that fit in that bucket (slower than max time for previous bucket, faster than min time for next bucket).
Query response time histogram
256us	1ms	4ms	16ms	64ms	256ms	1s	4s	16s	gt	max	tag
99.534	0.345	0.042	0.050	0.028	0.001	nonzero	nonzero	nonzero	0.000	6.237	pg174_o2nofp.cx10a_c32r128
99.539	0.355	0.041	0.042	0.023	nonzero	nonzero	nonzero	0.000	0.000	2.454	pg18beta1_o2nofp.cx10b_c32r128
99.519	0.366	0.043	0.046	0.025	nonzero	nonzero	nonzero	0.000	0.000	3.378	pg18beta1_o2nofp.cx10cw4_c32r128
99.506	0.380	0.043	0.045	0.025	0.001	nonzero	nonzero	0.000	0.000	1.991	pg18beta1_o2nofp.cx10d_c32r128
Insert response time histogram
256us	1ms	4ms	16ms	64ms	256ms	1s	4s	16s	gt	max	tag
0.000	0.000	0.000	33.214	46.519	20.067	0.083	0.099	0.017	0.000	6.785	pg174_o2nofp.cx10a_c32r128
0.000	0.000	0.000	36.698	43.745	19.339	0.115	0.102	nonzero	0.000	5.029	pg18beta1_o2nofp.cx10b_c32r128
0.000	0.000	0.000	31.791	46.720	21.260	0.100	0.122	0.007	0.000	7.900	pg18beta1_o2nofp.cx10cw4_c32r128
0.000	0.000	0.000	32.964	46.438	20.381	0.112	0.099	0.006	0.000	7.172	pg18beta1_o2nofp.cx10d_c32r128
Delete response time histogram
256us	1ms	4ms	16ms	64ms	256ms	1s	4s	16s	gt	max	tag
0.000	0.000	0.000	32.391	61.715	5.821	0.026	0.046	nonzero	0.000	6.605	pg174_o2nofp.cx10a_c32r128
0.000	0.000	0.000	34.065	61.667	4.173	0.048	0.047	0.000	0.000	2.508	pg18beta1_o2nofp.cx10b_c32r128
0.000	0.000	0.000	32.089	63.265	4.548	0.042	0.056	0.000	0.000	3.395	pg18beta1_o2nofp.cx10cw4_c32r128
0.000	0.000	0.000	32.159	63.256	4.486	0.045	0.054	0.000	0.000	1.987	pg18beta1_o2nofp.cx10d_c32r128
qp1000.L6
- qp1000.L6: point queries with 1000 insert/s per client
- Legend for results is here.
- Each entry lists the percentage of responses that fit in that bucket (slower than max time for previous bucket, faster than min time for next bucket).
Query response time histogram
256us	1ms	4ms	16ms	64ms	256ms	1s	4s	16s	gt	max	tag
0.000	0.001	69.644	20.855	9.110	0.305	0.056	0.024	0.005	0.000	10.150	pg174_o2nofp.cx10a_c32r128
0.000	0.001	67.856	22.399	9.329	0.331	0.051	0.028	0.005	0.000	9.886	pg18beta1_o2nofp.cx10b_c32r128
0.000	0.001	67.144	22.383	10.035	0.354	0.055	0.024	0.004	0.000	10.822	pg18beta1_o2nofp.cx10cw4_c32r128
0.000	0.001	68.432	21.835	9.309	0.344	0.051	0.024	0.004	0.000	10.573	pg18beta1_o2nofp.cx10d_c32r128
Insert response time histogram
256us	1ms	4ms	16ms	64ms	256ms	1s	4s	16s	gt	max	tag
0.000	0.000	0.000	10.286	72.209	16.899	0.386	0.185	0.035	0.000	11.435	pg174_o2nofp.cx10a_c32r128
0.000	0.000	0.000	9.455	71.945	18.011	0.352	0.203	0.034	0.000	9.952	pg18beta1_o2nofp.cx10b_c32r128
0.000	0.000	0.000	8.939	70.124	20.357	0.374	0.177	0.029	0.000	10.841	pg18beta1_o2nofp.cx10cw4_c32r128
0.000	0.000	0.000	9.945	71.688	17.812	0.351	0.175	0.030	0.000	10.549	pg18beta1_o2nofp.cx10d_c32r128
Delete response time histogram
256us	1ms	4ms	16ms	64ms	256ms	1s	4s	16s	gt	max	tag
0.000	0.000	0.000	0.041	96.208	3.444	0.209	0.096	0.002	0.000	6.005	pg174_o2nofp.cx10a_c32r128
0.000	0.000	0.000	0.037	96.319	3.372	0.184	0.088	0.000	0.000	3.058	pg18beta1_o2nofp.cx10b_c32r128
0.000	0.000	0.000	0.030	96.046	3.629	0.205	0.089	nonzero	0.000	5.224	pg18beta1_o2nofp.cx10cw4_c32r128
0.000	0.000	0.000	0.021	96.181	3.514	0.190	0.094	0.001	0.000	7.745	pg18beta1_o2nofp.cx10d_c32r128