Introduction
This is a report for the insert benchmark with 200M docs and 20 client(s). It is generated by scripts (bash, awk, sed) and Tufte might not be impressed. An overview of the insert benchmark is here and a short update is here. Below, by DBMS, I mean DBMS+version.config. An example is my8020.c10b40 where my means MySQL, 8020 is version 8.0.20 and c10b40 is the name for the configuration file.
The test server has 48 AMD cores, 128G RAM and RAID 10 with 2 NVMe devices. It is described here. The benchmark was run with 20 clients and there were 1 or 3 connections per client (1 for queries or inserts without rate limits, 1+1 for rate limited inserts+deletes). It uses 20 tables with a table per client. It loads 10M rows per table without secondary indexes, creates 3 secondary indexes per table, then inserts 16m+4m rows per table with a delete per insert to avoid growing the table. It then does 6 read+write tests for 1800s each that do queries as fast as possible with 100,100,500,500,1000,1000 inserts/s and the same for deletes/s per client concurrent with the queries. The database is cached by Postgres. Clients and the DBMS share one server. The per-database configs are in the per-database subdirectories here.
The tested DBMS are:
- pg174_o2nofp.cx10a_c32r128 - Postgres 17.4 with the cx10a_c32r128 config
- pg18beta1_o2nofp.cx10b_c32r128 - Postgres 18 beta1 with the cx10b_c32r128 config
- pg18beta1_o2nofp.cx10cw4_c32r128 - Postgres 18 beta1 with the cx10cw4_c32r128 config
- pg18beta1_o2nofp.cx10d_c32r128 - Postgres 18 beta1 with the cx10d_c32r128 config
Contents
- Summary
- l.i0: load without secondary indexes
- l.x: create secondary indexes
- l.i1: continue load after secondary indexes created with 50 inserts per transaction
- l.i2: continue load after secondary indexes created with 5 inserts per transaction
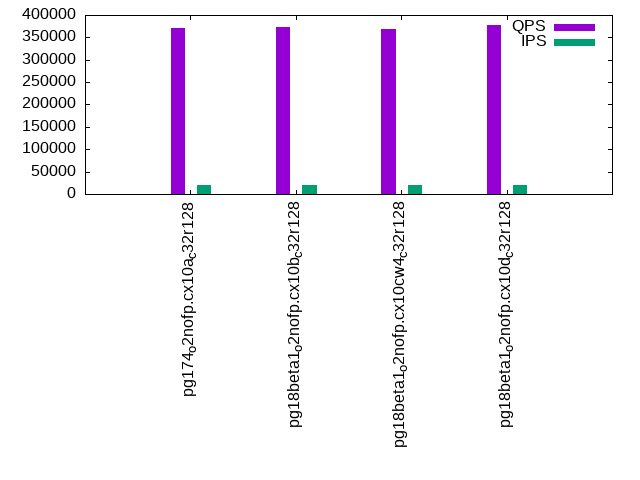
- qr100.L1: range queries with 100 insert/s per client
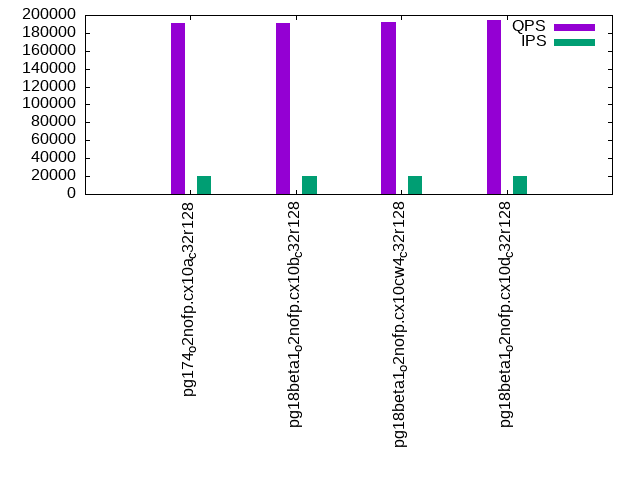
- qp100.L2: point queries with 100 insert/s per client
- qr500.L3: range queries with 500 insert/s per client
- qp500.L4: point queries with 500 insert/s per client
- qr1000.L5: range queries with 1000 insert/s per client
- qp1000.L6: point queries with 1000 insert/s per client
Summary
The numbers are inserts/s for l.i0, l.i1 and l.i2, indexed docs (or rows) /s for l.x and queries/s for qr100, qp100 thru qr1000, qp1000" The values are the average rate over the entire test for inserts (IPS) and queries (QPS). The range of values for IPS and QPS is split into 3 parts: bottom 25%, middle 50%, top 25%. Values in the bottom 25% have a red background, values in the top 25% have a green background and values in the middle have no color. A gray background is used for values that can be ignored because the DBMS did not sustain the target insert rate. Red backgrounds are not used when the minimum value is within 80% of the max value.
| dbms | l.i0 | l.x | l.i1 | l.i2 | qr100 | qp100 | qr500 | qp500 | qr1000 | qp1000 |
|---|---|---|---|---|---|---|---|---|---|---|
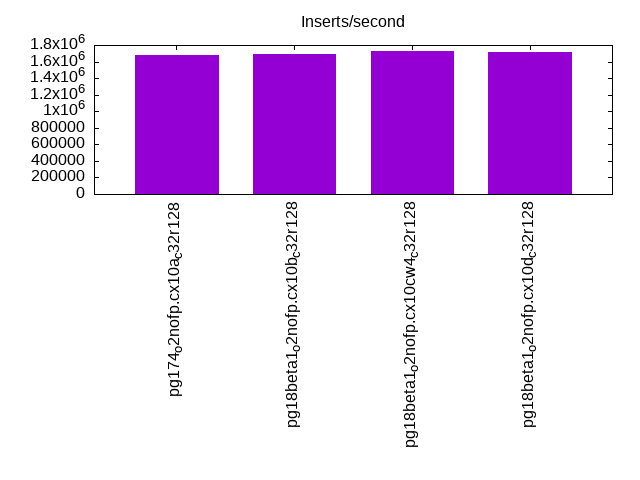
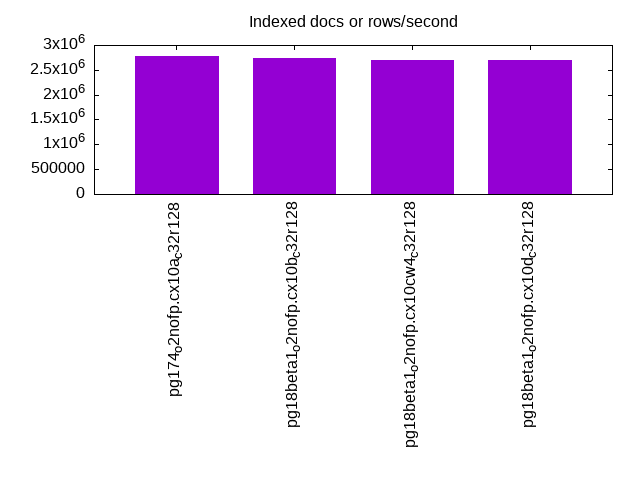
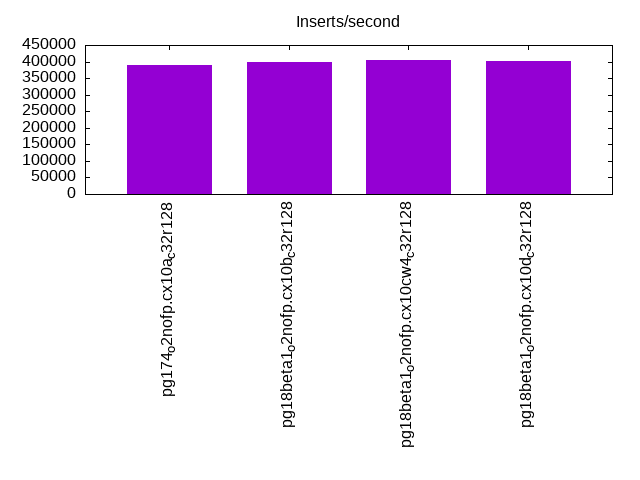
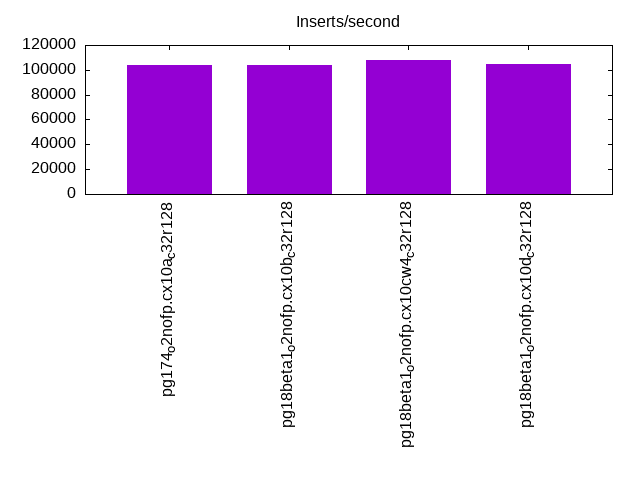
| pg174_o2nofp.cx10a_c32r128 | 1680672 | 2777779 | 390720 | 103896 | 390336 | 194871 | 375502 | 193163 | 371113 | 191529 |
| pg18beta1_o2nofp.cx10b_c32r128 | 1694915 | 2739727 | 397516 | 103761 | 389206 | 193978 | 375689 | 192471 | 372868 | 190806 |
| pg18beta1_o2nofp.cx10cw4_c32r128 | 1724138 | 2702704 | 405577 | 108108 | 384972 | 195740 | 374394 | 194024 | 368807 | 192294 |
| pg18beta1_o2nofp.cx10d_c32r128 | 1709402 | 2702704 | 403023 | 104439 | 394180 | 198592 | 380308 | 196382 | 376557 | 194336 |
This table has relative throughput, throughput for the DBMS relative to the DBMS in the first line, using the absolute throughput from the previous table. Values less than 0.95 have a yellow background. Values greater than 1.05 have a blue background.
| dbms | l.i0 | l.x | l.i1 | l.i2 | qr100 | qp100 | qr500 | qp500 | qr1000 | qp1000 |
|---|---|---|---|---|---|---|---|---|---|---|
| pg174_o2nofp.cx10a_c32r128 | 1.00 | 1.00 | 1.00 | 1.00 | 1.00 | 1.00 | 1.00 | 1.00 | 1.00 | 1.00 |
| pg18beta1_o2nofp.cx10b_c32r128 | 1.01 | 0.99 | 1.02 | 1.00 | 1.00 | 1.00 | 1.00 | 1.00 | 1.00 | 1.00 |
| pg18beta1_o2nofp.cx10cw4_c32r128 | 1.03 | 0.97 | 1.04 | 1.04 | 0.99 | 1.00 | 1.00 | 1.00 | 0.99 | 1.00 |
| pg18beta1_o2nofp.cx10d_c32r128 | 1.02 | 0.97 | 1.03 | 1.01 | 1.01 | 1.02 | 1.01 | 1.02 | 1.01 | 1.01 |
This lists the average rate of inserts/s for the tests that do inserts concurrent with queries. For such tests the query rate is listed in the table above. The read+write tests are setup so that the insert rate should match the target rate every second. Cells that are not at least 95% of the target have a red background to indicate a failure to satisfy the target.
| dbms | qr100.L1 | qp100.L2 | qr500.L3 | qp500.L4 | qr1000.L5 | qp1000.L6 |
|---|---|---|---|---|---|---|
| pg174_o2nofp.cx10a_c32r128 | 1977 | 1977 | 9885 | 9885 | 19758 | 19758 |
| pg18beta1_o2nofp.cx10b_c32r128 | 1978 | 1976 | 9885 | 9885 | 19758 | 19758 |
| pg18beta1_o2nofp.cx10cw4_c32r128 | 1977 | 1977 | 9885 | 9879 | 19758 | 19758 |
| pg18beta1_o2nofp.cx10d_c32r128 | 1977 | 1976 | 9885 | 9885 | 19758 | 19748 |
| target | 2000 | 2000 | 10000 | 10000 | 20000 | 20000 |
l.i0
l.i0: load without secondary indexes. Graphs for performance per 1-second interval are here.
Average throughput:
Insert response time histogram: each cell has the percentage of responses that take <= the time in the header and max is the max response time in seconds. For the max column values in the top 25% of the range have a red background and in the bottom 25% of the range have a green background. The red background is not used when the min value is within 80% of the max value.
| dbms | 256us | 1ms | 4ms | 16ms | 64ms | 256ms | 1s | 4s | 16s | gt | max |
|---|---|---|---|---|---|---|---|---|---|---|---|
| pg174_o2nofp.cx10a_c32r128 | 91.932 | 8.008 | 0.036 | 0.006 | 0.011 | 0.007 | 0.385 | ||||
| pg18beta1_o2nofp.cx10b_c32r128 | 94.122 | 5.814 | 0.038 | 0.015 | 0.006 | 0.006 | 0.659 | ||||
| pg18beta1_o2nofp.cx10cw4_c32r128 | 94.505 | 5.424 | 0.038 | 0.018 | 0.009 | 0.006 | 0.664 | ||||
| pg18beta1_o2nofp.cx10d_c32r128 | 94.426 | 5.518 | 0.031 | 0.009 | 0.010 | 0.006 | 0.778 |
Performance metrics for the DBMS listed above. Some are normalized by throughput, others are not. Legend for results is here.
ips	qps	rps	rmbps	wps	wmbps	rpq	rkbpq	wpi	wkbpi	csps	cpups	cspq	cpupq	dbgb1	dbgb2	rss	maxop	p50	p99	tag
1680672	0	3	0.0	6619.0	701.8	0.000	0.000	0.004	0.428	277493	44.4	0.165	13	19.1	51.7	12.8	0.385	110581	33864	pg174_o2nofp.cx10a_c32r128
1694915	0	3	0.0	6881.1	724.6	0.000	0.000	0.004	0.438	256212	45.9	0.151	13	19.1	51.7	1.4	0.659	113536	54542	pg18beta1_o2nofp.cx10b_c32r128
1724138	0	3	0.0	6869.8	724.2	0.000	0.000	0.004	0.430	251935	45.6	0.146	13	19.1	51.7	7.8	0.664	115076	31546	pg18beta1_o2nofp.cx10cw4_c32r128
1709402	0	3	0.0	6878.6	722.2	0.000	0.000	0.004	0.433	253094	45.5	0.148	13	19.1	51.7	8.0	0.778	115111	42853	pg18beta1_o2nofp.cx10d_c32r128
l.x
l.x: create secondary indexes.
Average throughput:
Performance metrics for the DBMS listed above. Some are normalized by throughput, others are not. Legend for results is here.
ips	qps	rps	rmbps	wps	wmbps	rpq	rkbpq	wpi	wkbpi	csps	cpups	cspq	cpupq	dbgb1	dbgb2	rss	maxop	p50	p99	tag
2777779	0	4	0.0	7177.8	833.9	0.000	0.000	0.003	0.307	43819	15.8	0.016	3	38.4	88.5	7.1	0.027	NA	NA	pg174_o2nofp.cx10a_c32r128
2739727	0	4	0.0	6901.1	802.3	0.000	0.000	0.003	0.300	34138	14.9	0.012	3	38.4	88.5	7.1	0.035	NA	NA	pg18beta1_o2nofp.cx10b_c32r128
2702704	0	4	0.0	6851.4	795.7	0.000	0.000	0.003	0.301	35396	15.1	0.013	3	38.4	88.5	6.4	0.025	NA	NA	pg18beta1_o2nofp.cx10cw4_c32r128
2702704	0	4	0.0	6861.0	797.8	0.000	0.000	0.003	0.302	34312	15.1	0.013	3	38.4	88.5	7.1	0.045	NA	NA	pg18beta1_o2nofp.cx10d_c32r128
l.i1
l.i1: continue load after secondary indexes created with 50 inserts per transaction. Graphs for performance per 1-second interval are here.
Average throughput:
Insert response time histogram: each cell has the percentage of responses that take <= the time in the header and max is the max response time in seconds. For the max column values in the top 25% of the range have a red background and in the bottom 25% of the range have a green background. The red background is not used when the min value is within 80% of the max value.
| dbms | 256us | 1ms | 4ms | 16ms | 64ms | 256ms | 1s | 4s | 16s | gt | max |
|---|---|---|---|---|---|---|---|---|---|---|---|
| pg174_o2nofp.cx10a_c32r128 | 2.820 | 89.477 | 7.147 | 0.549 | 0.006 | nonzero | 0.844 | ||||
| pg18beta1_o2nofp.cx10b_c32r128 | 3.119 | 90.127 | 6.119 | 0.630 | 0.005 | 0.001 | 0.407 | ||||
| pg18beta1_o2nofp.cx10cw4_c32r128 | 1.975 | 90.952 | 6.432 | 0.636 | 0.005 | 0.001 | 0.681 | ||||
| pg18beta1_o2nofp.cx10d_c32r128 | 2.245 | 90.721 | 6.386 | 0.642 | 0.006 | 0.001 | 0.916 |
Delete response time histogram: each cell has the percentage of responses that take <= the time in the header and max is the max response time in seconds. For the max column values in the top 25% of the range have a red background and in the bottom 25% of the range have a green background. The red background is not used when the min value is within 80% of the max value.
| dbms | 256us | 1ms | 4ms | 16ms | 64ms | 256ms | 1s | 4s | 16s | gt | max |
|---|---|---|---|---|---|---|---|---|---|---|---|
| pg174_o2nofp.cx10a_c32r128 | 22.106 | 74.754 | 2.882 | 0.254 | 0.004 | nonzero | 0.844 | ||||
| pg18beta1_o2nofp.cx10b_c32r128 | 21.232 | 75.732 | 2.696 | 0.336 | 0.004 | nonzero | 0.392 | ||||
| pg18beta1_o2nofp.cx10cw4_c32r128 | 22.036 | 75.123 | 2.493 | 0.345 | 0.003 | 0.001 | 0.680 | ||||
| pg18beta1_o2nofp.cx10d_c32r128 | 21.859 | 75.230 | 2.554 | 0.352 | 0.004 | nonzero | 0.886 |
Performance metrics for the DBMS listed above. Some are normalized by throughput, others are not. Legend for results is here.
ips	qps	rps	rmbps	wps	wmbps	rpq	rkbpq	wpi	wkbpi	csps	cpups	cspq	cpupq	dbgb1	dbgb2	rss	maxop	p50	p99	tag
390720	0	599	2.7	6383.1	607.7	0.002	0.007	0.016	1.593	254003	52.4	0.650	64	56.2	152.2	39.3	0.844	22676	3347	pg174_o2nofp.cx10a_c32r128
397516	0	104	0.8	6508.5	618.7	0.000	0.002	0.016	1.594	241744	53.5	0.608	65	56.3	152.4	33.6	0.407	23125	3346	pg18beta1_o2nofp.cx10b_c32r128
405577	0	88	0.5	6651.7	631.3	0.000	0.001	0.016	1.594	250240	53.6	0.617	63	56.0	152.0	43.2	0.681	23237	3596	pg18beta1_o2nofp.cx10cw4_c32r128
403023	0	116	0.9	6611.3	630.4	0.000	0.002	0.016	1.602	247532	53.6	0.614	64	56.0	152.1	25.6	0.916	23175	3346	pg18beta1_o2nofp.cx10d_c32r128
l.i2
l.i2: continue load after secondary indexes created with 5 inserts per transaction. Graphs for performance per 1-second interval are here.
Average throughput:
Insert response time histogram: each cell has the percentage of responses that take <= the time in the header and max is the max response time in seconds. For the max column values in the top 25% of the range have a red background and in the bottom 25% of the range have a green background. The red background is not used when the min value is within 80% of the max value.
| dbms | 256us | 1ms | 4ms | 16ms | 64ms | 256ms | 1s | 4s | 16s | gt | max |
|---|---|---|---|---|---|---|---|---|---|---|---|
| pg174_o2nofp.cx10a_c32r128 | 91.364 | 8.333 | 0.291 | 0.013 | nonzero | nonzero | 0.071 | ||||
| pg18beta1_o2nofp.cx10b_c32r128 | 91.006 | 8.700 | 0.270 | 0.024 | nonzero | 0.061 | |||||
| pg18beta1_o2nofp.cx10cw4_c32r128 | 90.285 | 9.384 | 0.302 | 0.028 | nonzero | nonzero | 0.083 | ||||
| pg18beta1_o2nofp.cx10d_c32r128 | 91.354 | 8.365 | 0.269 | 0.012 | nonzero | 0.024 |
Delete response time histogram: each cell has the percentage of responses that take <= the time in the header and max is the max response time in seconds. For the max column values in the top 25% of the range have a red background and in the bottom 25% of the range have a green background. The red background is not used when the min value is within 80% of the max value.
| dbms | 256us | 1ms | 4ms | 16ms | 64ms | 256ms | 1s | 4s | 16s | gt | max |
|---|---|---|---|---|---|---|---|---|---|---|---|
| pg174_o2nofp.cx10a_c32r128 | 3.432 | 56.307 | 40.217 | 0.044 | nonzero | nonzero | 0.071 | ||||
| pg18beta1_o2nofp.cx10b_c32r128 | 2.743 | 62.254 | 34.942 | 0.061 | 0.001 | 0.061 | |||||
| pg18beta1_o2nofp.cx10cw4_c32r128 | 2.684 | 62.080 | 35.169 | 0.066 | 0.001 | nonzero | 0.083 | ||||
| pg18beta1_o2nofp.cx10d_c32r128 | 2.748 | 60.867 | 36.342 | 0.043 | nonzero | 0.026 |
Performance metrics for the DBMS listed above. Some are normalized by throughput, others are not. Legend for results is here.
ips	qps	rps	rmbps	wps	wmbps	rpq	rkbpq	wpi	wkbpi	csps	cpups	cspq	cpupq	dbgb1	dbgb2	rss	maxop	p50	p99	tag
103896	0	1	0.0	1599.5	153.2	0.000	0.000	0.015	1.510	396232	53.2	3.814	246	56.4	152.5	16.0	0.071	4985	3626	pg174_o2nofp.cx10a_c32r128
103761	0	2	0.0	1593.2	152.6	0.000	0.000	0.015	1.506	393921	53.0	3.796	245	56.5	152.6	35.8	0.061	4760	2322	pg18beta1_o2nofp.cx10b_c32r128
108108	0	1	0.0	1625.9	155.6	0.000	0.000	0.015	1.474	407335	54.7	3.768	243	56.0	152.1	5.9	0.083	4365	2487	pg18beta1_o2nofp.cx10cw4_c32r128
104439	0	1	0.0	1556.5	149.3	0.000	0.000	0.015	1.464	397208	53.3	3.803	245	56.3	152.4	2.5	0.024	4605	2762	pg18beta1_o2nofp.cx10d_c32r128
qr100.L1
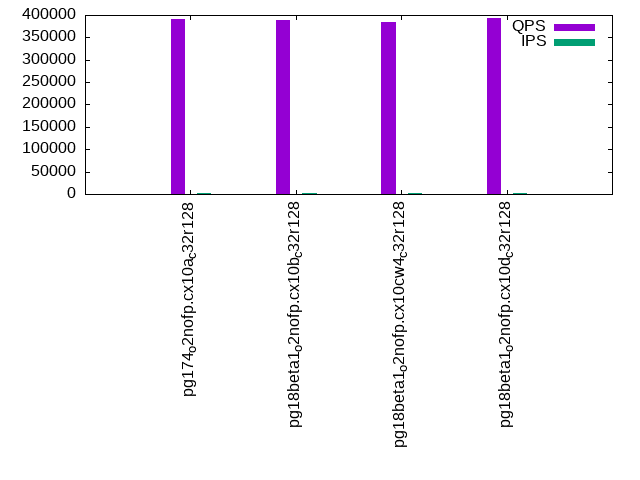
qr100.L1: range queries with 100 insert/s per client. Graphs for performance per 1-second interval are here.
Average throughput:
Query response time histogram: each cell has the percentage of responses that take <= the time in the header and max is the max response time in seconds. For max values in the top 25% of the range have a red background and in the bottom 25% of the range have a green background. The red background is not used when the min value is within 80% of the max value.
| dbms | 256us | 1ms | 4ms | 16ms | 64ms | 256ms | 1s | 4s | 16s | gt | max |
|---|---|---|---|---|---|---|---|---|---|---|---|
| pg174_o2nofp.cx10a_c32r128 | 99.997 | 0.002 | 0.002 | nonzero | 0.008 | ||||||
| pg18beta1_o2nofp.cx10b_c32r128 | 99.997 | 0.002 | 0.001 | nonzero | nonzero | 0.016 | |||||
| pg18beta1_o2nofp.cx10cw4_c32r128 | 99.997 | 0.002 | 0.001 | nonzero | nonzero | 0.024 | |||||
| pg18beta1_o2nofp.cx10d_c32r128 | 99.997 | 0.002 | 0.001 | nonzero | 0.008 |
Insert response time histogram: each cell has the percentage of responses that take <= the time in the header and max is the max response time in seconds. For max values in the top 25% of the range have a red background and in the bottom 25% of the range have a green background. The red background is not used when the min value is within 80% of the max value.
| dbms | 256us | 1ms | 4ms | 16ms | 64ms | 256ms | 1s | 4s | 16s | gt | max |
|---|---|---|---|---|---|---|---|---|---|---|---|
| pg174_o2nofp.cx10a_c32r128 | 0.006 | 99.689 | 0.306 | 0.009 | |||||||
| pg18beta1_o2nofp.cx10b_c32r128 | 0.006 | 99.686 | 0.308 | 0.014 | |||||||
| pg18beta1_o2nofp.cx10cw4_c32r128 | 0.014 | 99.707 | 0.279 | 0.010 | |||||||
| pg18beta1_o2nofp.cx10d_c32r128 | 0.004 | 99.694 | 0.301 | 0.011 |
Delete response time histogram: each cell has the percentage of responses that take <= the time in the header and max is the max response time in seconds. For max values in the top 25% of the range have a red background and in the bottom 25% of the range have a green background. The red background is not used when the min value is within 80% of the max value.
| dbms | 256us | 1ms | 4ms | 16ms | 64ms | 256ms | 1s | 4s | 16s | gt | max |
|---|---|---|---|---|---|---|---|---|---|---|---|
| pg174_o2nofp.cx10a_c32r128 | 66.753 | 33.229 | 0.018 | 0.009 | |||||||
| pg18beta1_o2nofp.cx10b_c32r128 | 66.628 | 33.357 | 0.015 | 0.008 | |||||||
| pg18beta1_o2nofp.cx10cw4_c32r128 | 67.350 | 32.628 | 0.022 | 0.010 | |||||||
| pg18beta1_o2nofp.cx10d_c32r128 | 65.475 | 34.489 | 0.036 | 0.007 |
Performance metrics for the DBMS listed above. Some are normalized by throughput, others are not. Legend for results is here.
ips	qps	rps	rmbps	wps	wmbps	rpq	rkbpq	wpi	wkbpi	csps	cpups	cspq	cpupq	dbgb1	dbgb2	rss	maxop	p50	p99	tag
1977	390336	0	0.0	121.3	10.4	0.000	0.000	0.061	5.410	1483684	42.6	3.801	52	56.4	152.5	0.5	0.008	19930	18060	pg174_o2nofp.cx10a_c32r128
1978	389206	0	0.0	122.2	10.4	0.000	0.000	0.062	5.394	1478663	42.5	3.799	52	56.5	152.6	0.4	0.016	19850	17971	pg18beta1_o2nofp.cx10b_c32r128
1977	384972	0	0.0	121.6	10.4	0.000	0.000	0.062	5.410	1463328	42.6	3.801	53	56.0	152.0	0.5	0.024	19426	17725	pg18beta1_o2nofp.cx10cw4_c32r128
1977	394180	0	0.0	123.1	10.4	0.000	0.000	0.062	5.409	1498386	42.6	3.801	52	56.3	152.3	0.5	0.008	19819	18316	pg18beta1_o2nofp.cx10d_c32r128
qp100.L2
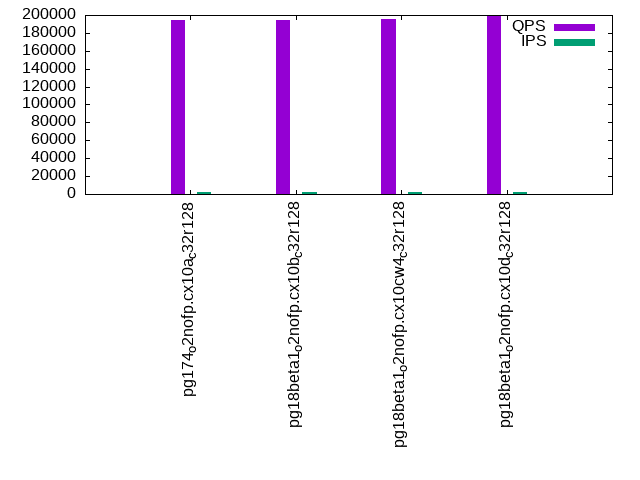
qp100.L2: point queries with 100 insert/s per client. Graphs for performance per 1-second interval are here.
Average throughput:
Query response time histogram: each cell has the percentage of responses that take <= the time in the header and max is the max response time in seconds. For max values in the top 25% of the range have a red background and in the bottom 25% of the range have a green background. The red background is not used when the min value is within 80% of the max value.
| dbms | 256us | 1ms | 4ms | 16ms | 64ms | 256ms | 1s | 4s | 16s | gt | max |
|---|---|---|---|---|---|---|---|---|---|---|---|
| pg174_o2nofp.cx10a_c32r128 | 99.986 | 0.011 | 0.003 | nonzero | 0.006 | ||||||
| pg18beta1_o2nofp.cx10b_c32r128 | 99.984 | 0.012 | 0.003 | nonzero | 0.008 | ||||||
| pg18beta1_o2nofp.cx10cw4_c32r128 | 99.986 | 0.011 | 0.003 | nonzero | 0.006 | ||||||
| pg18beta1_o2nofp.cx10d_c32r128 | 99.986 | 0.011 | 0.003 | nonzero | 0.012 |
Insert response time histogram: each cell has the percentage of responses that take <= the time in the header and max is the max response time in seconds. For max values in the top 25% of the range have a red background and in the bottom 25% of the range have a green background. The red background is not used when the min value is within 80% of the max value.
| dbms | 256us | 1ms | 4ms | 16ms | 64ms | 256ms | 1s | 4s | 16s | gt | max |
|---|---|---|---|---|---|---|---|---|---|---|---|
| pg174_o2nofp.cx10a_c32r128 | 99.596 | 0.404 | 0.010 | ||||||||
| pg18beta1_o2nofp.cx10b_c32r128 | 99.679 | 0.321 | 0.012 | ||||||||
| pg18beta1_o2nofp.cx10cw4_c32r128 | 99.722 | 0.278 | 0.009 | ||||||||
| pg18beta1_o2nofp.cx10d_c32r128 | 99.631 | 0.369 | 0.011 |
Delete response time histogram: each cell has the percentage of responses that take <= the time in the header and max is the max response time in seconds. For max values in the top 25% of the range have a red background and in the bottom 25% of the range have a green background. The red background is not used when the min value is within 80% of the max value.
| dbms | 256us | 1ms | 4ms | 16ms | 64ms | 256ms | 1s | 4s | 16s | gt | max |
|---|---|---|---|---|---|---|---|---|---|---|---|
| pg174_o2nofp.cx10a_c32r128 | 22.396 | 77.486 | 0.118 | 0.012 | |||||||
| pg18beta1_o2nofp.cx10b_c32r128 | 19.028 | 80.861 | 0.111 | 0.010 | |||||||
| pg18beta1_o2nofp.cx10cw4_c32r128 | 22.254 | 77.649 | 0.097 | 0.010 | |||||||
| pg18beta1_o2nofp.cx10d_c32r128 | 22.185 | 77.719 | 0.096 | 0.010 |
Performance metrics for the DBMS listed above. Some are normalized by throughput, others are not. Legend for results is here.
ips	qps	rps	rmbps	wps	wmbps	rpq	rkbpq	wpi	wkbpi	csps	cpups	cspq	cpupq	dbgb1	dbgb2	rss	maxop	p50	p99	tag
1977	194871	0	0.0	338.6	17.8	0.000	0.000	0.171	9.233	749889	41.5	3.848	102	56.4	149.3	0.5	0.006	9973	9430	pg174_o2nofp.cx10a_c32r128
1976	193978	0	0.0	341.7	17.9	0.000	0.000	0.173	9.264	746610	41.5	3.849	103	56.5	149.4	0.5	0.008	9925	9334	pg18beta1_o2nofp.cx10b_c32r128
1977	195740	0	0.0	340.6	17.8	0.000	0.000	0.172	9.223	753316	41.3	3.849	101	56.0	148.9	0.5	0.006	10012	9462	pg18beta1_o2nofp.cx10cw4_c32r128
1976	198592	0	0.0	340.7	17.8	0.000	0.000	0.172	9.251	764650	41.5	3.850	100	56.3	149.2	0.5	0.012	10197	9558	pg18beta1_o2nofp.cx10d_c32r128
qr500.L3
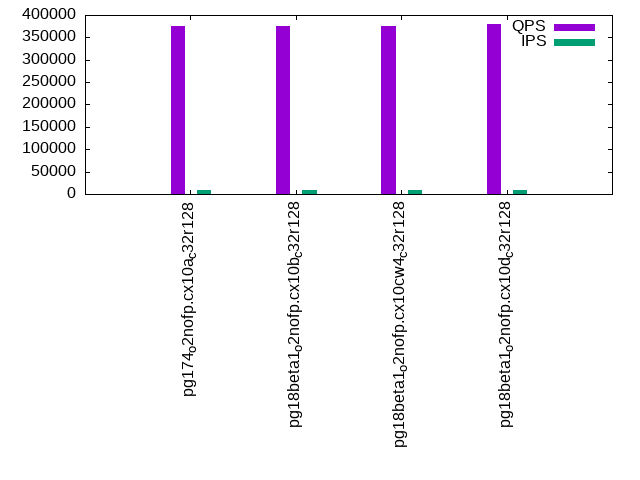
qr500.L3: range queries with 500 insert/s per client. Graphs for performance per 1-second interval are here.
Average throughput:
Query response time histogram: each cell has the percentage of responses that take <= the time in the header and max is the max response time in seconds. For max values in the top 25% of the range have a red background and in the bottom 25% of the range have a green background. The red background is not used when the min value is within 80% of the max value.
| dbms | 256us | 1ms | 4ms | 16ms | 64ms | 256ms | 1s | 4s | 16s | gt | max |
|---|---|---|---|---|---|---|---|---|---|---|---|
| pg174_o2nofp.cx10a_c32r128 | 99.987 | 0.006 | 0.007 | nonzero | nonzero | nonzero | 0.078 | ||||
| pg18beta1_o2nofp.cx10b_c32r128 | 99.987 | 0.006 | 0.007 | nonzero | nonzero | nonzero | 0.082 | ||||
| pg18beta1_o2nofp.cx10cw4_c32r128 | 99.987 | 0.006 | 0.007 | nonzero | nonzero | nonzero | 0.072 | ||||
| pg18beta1_o2nofp.cx10d_c32r128 | 99.987 | 0.006 | 0.007 | nonzero | nonzero | 0.018 |
Insert response time histogram: each cell has the percentage of responses that take <= the time in the header and max is the max response time in seconds. For max values in the top 25% of the range have a red background and in the bottom 25% of the range have a green background. The red background is not used when the min value is within 80% of the max value.
| dbms | 256us | 1ms | 4ms | 16ms | 64ms | 256ms | 1s | 4s | 16s | gt | max |
|---|---|---|---|---|---|---|---|---|---|---|---|
| pg174_o2nofp.cx10a_c32r128 | 8.078 | 91.113 | 0.778 | 0.031 | 0.038 | ||||||
| pg18beta1_o2nofp.cx10b_c32r128 | 9.953 | 89.061 | 0.937 | 0.049 | 0.045 | ||||||
| pg18beta1_o2nofp.cx10cw4_c32r128 | 10.629 | 88.319 | 1.016 | 0.036 | 0.033 | ||||||
| pg18beta1_o2nofp.cx10d_c32r128 | 8.952 | 90.112 | 0.898 | 0.037 | 0.034 |
Delete response time histogram: each cell has the percentage of responses that take <= the time in the header and max is the max response time in seconds. For max values in the top 25% of the range have a red background and in the bottom 25% of the range have a green background. The red background is not used when the min value is within 80% of the max value.
| dbms | 256us | 1ms | 4ms | 16ms | 64ms | 256ms | 1s | 4s | 16s | gt | max |
|---|---|---|---|---|---|---|---|---|---|---|---|
| pg174_o2nofp.cx10a_c32r128 | 53.013 | 46.437 | 0.539 | 0.011 | 0.028 | ||||||
| pg18beta1_o2nofp.cx10b_c32r128 | 50.036 | 49.353 | 0.589 | 0.021 | 0.033 | ||||||
| pg18beta1_o2nofp.cx10cw4_c32r128 | 52.047 | 47.276 | 0.661 | 0.016 | 0.023 | ||||||
| pg18beta1_o2nofp.cx10d_c32r128 | 50.064 | 49.347 | 0.573 | 0.016 | 0.023 |
Performance metrics for the DBMS listed above. Some are normalized by throughput, others are not. Legend for results is here.
ips	qps	rps	rmbps	wps	wmbps	rpq	rkbpq	wpi	wkbpi	csps	cpups	cspq	cpupq	dbgb1	dbgb2	rss	maxop	p50	p99	tag
9885	375502	0	0.0	509.4	27.4	0.000	0.000	0.052	2.841	1421582	43.2	3.786	55	56.5	142.7	26.6	0.078	19051	16868	pg174_o2nofp.cx10a_c32r128
9885	375689	0	0.0	515.7	27.8	0.000	0.000	0.052	2.882	1422585	43.2	3.787	55	56.3	142.4	6.7	0.082	19084	16670	pg18beta1_o2nofp.cx10b_c32r128
9885	374394	8	0.3	529.6	28.3	0.000	0.001	0.054	2.930	1416862	43.3	3.784	56	56.1	142.2	17.6	0.072	19051	16725	pg18beta1_o2nofp.cx10cw4_c32r128
9885	380308	0	0.0	513.7	27.9	0.000	0.000	0.052	2.888	1439708	43.3	3.786	55	56.3	142.6	14.2	0.018	19291	16766	pg18beta1_o2nofp.cx10d_c32r128
qp500.L4
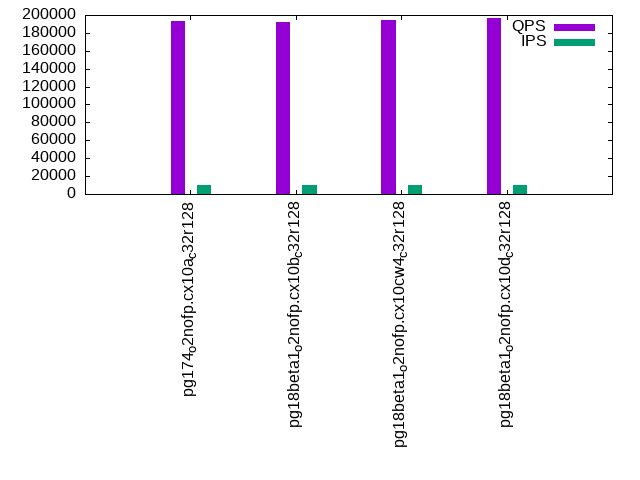
qp500.L4: point queries with 500 insert/s per client. Graphs for performance per 1-second interval are here.
Average throughput:
Query response time histogram: each cell has the percentage of responses that take <= the time in the header and max is the max response time in seconds. For max values in the top 25% of the range have a red background and in the bottom 25% of the range have a green background. The red background is not used when the min value is within 80% of the max value.
| dbms | 256us | 1ms | 4ms | 16ms | 64ms | 256ms | 1s | 4s | 16s | gt | max |
|---|---|---|---|---|---|---|---|---|---|---|---|
| pg174_o2nofp.cx10a_c32r128 | 99.965 | 0.024 | 0.011 | nonzero | nonzero | nonzero | 0.099 | ||||
| pg18beta1_o2nofp.cx10b_c32r128 | 99.963 | 0.026 | 0.011 | nonzero | nonzero | nonzero | 0.067 | ||||
| pg18beta1_o2nofp.cx10cw4_c32r128 | 99.965 | 0.024 | 0.011 | nonzero | nonzero | nonzero | 0.102 | ||||
| pg18beta1_o2nofp.cx10d_c32r128 | 99.963 | 0.025 | 0.011 | nonzero | nonzero | nonzero | 0.093 |
Insert response time histogram: each cell has the percentage of responses that take <= the time in the header and max is the max response time in seconds. For max values in the top 25% of the range have a red background and in the bottom 25% of the range have a green background. The red background is not used when the min value is within 80% of the max value.
| dbms | 256us | 1ms | 4ms | 16ms | 64ms | 256ms | 1s | 4s | 16s | gt | max |
|---|---|---|---|---|---|---|---|---|---|---|---|
| pg174_o2nofp.cx10a_c32r128 | 10.888 | 88.254 | 0.828 | 0.029 | 0.001 | 0.099 | |||||
| pg18beta1_o2nofp.cx10b_c32r128 | 9.210 | 90.094 | 0.682 | 0.015 | 0.034 | ||||||
| pg18beta1_o2nofp.cx10cw4_c32r128 | 10.469 | 88.743 | 0.751 | 0.037 | 0.039 | ||||||
| pg18beta1_o2nofp.cx10d_c32r128 | 7.941 | 91.395 | 0.634 | 0.031 | 0.038 |
Delete response time histogram: each cell has the percentage of responses that take <= the time in the header and max is the max response time in seconds. For max values in the top 25% of the range have a red background and in the bottom 25% of the range have a green background. The red background is not used when the min value is within 80% of the max value.
| dbms | 256us | 1ms | 4ms | 16ms | 64ms | 256ms | 1s | 4s | 16s | gt | max |
|---|---|---|---|---|---|---|---|---|---|---|---|
| pg174_o2nofp.cx10a_c32r128 | 47.846 | 51.559 | 0.572 | 0.022 | 0.001 | 0.095 | |||||
| pg18beta1_o2nofp.cx10b_c32r128 | 45.715 | 53.759 | 0.515 | 0.011 | 0.036 | ||||||
| pg18beta1_o2nofp.cx10cw4_c32r128 | 47.563 | 51.838 | 0.567 | 0.032 | 0.030 | ||||||
| pg18beta1_o2nofp.cx10d_c32r128 | 45.886 | 53.546 | 0.543 | 0.025 | 0.036 |
Performance metrics for the DBMS listed above. Some are normalized by throughput, others are not. Legend for results is here.
ips	qps	rps	rmbps	wps	wmbps	rpq	rkbpq	wpi	wkbpi	csps	cpups	cspq	cpupq	dbgb1	dbgb2	rss	maxop	p50	p99	tag
9885	193163	0	0.0	340.1	29.2	0.000	0.000	0.034	3.020	741791	41.8	3.840	104	56.3	138.5	24.3	0.099	9834	8985	pg174_o2nofp.cx10a_c32r128
9885	192471	0	0.0	340.6	27.7	0.000	0.000	0.034	2.868	738966	41.8	3.839	104	56.3	138.4	4.5	0.067	9817	8918	pg18beta1_o2nofp.cx10b_c32r128
9879	194024	0	0.0	342.3	27.6	0.000	0.000	0.035	2.862	745845	41.8	3.844	103	56.0	138.1	10.2	0.102	9988	9158	pg18beta1_o2nofp.cx10cw4_c32r128
9885	196382	0	0.0	341.3	27.6	0.000	0.000	0.035	2.855	753773	41.9	3.838	102	56.4	138.5	1.9	0.093	10069	9046	pg18beta1_o2nofp.cx10d_c32r128
qr1000.L5
qr1000.L5: range queries with 1000 insert/s per client. Graphs for performance per 1-second interval are here.
Average throughput:
Query response time histogram: each cell has the percentage of responses that take <= the time in the header and max is the max response time in seconds. For max values in the top 25% of the range have a red background and in the bottom 25% of the range have a green background. The red background is not used when the min value is within 80% of the max value.
| dbms | 256us | 1ms | 4ms | 16ms | 64ms | 256ms | 1s | 4s | 16s | gt | max |
|---|---|---|---|---|---|---|---|---|---|---|---|
| pg174_o2nofp.cx10a_c32r128 | 99.977 | 0.012 | 0.011 | nonzero | nonzero | nonzero | 0.100 | ||||
| pg18beta1_o2nofp.cx10b_c32r128 | 99.976 | 0.013 | 0.011 | nonzero | nonzero | nonzero | 0.103 | ||||
| pg18beta1_o2nofp.cx10cw4_c32r128 | 99.976 | 0.013 | 0.011 | nonzero | nonzero | nonzero | 0.089 | ||||
| pg18beta1_o2nofp.cx10d_c32r128 | 99.976 | 0.013 | 0.011 | nonzero | nonzero | nonzero | 0.095 |
Insert response time histogram: each cell has the percentage of responses that take <= the time in the header and max is the max response time in seconds. For max values in the top 25% of the range have a red background and in the bottom 25% of the range have a green background. The red background is not used when the min value is within 80% of the max value.
| dbms | 256us | 1ms | 4ms | 16ms | 64ms | 256ms | 1s | 4s | 16s | gt | max |
|---|---|---|---|---|---|---|---|---|---|---|---|
| pg174_o2nofp.cx10a_c32r128 | 24.003 | 75.468 | 0.524 | 0.005 | 0.056 | ||||||
| pg18beta1_o2nofp.cx10b_c32r128 | 33.605 | 65.827 | 0.549 | 0.019 | 0.038 | ||||||
| pg18beta1_o2nofp.cx10cw4_c32r128 | 35.736 | 63.760 | 0.489 | 0.016 | 0.044 | ||||||
| pg18beta1_o2nofp.cx10d_c32r128 | 28.632 | 70.734 | 0.601 | 0.033 | 0.035 |
Delete response time histogram: each cell has the percentage of responses that take <= the time in the header and max is the max response time in seconds. For max values in the top 25% of the range have a red background and in the bottom 25% of the range have a green background. The red background is not used when the min value is within 80% of the max value.
| dbms | 256us | 1ms | 4ms | 16ms | 64ms | 256ms | 1s | 4s | 16s | gt | max |
|---|---|---|---|---|---|---|---|---|---|---|---|
| pg174_o2nofp.cx10a_c32r128 | 52.723 | 46.965 | 0.309 | 0.003 | 0.057 | ||||||
| pg18beta1_o2nofp.cx10b_c32r128 | 51.887 | 47.677 | 0.428 | 0.008 | 0.028 | ||||||
| pg18beta1_o2nofp.cx10cw4_c32r128 | 54.066 | 45.533 | 0.391 | 0.010 | 0.030 | ||||||
| pg18beta1_o2nofp.cx10d_c32r128 | 53.291 | 46.219 | 0.472 | 0.018 | 0.027 |
Performance metrics for the DBMS listed above. Some are normalized by throughput, others are not. Legend for results is here.
ips	qps	rps	rmbps	wps	wmbps	rpq	rkbpq	wpi	wkbpi	csps	cpups	cspq	cpupq	dbgb1	dbgb2	rss	maxop	p50	p99	tag
19758	371113	0	0.0	394.8	33.5	0.000	0.000	0.020	1.734	1400382	44.1	3.773	57	56.2	134.6	14.2	0.100	18923	16829	pg174_o2nofp.cx10a_c32r128
19758	372868	0	0.0	413.2	35.6	0.000	0.000	0.021	1.846	1408402	44.2	3.777	57	56.1	134.7	4.1	0.103	18907	16462	pg18beta1_o2nofp.cx10b_c32r128
19758	368807	0	0.0	410.4	35.2	0.000	0.000	0.021	1.825	1392292	44.2	3.775	58	56.1	134.6	11.3	0.089	18626	16334	pg18beta1_o2nofp.cx10cw4_c32r128
19758	376557	0	0.0	406.7	35.2	0.000	0.000	0.021	1.826	1421573	44.2	3.775	56	56.3	134.9	3.7	0.095	18860	16430	pg18beta1_o2nofp.cx10d_c32r128
qp1000.L6
qp1000.L6: point queries with 1000 insert/s per client. Graphs for performance per 1-second interval are here.
Average throughput:
Query response time histogram: each cell has the percentage of responses that take <= the time in the header and max is the max response time in seconds. For max values in the top 25% of the range have a red background and in the bottom 25% of the range have a green background. The red background is not used when the min value is within 80% of the max value.
| dbms | 256us | 1ms | 4ms | 16ms | 64ms | 256ms | 1s | 4s | 16s | gt | max |
|---|---|---|---|---|---|---|---|---|---|---|---|
| pg174_o2nofp.cx10a_c32r128 | 99.935 | 0.046 | 0.019 | nonzero | nonzero | nonzero | 0.091 | ||||
| pg18beta1_o2nofp.cx10b_c32r128 | 99.934 | 0.048 | 0.018 | nonzero | nonzero | nonzero | 0.090 | ||||
| pg18beta1_o2nofp.cx10cw4_c32r128 | 99.935 | 0.046 | 0.018 | nonzero | nonzero | nonzero | 0.099 | ||||
| pg18beta1_o2nofp.cx10d_c32r128 | 99.934 | 0.047 | 0.018 | nonzero | nonzero | nonzero | 0.090 |
Insert response time histogram: each cell has the percentage of responses that take <= the time in the header and max is the max response time in seconds. For max values in the top 25% of the range have a red background and in the bottom 25% of the range have a green background. The red background is not used when the min value is within 80% of the max value.
| dbms | 256us | 1ms | 4ms | 16ms | 64ms | 256ms | 1s | 4s | 16s | gt | max |
|---|---|---|---|---|---|---|---|---|---|---|---|
| pg174_o2nofp.cx10a_c32r128 | 28.902 | 70.448 | 0.618 | 0.032 | 0.054 | ||||||
| pg18beta1_o2nofp.cx10b_c32r128 | 32.923 | 66.491 | 0.563 | 0.024 | 0.040 | ||||||
| pg18beta1_o2nofp.cx10cw4_c32r128 | 34.870 | 64.532 | 0.575 | 0.024 | 0.038 | ||||||
| pg18beta1_o2nofp.cx10d_c32r128 | 27.242 | 72.243 | 0.486 | 0.029 | 0.042 |
Delete response time histogram: each cell has the percentage of responses that take <= the time in the header and max is the max response time in seconds. For max values in the top 25% of the range have a red background and in the bottom 25% of the range have a green background. The red background is not used when the min value is within 80% of the max value.
| dbms | 256us | 1ms | 4ms | 16ms | 64ms | 256ms | 1s | 4s | 16s | gt | max |
|---|---|---|---|---|---|---|---|---|---|---|---|
| pg174_o2nofp.cx10a_c32r128 | 55.047 | 44.443 | 0.491 | 0.019 | 0.039 | ||||||
| pg18beta1_o2nofp.cx10b_c32r128 | 52.965 | 46.444 | 0.572 | 0.018 | 0.038 | ||||||
| pg18beta1_o2nofp.cx10cw4_c32r128 | 55.415 | 44.044 | 0.526 | 0.015 | 0.035 | ||||||
| pg18beta1_o2nofp.cx10d_c32r128 | 56.815 | 42.451 | 0.707 | 0.027 | 0.038 |
Performance metrics for the DBMS listed above. Some are normalized by throughput, others are not. Legend for results is here.
ips	qps	rps	rmbps	wps	wmbps	rpq	rkbpq	wpi	wkbpi	csps	cpups	cspq	cpupq	dbgb1	dbgb2	rss	maxop	p50	p99	tag
19758	191529	0	0.0	403.2	35.8	0.000	0.000	0.020	1.855	734938	42.8	3.837	107	56.2	133.5	39.6	0.091	9760	8790	pg174_o2nofp.cx10a_c32r128
19758	190806	0	0.0	396.7	34.9	0.000	0.000	0.020	1.809	732243	42.9	3.838	108	56.0	133.3	7.7	0.090	9706	8694	pg18beta1_o2nofp.cx10b_c32r128
19758	192294	0	0.0	397.0	34.8	0.000	0.000	0.020	1.802	738019	42.9	3.838	107	55.9	133.2	18.4	0.099	9861	8794	pg18beta1_o2nofp.cx10cw4_c32r128
19748	194336	0	0.0	400.3	35.1	0.000	0.000	0.020	1.819	745712	43.0	3.837	106	56.2	133.6	1.9	0.090	9861	8827	pg18beta1_o2nofp.cx10d_c32r128
l.i0
l.i0: load without secondary indexes
Performance metrics for all DBMS, not just the ones listed above. Some are normalized by throughput, others are not. Legend for results is here.
ips	qps	rps	rmbps	wps	wmbps	rpq	rkbpq	wpi	wkbpi	csps	cpups	cspq	cpupq	dbgb1	dbgb2	rss	maxop	p50	p99	tag
1680672	0	3	0.0	6619.0	701.8	0.000	0.000	0.004	0.428	277493	44.4	0.165	13	19.1	51.7	12.8	0.385	110581	33864	pg174_o2nofp.cx10a_c32r128
1694915	0	3	0.0	6881.1	724.6	0.000	0.000	0.004	0.438	256212	45.9	0.151	13	19.1	51.7	1.4	0.659	113536	54542	pg18beta1_o2nofp.cx10b_c32r128
1724138	0	3	0.0	6869.8	724.2	0.000	0.000	0.004	0.430	251935	45.6	0.146	13	19.1	51.7	7.8	0.664	115076	31546	pg18beta1_o2nofp.cx10cw4_c32r128
1709402	0	3	0.0	6878.6	722.2	0.000	0.000	0.004	0.433	253094	45.5	0.148	13	19.1	51.7	8.0	0.778	115111	42853	pg18beta1_o2nofp.cx10d_c32r128
l.x
l.x: create secondary indexes
Performance metrics for all DBMS, not just the ones listed above. Some are normalized by throughput, others are not. Legend for results is here.
ips	qps	rps	rmbps	wps	wmbps	rpq	rkbpq	wpi	wkbpi	csps	cpups	cspq	cpupq	dbgb1	dbgb2	rss	maxop	p50	p99	tag
2777779	0	4	0.0	7177.8	833.9	0.000	0.000	0.003	0.307	43819	15.8	0.016	3	38.4	88.5	7.1	0.027	NA	NA	pg174_o2nofp.cx10a_c32r128
2739727	0	4	0.0	6901.1	802.3	0.000	0.000	0.003	0.300	34138	14.9	0.012	3	38.4	88.5	7.1	0.035	NA	NA	pg18beta1_o2nofp.cx10b_c32r128
2702704	0	4	0.0	6851.4	795.7	0.000	0.000	0.003	0.301	35396	15.1	0.013	3	38.4	88.5	6.4	0.025	NA	NA	pg18beta1_o2nofp.cx10cw4_c32r128
2702704	0	4	0.0	6861.0	797.8	0.000	0.000	0.003	0.302	34312	15.1	0.013	3	38.4	88.5	7.1	0.045	NA	NA	pg18beta1_o2nofp.cx10d_c32r128
l.i1
l.i1: continue load after secondary indexes created with 50 inserts per transaction
Performance metrics for all DBMS, not just the ones listed above. Some are normalized by throughput, others are not. Legend for results is here.
ips	qps	rps	rmbps	wps	wmbps	rpq	rkbpq	wpi	wkbpi	csps	cpups	cspq	cpupq	dbgb1	dbgb2	rss	maxop	p50	p99	tag
390720	0	599	2.7	6383.1	607.7	0.002	0.007	0.016	1.593	254003	52.4	0.650	64	56.2	152.2	39.3	0.844	22676	3347	pg174_o2nofp.cx10a_c32r128
397516	0	104	0.8	6508.5	618.7	0.000	0.002	0.016	1.594	241744	53.5	0.608	65	56.3	152.4	33.6	0.407	23125	3346	pg18beta1_o2nofp.cx10b_c32r128
405577	0	88	0.5	6651.7	631.3	0.000	0.001	0.016	1.594	250240	53.6	0.617	63	56.0	152.0	43.2	0.681	23237	3596	pg18beta1_o2nofp.cx10cw4_c32r128
403023	0	116	0.9	6611.3	630.4	0.000	0.002	0.016	1.602	247532	53.6	0.614	64	56.0	152.1	25.6	0.916	23175	3346	pg18beta1_o2nofp.cx10d_c32r128
l.i2
l.i2: continue load after secondary indexes created with 5 inserts per transaction
Performance metrics for all DBMS, not just the ones listed above. Some are normalized by throughput, others are not. Legend for results is here.
ips	qps	rps	rmbps	wps	wmbps	rpq	rkbpq	wpi	wkbpi	csps	cpups	cspq	cpupq	dbgb1	dbgb2	rss	maxop	p50	p99	tag
103896	0	1	0.0	1599.5	153.2	0.000	0.000	0.015	1.510	396232	53.2	3.814	246	56.4	152.5	16.0	0.071	4985	3626	pg174_o2nofp.cx10a_c32r128
103761	0	2	0.0	1593.2	152.6	0.000	0.000	0.015	1.506	393921	53.0	3.796	245	56.5	152.6	35.8	0.061	4760	2322	pg18beta1_o2nofp.cx10b_c32r128
108108	0	1	0.0	1625.9	155.6	0.000	0.000	0.015	1.474	407335	54.7	3.768	243	56.0	152.1	5.9	0.083	4365	2487	pg18beta1_o2nofp.cx10cw4_c32r128
104439	0	1	0.0	1556.5	149.3	0.000	0.000	0.015	1.464	397208	53.3	3.803	245	56.3	152.4	2.5	0.024	4605	2762	pg18beta1_o2nofp.cx10d_c32r128
qr100.L1
qr100.L1: range queries with 100 insert/s per client
Performance metrics for all DBMS, not just the ones listed above. Some are normalized by throughput, others are not. Legend for results is here.
ips	qps	rps	rmbps	wps	wmbps	rpq	rkbpq	wpi	wkbpi	csps	cpups	cspq	cpupq	dbgb1	dbgb2	rss	maxop	p50	p99	tag
1977	390336	0	0.0	121.3	10.4	0.000	0.000	0.061	5.410	1483684	42.6	3.801	52	56.4	152.5	0.5	0.008	19930	18060	pg174_o2nofp.cx10a_c32r128
1978	389206	0	0.0	122.2	10.4	0.000	0.000	0.062	5.394	1478663	42.5	3.799	52	56.5	152.6	0.4	0.016	19850	17971	pg18beta1_o2nofp.cx10b_c32r128
1977	384972	0	0.0	121.6	10.4	0.000	0.000	0.062	5.410	1463328	42.6	3.801	53	56.0	152.0	0.5	0.024	19426	17725	pg18beta1_o2nofp.cx10cw4_c32r128
1977	394180	0	0.0	123.1	10.4	0.000	0.000	0.062	5.409	1498386	42.6	3.801	52	56.3	152.3	0.5	0.008	19819	18316	pg18beta1_o2nofp.cx10d_c32r128
qp100.L2
qp100.L2: point queries with 100 insert/s per client
Performance metrics for all DBMS, not just the ones listed above. Some are normalized by throughput, others are not. Legend for results is here.
ips	qps	rps	rmbps	wps	wmbps	rpq	rkbpq	wpi	wkbpi	csps	cpups	cspq	cpupq	dbgb1	dbgb2	rss	maxop	p50	p99	tag
1977	194871	0	0.0	338.6	17.8	0.000	0.000	0.171	9.233	749889	41.5	3.848	102	56.4	149.3	0.5	0.006	9973	9430	pg174_o2nofp.cx10a_c32r128
1976	193978	0	0.0	341.7	17.9	0.000	0.000	0.173	9.264	746610	41.5	3.849	103	56.5	149.4	0.5	0.008	9925	9334	pg18beta1_o2nofp.cx10b_c32r128
1977	195740	0	0.0	340.6	17.8	0.000	0.000	0.172	9.223	753316	41.3	3.849	101	56.0	148.9	0.5	0.006	10012	9462	pg18beta1_o2nofp.cx10cw4_c32r128
1976	198592	0	0.0	340.7	17.8	0.000	0.000	0.172	9.251	764650	41.5	3.850	100	56.3	149.2	0.5	0.012	10197	9558	pg18beta1_o2nofp.cx10d_c32r128
qr500.L3
qr500.L3: range queries with 500 insert/s per client
Performance metrics for all DBMS, not just the ones listed above. Some are normalized by throughput, others are not. Legend for results is here.
ips	qps	rps	rmbps	wps	wmbps	rpq	rkbpq	wpi	wkbpi	csps	cpups	cspq	cpupq	dbgb1	dbgb2	rss	maxop	p50	p99	tag
9885	375502	0	0.0	509.4	27.4	0.000	0.000	0.052	2.841	1421582	43.2	3.786	55	56.5	142.7	26.6	0.078	19051	16868	pg174_o2nofp.cx10a_c32r128
9885	375689	0	0.0	515.7	27.8	0.000	0.000	0.052	2.882	1422585	43.2	3.787	55	56.3	142.4	6.7	0.082	19084	16670	pg18beta1_o2nofp.cx10b_c32r128
9885	374394	8	0.3	529.6	28.3	0.000	0.001	0.054	2.930	1416862	43.3	3.784	56	56.1	142.2	17.6	0.072	19051	16725	pg18beta1_o2nofp.cx10cw4_c32r128
9885	380308	0	0.0	513.7	27.9	0.000	0.000	0.052	2.888	1439708	43.3	3.786	55	56.3	142.6	14.2	0.018	19291	16766	pg18beta1_o2nofp.cx10d_c32r128
qp500.L4
qp500.L4: point queries with 500 insert/s per client
Performance metrics for all DBMS, not just the ones listed above. Some are normalized by throughput, others are not. Legend for results is here.
ips	qps	rps	rmbps	wps	wmbps	rpq	rkbpq	wpi	wkbpi	csps	cpups	cspq	cpupq	dbgb1	dbgb2	rss	maxop	p50	p99	tag
9885	193163	0	0.0	340.1	29.2	0.000	0.000	0.034	3.020	741791	41.8	3.840	104	56.3	138.5	24.3	0.099	9834	8985	pg174_o2nofp.cx10a_c32r128
9885	192471	0	0.0	340.6	27.7	0.000	0.000	0.034	2.868	738966	41.8	3.839	104	56.3	138.4	4.5	0.067	9817	8918	pg18beta1_o2nofp.cx10b_c32r128
9879	194024	0	0.0	342.3	27.6	0.000	0.000	0.035	2.862	745845	41.8	3.844	103	56.0	138.1	10.2	0.102	9988	9158	pg18beta1_o2nofp.cx10cw4_c32r128
9885	196382	0	0.0	341.3	27.6	0.000	0.000	0.035	2.855	753773	41.9	3.838	102	56.4	138.5	1.9	0.093	10069	9046	pg18beta1_o2nofp.cx10d_c32r128
qr1000.L5
qr1000.L5: range queries with 1000 insert/s per client
Performance metrics for all DBMS, not just the ones listed above. Some are normalized by throughput, others are not. Legend for results is here.
ips	qps	rps	rmbps	wps	wmbps	rpq	rkbpq	wpi	wkbpi	csps	cpups	cspq	cpupq	dbgb1	dbgb2	rss	maxop	p50	p99	tag
19758	371113	0	0.0	394.8	33.5	0.000	0.000	0.020	1.734	1400382	44.1	3.773	57	56.2	134.6	14.2	0.100	18923	16829	pg174_o2nofp.cx10a_c32r128
19758	372868	0	0.0	413.2	35.6	0.000	0.000	0.021	1.846	1408402	44.2	3.777	57	56.1	134.7	4.1	0.103	18907	16462	pg18beta1_o2nofp.cx10b_c32r128
19758	368807	0	0.0	410.4	35.2	0.000	0.000	0.021	1.825	1392292	44.2	3.775	58	56.1	134.6	11.3	0.089	18626	16334	pg18beta1_o2nofp.cx10cw4_c32r128
19758	376557	0	0.0	406.7	35.2	0.000	0.000	0.021	1.826	1421573	44.2	3.775	56	56.3	134.9	3.7	0.095	18860	16430	pg18beta1_o2nofp.cx10d_c32r128
qp1000.L6
qp1000.L6: point queries with 1000 insert/s per client
Performance metrics for all DBMS, not just the ones listed above. Some are normalized by throughput, others are not. Legend for results is here.
ips	qps	rps	rmbps	wps	wmbps	rpq	rkbpq	wpi	wkbpi	csps	cpups	cspq	cpupq	dbgb1	dbgb2	rss	maxop	p50	p99	tag
19758	191529	0	0.0	403.2	35.8	0.000	0.000	0.020	1.855	734938	42.8	3.837	107	56.2	133.5	39.6	0.091	9760	8790	pg174_o2nofp.cx10a_c32r128
19758	190806	0	0.0	396.7	34.9	0.000	0.000	0.020	1.809	732243	42.9	3.838	108	56.0	133.3	7.7	0.090	9706	8694	pg18beta1_o2nofp.cx10b_c32r128
19758	192294	0	0.0	397.0	34.8	0.000	0.000	0.020	1.802	738019	42.9	3.838	107	55.9	133.2	18.4	0.099	9861	8794	pg18beta1_o2nofp.cx10cw4_c32r128
19748	194336	0	0.0	400.3	35.1	0.000	0.000	0.020	1.819	745712	43.0	3.837	106	56.2	133.6	1.9	0.090	9861	8827	pg18beta1_o2nofp.cx10d_c32r128
l.i0
- l.i0: load without secondary indexes
- Legend for results is here.
- Each entry lists the percentage of responses that fit in that bucket (slower than max time for previous bucket, faster than min time for next bucket).
Insert response time histogram
256us	1ms	4ms	16ms	64ms	256ms	1s	4s	16s	gt	max	tag
0.000	91.932	8.008	0.036	0.006	0.011	0.007	0.000	0.000	0.000	0.385	pg174_o2nofp.cx10a_c32r128
0.000	94.122	5.814	0.038	0.015	0.006	0.006	0.000	0.000	0.000	0.659	pg18beta1_o2nofp.cx10b_c32r128
0.000	94.505	5.424	0.038	0.018	0.009	0.006	0.000	0.000	0.000	0.664	pg18beta1_o2nofp.cx10cw4_c32r128
0.000	94.426	5.518	0.031	0.009	0.010	0.006	0.000	0.000	0.000	0.778	pg18beta1_o2nofp.cx10d_c32r128
l.x
- l.x: create secondary indexes
- Legend for results is here.
- Each entry lists the percentage of responses that fit in that bucket (slower than max time for previous bucket, faster than min time for next bucket).
TODO - determine whether there is data for create index response time
l.i1
- l.i1: continue load after secondary indexes created with 50 inserts per transaction
- Legend for results is here.
- Each entry lists the percentage of responses that fit in that bucket (slower than max time for previous bucket, faster than min time for next bucket).
Insert response time histogram
256us	1ms	4ms	16ms	64ms	256ms	1s	4s	16s	gt	max	tag
0.000	2.820	89.477	7.147	0.549	0.006	nonzero	0.000	0.000	0.000	0.844	pg174_o2nofp.cx10a_c32r128
0.000	3.119	90.127	6.119	0.630	0.005	0.001	0.000	0.000	0.000	0.407	pg18beta1_o2nofp.cx10b_c32r128
0.000	1.975	90.952	6.432	0.636	0.005	0.001	0.000	0.000	0.000	0.681	pg18beta1_o2nofp.cx10cw4_c32r128
0.000	2.245	90.721	6.386	0.642	0.006	0.001	0.000	0.000	0.000	0.916	pg18beta1_o2nofp.cx10d_c32r128
Delete response time histogram
256us	1ms	4ms	16ms	64ms	256ms	1s	4s	16s	gt	max	tag
0.000	22.106	74.754	2.882	0.254	0.004	nonzero	0.000	0.000	0.000	0.844	pg174_o2nofp.cx10a_c32r128
0.000	21.232	75.732	2.696	0.336	0.004	nonzero	0.000	0.000	0.000	0.392	pg18beta1_o2nofp.cx10b_c32r128
0.000	22.036	75.123	2.493	0.345	0.003	0.001	0.000	0.000	0.000	0.680	pg18beta1_o2nofp.cx10cw4_c32r128
0.000	21.859	75.230	2.554	0.352	0.004	nonzero	0.000	0.000	0.000	0.886	pg18beta1_o2nofp.cx10d_c32r128
l.i2
- l.i2: continue load after secondary indexes created with 5 inserts per transaction
- Legend for results is here.
- Each entry lists the percentage of responses that fit in that bucket (slower than max time for previous bucket, faster than min time for next bucket).
Insert response time histogram
256us	1ms	4ms	16ms	64ms	256ms	1s	4s	16s	gt	max	tag
91.364	8.333	0.291	0.013	nonzero	nonzero	0.000	0.000	0.000	0.000	0.071	pg174_o2nofp.cx10a_c32r128
91.006	8.700	0.270	0.024	nonzero	0.000	0.000	0.000	0.000	0.000	0.061	pg18beta1_o2nofp.cx10b_c32r128
90.285	9.384	0.302	0.028	nonzero	nonzero	0.000	0.000	0.000	0.000	0.083	pg18beta1_o2nofp.cx10cw4_c32r128
91.354	8.365	0.269	0.012	nonzero	0.000	0.000	0.000	0.000	0.000	0.024	pg18beta1_o2nofp.cx10d_c32r128
Delete response time histogram
256us	1ms	4ms	16ms	64ms	256ms	1s	4s	16s	gt	max	tag
3.432	56.307	40.217	0.044	nonzero	nonzero	0.000	0.000	0.000	0.000	0.071	pg174_o2nofp.cx10a_c32r128
2.743	62.254	34.942	0.061	0.001	0.000	0.000	0.000	0.000	0.000	0.061	pg18beta1_o2nofp.cx10b_c32r128
2.684	62.080	35.169	0.066	0.001	nonzero	0.000	0.000	0.000	0.000	0.083	pg18beta1_o2nofp.cx10cw4_c32r128
2.748	60.867	36.342	0.043	nonzero	0.000	0.000	0.000	0.000	0.000	0.026	pg18beta1_o2nofp.cx10d_c32r128
qr100.L1
- qr100.L1: range queries with 100 insert/s per client
- Legend for results is here.
- Each entry lists the percentage of responses that fit in that bucket (slower than max time for previous bucket, faster than min time for next bucket).
Query response time histogram
256us	1ms	4ms	16ms	64ms	256ms	1s	4s	16s	gt	max	tag
99.997	0.002	0.002	nonzero	0.000	0.000	0.000	0.000	0.000	0.000	0.008	pg174_o2nofp.cx10a_c32r128
99.997	0.002	0.001	nonzero	nonzero	0.000	0.000	0.000	0.000	0.000	0.016	pg18beta1_o2nofp.cx10b_c32r128
99.997	0.002	0.001	nonzero	nonzero	0.000	0.000	0.000	0.000	0.000	0.024	pg18beta1_o2nofp.cx10cw4_c32r128
99.997	0.002	0.001	nonzero	0.000	0.000	0.000	0.000	0.000	0.000	0.008	pg18beta1_o2nofp.cx10d_c32r128
Insert response time histogram
256us	1ms	4ms	16ms	64ms	256ms	1s	4s	16s	gt	max	tag
0.000	0.006	99.689	0.306	0.000	0.000	0.000	0.000	0.000	0.000	0.009	pg174_o2nofp.cx10a_c32r128
0.000	0.006	99.686	0.308	0.000	0.000	0.000	0.000	0.000	0.000	0.014	pg18beta1_o2nofp.cx10b_c32r128
0.000	0.014	99.707	0.279	0.000	0.000	0.000	0.000	0.000	0.000	0.010	pg18beta1_o2nofp.cx10cw4_c32r128
0.000	0.004	99.694	0.301	0.000	0.000	0.000	0.000	0.000	0.000	0.011	pg18beta1_o2nofp.cx10d_c32r128
Delete response time histogram
256us	1ms	4ms	16ms	64ms	256ms	1s	4s	16s	gt	max	tag
0.000	66.753	33.229	0.018	0.000	0.000	0.000	0.000	0.000	0.000	0.009	pg174_o2nofp.cx10a_c32r128
0.000	66.628	33.357	0.015	0.000	0.000	0.000	0.000	0.000	0.000	0.008	pg18beta1_o2nofp.cx10b_c32r128
0.000	67.350	32.628	0.022	0.000	0.000	0.000	0.000	0.000	0.000	0.010	pg18beta1_o2nofp.cx10cw4_c32r128
0.000	65.475	34.489	0.036	0.000	0.000	0.000	0.000	0.000	0.000	0.007	pg18beta1_o2nofp.cx10d_c32r128
qp100.L2
- qp100.L2: point queries with 100 insert/s per client
- Legend for results is here.
- Each entry lists the percentage of responses that fit in that bucket (slower than max time for previous bucket, faster than min time for next bucket).
Query response time histogram
256us	1ms	4ms	16ms	64ms	256ms	1s	4s	16s	gt	max	tag
99.986	0.011	0.003	nonzero	0.000	0.000	0.000	0.000	0.000	0.000	0.006	pg174_o2nofp.cx10a_c32r128
99.984	0.012	0.003	nonzero	0.000	0.000	0.000	0.000	0.000	0.000	0.008	pg18beta1_o2nofp.cx10b_c32r128
99.986	0.011	0.003	nonzero	0.000	0.000	0.000	0.000	0.000	0.000	0.006	pg18beta1_o2nofp.cx10cw4_c32r128
99.986	0.011	0.003	nonzero	0.000	0.000	0.000	0.000	0.000	0.000	0.012	pg18beta1_o2nofp.cx10d_c32r128
Insert response time histogram
256us	1ms	4ms	16ms	64ms	256ms	1s	4s	16s	gt	max	tag
0.000	0.000	99.596	0.404	0.000	0.000	0.000	0.000	0.000	0.000	0.010	pg174_o2nofp.cx10a_c32r128
0.000	0.000	99.679	0.321	0.000	0.000	0.000	0.000	0.000	0.000	0.012	pg18beta1_o2nofp.cx10b_c32r128
0.000	0.000	99.722	0.278	0.000	0.000	0.000	0.000	0.000	0.000	0.009	pg18beta1_o2nofp.cx10cw4_c32r128
0.000	0.000	99.631	0.369	0.000	0.000	0.000	0.000	0.000	0.000	0.011	pg18beta1_o2nofp.cx10d_c32r128
Delete response time histogram
256us	1ms	4ms	16ms	64ms	256ms	1s	4s	16s	gt	max	tag
0.000	22.396	77.486	0.118	0.000	0.000	0.000	0.000	0.000	0.000	0.012	pg174_o2nofp.cx10a_c32r128
0.000	19.028	80.861	0.111	0.000	0.000	0.000	0.000	0.000	0.000	0.010	pg18beta1_o2nofp.cx10b_c32r128
0.000	22.254	77.649	0.097	0.000	0.000	0.000	0.000	0.000	0.000	0.010	pg18beta1_o2nofp.cx10cw4_c32r128
0.000	22.185	77.719	0.096	0.000	0.000	0.000	0.000	0.000	0.000	0.010	pg18beta1_o2nofp.cx10d_c32r128
qr500.L3
- qr500.L3: range queries with 500 insert/s per client
- Legend for results is here.
- Each entry lists the percentage of responses that fit in that bucket (slower than max time for previous bucket, faster than min time for next bucket).
Query response time histogram
256us	1ms	4ms	16ms	64ms	256ms	1s	4s	16s	gt	max	tag
99.987	0.006	0.007	nonzero	nonzero	nonzero	0.000	0.000	0.000	0.000	0.078	pg174_o2nofp.cx10a_c32r128
99.987	0.006	0.007	nonzero	nonzero	nonzero	0.000	0.000	0.000	0.000	0.082	pg18beta1_o2nofp.cx10b_c32r128
99.987	0.006	0.007	nonzero	nonzero	nonzero	0.000	0.000	0.000	0.000	0.072	pg18beta1_o2nofp.cx10cw4_c32r128
99.987	0.006	0.007	nonzero	nonzero	0.000	0.000	0.000	0.000	0.000	0.018	pg18beta1_o2nofp.cx10d_c32r128
Insert response time histogram
256us	1ms	4ms	16ms	64ms	256ms	1s	4s	16s	gt	max	tag
0.000	8.078	91.113	0.778	0.031	0.000	0.000	0.000	0.000	0.000	0.038	pg174_o2nofp.cx10a_c32r128
0.000	9.953	89.061	0.937	0.049	0.000	0.000	0.000	0.000	0.000	0.045	pg18beta1_o2nofp.cx10b_c32r128
0.000	10.629	88.319	1.016	0.036	0.000	0.000	0.000	0.000	0.000	0.033	pg18beta1_o2nofp.cx10cw4_c32r128
0.000	8.952	90.112	0.898	0.037	0.000	0.000	0.000	0.000	0.000	0.034	pg18beta1_o2nofp.cx10d_c32r128
Delete response time histogram
256us	1ms	4ms	16ms	64ms	256ms	1s	4s	16s	gt	max	tag
0.000	53.013	46.437	0.539	0.011	0.000	0.000	0.000	0.000	0.000	0.028	pg174_o2nofp.cx10a_c32r128
0.000	50.036	49.353	0.589	0.021	0.000	0.000	0.000	0.000	0.000	0.033	pg18beta1_o2nofp.cx10b_c32r128
0.000	52.047	47.276	0.661	0.016	0.000	0.000	0.000	0.000	0.000	0.023	pg18beta1_o2nofp.cx10cw4_c32r128
0.000	50.064	49.347	0.573	0.016	0.000	0.000	0.000	0.000	0.000	0.023	pg18beta1_o2nofp.cx10d_c32r128
qp500.L4
- qp500.L4: point queries with 500 insert/s per client
- Legend for results is here.
- Each entry lists the percentage of responses that fit in that bucket (slower than max time for previous bucket, faster than min time for next bucket).
Query response time histogram
256us	1ms	4ms	16ms	64ms	256ms	1s	4s	16s	gt	max	tag
99.965	0.024	0.011	nonzero	nonzero	nonzero	0.000	0.000	0.000	0.000	0.099	pg174_o2nofp.cx10a_c32r128
99.963	0.026	0.011	nonzero	nonzero	nonzero	0.000	0.000	0.000	0.000	0.067	pg18beta1_o2nofp.cx10b_c32r128
99.965	0.024	0.011	nonzero	nonzero	nonzero	0.000	0.000	0.000	0.000	0.102	pg18beta1_o2nofp.cx10cw4_c32r128
99.963	0.025	0.011	nonzero	nonzero	nonzero	0.000	0.000	0.000	0.000	0.093	pg18beta1_o2nofp.cx10d_c32r128
Insert response time histogram
256us	1ms	4ms	16ms	64ms	256ms	1s	4s	16s	gt	max	tag
0.000	10.888	88.254	0.828	0.029	0.001	0.000	0.000	0.000	0.000	0.099	pg174_o2nofp.cx10a_c32r128
0.000	9.210	90.094	0.682	0.015	0.000	0.000	0.000	0.000	0.000	0.034	pg18beta1_o2nofp.cx10b_c32r128
0.000	10.469	88.743	0.751	0.037	0.000	0.000	0.000	0.000	0.000	0.039	pg18beta1_o2nofp.cx10cw4_c32r128
0.000	7.941	91.395	0.634	0.031	0.000	0.000	0.000	0.000	0.000	0.038	pg18beta1_o2nofp.cx10d_c32r128
Delete response time histogram
256us	1ms	4ms	16ms	64ms	256ms	1s	4s	16s	gt	max	tag
0.000	47.846	51.559	0.572	0.022	0.001	0.000	0.000	0.000	0.000	0.095	pg174_o2nofp.cx10a_c32r128
0.000	45.715	53.759	0.515	0.011	0.000	0.000	0.000	0.000	0.000	0.036	pg18beta1_o2nofp.cx10b_c32r128
0.000	47.563	51.838	0.567	0.032	0.000	0.000	0.000	0.000	0.000	0.030	pg18beta1_o2nofp.cx10cw4_c32r128
0.000	45.886	53.546	0.543	0.025	0.000	0.000	0.000	0.000	0.000	0.036	pg18beta1_o2nofp.cx10d_c32r128
qr1000.L5
- qr1000.L5: range queries with 1000 insert/s per client
- Legend for results is here.
- Each entry lists the percentage of responses that fit in that bucket (slower than max time for previous bucket, faster than min time for next bucket).
Query response time histogram
256us	1ms	4ms	16ms	64ms	256ms	1s	4s	16s	gt	max	tag
99.977	0.012	0.011	nonzero	nonzero	nonzero	0.000	0.000	0.000	0.000	0.100	pg174_o2nofp.cx10a_c32r128
99.976	0.013	0.011	nonzero	nonzero	nonzero	0.000	0.000	0.000	0.000	0.103	pg18beta1_o2nofp.cx10b_c32r128
99.976	0.013	0.011	nonzero	nonzero	nonzero	0.000	0.000	0.000	0.000	0.089	pg18beta1_o2nofp.cx10cw4_c32r128
99.976	0.013	0.011	nonzero	nonzero	nonzero	0.000	0.000	0.000	0.000	0.095	pg18beta1_o2nofp.cx10d_c32r128
Insert response time histogram
256us	1ms	4ms	16ms	64ms	256ms	1s	4s	16s	gt	max	tag
0.000	24.003	75.468	0.524	0.005	0.000	0.000	0.000	0.000	0.000	0.056	pg174_o2nofp.cx10a_c32r128
0.000	33.605	65.827	0.549	0.019	0.000	0.000	0.000	0.000	0.000	0.038	pg18beta1_o2nofp.cx10b_c32r128
0.000	35.736	63.760	0.489	0.016	0.000	0.000	0.000	0.000	0.000	0.044	pg18beta1_o2nofp.cx10cw4_c32r128
0.000	28.632	70.734	0.601	0.033	0.000	0.000	0.000	0.000	0.000	0.035	pg18beta1_o2nofp.cx10d_c32r128
Delete response time histogram
256us	1ms	4ms	16ms	64ms	256ms	1s	4s	16s	gt	max	tag
0.000	52.723	46.965	0.309	0.003	0.000	0.000	0.000	0.000	0.000	0.057	pg174_o2nofp.cx10a_c32r128
0.000	51.887	47.677	0.428	0.008	0.000	0.000	0.000	0.000	0.000	0.028	pg18beta1_o2nofp.cx10b_c32r128
0.000	54.066	45.533	0.391	0.010	0.000	0.000	0.000	0.000	0.000	0.030	pg18beta1_o2nofp.cx10cw4_c32r128
0.000	53.291	46.219	0.472	0.018	0.000	0.000	0.000	0.000	0.000	0.027	pg18beta1_o2nofp.cx10d_c32r128
qp1000.L6
- qp1000.L6: point queries with 1000 insert/s per client
- Legend for results is here.
- Each entry lists the percentage of responses that fit in that bucket (slower than max time for previous bucket, faster than min time for next bucket).
Query response time histogram
256us	1ms	4ms	16ms	64ms	256ms	1s	4s	16s	gt	max	tag
99.935	0.046	0.019	nonzero	nonzero	nonzero	0.000	0.000	0.000	0.000	0.091	pg174_o2nofp.cx10a_c32r128
99.934	0.048	0.018	nonzero	nonzero	nonzero	0.000	0.000	0.000	0.000	0.090	pg18beta1_o2nofp.cx10b_c32r128
99.935	0.046	0.018	nonzero	nonzero	nonzero	0.000	0.000	0.000	0.000	0.099	pg18beta1_o2nofp.cx10cw4_c32r128
99.934	0.047	0.018	nonzero	nonzero	nonzero	0.000	0.000	0.000	0.000	0.090	pg18beta1_o2nofp.cx10d_c32r128
Insert response time histogram
256us	1ms	4ms	16ms	64ms	256ms	1s	4s	16s	gt	max	tag
0.000	28.902	70.448	0.618	0.032	0.000	0.000	0.000	0.000	0.000	0.054	pg174_o2nofp.cx10a_c32r128
0.000	32.923	66.491	0.563	0.024	0.000	0.000	0.000	0.000	0.000	0.040	pg18beta1_o2nofp.cx10b_c32r128
0.000	34.870	64.532	0.575	0.024	0.000	0.000	0.000	0.000	0.000	0.038	pg18beta1_o2nofp.cx10cw4_c32r128
0.000	27.242	72.243	0.486	0.029	0.000	0.000	0.000	0.000	0.000	0.042	pg18beta1_o2nofp.cx10d_c32r128
Delete response time histogram
256us	1ms	4ms	16ms	64ms	256ms	1s	4s	16s	gt	max	tag
0.000	55.047	44.443	0.491	0.019	0.000	0.000	0.000	0.000	0.000	0.039	pg174_o2nofp.cx10a_c32r128
0.000	52.965	46.444	0.572	0.018	0.000	0.000	0.000	0.000	0.000	0.038	pg18beta1_o2nofp.cx10b_c32r128
0.000	55.415	44.044	0.526	0.015	0.000	0.000	0.000	0.000	0.000	0.035	pg18beta1_o2nofp.cx10cw4_c32r128
0.000	56.815	42.451	0.707	0.027	0.000	0.000	0.000	0.000	0.000	0.038	pg18beta1_o2nofp.cx10d_c32r128