Introduction
This is a report for the insert benchmark with 200M docs and 20 client(s). It is generated by scripts (bash, awk, sed) and Tufte might not be impressed. An overview of the insert benchmark is here and a short update is here. Below, by DBMS, I mean DBMS+version.config. An example is my8020.c10b40 where my means MySQL, 8020 is version 8.0.20 and c10b40 is the name for the configuration file.
The test server has 48 AMD cores, 128G RAM and RAID 10 with 2 NVMe devices. It is described here. The benchmark was run with 20 clients and there were 1 or 3 connections per client (1 for queries or inserts without rate limits, 1+1 for rate limited inserts+deletes). It uses 20 tables with a table per client. It loads 10M rows per table without secondary indexes, creates 3 secondary indexes per table, then inserts 16m+4m rows per table with a delete per insert to avoid growing the table. It then does 6 read+write tests for 1800s each that do queries as fast as possible with 100,100,500,500,1000,1000 inserts/s and the same for deletes/s per client concurrent with the queries. The database is cached by Postgres. Clients and the DBMS share one server. The per-database configs are in the per-database subdirectories here.
The tested DBMS are:
- pg174_o2nofp.cx10a_c32r128 - Postgres 17.4 with the cx10a_c32r128 config
- pg18b1git_o2nofp.cx10b_c32r128 - Postgres 18 beta1 with the cx10b_c32r128 config
- pg18b1git_o2nofp.cx10cw2_c32r128 - Postgres 18 beta1 with the cx10cw2_c32r128 config
- pg18b1git_o2nofp.cx10d_c32r128 - Postgres 18 beta1 with the cx10d_c32r128 config
Contents
- Summary
- l.i0: load without secondary indexes
- l.x: create secondary indexes
- l.i1: continue load after secondary indexes created with 50 inserts per transaction
- l.i2: continue load after secondary indexes created with 5 inserts per transaction
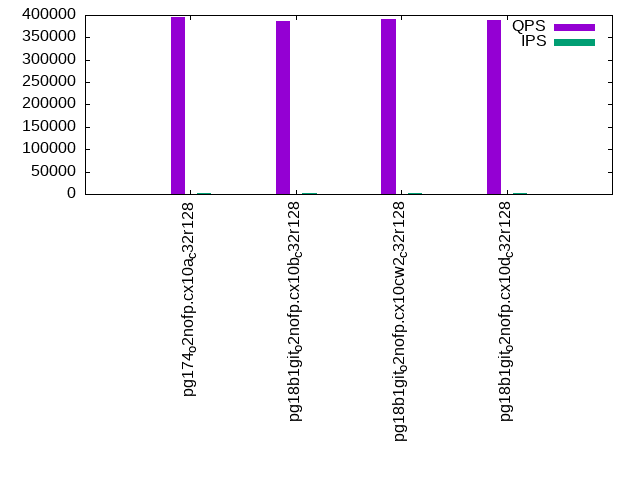
- qr100.L1: range queries with 100 insert/s per client
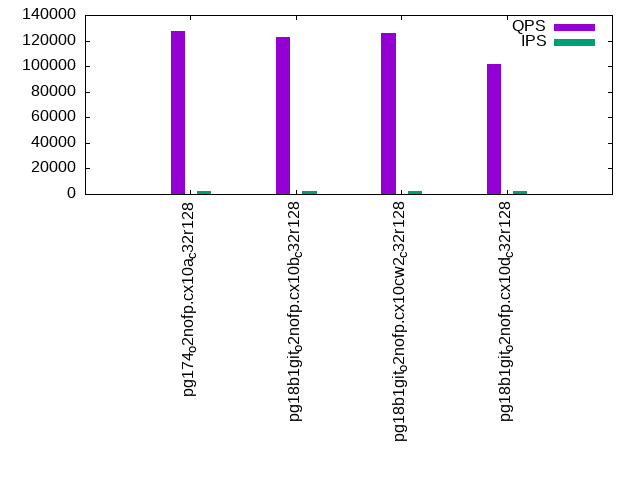
- qp100.L2: point queries with 100 insert/s per client
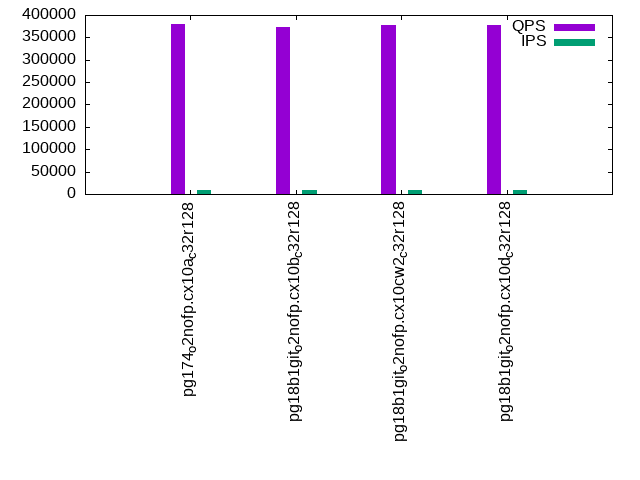
- qr500.L3: range queries with 500 insert/s per client
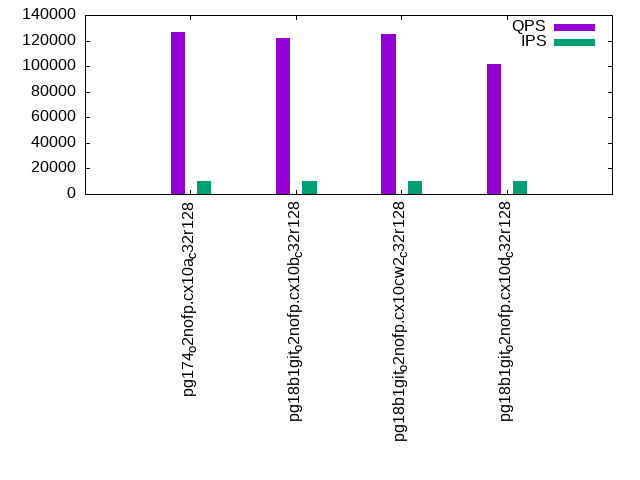
- qp500.L4: point queries with 500 insert/s per client
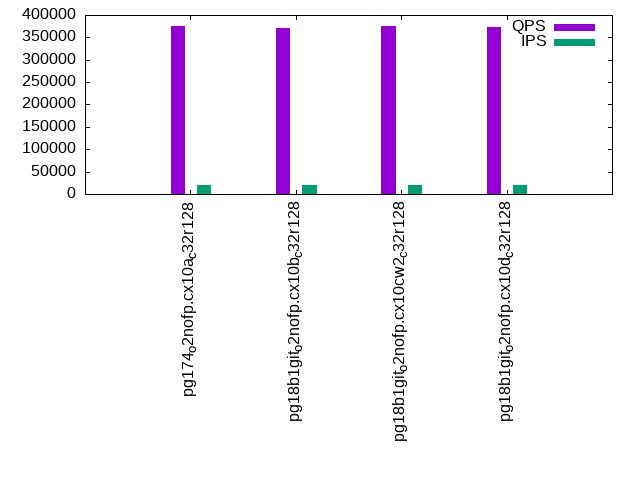
- qr1000.L5: range queries with 1000 insert/s per client
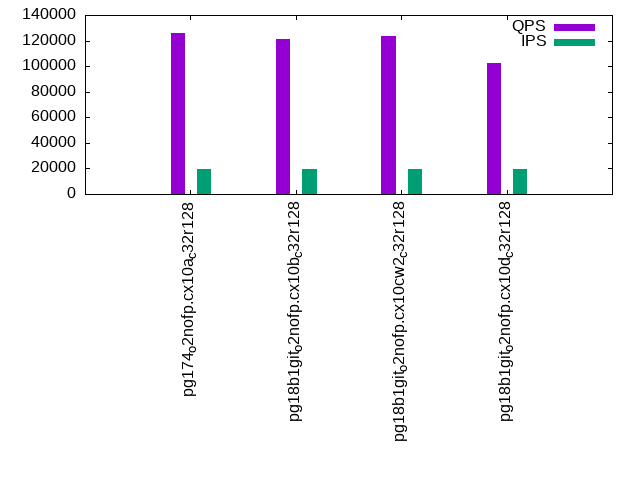
- qp1000.L6: point queries with 1000 insert/s per client
Summary
The numbers are inserts/s for l.i0, l.i1 and l.i2, indexed docs (or rows) /s for l.x and queries/s for qr100, qp100 thru qr1000, qp1000" The values are the average rate over the entire test for inserts (IPS) and queries (QPS). The range of values for IPS and QPS is split into 3 parts: bottom 25%, middle 50%, top 25%. Values in the bottom 25% have a red background, values in the top 25% have a green background and values in the middle have no color. A gray background is used for values that can be ignored because the DBMS did not sustain the target insert rate. Red backgrounds are not used when the minimum value is within 80% of the max value.
| dbms | l.i0 | l.x | l.i1 | l.i2 | qr100 | qp100 | qr500 | qp500 | qr1000 | qp1000 |
|---|---|---|---|---|---|---|---|---|---|---|
| pg174_o2nofp.cx10a_c32r128 | 1652892 | 2597404 | 389294 | 104302 | 395352 | 127814 | 380694 | 126936 | 375704 | 125548 |
| pg18b1git_o2nofp.cx10b_c32r128 | 1709402 | 2666668 | 401002 | 101266 | 386634 | 122969 | 374216 | 122137 | 370528 | 120865 |
| pg18b1git_o2nofp.cx10cw2_c32r128 | 1680672 | 2666668 | 395550 | 104439 | 391631 | 125804 | 376837 | 124833 | 376508 | 123498 |
| pg18b1git_o2nofp.cx10d_c32r128 | 1724138 | 2816903 | 401002 | 102302 | 389751 | 101388 | 378644 | 101394 | 373151 | 102795 |
This table has relative throughput, throughput for the DBMS relative to the DBMS in the first line, using the absolute throughput from the previous table. Values less than 0.95 have a yellow background. Values greater than 1.05 have a blue background.
| dbms | l.i0 | l.x | l.i1 | l.i2 | qr100 | qp100 | qr500 | qp500 | qr1000 | qp1000 |
|---|---|---|---|---|---|---|---|---|---|---|
| pg174_o2nofp.cx10a_c32r128 | 1.00 | 1.00 | 1.00 | 1.00 | 1.00 | 1.00 | 1.00 | 1.00 | 1.00 | 1.00 |
| pg18b1git_o2nofp.cx10b_c32r128 | 1.03 | 1.03 | 1.03 | 0.97 | 0.98 | 0.96 | 0.98 | 0.96 | 0.99 | 0.96 |
| pg18b1git_o2nofp.cx10cw2_c32r128 | 1.02 | 1.03 | 1.02 | 1.00 | 0.99 | 0.98 | 0.99 | 0.98 | 1.00 | 0.98 |
| pg18b1git_o2nofp.cx10d_c32r128 | 1.04 | 1.08 | 1.03 | 0.98 | 0.99 | 0.79 | 0.99 | 0.80 | 0.99 | 0.82 |
This lists the average rate of inserts/s for the tests that do inserts concurrent with queries. For such tests the query rate is listed in the table above. The read+write tests are setup so that the insert rate should match the target rate every second. Cells that are not at least 95% of the target have a red background to indicate a failure to satisfy the target.
| dbms | qr100.L1 | qp100.L2 | qr500.L3 | qp500.L4 | qr1000.L5 | qp1000.L6 |
|---|---|---|---|---|---|---|
| pg174_o2nofp.cx10a_c32r128 | 1977 | 1977 | 9885 | 9885 | 19758 | 19769 |
| pg18b1git_o2nofp.cx10b_c32r128 | 1977 | 1977 | 9885 | 9879 | 19769 | 19769 |
| pg18b1git_o2nofp.cx10cw2_c32r128 | 1977 | 1977 | 9879 | 9885 | 19758 | 19769 |
| pg18b1git_o2nofp.cx10d_c32r128 | 1977 | 1977 | 9885 | 9885 | 19758 | 19769 |
| target | 2000 | 2000 | 10000 | 10000 | 20000 | 20000 |
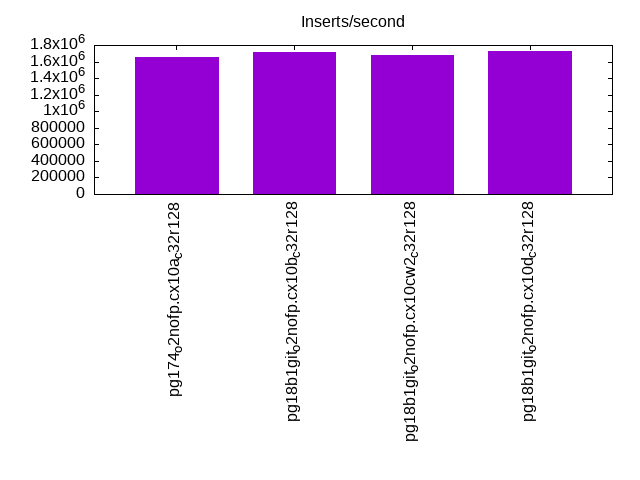
l.i0
l.i0: load without secondary indexes. Graphs for performance per 1-second interval are here.
Average throughput:
Insert response time histogram: each cell has the percentage of responses that take <= the time in the header and max is the max response time in seconds. For the max column values in the top 25% of the range have a red background and in the bottom 25% of the range have a green background. The red background is not used when the min value is within 80% of the max value.
| dbms | 256us | 1ms | 4ms | 16ms | 64ms | 256ms | 1s | 4s | 16s | gt | max |
|---|---|---|---|---|---|---|---|---|---|---|---|
| pg174_o2nofp.cx10a_c32r128 | 92.362 | 7.590 | 0.030 | 0.001 | 0.007 | 0.010 | 0.859 | ||||
| pg18b1git_o2nofp.cx10b_c32r128 | 94.290 | 5.650 | 0.033 | 0.011 | 0.008 | 0.008 | 0.702 | ||||
| pg18b1git_o2nofp.cx10cw2_c32r128 | 94.137 | 5.802 | 0.032 | 0.013 | 0.007 | 0.009 | 0.911 | ||||
| pg18b1git_o2nofp.cx10d_c32r128 | 93.770 | 6.159 | 0.038 | 0.015 | 0.011 | 0.006 | 0.486 |
Performance metrics for the DBMS listed above. Some are normalized by throughput, others are not. Legend for results is here.
ips	qps	rps	rmbps	wps	wmbps	rpq	rkbpq	wpi	wkbpi	csps	cpups	cspq	cpupq	dbgb1	dbgb2	rss	maxop	p50	p99	tag
1652892	0	2	0.0	6632.7	705.8	0.000	0.000	0.004	0.437	269603	44.1	0.163	13	19.1	51.7	1.4	0.859	112017	22375	pg174_o2nofp.cx10a_c32r128
1709402	0	3	0.0	6819.9	719.8	0.000	0.000	0.004	0.431	256346	45.4	0.150	13	19.1	51.7	0.4	0.702	115091	35361	pg18b1git_o2nofp.cx10b_c32r128
1680672	0	4	0.0	6708.2	707.0	0.000	0.000	0.004	0.431	252469	43.9	0.150	13	19.1	51.7	1.4	0.911	114233	10093	pg18b1git_o2nofp.cx10cw2_c32r128
1724138	0	3	0.0	6829.9	722.9	0.000	0.000	0.004	0.429	263952	45.8	0.153	13	19.1	51.7	0.4	0.486	113513	55559	pg18b1git_o2nofp.cx10d_c32r128
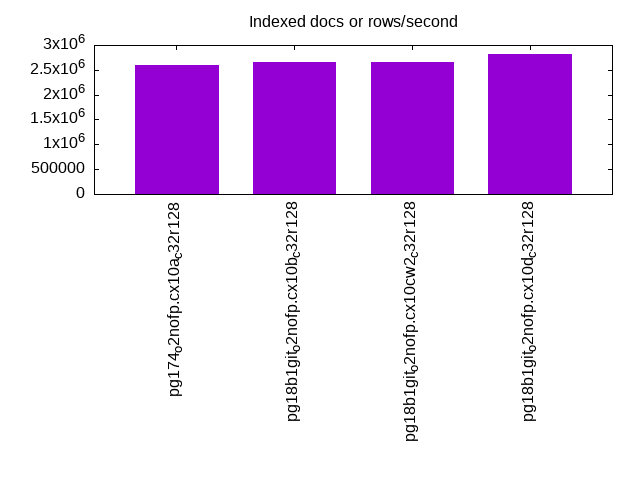
l.x
l.x: create secondary indexes.
Average throughput:
Performance metrics for the DBMS listed above. Some are normalized by throughput, others are not. Legend for results is here.
ips	qps	rps	rmbps	wps	wmbps	rpq	rkbpq	wpi	wkbpi	csps	cpups	cspq	cpupq	dbgb1	dbgb2	rss	maxop	p50	p99	tag
2597404	0	4	0.0	6599.1	769.3	0.000	0.000	0.003	0.303	41405	15.0	0.016	3	38.4	88.5	7.2	0.037	NA	NA	pg174_o2nofp.cx10a_c32r128
2666668	0	4	0.0	6907.6	800.7	0.000	0.000	0.003	0.307	35110	15.0	0.013	3	38.4	88.5	7.2	0.043	NA	NA	pg18b1git_o2nofp.cx10b_c32r128
2666668	0	4	0.0	6889.9	798.5	0.000	0.000	0.003	0.307	33934	14.8	0.013	3	38.4	88.5	7.2	0.031	NA	NA	pg18b1git_o2nofp.cx10cw2_c32r128
2816903	0	4	0.0	7300.3	848.2	0.000	0.000	0.003	0.308	37787	15.6	0.013	3	38.4	88.5	7.0	0.036	NA	NA	pg18b1git_o2nofp.cx10d_c32r128
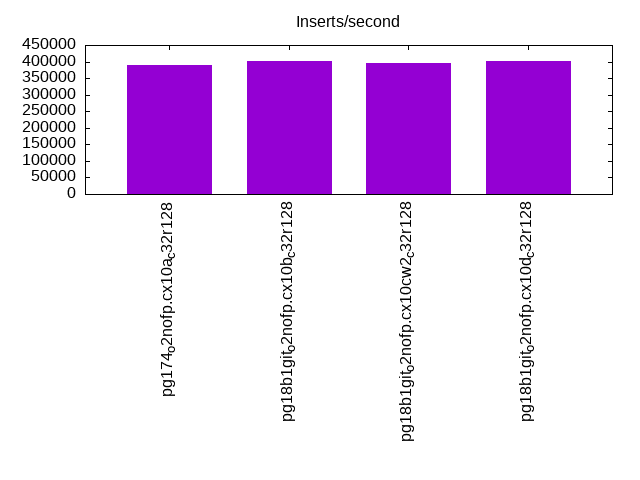
l.i1
l.i1: continue load after secondary indexes created with 50 inserts per transaction. Graphs for performance per 1-second interval are here.
Average throughput:
Insert response time histogram: each cell has the percentage of responses that take <= the time in the header and max is the max response time in seconds. For the max column values in the top 25% of the range have a red background and in the bottom 25% of the range have a green background. The red background is not used when the min value is within 80% of the max value.
| dbms | 256us | 1ms | 4ms | 16ms | 64ms | 256ms | 1s | 4s | 16s | gt | max |
|---|---|---|---|---|---|---|---|---|---|---|---|
| pg174_o2nofp.cx10a_c32r128 | 1.868 | 90.131 | 7.445 | 0.548 | 0.006 | 0.002 | nonzero | 1.020 | |||
| pg18b1git_o2nofp.cx10b_c32r128 | 1.851 | 90.964 | 6.509 | 0.668 | 0.006 | 0.001 | 0.568 | ||||
| pg18b1git_o2nofp.cx10cw2_c32r128 | 2.208 | 90.925 | 6.212 | 0.649 | 0.005 | 0.002 | 0.744 | ||||
| pg18b1git_o2nofp.cx10d_c32r128 | 2.108 | 90.842 | 6.421 | 0.624 | 0.005 | nonzero | 0.885 |
Delete response time histogram: each cell has the percentage of responses that take <= the time in the header and max is the max response time in seconds. For the max column values in the top 25% of the range have a red background and in the bottom 25% of the range have a green background. The red background is not used when the min value is within 80% of the max value.
| dbms | 256us | 1ms | 4ms | 16ms | 64ms | 256ms | 1s | 4s | 16s | gt | max |
|---|---|---|---|---|---|---|---|---|---|---|---|
| pg174_o2nofp.cx10a_c32r128 | 22.015 | 75.053 | 2.680 | 0.246 | 0.005 | 0.001 | nonzero | 1.019 | |||
| pg18b1git_o2nofp.cx10b_c32r128 | 21.378 | 75.804 | 2.446 | 0.367 | 0.005 | 0.001 | 0.561 | ||||
| pg18b1git_o2nofp.cx10cw2_c32r128 | 21.160 | 75.880 | 2.609 | 0.345 | 0.004 | 0.001 | 0.711 | ||||
| pg18b1git_o2nofp.cx10d_c32r128 | 21.334 | 75.743 | 2.599 | 0.321 | 0.003 | nonzero | 0.910 |
Performance metrics for the DBMS listed above. Some are normalized by throughput, others are not. Legend for results is here.
ips	qps	rps	rmbps	wps	wmbps	rpq	rkbpq	wpi	wkbpi	csps	cpups	cspq	cpupq	dbgb1	dbgb2	rss	maxop	p50	p99	tag
389294	0	637	2.9	6376.2	606.6	0.002	0.008	0.016	1.596	253356	52.6	0.651	65	56.0	152.0	23.3	1.020	22562	3097	pg174_o2nofp.cx10a_c32r128
401002	0	64	0.3	6580.3	626.4	0.000	0.001	0.016	1.599	247357	54.0	0.617	65	55.7	151.8	9.6	0.568	22974	3246	pg18b1git_o2nofp.cx10b_c32r128
395550	0	109	0.6	6460.0	612.8	0.000	0.001	0.016	1.586	238154	53.5	0.602	65	56.2	152.2	24.0	0.744	23175	3396	pg18b1git_o2nofp.cx10cw2_c32r128
401002	0	83	0.4	6556.8	625.2	0.000	0.001	0.016	1.597	245868	54.3	0.613	65	55.6	151.7	49.7	0.885	22975	3248	pg18b1git_o2nofp.cx10d_c32r128
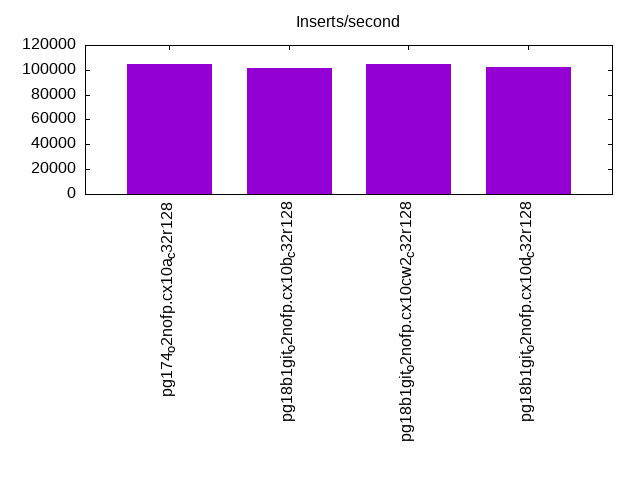
l.i2
l.i2: continue load after secondary indexes created with 5 inserts per transaction. Graphs for performance per 1-second interval are here.
Average throughput:
Insert response time histogram: each cell has the percentage of responses that take <= the time in the header and max is the max response time in seconds. For the max column values in the top 25% of the range have a red background and in the bottom 25% of the range have a green background. The red background is not used when the min value is within 80% of the max value.
| dbms | 256us | 1ms | 4ms | 16ms | 64ms | 256ms | 1s | 4s | 16s | gt | max |
|---|---|---|---|---|---|---|---|---|---|---|---|
| pg174_o2nofp.cx10a_c32r128 | 90.290 | 9.387 | 0.314 | 0.010 | nonzero | nonzero | 0.066 | ||||
| pg18b1git_o2nofp.cx10b_c32r128 | 90.195 | 9.492 | 0.298 | 0.014 | nonzero | nonzero | 0.068 | ||||
| pg18b1git_o2nofp.cx10cw2_c32r128 | 89.653 | 10.014 | 0.311 | 0.021 | nonzero | 0.058 | |||||
| pg18b1git_o2nofp.cx10d_c32r128 | 89.616 | 10.024 | 0.334 | 0.026 | nonzero | nonzero | 0.072 |
Delete response time histogram: each cell has the percentage of responses that take <= the time in the header and max is the max response time in seconds. For the max column values in the top 25% of the range have a red background and in the bottom 25% of the range have a green background. The red background is not used when the min value is within 80% of the max value.
| dbms | 256us | 1ms | 4ms | 16ms | 64ms | 256ms | 1s | 4s | 16s | gt | max |
|---|---|---|---|---|---|---|---|---|---|---|---|
| pg174_o2nofp.cx10a_c32r128 | 3.634 | 59.404 | 36.918 | 0.044 | 0.001 | nonzero | 0.067 | ||||
| pg18b1git_o2nofp.cx10b_c32r128 | 2.999 | 59.893 | 37.051 | 0.056 | nonzero | nonzero | 0.068 | ||||
| pg18b1git_o2nofp.cx10cw2_c32r128 | 3.092 | 60.534 | 36.308 | 0.065 | 0.001 | 0.059 | |||||
| pg18b1git_o2nofp.cx10d_c32r128 | 2.917 | 56.106 | 40.902 | 0.074 | 0.001 | nonzero | 0.068 |
Performance metrics for the DBMS listed above. Some are normalized by throughput, others are not. Legend for results is here.
ips	qps	rps	rmbps	wps	wmbps	rpq	rkbpq	wpi	wkbpi	csps	cpups	cspq	cpupq	dbgb1	dbgb2	rss	maxop	p50	p99	tag
104302	0	2	0.0	1577.1	150.6	0.000	0.000	0.015	1.479	395579	54.1	3.793	249	56.2	152.3	39.4	0.066	4885	2073	pg174_o2nofp.cx10a_c32r128
101266	0	2	0.0	1509.4	144.1	0.000	0.000	0.015	1.458	382770	52.9	3.780	251	55.9	152.0	30.8	0.068	4825	2273	pg18b1git_o2nofp.cx10b_c32r128
104439	0	0	0.0	1600.6	152.9	0.000	0.000	0.015	1.499	394047	54.2	3.773	249	56.3	152.4	19.8	0.058	4222	2707	pg18b1git_o2nofp.cx10cw2_c32r128
102302	0	0	0.0	1531.2	146.7	0.000	0.000	0.015	1.469	387672	54.1	3.790	254	55.9	152.0	16.3	0.072	4795	3603	pg18b1git_o2nofp.cx10d_c32r128
qr100.L1
qr100.L1: range queries with 100 insert/s per client. Graphs for performance per 1-second interval are here.
Average throughput:
Query response time histogram: each cell has the percentage of responses that take <= the time in the header and max is the max response time in seconds. For max values in the top 25% of the range have a red background and in the bottom 25% of the range have a green background. The red background is not used when the min value is within 80% of the max value.
| dbms | 256us | 1ms | 4ms | 16ms | 64ms | 256ms | 1s | 4s | 16s | gt | max |
|---|---|---|---|---|---|---|---|---|---|---|---|
| pg174_o2nofp.cx10a_c32r128 | 99.997 | 0.002 | 0.001 | nonzero | 0.012 | ||||||
| pg18b1git_o2nofp.cx10b_c32r128 | 99.996 | 0.002 | 0.002 | nonzero | 0.008 | ||||||
| pg18b1git_o2nofp.cx10cw2_c32r128 | 99.997 | 0.002 | 0.002 | nonzero | 0.009 | ||||||
| pg18b1git_o2nofp.cx10d_c32r128 | 99.997 | 0.002 | 0.002 | nonzero | nonzero | 0.016 |
Insert response time histogram: each cell has the percentage of responses that take <= the time in the header and max is the max response time in seconds. For max values in the top 25% of the range have a red background and in the bottom 25% of the range have a green background. The red background is not used when the min value is within 80% of the max value.
| dbms | 256us | 1ms | 4ms | 16ms | 64ms | 256ms | 1s | 4s | 16s | gt | max |
|---|---|---|---|---|---|---|---|---|---|---|---|
| pg174_o2nofp.cx10a_c32r128 | 0.004 | 99.724 | 0.272 | 0.009 | |||||||
| pg18b1git_o2nofp.cx10b_c32r128 | 0.003 | 99.706 | 0.292 | 0.013 | |||||||
| pg18b1git_o2nofp.cx10cw2_c32r128 | 0.004 | 99.744 | 0.251 | 0.009 | |||||||
| pg18b1git_o2nofp.cx10d_c32r128 | 0.010 | 99.719 | 0.271 | 0.015 |
Delete response time histogram: each cell has the percentage of responses that take <= the time in the header and max is the max response time in seconds. For max values in the top 25% of the range have a red background and in the bottom 25% of the range have a green background. The red background is not used when the min value is within 80% of the max value.
| dbms | 256us | 1ms | 4ms | 16ms | 64ms | 256ms | 1s | 4s | 16s | gt | max |
|---|---|---|---|---|---|---|---|---|---|---|---|
| pg174_o2nofp.cx10a_c32r128 | 67.388 | 32.593 | 0.019 | 0.005 | |||||||
| pg18b1git_o2nofp.cx10b_c32r128 | 64.167 | 35.807 | 0.026 | 0.009 | |||||||
| pg18b1git_o2nofp.cx10cw2_c32r128 | 65.692 | 34.278 | 0.031 | 0.009 | |||||||
| pg18b1git_o2nofp.cx10d_c32r128 | 64.571 | 35.400 | 0.029 | 0.008 |
Performance metrics for the DBMS listed above. Some are normalized by throughput, others are not. Legend for results is here.
ips	qps	rps	rmbps	wps	wmbps	rpq	rkbpq	wpi	wkbpi	csps	cpups	cspq	cpupq	dbgb1	dbgb2	rss	maxop	p50	p99	tag
1977	395352	0	0.0	122.8	10.4	0.000	0.000	0.062	5.410	1503014	42.5	3.802	52	56.2	152.3	0.5	0.012	19921	18284	pg174_o2nofp.cx10a_c32r128
1977	386634	0	0.0	126.7	10.5	0.000	0.000	0.064	5.423	1469681	42.5	3.801	53	55.9	152.0	0.5	0.008	19371	17756	pg18b1git_o2nofp.cx10b_c32r128
1977	391631	0	0.0	128.7	10.4	0.000	0.000	0.065	5.402	1488753	42.5	3.801	52	56.3	152.4	0.5	0.009	19721	17869	pg18b1git_o2nofp.cx10cw2_c32r128
1977	389751	1	0.0	123.1	10.5	0.000	0.000	0.062	5.419	1481576	42.5	3.801	52	55.9	151.9	0.5	0.016	19548	17981	pg18b1git_o2nofp.cx10d_c32r128
qp100.L2
qp100.L2: point queries with 100 insert/s per client. Graphs for performance per 1-second interval are here.
Average throughput:
Query response time histogram: each cell has the percentage of responses that take <= the time in the header and max is the max response time in seconds. For max values in the top 25% of the range have a red background and in the bottom 25% of the range have a green background. The red background is not used when the min value is within 80% of the max value.
| dbms | 256us | 1ms | 4ms | 16ms | 64ms | 256ms | 1s | 4s | 16s | gt | max |
|---|---|---|---|---|---|---|---|---|---|---|---|
| pg174_o2nofp.cx10a_c32r128 | 99.701 | 0.232 | 0.067 | nonzero | 0.010 | ||||||
| pg18b1git_o2nofp.cx10b_c32r128 | 99.696 | 0.244 | 0.060 | nonzero | 0.009 | ||||||
| pg18b1git_o2nofp.cx10cw2_c32r128 | 99.696 | 0.241 | 0.063 | nonzero | 0.007 | ||||||
| pg18b1git_o2nofp.cx10d_c32r128 | 99.898 | 0.084 | 0.018 | nonzero | 0.008 |
Insert response time histogram: each cell has the percentage of responses that take <= the time in the header and max is the max response time in seconds. For max values in the top 25% of the range have a red background and in the bottom 25% of the range have a green background. The red background is not used when the min value is within 80% of the max value.
| dbms | 256us | 1ms | 4ms | 16ms | 64ms | 256ms | 1s | 4s | 16s | gt | max |
|---|---|---|---|---|---|---|---|---|---|---|---|
| pg174_o2nofp.cx10a_c32r128 | 99.600 | 0.400 | 0.012 | ||||||||
| pg18b1git_o2nofp.cx10b_c32r128 | 99.597 | 0.403 | 0.009 | ||||||||
| pg18b1git_o2nofp.cx10cw2_c32r128 | 99.658 | 0.342 | 0.008 | ||||||||
| pg18b1git_o2nofp.cx10d_c32r128 | 99.747 | 0.253 | 0.009 |
Delete response time histogram: each cell has the percentage of responses that take <= the time in the header and max is the max response time in seconds. For max values in the top 25% of the range have a red background and in the bottom 25% of the range have a green background. The red background is not used when the min value is within 80% of the max value.
| dbms | 256us | 1ms | 4ms | 16ms | 64ms | 256ms | 1s | 4s | 16s | gt | max |
|---|---|---|---|---|---|---|---|---|---|---|---|
| pg174_o2nofp.cx10a_c32r128 | 6.093 | 93.806 | 0.101 | 0.009 | |||||||
| pg18b1git_o2nofp.cx10b_c32r128 | 6.829 | 93.074 | 0.097 | 0.010 | |||||||
| pg18b1git_o2nofp.cx10cw2_c32r128 | 3.025 | 96.879 | 0.096 | 0.009 | |||||||
| pg18b1git_o2nofp.cx10d_c32r128 | 3.411 | 96.524 | 0.065 | 0.010 |
Performance metrics for the DBMS listed above. Some are normalized by throughput, others are not. Legend for results is here.
ips	qps	rps	rmbps	wps	wmbps	rpq	rkbpq	wpi	wkbpi	csps	cpups	cspq	cpupq	dbgb1	dbgb2	rss	maxop	p50	p99	tag
1977	127814	0	0.0	347.0	17.9	0.000	0.000	0.176	9.259	512487	44.4	4.010	167	56.2	149.1	0.5	0.010	6475	6313	pg174_o2nofp.cx10a_c32r128
1977	122969	0	0.0	345.2	17.8	0.000	0.000	0.175	9.224	495346	45.3	4.028	177	55.9	148.7	0.5	0.009	6265	6124	pg18b1git_o2nofp.cx10b_c32r128
1977	125804	0	0.0	349.8	17.9	0.000	0.000	0.177	9.257	505076	44.8	4.015	171	56.4	149.2	0.5	0.007	6425	6284	pg18b1git_o2nofp.cx10cw2_c32r128
1977	101388	0	0.0	342.7	17.8	0.000	0.000	0.173	9.240	404930	38.3	3.994	181	55.9	148.7	0.5	0.008	5131	5003	pg18b1git_o2nofp.cx10d_c32r128
qr500.L3
qr500.L3: range queries with 500 insert/s per client. Graphs for performance per 1-second interval are here.
Average throughput:
Query response time histogram: each cell has the percentage of responses that take <= the time in the header and max is the max response time in seconds. For max values in the top 25% of the range have a red background and in the bottom 25% of the range have a green background. The red background is not used when the min value is within 80% of the max value.
| dbms | 256us | 1ms | 4ms | 16ms | 64ms | 256ms | 1s | 4s | 16s | gt | max |
|---|---|---|---|---|---|---|---|---|---|---|---|
| pg174_o2nofp.cx10a_c32r128 | 99.987 | 0.006 | 0.007 | nonzero | nonzero | nonzero | 0.076 | ||||
| pg18b1git_o2nofp.cx10b_c32r128 | 99.987 | 0.006 | 0.007 | nonzero | nonzero | nonzero | 0.072 | ||||
| pg18b1git_o2nofp.cx10cw2_c32r128 | 99.987 | 0.006 | 0.007 | nonzero | nonzero | 0.058 | |||||
| pg18b1git_o2nofp.cx10d_c32r128 | 99.987 | 0.006 | 0.007 | nonzero | nonzero | 0.018 |
Insert response time histogram: each cell has the percentage of responses that take <= the time in the header and max is the max response time in seconds. For max values in the top 25% of the range have a red background and in the bottom 25% of the range have a green background. The red background is not used when the min value is within 80% of the max value.
| dbms | 256us | 1ms | 4ms | 16ms | 64ms | 256ms | 1s | 4s | 16s | gt | max |
|---|---|---|---|---|---|---|---|---|---|---|---|
| pg174_o2nofp.cx10a_c32r128 | 7.587 | 91.469 | 0.920 | 0.024 | 0.029 | ||||||
| pg18b1git_o2nofp.cx10b_c32r128 | 6.623 | 92.271 | 1.059 | 0.048 | 0.035 | ||||||
| pg18b1git_o2nofp.cx10cw2_c32r128 | 9.593 | 89.381 | 0.972 | 0.054 | 0.036 | ||||||
| pg18b1git_o2nofp.cx10d_c32r128 | 6.182 | 92.909 | 0.867 | 0.042 | 0.034 |
Delete response time histogram: each cell has the percentage of responses that take <= the time in the header and max is the max response time in seconds. For max values in the top 25% of the range have a red background and in the bottom 25% of the range have a green background. The red background is not used when the min value is within 80% of the max value.
| dbms | 256us | 1ms | 4ms | 16ms | 64ms | 256ms | 1s | 4s | 16s | gt | max |
|---|---|---|---|---|---|---|---|---|---|---|---|
| pg174_o2nofp.cx10a_c32r128 | 52.816 | 46.565 | 0.617 | 0.003 | 0.023 | ||||||
| pg18b1git_o2nofp.cx10b_c32r128 | 48.671 | 50.592 | 0.713 | 0.024 | 0.022 | ||||||
| pg18b1git_o2nofp.cx10cw2_c32r128 | 49.910 | 49.430 | 0.634 | 0.025 | 0.024 | ||||||
| pg18b1git_o2nofp.cx10d_c32r128 | 49.289 | 50.114 | 0.580 | 0.016 | 0.028 |
Performance metrics for the DBMS listed above. Some are normalized by throughput, others are not. Legend for results is here.
ips	qps	rps	rmbps	wps	wmbps	rpq	rkbpq	wpi	wkbpi	csps	cpups	cspq	cpupq	dbgb1	dbgb2	rss	maxop	p50	p99	tag
9885	380694	0	0.0	515.6	27.4	0.000	0.000	0.052	2.839	1441340	43.1	3.786	54	56.2	142.4	9.3	0.076	19234	17022	pg174_o2nofp.cx10a_c32r128
9885	374216	0	0.0	515.9	27.9	0.000	0.000	0.052	2.888	1416677	43.2	3.786	55	56.0	142.1	6.0	0.072	19099	16565	pg18b1git_o2nofp.cx10b_c32r128
9879	376837	0	0.0	522.3	27.9	0.000	0.000	0.053	2.892	1427671	43.2	3.789	55	56.4	142.5	17.6	0.058	19052	16894	pg18b1git_o2nofp.cx10cw2_c32r128
9885	378644	0	0.0	510.0	27.4	0.000	0.000	0.052	2.836	1433199	43.2	3.785	55	56.0	142.1	1.4	0.018	19339	17005	pg18b1git_o2nofp.cx10d_c32r128
qp500.L4
qp500.L4: point queries with 500 insert/s per client. Graphs for performance per 1-second interval are here.
Average throughput:
Query response time histogram: each cell has the percentage of responses that take <= the time in the header and max is the max response time in seconds. For max values in the top 25% of the range have a red background and in the bottom 25% of the range have a green background. The red background is not used when the min value is within 80% of the max value.
| dbms | 256us | 1ms | 4ms | 16ms | 64ms | 256ms | 1s | 4s | 16s | gt | max |
|---|---|---|---|---|---|---|---|---|---|---|---|
| pg174_o2nofp.cx10a_c32r128 | 99.630 | 0.279 | 0.090 | 0.001 | nonzero | nonzero | 0.071 | ||||
| pg18b1git_o2nofp.cx10b_c32r128 | 99.614 | 0.300 | 0.086 | 0.001 | nonzero | nonzero | 0.078 | ||||
| pg18b1git_o2nofp.cx10cw2_c32r128 | 99.619 | 0.293 | 0.087 | 0.001 | nonzero | 0.016 | |||||
| pg18b1git_o2nofp.cx10d_c32r128 | 99.841 | 0.122 | 0.037 | 0.001 | nonzero | 0.018 |
Insert response time histogram: each cell has the percentage of responses that take <= the time in the header and max is the max response time in seconds. For max values in the top 25% of the range have a red background and in the bottom 25% of the range have a green background. The red background is not used when the min value is within 80% of the max value.
| dbms | 256us | 1ms | 4ms | 16ms | 64ms | 256ms | 1s | 4s | 16s | gt | max |
|---|---|---|---|---|---|---|---|---|---|---|---|
| pg174_o2nofp.cx10a_c32r128 | 2.566 | 96.621 | 0.801 | 0.011 | 0.038 | ||||||
| pg18b1git_o2nofp.cx10b_c32r128 | 2.237 | 96.998 | 0.754 | 0.011 | 0.054 | ||||||
| pg18b1git_o2nofp.cx10cw2_c32r128 | 1.498 | 97.781 | 0.702 | 0.019 | 0.032 | ||||||
| pg18b1git_o2nofp.cx10d_c32r128 | 1.415 | 97.758 | 0.805 | 0.022 | 0.041 |
Delete response time histogram: each cell has the percentage of responses that take <= the time in the header and max is the max response time in seconds. For max values in the top 25% of the range have a red background and in the bottom 25% of the range have a green background. The red background is not used when the min value is within 80% of the max value.
| dbms | 256us | 1ms | 4ms | 16ms | 64ms | 256ms | 1s | 4s | 16s | gt | max |
|---|---|---|---|---|---|---|---|---|---|---|---|
| pg174_o2nofp.cx10a_c32r128 | 42.622 | 56.830 | 0.538 | 0.009 | 0.034 | ||||||
| pg18b1git_o2nofp.cx10b_c32r128 | 44.728 | 54.731 | 0.527 | 0.014 | 0.022 | ||||||
| pg18b1git_o2nofp.cx10cw2_c32r128 | 42.373 | 57.021 | 0.591 | 0.016 | 0.038 | ||||||
| pg18b1git_o2nofp.cx10d_c32r128 | 42.200 | 57.199 | 0.577 | 0.024 | 0.032 |
Performance metrics for the DBMS listed above. Some are normalized by throughput, others are not. Legend for results is here.
ips	qps	rps	rmbps	wps	wmbps	rpq	rkbpq	wpi	wkbpi	csps	cpups	cspq	cpupq	dbgb1	dbgb2	rss	maxop	p50	p99	tag
9885	126936	0	0.0	350.0	29.2	0.000	0.000	0.035	3.021	509658	45.4	4.015	172	56.2	138.3	14.9	0.071	6441	6249	pg174_o2nofp.cx10a_c32r128
9879	122137	1	0.0	345.4	27.3	0.000	0.000	0.035	2.833	492990	45.7	4.036	180	56.1	138.1	1.9	0.078	6217	6033	pg18b1git_o2nofp.cx10b_c32r128
9885	124833	0	0.0	355.8	27.8	0.000	0.000	0.036	2.881	502132	45.6	4.022	175	56.5	138.5	15.4	0.016	6361	6185	pg18b1git_o2nofp.cx10cw2_c32r128
9885	101394	0	0.0	344.0	27.6	0.000	0.000	0.035	2.862	406526	39.2	4.009	186	56.0	138.0	2.8	0.018	5131	4939	pg18b1git_o2nofp.cx10d_c32r128
qr1000.L5
qr1000.L5: range queries with 1000 insert/s per client. Graphs for performance per 1-second interval are here.
Average throughput:
Query response time histogram: each cell has the percentage of responses that take <= the time in the header and max is the max response time in seconds. For max values in the top 25% of the range have a red background and in the bottom 25% of the range have a green background. The red background is not used when the min value is within 80% of the max value.
| dbms | 256us | 1ms | 4ms | 16ms | 64ms | 256ms | 1s | 4s | 16s | gt | max |
|---|---|---|---|---|---|---|---|---|---|---|---|
| pg174_o2nofp.cx10a_c32r128 | 99.977 | 0.011 | 0.011 | nonzero | nonzero | nonzero | 0.091 | ||||
| pg18b1git_o2nofp.cx10b_c32r128 | 99.976 | 0.012 | 0.011 | nonzero | nonzero | nonzero | 0.099 | ||||
| pg18b1git_o2nofp.cx10cw2_c32r128 | 99.976 | 0.013 | 0.011 | nonzero | nonzero | nonzero | 0.086 | ||||
| pg18b1git_o2nofp.cx10d_c32r128 | 99.976 | 0.012 | 0.011 | nonzero | nonzero | nonzero | 0.099 |
Insert response time histogram: each cell has the percentage of responses that take <= the time in the header and max is the max response time in seconds. For max values in the top 25% of the range have a red background and in the bottom 25% of the range have a green background. The red background is not used when the min value is within 80% of the max value.
| dbms | 256us | 1ms | 4ms | 16ms | 64ms | 256ms | 1s | 4s | 16s | gt | max |
|---|---|---|---|---|---|---|---|---|---|---|---|
| pg174_o2nofp.cx10a_c32r128 | 23.917 | 75.466 | 0.604 | 0.014 | 0.042 | ||||||
| pg18b1git_o2nofp.cx10b_c32r128 | 23.332 | 76.115 | 0.520 | 0.034 | 0.052 | ||||||
| pg18b1git_o2nofp.cx10cw2_c32r128 | 30.402 | 68.989 | 0.587 | 0.022 | 0.039 | ||||||
| pg18b1git_o2nofp.cx10d_c32r128 | 23.850 | 75.630 | 0.478 | 0.042 | 0.051 |
Delete response time histogram: each cell has the percentage of responses that take <= the time in the header and max is the max response time in seconds. For max values in the top 25% of the range have a red background and in the bottom 25% of the range have a green background. The red background is not used when the min value is within 80% of the max value.
| dbms | 256us | 1ms | 4ms | 16ms | 64ms | 256ms | 1s | 4s | 16s | gt | max |
|---|---|---|---|---|---|---|---|---|---|---|---|
| pg174_o2nofp.cx10a_c32r128 | 53.522 | 46.112 | 0.359 | 0.006 | 0.042 | ||||||
| pg18b1git_o2nofp.cx10b_c32r128 | 51.889 | 47.667 | 0.426 | 0.018 | 0.037 | ||||||
| pg18b1git_o2nofp.cx10cw2_c32r128 | 56.181 | 43.329 | 0.478 | 0.011 | 0.030 | ||||||
| pg18b1git_o2nofp.cx10d_c32r128 | 48.966 | 50.574 | 0.439 | 0.021 | 0.033 |
Performance metrics for the DBMS listed above. Some are normalized by throughput, others are not. Legend for results is here.
ips	qps	rps	rmbps	wps	wmbps	rpq	rkbpq	wpi	wkbpi	csps	cpups	cspq	cpupq	dbgb1	dbgb2	rss	maxop	p50	p99	tag
19758	375704	0	0.0	401.2	33.4	0.000	0.000	0.020	1.733	1417844	44.1	3.774	56	56.3	134.7	33.4	0.091	19083	16670	pg174_o2nofp.cx10a_c32r128
19769	370528	0	0.0	413.1	35.3	0.000	0.000	0.021	1.827	1398748	44.2	3.775	57	56.0	134.5	9.2	0.099	18812	16474	pg18b1git_o2nofp.cx10b_c32r128
19758	376508	0	0.0	416.9	34.9	0.000	0.000	0.021	1.810	1421640	44.2	3.776	56	56.6	135.1	3.1	0.086	19163	16996	pg18b1git_o2nofp.cx10cw2_c32r128
19758	373151	0	0.0	404.7	35.3	0.000	0.000	0.020	1.829	1408300	44.2	3.774	57	56.1	134.5	4.4	0.099	19019	16494	pg18b1git_o2nofp.cx10d_c32r128
qp1000.L6
qp1000.L6: point queries with 1000 insert/s per client. Graphs for performance per 1-second interval are here.
Average throughput:
Query response time histogram: each cell has the percentage of responses that take <= the time in the header and max is the max response time in seconds. For max values in the top 25% of the range have a red background and in the bottom 25% of the range have a green background. The red background is not used when the min value is within 80% of the max value.
| dbms | 256us | 1ms | 4ms | 16ms | 64ms | 256ms | 1s | 4s | 16s | gt | max |
|---|---|---|---|---|---|---|---|---|---|---|---|
| pg174_o2nofp.cx10a_c32r128 | 99.504 | 0.370 | 0.124 | 0.002 | nonzero | nonzero | 0.086 | ||||
| pg18b1git_o2nofp.cx10b_c32r128 | 99.477 | 0.402 | 0.119 | 0.002 | nonzero | nonzero | 0.094 | ||||
| pg18b1git_o2nofp.cx10cw2_c32r128 | 99.494 | 0.383 | 0.120 | 0.002 | nonzero | nonzero | 0.097 | ||||
| pg18b1git_o2nofp.cx10d_c32r128 | 99.734 | 0.200 | 0.064 | 0.002 | nonzero | nonzero | 0.083 |
Insert response time histogram: each cell has the percentage of responses that take <= the time in the header and max is the max response time in seconds. For max values in the top 25% of the range have a red background and in the bottom 25% of the range have a green background. The red background is not used when the min value is within 80% of the max value.
| dbms | 256us | 1ms | 4ms | 16ms | 64ms | 256ms | 1s | 4s | 16s | gt | max |
|---|---|---|---|---|---|---|---|---|---|---|---|
| pg174_o2nofp.cx10a_c32r128 | 9.332 | 89.626 | 0.990 | 0.052 | 0.050 | ||||||
| pg18b1git_o2nofp.cx10b_c32r128 | 9.046 | 89.992 | 0.887 | 0.074 | nonzero | 0.081 | |||||
| pg18b1git_o2nofp.cx10cw2_c32r128 | 8.065 | 90.992 | 0.895 | 0.048 | 0.044 | ||||||
| pg18b1git_o2nofp.cx10d_c32r128 | 8.378 | 90.797 | 0.803 | 0.021 | 0.043 |
Delete response time histogram: each cell has the percentage of responses that take <= the time in the header and max is the max response time in seconds. For max values in the top 25% of the range have a red background and in the bottom 25% of the range have a green background. The red background is not used when the min value is within 80% of the max value.
| dbms | 256us | 1ms | 4ms | 16ms | 64ms | 256ms | 1s | 4s | 16s | gt | max |
|---|---|---|---|---|---|---|---|---|---|---|---|
| pg174_o2nofp.cx10a_c32r128 | 53.062 | 46.147 | 0.765 | 0.026 | 0.041 | ||||||
| pg18b1git_o2nofp.cx10b_c32r128 | 52.753 | 46.126 | 1.033 | 0.088 | nonzero | 0.081 | |||||
| pg18b1git_o2nofp.cx10cw2_c32r128 | 53.516 | 45.249 | 1.185 | 0.049 | 0.034 | ||||||
| pg18b1git_o2nofp.cx10d_c32r128 | 51.127 | 47.914 | 0.938 | 0.021 | 0.026 |
Performance metrics for the DBMS listed above. Some are normalized by throughput, others are not. Legend for results is here.
ips	qps	rps	rmbps	wps	wmbps	rpq	rkbpq	wpi	wkbpi	csps	cpups	cspq	cpupq	dbgb1	dbgb2	rss	maxop	p50	p99	tag
19769	125548	0	0.0	415.9	35.8	0.000	0.000	0.021	1.856	505877	46.1	4.029	176	56.0	133.3	11.4	0.086	6379	6121	pg174_o2nofp.cx10a_c32r128
19769	120865	13	0.3	405.8	35.0	0.000	0.003	0.021	1.811	489781	46.5	4.052	185	55.8	133.0	7.9	0.094	6137	5866	pg18b1git_o2nofp.cx10b_c32r128
19769	123498	0	0.0	411.1	35.1	0.000	0.000	0.021	1.818	498096	46.2	4.033	180	56.0	133.3	12.3	0.097	6297	6009	pg18b1git_o2nofp.cx10cw2_c32r128
19769	102795	0	0.0	402.2	35.0	0.000	0.000	0.020	1.811	414649	41.1	4.034	192	55.9	133.1	18.6	0.083	5210	5019	pg18b1git_o2nofp.cx10d_c32r128
l.i0
l.i0: load without secondary indexes
Performance metrics for all DBMS, not just the ones listed above. Some are normalized by throughput, others are not. Legend for results is here.
ips	qps	rps	rmbps	wps	wmbps	rpq	rkbpq	wpi	wkbpi	csps	cpups	cspq	cpupq	dbgb1	dbgb2	rss	maxop	p50	p99	tag
1652892	0	2	0.0	6632.7	705.8	0.000	0.000	0.004	0.437	269603	44.1	0.163	13	19.1	51.7	1.4	0.859	112017	22375	pg174_o2nofp.cx10a_c32r128
1709402	0	3	0.0	6819.9	719.8	0.000	0.000	0.004	0.431	256346	45.4	0.150	13	19.1	51.7	0.4	0.702	115091	35361	pg18b1git_o2nofp.cx10b_c32r128
1680672	0	4	0.0	6708.2	707.0	0.000	0.000	0.004	0.431	252469	43.9	0.150	13	19.1	51.7	1.4	0.911	114233	10093	pg18b1git_o2nofp.cx10cw2_c32r128
1724138	0	3	0.0	6829.9	722.9	0.000	0.000	0.004	0.429	263952	45.8	0.153	13	19.1	51.7	0.4	0.486	113513	55559	pg18b1git_o2nofp.cx10d_c32r128
l.x
l.x: create secondary indexes
Performance metrics for all DBMS, not just the ones listed above. Some are normalized by throughput, others are not. Legend for results is here.
ips	qps	rps	rmbps	wps	wmbps	rpq	rkbpq	wpi	wkbpi	csps	cpups	cspq	cpupq	dbgb1	dbgb2	rss	maxop	p50	p99	tag
2597404	0	4	0.0	6599.1	769.3	0.000	0.000	0.003	0.303	41405	15.0	0.016	3	38.4	88.5	7.2	0.037	NA	NA	pg174_o2nofp.cx10a_c32r128
2666668	0	4	0.0	6907.6	800.7	0.000	0.000	0.003	0.307	35110	15.0	0.013	3	38.4	88.5	7.2	0.043	NA	NA	pg18b1git_o2nofp.cx10b_c32r128
2666668	0	4	0.0	6889.9	798.5	0.000	0.000	0.003	0.307	33934	14.8	0.013	3	38.4	88.5	7.2	0.031	NA	NA	pg18b1git_o2nofp.cx10cw2_c32r128
2816903	0	4	0.0	7300.3	848.2	0.000	0.000	0.003	0.308	37787	15.6	0.013	3	38.4	88.5	7.0	0.036	NA	NA	pg18b1git_o2nofp.cx10d_c32r128
l.i1
l.i1: continue load after secondary indexes created with 50 inserts per transaction
Performance metrics for all DBMS, not just the ones listed above. Some are normalized by throughput, others are not. Legend for results is here.
ips	qps	rps	rmbps	wps	wmbps	rpq	rkbpq	wpi	wkbpi	csps	cpups	cspq	cpupq	dbgb1	dbgb2	rss	maxop	p50	p99	tag
389294	0	637	2.9	6376.2	606.6	0.002	0.008	0.016	1.596	253356	52.6	0.651	65	56.0	152.0	23.3	1.020	22562	3097	pg174_o2nofp.cx10a_c32r128
401002	0	64	0.3	6580.3	626.4	0.000	0.001	0.016	1.599	247357	54.0	0.617	65	55.7	151.8	9.6	0.568	22974	3246	pg18b1git_o2nofp.cx10b_c32r128
395550	0	109	0.6	6460.0	612.8	0.000	0.001	0.016	1.586	238154	53.5	0.602	65	56.2	152.2	24.0	0.744	23175	3396	pg18b1git_o2nofp.cx10cw2_c32r128
401002	0	83	0.4	6556.8	625.2	0.000	0.001	0.016	1.597	245868	54.3	0.613	65	55.6	151.7	49.7	0.885	22975	3248	pg18b1git_o2nofp.cx10d_c32r128
l.i2
l.i2: continue load after secondary indexes created with 5 inserts per transaction
Performance metrics for all DBMS, not just the ones listed above. Some are normalized by throughput, others are not. Legend for results is here.
ips	qps	rps	rmbps	wps	wmbps	rpq	rkbpq	wpi	wkbpi	csps	cpups	cspq	cpupq	dbgb1	dbgb2	rss	maxop	p50	p99	tag
104302	0	2	0.0	1577.1	150.6	0.000	0.000	0.015	1.479	395579	54.1	3.793	249	56.2	152.3	39.4	0.066	4885	2073	pg174_o2nofp.cx10a_c32r128
101266	0	2	0.0	1509.4	144.1	0.000	0.000	0.015	1.458	382770	52.9	3.780	251	55.9	152.0	30.8	0.068	4825	2273	pg18b1git_o2nofp.cx10b_c32r128
104439	0	0	0.0	1600.6	152.9	0.000	0.000	0.015	1.499	394047	54.2	3.773	249	56.3	152.4	19.8	0.058	4222	2707	pg18b1git_o2nofp.cx10cw2_c32r128
102302	0	0	0.0	1531.2	146.7	0.000	0.000	0.015	1.469	387672	54.1	3.790	254	55.9	152.0	16.3	0.072	4795	3603	pg18b1git_o2nofp.cx10d_c32r128
qr100.L1
qr100.L1: range queries with 100 insert/s per client
Performance metrics for all DBMS, not just the ones listed above. Some are normalized by throughput, others are not. Legend for results is here.
ips	qps	rps	rmbps	wps	wmbps	rpq	rkbpq	wpi	wkbpi	csps	cpups	cspq	cpupq	dbgb1	dbgb2	rss	maxop	p50	p99	tag
1977	395352	0	0.0	122.8	10.4	0.000	0.000	0.062	5.410	1503014	42.5	3.802	52	56.2	152.3	0.5	0.012	19921	18284	pg174_o2nofp.cx10a_c32r128
1977	386634	0	0.0	126.7	10.5	0.000	0.000	0.064	5.423	1469681	42.5	3.801	53	55.9	152.0	0.5	0.008	19371	17756	pg18b1git_o2nofp.cx10b_c32r128
1977	391631	0	0.0	128.7	10.4	0.000	0.000	0.065	5.402	1488753	42.5	3.801	52	56.3	152.4	0.5	0.009	19721	17869	pg18b1git_o2nofp.cx10cw2_c32r128
1977	389751	1	0.0	123.1	10.5	0.000	0.000	0.062	5.419	1481576	42.5	3.801	52	55.9	151.9	0.5	0.016	19548	17981	pg18b1git_o2nofp.cx10d_c32r128
qp100.L2
qp100.L2: point queries with 100 insert/s per client
Performance metrics for all DBMS, not just the ones listed above. Some are normalized by throughput, others are not. Legend for results is here.
ips	qps	rps	rmbps	wps	wmbps	rpq	rkbpq	wpi	wkbpi	csps	cpups	cspq	cpupq	dbgb1	dbgb2	rss	maxop	p50	p99	tag
1977	127814	0	0.0	347.0	17.9	0.000	0.000	0.176	9.259	512487	44.4	4.010	167	56.2	149.1	0.5	0.010	6475	6313	pg174_o2nofp.cx10a_c32r128
1977	122969	0	0.0	345.2	17.8	0.000	0.000	0.175	9.224	495346	45.3	4.028	177	55.9	148.7	0.5	0.009	6265	6124	pg18b1git_o2nofp.cx10b_c32r128
1977	125804	0	0.0	349.8	17.9	0.000	0.000	0.177	9.257	505076	44.8	4.015	171	56.4	149.2	0.5	0.007	6425	6284	pg18b1git_o2nofp.cx10cw2_c32r128
1977	101388	0	0.0	342.7	17.8	0.000	0.000	0.173	9.240	404930	38.3	3.994	181	55.9	148.7	0.5	0.008	5131	5003	pg18b1git_o2nofp.cx10d_c32r128
qr500.L3
qr500.L3: range queries with 500 insert/s per client
Performance metrics for all DBMS, not just the ones listed above. Some are normalized by throughput, others are not. Legend for results is here.
ips	qps	rps	rmbps	wps	wmbps	rpq	rkbpq	wpi	wkbpi	csps	cpups	cspq	cpupq	dbgb1	dbgb2	rss	maxop	p50	p99	tag
9885	380694	0	0.0	515.6	27.4	0.000	0.000	0.052	2.839	1441340	43.1	3.786	54	56.2	142.4	9.3	0.076	19234	17022	pg174_o2nofp.cx10a_c32r128
9885	374216	0	0.0	515.9	27.9	0.000	0.000	0.052	2.888	1416677	43.2	3.786	55	56.0	142.1	6.0	0.072	19099	16565	pg18b1git_o2nofp.cx10b_c32r128
9879	376837	0	0.0	522.3	27.9	0.000	0.000	0.053	2.892	1427671	43.2	3.789	55	56.4	142.5	17.6	0.058	19052	16894	pg18b1git_o2nofp.cx10cw2_c32r128
9885	378644	0	0.0	510.0	27.4	0.000	0.000	0.052	2.836	1433199	43.2	3.785	55	56.0	142.1	1.4	0.018	19339	17005	pg18b1git_o2nofp.cx10d_c32r128
qp500.L4
qp500.L4: point queries with 500 insert/s per client
Performance metrics for all DBMS, not just the ones listed above. Some are normalized by throughput, others are not. Legend for results is here.
ips	qps	rps	rmbps	wps	wmbps	rpq	rkbpq	wpi	wkbpi	csps	cpups	cspq	cpupq	dbgb1	dbgb2	rss	maxop	p50	p99	tag
9885	126936	0	0.0	350.0	29.2	0.000	0.000	0.035	3.021	509658	45.4	4.015	172	56.2	138.3	14.9	0.071	6441	6249	pg174_o2nofp.cx10a_c32r128
9879	122137	1	0.0	345.4	27.3	0.000	0.000	0.035	2.833	492990	45.7	4.036	180	56.1	138.1	1.9	0.078	6217	6033	pg18b1git_o2nofp.cx10b_c32r128
9885	124833	0	0.0	355.8	27.8	0.000	0.000	0.036	2.881	502132	45.6	4.022	175	56.5	138.5	15.4	0.016	6361	6185	pg18b1git_o2nofp.cx10cw2_c32r128
9885	101394	0	0.0	344.0	27.6	0.000	0.000	0.035	2.862	406526	39.2	4.009	186	56.0	138.0	2.8	0.018	5131	4939	pg18b1git_o2nofp.cx10d_c32r128
qr1000.L5
qr1000.L5: range queries with 1000 insert/s per client
Performance metrics for all DBMS, not just the ones listed above. Some are normalized by throughput, others are not. Legend for results is here.
ips	qps	rps	rmbps	wps	wmbps	rpq	rkbpq	wpi	wkbpi	csps	cpups	cspq	cpupq	dbgb1	dbgb2	rss	maxop	p50	p99	tag
19758	375704	0	0.0	401.2	33.4	0.000	0.000	0.020	1.733	1417844	44.1	3.774	56	56.3	134.7	33.4	0.091	19083	16670	pg174_o2nofp.cx10a_c32r128
19769	370528	0	0.0	413.1	35.3	0.000	0.000	0.021	1.827	1398748	44.2	3.775	57	56.0	134.5	9.2	0.099	18812	16474	pg18b1git_o2nofp.cx10b_c32r128
19758	376508	0	0.0	416.9	34.9	0.000	0.000	0.021	1.810	1421640	44.2	3.776	56	56.6	135.1	3.1	0.086	19163	16996	pg18b1git_o2nofp.cx10cw2_c32r128
19758	373151	0	0.0	404.7	35.3	0.000	0.000	0.020	1.829	1408300	44.2	3.774	57	56.1	134.5	4.4	0.099	19019	16494	pg18b1git_o2nofp.cx10d_c32r128
qp1000.L6
qp1000.L6: point queries with 1000 insert/s per client
Performance metrics for all DBMS, not just the ones listed above. Some are normalized by throughput, others are not. Legend for results is here.
ips	qps	rps	rmbps	wps	wmbps	rpq	rkbpq	wpi	wkbpi	csps	cpups	cspq	cpupq	dbgb1	dbgb2	rss	maxop	p50	p99	tag
19769	125548	0	0.0	415.9	35.8	0.000	0.000	0.021	1.856	505877	46.1	4.029	176	56.0	133.3	11.4	0.086	6379	6121	pg174_o2nofp.cx10a_c32r128
19769	120865	13	0.3	405.8	35.0	0.000	0.003	0.021	1.811	489781	46.5	4.052	185	55.8	133.0	7.9	0.094	6137	5866	pg18b1git_o2nofp.cx10b_c32r128
19769	123498	0	0.0	411.1	35.1	0.000	0.000	0.021	1.818	498096	46.2	4.033	180	56.0	133.3	12.3	0.097	6297	6009	pg18b1git_o2nofp.cx10cw2_c32r128
19769	102795	0	0.0	402.2	35.0	0.000	0.000	0.020	1.811	414649	41.1	4.034	192	55.9	133.1	18.6	0.083	5210	5019	pg18b1git_o2nofp.cx10d_c32r128
l.i0
- l.i0: load without secondary indexes
- Legend for results is here.
- Each entry lists the percentage of responses that fit in that bucket (slower than max time for previous bucket, faster than min time for next bucket).
Insert response time histogram
256us	1ms	4ms	16ms	64ms	256ms	1s	4s	16s	gt	max	tag
0.000	92.362	7.590	0.030	0.001	0.007	0.010	0.000	0.000	0.000	0.859	pg174_o2nofp.cx10a_c32r128
0.000	94.290	5.650	0.033	0.011	0.008	0.008	0.000	0.000	0.000	0.702	pg18b1git_o2nofp.cx10b_c32r128
0.000	94.137	5.802	0.032	0.013	0.007	0.009	0.000	0.000	0.000	0.911	pg18b1git_o2nofp.cx10cw2_c32r128
0.000	93.770	6.159	0.038	0.015	0.011	0.006	0.000	0.000	0.000	0.486	pg18b1git_o2nofp.cx10d_c32r128
l.x
- l.x: create secondary indexes
- Legend for results is here.
- Each entry lists the percentage of responses that fit in that bucket (slower than max time for previous bucket, faster than min time for next bucket).
TODO - determine whether there is data for create index response time
l.i1
- l.i1: continue load after secondary indexes created with 50 inserts per transaction
- Legend for results is here.
- Each entry lists the percentage of responses that fit in that bucket (slower than max time for previous bucket, faster than min time for next bucket).
Insert response time histogram
256us	1ms	4ms	16ms	64ms	256ms	1s	4s	16s	gt	max	tag
0.000	1.868	90.131	7.445	0.548	0.006	0.002	nonzero	0.000	0.000	1.020	pg174_o2nofp.cx10a_c32r128
0.000	1.851	90.964	6.509	0.668	0.006	0.001	0.000	0.000	0.000	0.568	pg18b1git_o2nofp.cx10b_c32r128
0.000	2.208	90.925	6.212	0.649	0.005	0.002	0.000	0.000	0.000	0.744	pg18b1git_o2nofp.cx10cw2_c32r128
0.000	2.108	90.842	6.421	0.624	0.005	nonzero	0.000	0.000	0.000	0.885	pg18b1git_o2nofp.cx10d_c32r128
Delete response time histogram
256us	1ms	4ms	16ms	64ms	256ms	1s	4s	16s	gt	max	tag
0.000	22.015	75.053	2.680	0.246	0.005	0.001	nonzero	0.000	0.000	1.019	pg174_o2nofp.cx10a_c32r128
0.000	21.378	75.804	2.446	0.367	0.005	0.001	0.000	0.000	0.000	0.561	pg18b1git_o2nofp.cx10b_c32r128
0.000	21.160	75.880	2.609	0.345	0.004	0.001	0.000	0.000	0.000	0.711	pg18b1git_o2nofp.cx10cw2_c32r128
0.000	21.334	75.743	2.599	0.321	0.003	nonzero	0.000	0.000	0.000	0.910	pg18b1git_o2nofp.cx10d_c32r128
l.i2
- l.i2: continue load after secondary indexes created with 5 inserts per transaction
- Legend for results is here.
- Each entry lists the percentage of responses that fit in that bucket (slower than max time for previous bucket, faster than min time for next bucket).
Insert response time histogram
256us	1ms	4ms	16ms	64ms	256ms	1s	4s	16s	gt	max	tag
90.290	9.387	0.314	0.010	nonzero	nonzero	0.000	0.000	0.000	0.000	0.066	pg174_o2nofp.cx10a_c32r128
90.195	9.492	0.298	0.014	nonzero	nonzero	0.000	0.000	0.000	0.000	0.068	pg18b1git_o2nofp.cx10b_c32r128
89.653	10.014	0.311	0.021	nonzero	0.000	0.000	0.000	0.000	0.000	0.058	pg18b1git_o2nofp.cx10cw2_c32r128
89.616	10.024	0.334	0.026	nonzero	nonzero	0.000	0.000	0.000	0.000	0.072	pg18b1git_o2nofp.cx10d_c32r128
Delete response time histogram
256us	1ms	4ms	16ms	64ms	256ms	1s	4s	16s	gt	max	tag
3.634	59.404	36.918	0.044	0.001	nonzero	0.000	0.000	0.000	0.000	0.067	pg174_o2nofp.cx10a_c32r128
2.999	59.893	37.051	0.056	nonzero	nonzero	0.000	0.000	0.000	0.000	0.068	pg18b1git_o2nofp.cx10b_c32r128
3.092	60.534	36.308	0.065	0.001	0.000	0.000	0.000	0.000	0.000	0.059	pg18b1git_o2nofp.cx10cw2_c32r128
2.917	56.106	40.902	0.074	0.001	nonzero	0.000	0.000	0.000	0.000	0.068	pg18b1git_o2nofp.cx10d_c32r128
qr100.L1
- qr100.L1: range queries with 100 insert/s per client
- Legend for results is here.
- Each entry lists the percentage of responses that fit in that bucket (slower than max time for previous bucket, faster than min time for next bucket).
Query response time histogram
256us	1ms	4ms	16ms	64ms	256ms	1s	4s	16s	gt	max	tag
99.997	0.002	0.001	nonzero	0.000	0.000	0.000	0.000	0.000	0.000	0.012	pg174_o2nofp.cx10a_c32r128
99.996	0.002	0.002	nonzero	0.000	0.000	0.000	0.000	0.000	0.000	0.008	pg18b1git_o2nofp.cx10b_c32r128
99.997	0.002	0.002	nonzero	0.000	0.000	0.000	0.000	0.000	0.000	0.009	pg18b1git_o2nofp.cx10cw2_c32r128
99.997	0.002	0.002	nonzero	nonzero	0.000	0.000	0.000	0.000	0.000	0.016	pg18b1git_o2nofp.cx10d_c32r128
Insert response time histogram
256us	1ms	4ms	16ms	64ms	256ms	1s	4s	16s	gt	max	tag
0.000	0.004	99.724	0.272	0.000	0.000	0.000	0.000	0.000	0.000	0.009	pg174_o2nofp.cx10a_c32r128
0.000	0.003	99.706	0.292	0.000	0.000	0.000	0.000	0.000	0.000	0.013	pg18b1git_o2nofp.cx10b_c32r128
0.000	0.004	99.744	0.251	0.000	0.000	0.000	0.000	0.000	0.000	0.009	pg18b1git_o2nofp.cx10cw2_c32r128
0.000	0.010	99.719	0.271	0.000	0.000	0.000	0.000	0.000	0.000	0.015	pg18b1git_o2nofp.cx10d_c32r128
Delete response time histogram
256us	1ms	4ms	16ms	64ms	256ms	1s	4s	16s	gt	max	tag
0.000	67.388	32.593	0.019	0.000	0.000	0.000	0.000	0.000	0.000	0.005	pg174_o2nofp.cx10a_c32r128
0.000	64.167	35.807	0.026	0.000	0.000	0.000	0.000	0.000	0.000	0.009	pg18b1git_o2nofp.cx10b_c32r128
0.000	65.692	34.278	0.031	0.000	0.000	0.000	0.000	0.000	0.000	0.009	pg18b1git_o2nofp.cx10cw2_c32r128
0.000	64.571	35.400	0.029	0.000	0.000	0.000	0.000	0.000	0.000	0.008	pg18b1git_o2nofp.cx10d_c32r128
qp100.L2
- qp100.L2: point queries with 100 insert/s per client
- Legend for results is here.
- Each entry lists the percentage of responses that fit in that bucket (slower than max time for previous bucket, faster than min time for next bucket).
Query response time histogram
256us	1ms	4ms	16ms	64ms	256ms	1s	4s	16s	gt	max	tag
99.701	0.232	0.067	nonzero	0.000	0.000	0.000	0.000	0.000	0.000	0.010	pg174_o2nofp.cx10a_c32r128
99.696	0.244	0.060	nonzero	0.000	0.000	0.000	0.000	0.000	0.000	0.009	pg18b1git_o2nofp.cx10b_c32r128
99.696	0.241	0.063	nonzero	0.000	0.000	0.000	0.000	0.000	0.000	0.007	pg18b1git_o2nofp.cx10cw2_c32r128
99.898	0.084	0.018	nonzero	0.000	0.000	0.000	0.000	0.000	0.000	0.008	pg18b1git_o2nofp.cx10d_c32r128
Insert response time histogram
256us	1ms	4ms	16ms	64ms	256ms	1s	4s	16s	gt	max	tag
0.000	0.000	99.600	0.400	0.000	0.000	0.000	0.000	0.000	0.000	0.012	pg174_o2nofp.cx10a_c32r128
0.000	0.000	99.597	0.403	0.000	0.000	0.000	0.000	0.000	0.000	0.009	pg18b1git_o2nofp.cx10b_c32r128
0.000	0.000	99.658	0.342	0.000	0.000	0.000	0.000	0.000	0.000	0.008	pg18b1git_o2nofp.cx10cw2_c32r128
0.000	0.000	99.747	0.253	0.000	0.000	0.000	0.000	0.000	0.000	0.009	pg18b1git_o2nofp.cx10d_c32r128
Delete response time histogram
256us	1ms	4ms	16ms	64ms	256ms	1s	4s	16s	gt	max	tag
0.000	6.093	93.806	0.101	0.000	0.000	0.000	0.000	0.000	0.000	0.009	pg174_o2nofp.cx10a_c32r128
0.000	6.829	93.074	0.097	0.000	0.000	0.000	0.000	0.000	0.000	0.010	pg18b1git_o2nofp.cx10b_c32r128
0.000	3.025	96.879	0.096	0.000	0.000	0.000	0.000	0.000	0.000	0.009	pg18b1git_o2nofp.cx10cw2_c32r128
0.000	3.411	96.524	0.065	0.000	0.000	0.000	0.000	0.000	0.000	0.010	pg18b1git_o2nofp.cx10d_c32r128
qr500.L3
- qr500.L3: range queries with 500 insert/s per client
- Legend for results is here.
- Each entry lists the percentage of responses that fit in that bucket (slower than max time for previous bucket, faster than min time for next bucket).
Query response time histogram
256us	1ms	4ms	16ms	64ms	256ms	1s	4s	16s	gt	max	tag
99.987	0.006	0.007	nonzero	nonzero	nonzero	0.000	0.000	0.000	0.000	0.076	pg174_o2nofp.cx10a_c32r128
99.987	0.006	0.007	nonzero	nonzero	nonzero	0.000	0.000	0.000	0.000	0.072	pg18b1git_o2nofp.cx10b_c32r128
99.987	0.006	0.007	nonzero	nonzero	0.000	0.000	0.000	0.000	0.000	0.058	pg18b1git_o2nofp.cx10cw2_c32r128
99.987	0.006	0.007	nonzero	nonzero	0.000	0.000	0.000	0.000	0.000	0.018	pg18b1git_o2nofp.cx10d_c32r128
Insert response time histogram
256us	1ms	4ms	16ms	64ms	256ms	1s	4s	16s	gt	max	tag
0.000	7.587	91.469	0.920	0.024	0.000	0.000	0.000	0.000	0.000	0.029	pg174_o2nofp.cx10a_c32r128
0.000	6.623	92.271	1.059	0.048	0.000	0.000	0.000	0.000	0.000	0.035	pg18b1git_o2nofp.cx10b_c32r128
0.000	9.593	89.381	0.972	0.054	0.000	0.000	0.000	0.000	0.000	0.036	pg18b1git_o2nofp.cx10cw2_c32r128
0.000	6.182	92.909	0.867	0.042	0.000	0.000	0.000	0.000	0.000	0.034	pg18b1git_o2nofp.cx10d_c32r128
Delete response time histogram
256us	1ms	4ms	16ms	64ms	256ms	1s	4s	16s	gt	max	tag
0.000	52.816	46.565	0.617	0.003	0.000	0.000	0.000	0.000	0.000	0.023	pg174_o2nofp.cx10a_c32r128
0.000	48.671	50.592	0.713	0.024	0.000	0.000	0.000	0.000	0.000	0.022	pg18b1git_o2nofp.cx10b_c32r128
0.000	49.910	49.430	0.634	0.025	0.000	0.000	0.000	0.000	0.000	0.024	pg18b1git_o2nofp.cx10cw2_c32r128
0.000	49.289	50.114	0.580	0.016	0.000	0.000	0.000	0.000	0.000	0.028	pg18b1git_o2nofp.cx10d_c32r128
qp500.L4
- qp500.L4: point queries with 500 insert/s per client
- Legend for results is here.
- Each entry lists the percentage of responses that fit in that bucket (slower than max time for previous bucket, faster than min time for next bucket).
Query response time histogram
256us	1ms	4ms	16ms	64ms	256ms	1s	4s	16s	gt	max	tag
99.630	0.279	0.090	0.001	nonzero	nonzero	0.000	0.000	0.000	0.000	0.071	pg174_o2nofp.cx10a_c32r128
99.614	0.300	0.086	0.001	nonzero	nonzero	0.000	0.000	0.000	0.000	0.078	pg18b1git_o2nofp.cx10b_c32r128
99.619	0.293	0.087	0.001	nonzero	0.000	0.000	0.000	0.000	0.000	0.016	pg18b1git_o2nofp.cx10cw2_c32r128
99.841	0.122	0.037	0.001	nonzero	0.000	0.000	0.000	0.000	0.000	0.018	pg18b1git_o2nofp.cx10d_c32r128
Insert response time histogram
256us	1ms	4ms	16ms	64ms	256ms	1s	4s	16s	gt	max	tag
0.000	2.566	96.621	0.801	0.011	0.000	0.000	0.000	0.000	0.000	0.038	pg174_o2nofp.cx10a_c32r128
0.000	2.237	96.998	0.754	0.011	0.000	0.000	0.000	0.000	0.000	0.054	pg18b1git_o2nofp.cx10b_c32r128
0.000	1.498	97.781	0.702	0.019	0.000	0.000	0.000	0.000	0.000	0.032	pg18b1git_o2nofp.cx10cw2_c32r128
0.000	1.415	97.758	0.805	0.022	0.000	0.000	0.000	0.000	0.000	0.041	pg18b1git_o2nofp.cx10d_c32r128
Delete response time histogram
256us	1ms	4ms	16ms	64ms	256ms	1s	4s	16s	gt	max	tag
0.000	42.622	56.830	0.538	0.009	0.000	0.000	0.000	0.000	0.000	0.034	pg174_o2nofp.cx10a_c32r128
0.000	44.728	54.731	0.527	0.014	0.000	0.000	0.000	0.000	0.000	0.022	pg18b1git_o2nofp.cx10b_c32r128
0.000	42.373	57.021	0.591	0.016	0.000	0.000	0.000	0.000	0.000	0.038	pg18b1git_o2nofp.cx10cw2_c32r128
0.000	42.200	57.199	0.577	0.024	0.000	0.000	0.000	0.000	0.000	0.032	pg18b1git_o2nofp.cx10d_c32r128
qr1000.L5
- qr1000.L5: range queries with 1000 insert/s per client
- Legend for results is here.
- Each entry lists the percentage of responses that fit in that bucket (slower than max time for previous bucket, faster than min time for next bucket).
Query response time histogram
256us	1ms	4ms	16ms	64ms	256ms	1s	4s	16s	gt	max	tag
99.977	0.011	0.011	nonzero	nonzero	nonzero	0.000	0.000	0.000	0.000	0.091	pg174_o2nofp.cx10a_c32r128
99.976	0.012	0.011	nonzero	nonzero	nonzero	0.000	0.000	0.000	0.000	0.099	pg18b1git_o2nofp.cx10b_c32r128
99.976	0.013	0.011	nonzero	nonzero	nonzero	0.000	0.000	0.000	0.000	0.086	pg18b1git_o2nofp.cx10cw2_c32r128
99.976	0.012	0.011	nonzero	nonzero	nonzero	0.000	0.000	0.000	0.000	0.099	pg18b1git_o2nofp.cx10d_c32r128
Insert response time histogram
256us	1ms	4ms	16ms	64ms	256ms	1s	4s	16s	gt	max	tag
0.000	23.917	75.466	0.604	0.014	0.000	0.000	0.000	0.000	0.000	0.042	pg174_o2nofp.cx10a_c32r128
0.000	23.332	76.115	0.520	0.034	0.000	0.000	0.000	0.000	0.000	0.052	pg18b1git_o2nofp.cx10b_c32r128
0.000	30.402	68.989	0.587	0.022	0.000	0.000	0.000	0.000	0.000	0.039	pg18b1git_o2nofp.cx10cw2_c32r128
0.000	23.850	75.630	0.478	0.042	0.000	0.000	0.000	0.000	0.000	0.051	pg18b1git_o2nofp.cx10d_c32r128
Delete response time histogram
256us	1ms	4ms	16ms	64ms	256ms	1s	4s	16s	gt	max	tag
0.000	53.522	46.112	0.359	0.006	0.000	0.000	0.000	0.000	0.000	0.042	pg174_o2nofp.cx10a_c32r128
0.000	51.889	47.667	0.426	0.018	0.000	0.000	0.000	0.000	0.000	0.037	pg18b1git_o2nofp.cx10b_c32r128
0.000	56.181	43.329	0.478	0.011	0.000	0.000	0.000	0.000	0.000	0.030	pg18b1git_o2nofp.cx10cw2_c32r128
0.000	48.966	50.574	0.439	0.021	0.000	0.000	0.000	0.000	0.000	0.033	pg18b1git_o2nofp.cx10d_c32r128
qp1000.L6
- qp1000.L6: point queries with 1000 insert/s per client
- Legend for results is here.
- Each entry lists the percentage of responses that fit in that bucket (slower than max time for previous bucket, faster than min time for next bucket).
Query response time histogram
256us	1ms	4ms	16ms	64ms	256ms	1s	4s	16s	gt	max	tag
99.504	0.370	0.124	0.002	nonzero	nonzero	0.000	0.000	0.000	0.000	0.086	pg174_o2nofp.cx10a_c32r128
99.477	0.402	0.119	0.002	nonzero	nonzero	0.000	0.000	0.000	0.000	0.094	pg18b1git_o2nofp.cx10b_c32r128
99.494	0.383	0.120	0.002	nonzero	nonzero	0.000	0.000	0.000	0.000	0.097	pg18b1git_o2nofp.cx10cw2_c32r128
99.734	0.200	0.064	0.002	nonzero	nonzero	0.000	0.000	0.000	0.000	0.083	pg18b1git_o2nofp.cx10d_c32r128
Insert response time histogram
256us	1ms	4ms	16ms	64ms	256ms	1s	4s	16s	gt	max	tag
0.000	9.332	89.626	0.990	0.052	0.000	0.000	0.000	0.000	0.000	0.050	pg174_o2nofp.cx10a_c32r128
0.000	9.046	89.992	0.887	0.074	nonzero	0.000	0.000	0.000	0.000	0.081	pg18b1git_o2nofp.cx10b_c32r128
0.000	8.065	90.992	0.895	0.048	0.000	0.000	0.000	0.000	0.000	0.044	pg18b1git_o2nofp.cx10cw2_c32r128
0.000	8.378	90.797	0.803	0.021	0.000	0.000	0.000	0.000	0.000	0.043	pg18b1git_o2nofp.cx10d_c32r128
Delete response time histogram
256us	1ms	4ms	16ms	64ms	256ms	1s	4s	16s	gt	max	tag
0.000	53.062	46.147	0.765	0.026	0.000	0.000	0.000	0.000	0.000	0.041	pg174_o2nofp.cx10a_c32r128
0.000	52.753	46.126	1.033	0.088	nonzero	0.000	0.000	0.000	0.000	0.081	pg18b1git_o2nofp.cx10b_c32r128
0.000	53.516	45.249	1.185	0.049	0.000	0.000	0.000	0.000	0.000	0.034	pg18b1git_o2nofp.cx10cw2_c32r128
0.000	51.127	47.914	0.938	0.021	0.000	0.000	0.000	0.000	0.000	0.026	pg18b1git_o2nofp.cx10d_c32r128