Introduction
This is a report for the insert benchmark with 4000M docs and 20 client(s). It is generated by scripts (bash, awk, sed) and Tufte might not be impressed. An overview of the insert benchmark is here and a short update is here. Below, by DBMS, I mean DBMS+version.config. An example is my8020.c10b40 where my means MySQL, 8020 is version 8.0.20 and c10b40 is the name for the configuration file.
The test server has 48 AMD cores, 128G RAM and RAID 10 with 2 NVMe devices. It is described here. The benchmark was run with 20 clients and there were 1 or 3 connections per client (1 for queries or inserts without rate limits, 1+1 for rate limited inserts+deletes). It uses 20 tables with a table per client. It loads 200M rows per table without secondary indexes, creates 3 secondary indexes per table, then inserts 4m+1m rows per table with a delete per insert to avoid growing the table. It then does 6 read+write tests for 1800s each that do queries as fast as possible with 100,100,500,500,1000,1000 inserts/s and the same for deletes/s per client concurrent with the queries. The database is larger than memory. Clients and the DBMS share one server. The per-database configs are in the per-database subdirectories here.
The tested DBMS are:
- pg174_o2nofp.cx10a_c32r128 - Postgres 17.4 with the cx10a_c32r128 config
- pg18b1git_o2nofp.cx10b_c32r128 - Postgres 18 beta1 with the cx10b_c32r128 config
- pg18b1git_o2nofp.cx10cw4_c32r128 - Postgres 18 beta1 with the cx10cw4_c32r128 config
- pg18b1git_o2nofp.cx10d_c32r128 - Postgres 18 beta1 with the cx10d_c32r128 config
Contents
- Summary
- l.i0: load without secondary indexes
- l.x: create secondary indexes
- l.i1: continue load after secondary indexes created with 50 inserts per transaction
- l.i2: continue load after secondary indexes created with 5 inserts per transaction
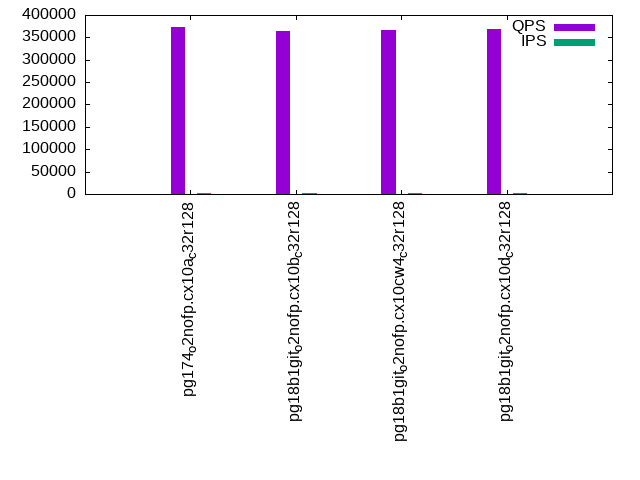
- qr100.L1: range queries with 100 insert/s per client
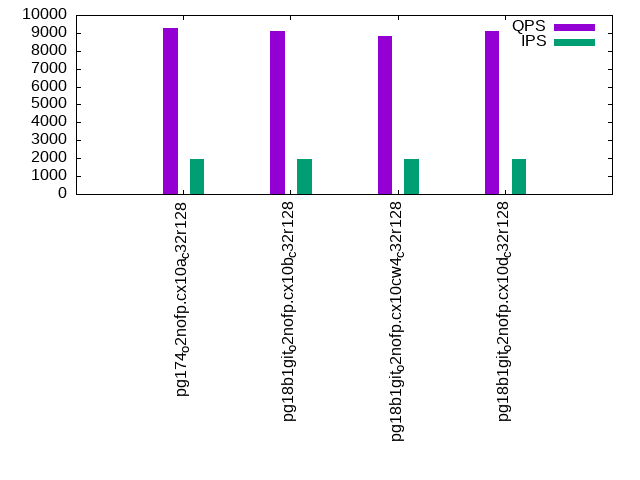
- qp100.L2: point queries with 100 insert/s per client
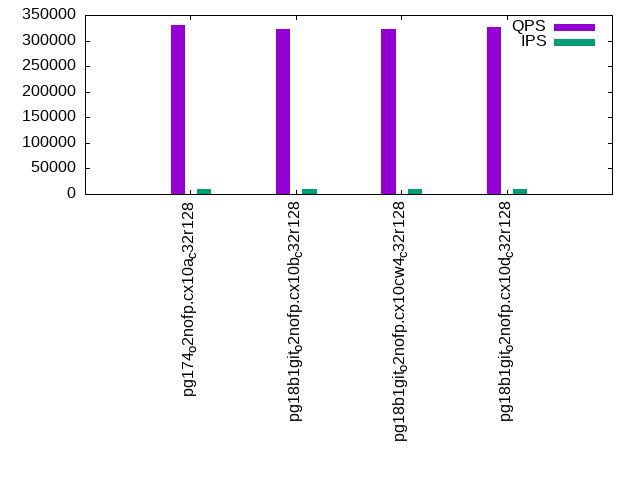
- qr500.L3: range queries with 500 insert/s per client
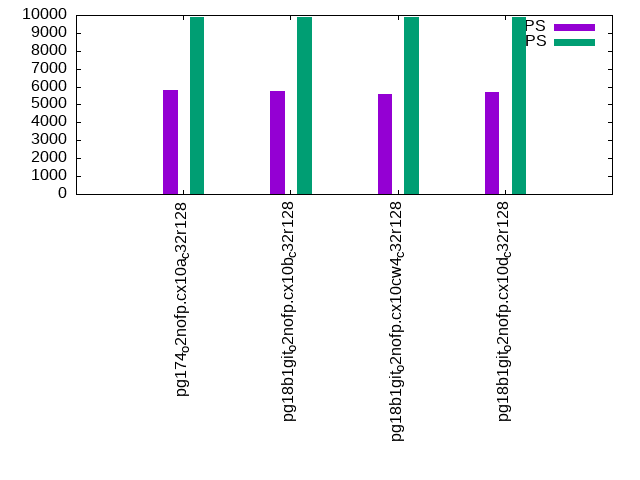
- qp500.L4: point queries with 500 insert/s per client
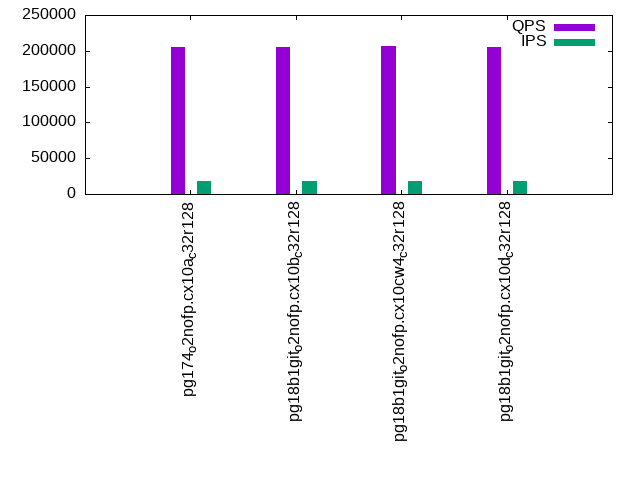
- qr1000.L5: range queries with 1000 insert/s per client
- qp1000.L6: point queries with 1000 insert/s per client
Summary
The numbers are inserts/s for l.i0, l.i1 and l.i2, indexed docs (or rows) /s for l.x and queries/s for qr100, qp100 thru qr1000, qp1000" The values are the average rate over the entire test for inserts (IPS) and queries (QPS). The range of values for IPS and QPS is split into 3 parts: bottom 25%, middle 50%, top 25%. Values in the bottom 25% have a red background, values in the top 25% have a green background and values in the middle have no color. A gray background is used for values that can be ignored because the DBMS did not sustain the target insert rate. Red backgrounds are not used when the minimum value is within 80% of the max value.
| dbms | l.i0 | l.x | l.i1 | l.i2 | qr100 | qp100 | qr500 | qp500 | qr1000 | qp1000 |
|---|---|---|---|---|---|---|---|---|---|---|
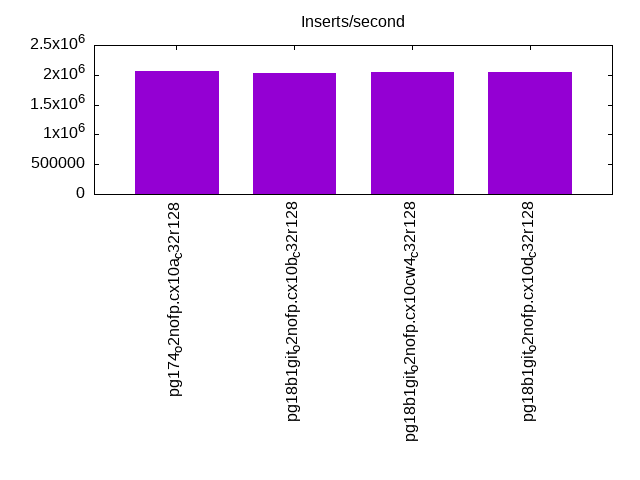
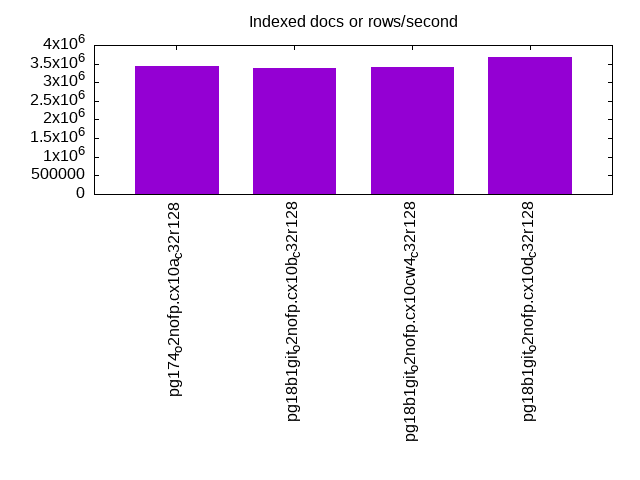
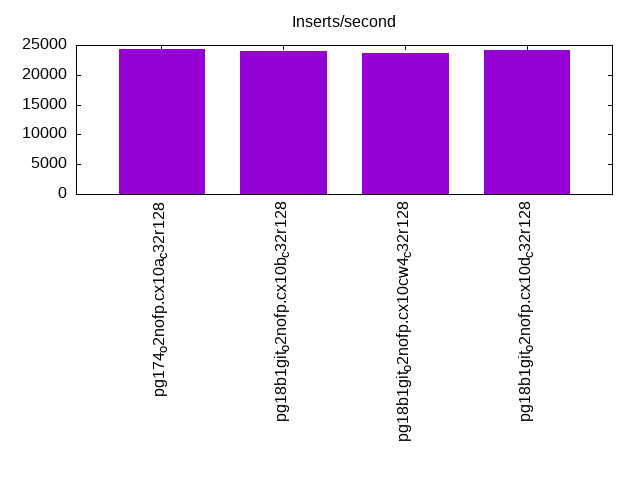
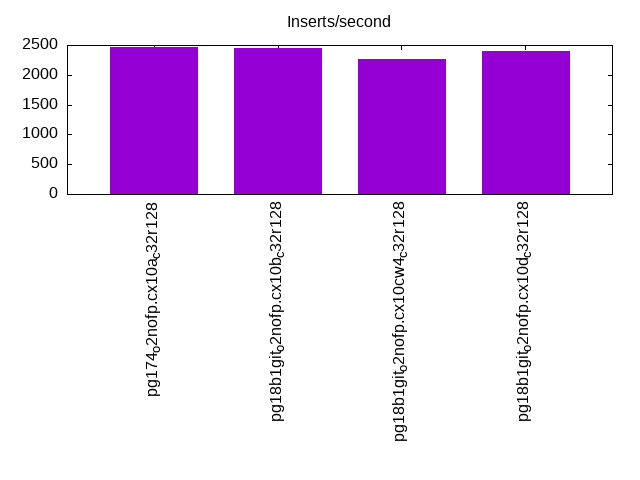
| pg174_o2nofp.cx10a_c32r128 | 2058672 | 3430532 | 24286 | 2460 | 373754 | 9268 | 331273 | 5814 | 205917 | 3154 |
| pg18b1git_o2nofp.cx10b_c32r128 | 2027369 | 3384095 | 24031 | 2450 | 364958 | 9114 | 322046 | 5731 | 205339 | 3156 |
| pg18b1git_o2nofp.cx10cw4_c32r128 | 2041858 | 3407155 | 23704 | 2263 | 365876 | 8818 | 322634 | 5587 | 206986 | 3079 |
| pg18b1git_o2nofp.cx10d_c32r128 | 2041858 | 3690037 | 24118 | 2399 | 369429 | 9095 | 326308 | 5682 | 204709 | 3149 |
This table has relative throughput, throughput for the DBMS relative to the DBMS in the first line, using the absolute throughput from the previous table. Values less than 0.95 have a yellow background. Values greater than 1.05 have a blue background.
| dbms | l.i0 | l.x | l.i1 | l.i2 | qr100 | qp100 | qr500 | qp500 | qr1000 | qp1000 |
|---|---|---|---|---|---|---|---|---|---|---|
| pg174_o2nofp.cx10a_c32r128 | 1.00 | 1.00 | 1.00 | 1.00 | 1.00 | 1.00 | 1.00 | 1.00 | 1.00 | 1.00 |
| pg18b1git_o2nofp.cx10b_c32r128 | 0.98 | 0.99 | 0.99 | 1.00 | 0.98 | 0.98 | 0.97 | 0.99 | 1.00 | 1.00 |
| pg18b1git_o2nofp.cx10cw4_c32r128 | 0.99 | 0.99 | 0.98 | 0.92 | 0.98 | 0.95 | 0.97 | 0.96 | 1.01 | 0.98 |
| pg18b1git_o2nofp.cx10d_c32r128 | 0.99 | 1.08 | 0.99 | 0.98 | 0.99 | 0.98 | 0.99 | 0.98 | 0.99 | 1.00 |
This lists the average rate of inserts/s for the tests that do inserts concurrent with queries. For such tests the query rate is listed in the table above. The read+write tests are setup so that the insert rate should match the target rate every second. Cells that are not at least 95% of the target have a red background to indicate a failure to satisfy the target.
| dbms | qr100.L1 | qp100.L2 | qr500.L3 | qp500.L4 | qr1000.L5 | qp1000.L6 |
|---|---|---|---|---|---|---|
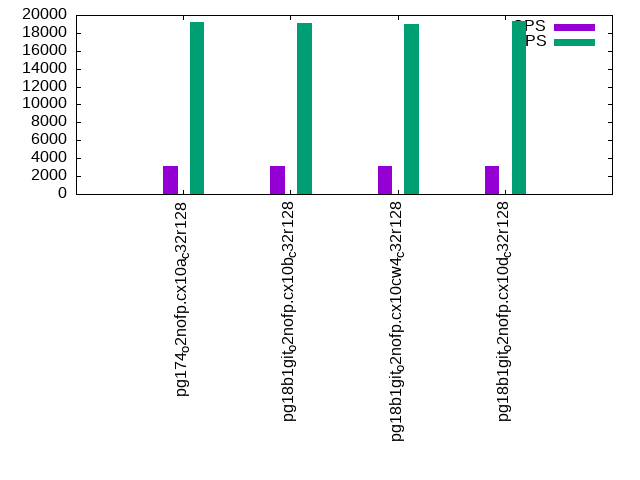
| pg174_o2nofp.cx10a_c32r128 | 1977 | 1977 | 9885 | 9879 | 18452 | 19262 |
| pg18b1git_o2nofp.cx10b_c32r128 | 1977 | 1977 | 9874 | 9879 | 18721 | 19128 |
| pg18b1git_o2nofp.cx10cw4_c32r128 | 1977 | 1976 | 9868 | 9879 | 18692 | 19048 |
| pg18b1git_o2nofp.cx10d_c32r128 | 1977 | 1977 | 9847 | 9879 | 18585 | 19324 |
| target | 2000 | 2000 | 10000 | 10000 | 20000 | 20000 |
l.i0
l.i0: load without secondary indexes. Graphs for performance per 1-second interval are here.
Average throughput:
Insert response time histogram: each cell has the percentage of responses that take <= the time in the header and max is the max response time in seconds. For the max column values in the top 25% of the range have a red background and in the bottom 25% of the range have a green background. The red background is not used when the min value is within 80% of the max value.
| dbms | 256us | 1ms | 4ms | 16ms | 64ms | 256ms | 1s | 4s | 16s | gt | max |
|---|---|---|---|---|---|---|---|---|---|---|---|
| pg174_o2nofp.cx10a_c32r128 | 89.140 | 10.546 | 0.233 | 0.069 | 0.007 | 0.004 | nonzero | 1.117 | |||
| pg18b1git_o2nofp.cx10b_c32r128 | 90.157 | 9.328 | 0.411 | 0.093 | 0.005 | 0.007 | nonzero | 1.364 | |||
| pg18b1git_o2nofp.cx10cw4_c32r128 | 90.358 | 9.210 | 0.324 | 0.096 | 0.005 | 0.006 | nonzero | 1.365 | |||
| pg18b1git_o2nofp.cx10d_c32r128 | 90.449 | 9.151 | 0.306 | 0.083 | 0.005 | 0.006 | nonzero | 1.649 |
Performance metrics for the DBMS listed above. Some are normalized by throughput, others are not. Legend for results is here.
ips	qps	rps	rmbps	wps	wmbps	rpq	rkbpq	wpi	wkbpi	csps	cpups	cspq	cpupq	dbgb1	dbgb2	rss	maxop	p50	p99	tag
2058672	0	1750	14.0	8661.4	829.9	0.001	0.007	0.004	0.413	376027	57.4	0.183	13	382.7	478.8	93.1	1.117	109782	50646	pg174_o2nofp.cx10a_c32r128
2027369	0	1737	13.9	8469.4	808.8	0.001	0.007	0.004	0.409	329202	56.3	0.162	13	382.7	478.8	90.7	1.364	111243	33164	pg18b1git_o2nofp.cx10b_c32r128
2041858	0	1678	13.5	8552.2	812.7	0.001	0.007	0.004	0.408	344523	56.7	0.169	13	382.7	478.8	93.6	1.365	110576	36860	pg18b1git_o2nofp.cx10cw4_c32r128
2041858	0	1706	13.7	8545.8	817.5	0.001	0.007	0.004	0.410	356846	56.8	0.175	13	382.7	478.8	94.3	1.649	111334	29568	pg18b1git_o2nofp.cx10d_c32r128
l.x
l.x: create secondary indexes.
Average throughput:
Performance metrics for the DBMS listed above. Some are normalized by throughput, others are not. Legend for results is here.
ips	qps	rps	rmbps	wps	wmbps	rpq	rkbpq	wpi	wkbpi	csps	cpups	cspq	cpupq	dbgb1	dbgb2	rss	maxop	p50	p99	tag
3430532	0	11204	1091.2	8707.9	972.9	0.003	0.326	0.003	0.290	89895	23.7	0.026	3	768.4	863.7	29.6	0.044	NA	NA	pg174_o2nofp.cx10a_c32r128
3384095	0	11064	1077.3	8628.5	966.9	0.003	0.326	0.003	0.293	90258	23.5	0.027	3	768.4	863.7	40.2	0.027	NA	NA	pg18b1git_o2nofp.cx10b_c32r128
3407155	0	11443	1082.0	8729.2	975.8	0.003	0.325	0.003	0.293	94770	23.7	0.028	3	768.4	863.7	46.5	0.114	NA	NA	pg18b1git_o2nofp.cx10cw4_c32r128
3690037	0	12327	1171.8	9319.7	1050.6	0.003	0.325	0.003	0.292	117363	26.1	0.032	3	768.4	863.7	20.5	0.021	NA	NA	pg18b1git_o2nofp.cx10d_c32r128
l.i1
l.i1: continue load after secondary indexes created with 50 inserts per transaction. Graphs for performance per 1-second interval are here.
Average throughput:
Insert response time histogram: each cell has the percentage of responses that take <= the time in the header and max is the max response time in seconds. For the max column values in the top 25% of the range have a red background and in the bottom 25% of the range have a green background. The red background is not used when the min value is within 80% of the max value.
| dbms | 256us | 1ms | 4ms | 16ms | 64ms | 256ms | 1s | 4s | 16s | gt | max |
|---|---|---|---|---|---|---|---|---|---|---|---|
| pg174_o2nofp.cx10a_c32r128 | 20.454 | 69.471 | 9.881 | 0.094 | 0.100 | 3.337 | |||||
| pg18b1git_o2nofp.cx10b_c32r128 | 16.385 | 73.728 | 9.666 | 0.103 | 0.119 | 3.597 | |||||
| pg18b1git_o2nofp.cx10cw4_c32r128 | 17.045 | 72.482 | 10.279 | 0.077 | 0.117 | 3.797 | |||||
| pg18b1git_o2nofp.cx10d_c32r128 | 17.577 | 73.102 | 9.133 | 0.082 | 0.106 | 2.735 |
Delete response time histogram: each cell has the percentage of responses that take <= the time in the header and max is the max response time in seconds. For the max column values in the top 25% of the range have a red background and in the bottom 25% of the range have a green background. The red background is not used when the min value is within 80% of the max value.
| dbms | 256us | 1ms | 4ms | 16ms | 64ms | 256ms | 1s | 4s | 16s | gt | max |
|---|---|---|---|---|---|---|---|---|---|---|---|
| pg174_o2nofp.cx10a_c32r128 | 2.408 | 8.548 | 22.836 | 62.612 | 3.498 | 0.046 | 0.052 | 2.607 | |||
| pg18b1git_o2nofp.cx10b_c32r128 | 2.431 | 9.028 | 23.327 | 64.040 | 1.078 | 0.034 | 0.062 | 2.819 | |||
| pg18b1git_o2nofp.cx10cw4_c32r128 | 2.435 | 8.627 | 24.347 | 62.836 | 1.659 | 0.034 | 0.062 | 2.752 | |||
| pg18b1git_o2nofp.cx10d_c32r128 | 2.492 | 9.288 | 21.702 | 64.753 | 1.663 | 0.034 | 0.067 | 2.751 |
Performance metrics for the DBMS listed above. Some are normalized by throughput, others are not. Legend for results is here.
ips	qps	rps	rmbps	wps	wmbps	rpq	rkbpq	wpi	wkbpi	csps	cpups	cspq	cpupq	dbgb1	dbgb2	rss	maxop	p50	p99	tag
24286	0	30647	243.5	35938.3	787.5	1.262	10.266	1.480	33.203	84303	30.8	3.471	609	781.5	877.6	88.0	3.337	1149	0	pg174_o2nofp.cx10a_c32r128
24031	0	30351	242.1	35649.1	786.8	1.263	10.318	1.483	33.526	86522	30.2	3.600	603	781.5	877.6	85.5	3.597	1199	0	pg18b1git_o2nofp.cx10b_c32r128
23704	0	30066	240.6	35205.8	779.3	1.268	10.395	1.485	33.664	84821	30.8	3.578	624	781.5	877.6	89.9	3.797	1199	0	pg18b1git_o2nofp.cx10cw4_c32r128
24118	0	30527	243.1	35779.2	785.1	1.266	10.322	1.483	33.334	86876	31.6	3.602	629	781.5	877.6	85.2	2.735	1249	0	pg18b1git_o2nofp.cx10d_c32r128
l.i2
l.i2: continue load after secondary indexes created with 5 inserts per transaction. Graphs for performance per 1-second interval are here.
Average throughput:
Insert response time histogram: each cell has the percentage of responses that take <= the time in the header and max is the max response time in seconds. For the max column values in the top 25% of the range have a red background and in the bottom 25% of the range have a green background. The red background is not used when the min value is within 80% of the max value.
| dbms | 256us | 1ms | 4ms | 16ms | 64ms | 256ms | 1s | 4s | 16s | gt | max |
|---|---|---|---|---|---|---|---|---|---|---|---|
| pg174_o2nofp.cx10a_c32r128 | 0.074 | 39.749 | 59.985 | 0.043 | 0.106 | 0.020 | 0.020 | 0.002 | 1.798 | ||
| pg18b1git_o2nofp.cx10b_c32r128 | 0.183 | 38.771 | 60.801 | 0.091 | 0.105 | 0.022 | 0.024 | 0.003 | 2.436 | ||
| pg18b1git_o2nofp.cx10cw4_c32r128 | 0.150 | 36.556 | 63.115 | 0.069 | 0.091 | 0.010 | 0.007 | 0.002 | 3.944 | ||
| pg18b1git_o2nofp.cx10d_c32r128 | nonzero | 38.944 | 60.972 | 0.011 | 0.012 | 0.024 | 0.032 | 0.005 | 2.607 |
Delete response time histogram: each cell has the percentage of responses that take <= the time in the header and max is the max response time in seconds. For the max column values in the top 25% of the range have a red background and in the bottom 25% of the range have a green background. The red background is not used when the min value is within 80% of the max value.
| dbms | 256us | 1ms | 4ms | 16ms | 64ms | 256ms | 1s | 4s | 16s | gt | max |
|---|---|---|---|---|---|---|---|---|---|---|---|
| pg174_o2nofp.cx10a_c32r128 | 0.083 | 1.517 | 1.252 | 2.080 | 95.066 | 0.002 | nonzero | nonzero | 2.187 | ||
| pg18b1git_o2nofp.cx10b_c32r128 | 0.144 | 2.908 | 2.877 | 0.050 | 94.020 | 0.002 | 0.001 | nonzero | 1.959 | ||
| pg18b1git_o2nofp.cx10cw4_c32r128 | 0.104 | 2.314 | 4.971 | 0.190 | 92.417 | 0.003 | nonzero | nonzero | 1.394 | ||
| pg18b1git_o2nofp.cx10d_c32r128 | 0.045 | 99.953 | 0.001 | nonzero | nonzero | 1.348 |
Performance metrics for the DBMS listed above. Some are normalized by throughput, others are not. Legend for results is here.
ips	qps	rps	rmbps	wps	wmbps	rpq	rkbpq	wpi	wkbpi	csps	cpups	cspq	cpupq	dbgb1	dbgb2	rss	maxop	p50	p99	tag
2460	0	3054	26.6	4689.6	74.7	1.241	11.071	1.907	31.093	18669	28.2	7.590	5503	784.8	880.9	84.2	1.798	210	115	pg174_o2nofp.cx10a_c32r128
2450	0	3078	28.2	4613.2	73.1	1.256	11.768	1.883	30.559	18546	27.8	7.570	5447	784.8	880.8	77.4	2.436	215	175	pg18b1git_o2nofp.cx10b_c32r128
2263	0	2867	26.7	4056.9	66.0	1.267	12.070	1.792	29.860	17533	34.9	7.746	7401	784.7	880.7	89.9	3.944	215	190	pg18b1git_o2nofp.cx10cw4_c32r128
2399	0	2936	23.4	4542.7	71.1	1.224	9.983	1.893	30.367	18298	29.5	7.627	5902	784.9	880.9	77.9	2.607	215	165	pg18b1git_o2nofp.cx10d_c32r128
qr100.L1
qr100.L1: range queries with 100 insert/s per client. Graphs for performance per 1-second interval are here.
Average throughput:
Query response time histogram: each cell has the percentage of responses that take <= the time in the header and max is the max response time in seconds. For max values in the top 25% of the range have a red background and in the bottom 25% of the range have a green background. The red background is not used when the min value is within 80% of the max value.
| dbms | 256us | 1ms | 4ms | 16ms | 64ms | 256ms | 1s | 4s | 16s | gt | max |
|---|---|---|---|---|---|---|---|---|---|---|---|
| pg174_o2nofp.cx10a_c32r128 | 99.993 | 0.006 | 0.001 | nonzero | nonzero | nonzero | nonzero | 1.310 | |||
| pg18b1git_o2nofp.cx10b_c32r128 | 99.993 | 0.006 | 0.001 | nonzero | 0.011 | ||||||
| pg18b1git_o2nofp.cx10cw4_c32r128 | 99.993 | 0.006 | 0.001 | nonzero | nonzero | nonzero | nonzero | 0.283 | |||
| pg18b1git_o2nofp.cx10d_c32r128 | 99.993 | 0.006 | 0.001 | nonzero | nonzero | nonzero | nonzero | 0.357 |
Insert response time histogram: each cell has the percentage of responses that take <= the time in the header and max is the max response time in seconds. For max values in the top 25% of the range have a red background and in the bottom 25% of the range have a green background. The red background is not used when the min value is within 80% of the max value.
| dbms | 256us | 1ms | 4ms | 16ms | 64ms | 256ms | 1s | 4s | 16s | gt | max |
|---|---|---|---|---|---|---|---|---|---|---|---|
| pg174_o2nofp.cx10a_c32r128 | 98.929 | 1.060 | 0.008 | 0.003 | 1.139 | ||||||
| pg18b1git_o2nofp.cx10b_c32r128 | 98.862 | 1.121 | 0.017 | 0.222 | |||||||
| pg18b1git_o2nofp.cx10cw4_c32r128 | 98.447 | 1.553 | 0.063 | ||||||||
| pg18b1git_o2nofp.cx10d_c32r128 | 98.674 | 1.322 | 0.004 | 0.236 |
Delete response time histogram: each cell has the percentage of responses that take <= the time in the header and max is the max response time in seconds. For max values in the top 25% of the range have a red background and in the bottom 25% of the range have a green background. The red background is not used when the min value is within 80% of the max value.
| dbms | 256us | 1ms | 4ms | 16ms | 64ms | 256ms | 1s | 4s | 16s | gt | max |
|---|---|---|---|---|---|---|---|---|---|---|---|
| pg174_o2nofp.cx10a_c32r128 | 44.775 | 55.163 | 0.061 | 0.001 | 0.153 | ||||||
| pg18b1git_o2nofp.cx10b_c32r128 | 46.454 | 53.490 | 0.056 | 0.013 | |||||||
| pg18b1git_o2nofp.cx10cw4_c32r128 | 46.374 | 53.583 | 0.040 | 0.003 | 0.018 | ||||||
| pg18b1git_o2nofp.cx10d_c32r128 | 45.240 | 54.711 | 0.047 | 0.001 | 0.021 |
Performance metrics for the DBMS listed above. Some are normalized by throughput, others are not. Legend for results is here.
ips	qps	rps	rmbps	wps	wmbps	rpq	rkbpq	wpi	wkbpi	csps	cpups	cspq	cpupq	dbgb1	dbgb2	rss	maxop	p50	p99	tag
1977	373754	2715	21.8	1251.8	36.2	0.007	0.060	0.633	18.764	1422112	42.8	3.805	55	784.9	881.0	95.1	1.310	19163	17197	pg174_o2nofp.cx10a_c32r128
1977	364958	2667	21.5	1294.4	36.6	0.007	0.060	0.655	18.978	1389056	43.1	3.806	57	784.9	880.9	95.7	0.011	18828	17022	pg18b1git_o2nofp.cx10b_c32r128
1977	365876	2667	21.4	1270.4	36.4	0.007	0.060	0.643	18.859	1392140	43.0	3.805	56	784.8	880.8	96.2	0.283	18739	16926	pg18b1git_o2nofp.cx10cw4_c32r128
1977	369429	2670	21.5	1280.4	36.5	0.007	0.060	0.648	18.905	1405775	43.0	3.805	56	785.0	881.0	95.7	0.357	18732	17027	pg18b1git_o2nofp.cx10d_c32r128
qp100.L2
qp100.L2: point queries with 100 insert/s per client. Graphs for performance per 1-second interval are here.
Average throughput:
Query response time histogram: each cell has the percentage of responses that take <= the time in the header and max is the max response time in seconds. For max values in the top 25% of the range have a red background and in the bottom 25% of the range have a green background. The red background is not used when the min value is within 80% of the max value.
| dbms | 256us | 1ms | 4ms | 16ms | 64ms | 256ms | 1s | 4s | 16s | gt | max |
|---|---|---|---|---|---|---|---|---|---|---|---|
| pg174_o2nofp.cx10a_c32r128 | nonzero | 2.913 | 94.241 | 0.418 | 2.425 | 0.001 | 0.001 | 0.001 | 2.357 | ||
| pg18b1git_o2nofp.cx10b_c32r128 | nonzero | 2.708 | 94.426 | 0.434 | 2.428 | 0.002 | 0.002 | 0.001 | nonzero | 4.489 | |
| pg18b1git_o2nofp.cx10cw4_c32r128 | nonzero | 2.431 | 94.503 | 0.445 | 2.617 | 0.003 | 0.001 | 0.002 | 2.444 | ||
| pg18b1git_o2nofp.cx10d_c32r128 | nonzero | 2.746 | 94.471 | 0.362 | 2.417 | 0.002 | 0.002 | 0.001 | 3.325 |
Insert response time histogram: each cell has the percentage of responses that take <= the time in the header and max is the max response time in seconds. For max values in the top 25% of the range have a red background and in the bottom 25% of the range have a green background. The red background is not used when the min value is within 80% of the max value.
| dbms | 256us | 1ms | 4ms | 16ms | 64ms | 256ms | 1s | 4s | 16s | gt | max |
|---|---|---|---|---|---|---|---|---|---|---|---|
| pg174_o2nofp.cx10a_c32r128 | 64.375 | 35.250 | 0.067 | 0.218 | 0.090 | 1.934 | |||||
| pg18b1git_o2nofp.cx10b_c32r128 | 62.574 | 36.690 | 0.219 | 0.326 | 0.163 | 0.028 | 4.152 | ||||
| pg18b1git_o2nofp.cx10cw4_c32r128 | 60.053 | 39.215 | 0.217 | 0.321 | 0.194 | 2.133 | |||||
| pg18b1git_o2nofp.cx10d_c32r128 | 65.315 | 34.174 | 0.139 | 0.199 | 0.174 | 2.495 |
Delete response time histogram: each cell has the percentage of responses that take <= the time in the header and max is the max response time in seconds. For max values in the top 25% of the range have a red background and in the bottom 25% of the range have a green background. The red background is not used when the min value is within 80% of the max value.
| dbms | 256us | 1ms | 4ms | 16ms | 64ms | 256ms | 1s | 4s | 16s | gt | max |
|---|---|---|---|---|---|---|---|---|---|---|---|
| pg174_o2nofp.cx10a_c32r128 | 92.510 | 4.175 | 3.307 | 0.008 | 0.605 | ||||||
| pg18b1git_o2nofp.cx10b_c32r128 | 92.847 | 4.043 | 3.022 | 0.007 | 0.071 | 0.010 | 3.113 | ||||
| pg18b1git_o2nofp.cx10cw4_c32r128 | 91.811 | 4.603 | 3.519 | 0.026 | 0.029 | 0.011 | 2.099 | ||||
| pg18b1git_o2nofp.cx10d_c32r128 | 93.674 | 2.918 | 3.306 | 0.058 | 0.042 | 0.003 | 2.033 |
Performance metrics for the DBMS listed above. Some are normalized by throughput, others are not. Legend for results is here.
ips	qps	rps	rmbps	wps	wmbps	rpq	rkbpq	wpi	wkbpi	csps	cpups	cspq	cpupq	dbgb1	dbgb2	rss	maxop	p50	p99	tag
1977	9268	129015	1012.7	6684.9	77.0	13.920	111.886	3.381	39.903	291038	23.7	31.402	1227	785.0	881.1	91.0	2.357	479	240	pg174_o2nofp.cx10a_c32r128
1977	9114	126987	996.8	6703.5	76.9	13.932	111.983	3.391	39.829	287142	23.6	31.504	1243	785.0	881.0	90.9	4.489	479	64	pg18b1git_o2nofp.cx10b_c32r128
1976	8818	123157	966.7	6739.6	77.8	13.966	112.251	3.411	40.345	279052	24.1	31.645	1312	784.9	880.9	91.1	2.444	463	112	pg18b1git_o2nofp.cx10cw4_c32r128
1977	9095	126722	994.6	6725.3	77.1	13.933	111.984	3.402	39.915	285912	24.1	31.435	1272	785.1	881.1	90.6	3.325	479	192	pg18b1git_o2nofp.cx10d_c32r128
qr500.L3
qr500.L3: range queries with 500 insert/s per client. Graphs for performance per 1-second interval are here.
Average throughput:
Query response time histogram: each cell has the percentage of responses that take <= the time in the header and max is the max response time in seconds. For max values in the top 25% of the range have a red background and in the bottom 25% of the range have a green background. The red background is not used when the min value is within 80% of the max value.
| dbms | 256us | 1ms | 4ms | 16ms | 64ms | 256ms | 1s | 4s | 16s | gt | max |
|---|---|---|---|---|---|---|---|---|---|---|---|
| pg174_o2nofp.cx10a_c32r128 | 99.962 | 0.030 | 0.006 | 0.001 | 0.001 | nonzero | nonzero | nonzero | 1.017 | ||
| pg18b1git_o2nofp.cx10b_c32r128 | 99.960 | 0.032 | 0.006 | 0.002 | 0.001 | nonzero | nonzero | nonzero | 1.775 | ||
| pg18b1git_o2nofp.cx10cw4_c32r128 | 99.957 | 0.034 | 0.006 | 0.002 | 0.001 | nonzero | nonzero | nonzero | 1.783 | ||
| pg18b1git_o2nofp.cx10d_c32r128 | 99.959 | 0.032 | 0.006 | 0.002 | 0.001 | nonzero | nonzero | nonzero | 2.326 |
Insert response time histogram: each cell has the percentage of responses that take <= the time in the header and max is the max response time in seconds. For max values in the top 25% of the range have a red background and in the bottom 25% of the range have a green background. The red background is not used when the min value is within 80% of the max value.
| dbms | 256us | 1ms | 4ms | 16ms | 64ms | 256ms | 1s | 4s | 16s | gt | max |
|---|---|---|---|---|---|---|---|---|---|---|---|
| pg174_o2nofp.cx10a_c32r128 | 80.888 | 18.229 | 0.413 | 0.451 | 0.019 | 1.848 | |||||
| pg18b1git_o2nofp.cx10b_c32r128 | 80.306 | 18.927 | 0.382 | 0.316 | 0.069 | 2.459 | |||||
| pg18b1git_o2nofp.cx10cw4_c32r128 | 79.210 | 19.996 | 0.410 | 0.348 | 0.036 | 1.992 | |||||
| pg18b1git_o2nofp.cx10d_c32r128 | 82.242 | 16.737 | 0.474 | 0.428 | 0.118 | 0.001 | 4.090 |
Delete response time histogram: each cell has the percentage of responses that take <= the time in the header and max is the max response time in seconds. For max values in the top 25% of the range have a red background and in the bottom 25% of the range have a green background. The red background is not used when the min value is within 80% of the max value.
| dbms | 256us | 1ms | 4ms | 16ms | 64ms | 256ms | 1s | 4s | 16s | gt | max |
|---|---|---|---|---|---|---|---|---|---|---|---|
| pg174_o2nofp.cx10a_c32r128 | 32.891 | 65.945 | 1.136 | 0.011 | 0.016 | nonzero | 1.089 | ||||
| pg18b1git_o2nofp.cx10b_c32r128 | 38.681 | 60.082 | 1.213 | 0.010 | 0.010 | 0.005 | 2.113 | ||||
| pg18b1git_o2nofp.cx10cw4_c32r128 | 35.861 | 62.660 | 1.458 | 0.007 | 0.009 | 0.004 | 1.893 | ||||
| pg18b1git_o2nofp.cx10d_c32r128 | 37.603 | 60.737 | 1.634 | 0.009 | 0.011 | 0.007 | 2.098 |
Performance metrics for the DBMS listed above. Some are normalized by throughput, others are not. Legend for results is here.
ips	qps	rps	rmbps	wps	wmbps	rpq	rkbpq	wpi	wkbpi	csps	cpups	cspq	cpupq	dbgb1	dbgb2	rss	maxop	p50	p99	tag
9885	331273	13840	111.6	14431.7	242.7	0.042	0.345	1.460	25.143	1243650	49.0	3.754	71	785.5	881.6	85.7	1.017	17006	14400	pg174_o2nofp.cx10a_c32r128
9874	322046	13810	111.4	14421.7	242.3	0.043	0.354	1.461	25.125	1209505	48.7	3.756	73	785.4	881.4	86.6	1.775	16505	14145	pg18b1git_o2nofp.cx10b_c32r128
9868	322634	13808	111.3	14411.6	242.2	0.043	0.353	1.460	25.131	1209288	48.7	3.748	72	785.4	881.4	86.1	1.783	16558	14065	pg18b1git_o2nofp.cx10cw4_c32r128
9847	326308	13769	111.0	14371.8	241.6	0.042	0.348	1.460	25.125	1225131	48.7	3.755	72	785.6	881.6	87.2	2.326	16702	13729	pg18b1git_o2nofp.cx10d_c32r128
qp500.L4
qp500.L4: point queries with 500 insert/s per client. Graphs for performance per 1-second interval are here.
Average throughput:
Query response time histogram: each cell has the percentage of responses that take <= the time in the header and max is the max response time in seconds. For max values in the top 25% of the range have a red background and in the bottom 25% of the range have a green background. The red background is not used when the min value is within 80% of the max value.
| dbms | 256us | 1ms | 4ms | 16ms | 64ms | 256ms | 1s | 4s | 16s | gt | max |
|---|---|---|---|---|---|---|---|---|---|---|---|
| pg174_o2nofp.cx10a_c32r128 | 0.263 | 93.848 | 1.470 | 4.401 | 0.010 | 0.008 | nonzero | 1.124 | |||
| pg18b1git_o2nofp.cx10b_c32r128 | 0.233 | 93.938 | 1.336 | 4.473 | 0.012 | 0.008 | 0.001 | 1.468 | |||
| pg18b1git_o2nofp.cx10cw4_c32r128 | 0.207 | 93.899 | 1.173 | 4.689 | 0.019 | 0.011 | 0.001 | 2.640 | |||
| pg18b1git_o2nofp.cx10d_c32r128 | 0.212 | 94.035 | 1.193 | 4.543 | 0.010 | 0.006 | nonzero | 1.295 |
Insert response time histogram: each cell has the percentage of responses that take <= the time in the header and max is the max response time in seconds. For max values in the top 25% of the range have a red background and in the bottom 25% of the range have a green background. The red background is not used when the min value is within 80% of the max value.
| dbms | 256us | 1ms | 4ms | 16ms | 64ms | 256ms | 1s | 4s | 16s | gt | max |
|---|---|---|---|---|---|---|---|---|---|---|---|
| pg174_o2nofp.cx10a_c32r128 | 34.973 | 64.321 | 0.448 | 0.249 | 0.010 | 1.243 | |||||
| pg18b1git_o2nofp.cx10b_c32r128 | 39.388 | 59.969 | 0.386 | 0.240 | 0.017 | 1.663 | |||||
| pg18b1git_o2nofp.cx10cw4_c32r128 | 48.277 | 50.938 | 0.452 | 0.301 | 0.032 | 2.333 | |||||
| pg18b1git_o2nofp.cx10d_c32r128 | 45.771 | 53.783 | 0.283 | 0.137 | 0.026 | 1.911 |
Delete response time histogram: each cell has the percentage of responses that take <= the time in the header and max is the max response time in seconds. For max values in the top 25% of the range have a red background and in the bottom 25% of the range have a green background. The red background is not used when the min value is within 80% of the max value.
| dbms | 256us | 1ms | 4ms | 16ms | 64ms | 256ms | 1s | 4s | 16s | gt | max |
|---|---|---|---|---|---|---|---|---|---|---|---|
| pg174_o2nofp.cx10a_c32r128 | 69.511 | 30.172 | 0.170 | 0.141 | 0.006 | 1.139 | |||||
| pg18b1git_o2nofp.cx10b_c32r128 | 70.066 | 29.664 | 0.138 | 0.128 | 0.004 | 1.362 | |||||
| pg18b1git_o2nofp.cx10cw4_c32r128 | 71.626 | 28.064 | 0.149 | 0.156 | 0.006 | 2.250 | |||||
| pg18b1git_o2nofp.cx10d_c32r128 | 70.032 | 29.792 | 0.083 | 0.092 | 0.001 | 1.135 |
Performance metrics for the DBMS listed above. Some are normalized by throughput, others are not. Legend for results is here.
ips	qps	rps	rmbps	wps	wmbps	rpq	rkbpq	wpi	wkbpi	csps	cpups	cspq	cpupq	dbgb1	dbgb2	rss	maxop	p50	p99	tag
9879	5814	102452	804.7	22454.8	302.0	17.623	141.748	2.273	31.301	236296	37.6	40.646	3105	786.1	882.1	28.8	1.124	304	144	pg174_o2nofp.cx10a_c32r128
9879	5731	101294	795.6	22339.7	301.0	17.676	142.171	2.261	31.198	234079	37.6	40.846	3149	785.8	881.9	28.9	1.468	288	128	pg18b1git_o2nofp.cx10b_c32r128
9879	5587	99331	779.7	22475.6	301.8	17.780	142.909	2.275	31.287	230669	37.7	41.290	3239	786.5	882.6	31.5	2.640	288	96	pg18b1git_o2nofp.cx10cw4_c32r128
9879	5682	100633	790.3	22317.9	300.9	17.711	142.427	2.259	31.192	233226	37.9	41.047	3202	786.4	882.4	27.1	1.295	288	128	pg18b1git_o2nofp.cx10d_c32r128
qr1000.L5
qr1000.L5: range queries with 1000 insert/s per client. Graphs for performance per 1-second interval are here.
Average throughput:
Query response time histogram: each cell has the percentage of responses that take <= the time in the header and max is the max response time in seconds. For max values in the top 25% of the range have a red background and in the bottom 25% of the range have a green background. The red background is not used when the min value is within 80% of the max value.
| dbms | 256us | 1ms | 4ms | 16ms | 64ms | 256ms | 1s | 4s | 16s | gt | max |
|---|---|---|---|---|---|---|---|---|---|---|---|
| pg174_o2nofp.cx10a_c32r128 | 99.568 | 0.326 | 0.039 | 0.043 | 0.024 | nonzero | nonzero | nonzero | 3.985 | ||
| pg18b1git_o2nofp.cx10b_c32r128 | 99.558 | 0.345 | 0.040 | 0.038 | 0.020 | nonzero | nonzero | nonzero | 2.134 | ||
| pg18b1git_o2nofp.cx10cw4_c32r128 | 99.562 | 0.342 | 0.040 | 0.038 | 0.018 | nonzero | nonzero | nonzero | 3.952 | ||
| pg18b1git_o2nofp.cx10d_c32r128 | 99.542 | 0.356 | 0.041 | 0.041 | 0.021 | nonzero | nonzero | nonzero | 2.868 |
Insert response time histogram: each cell has the percentage of responses that take <= the time in the header and max is the max response time in seconds. For max values in the top 25% of the range have a red background and in the bottom 25% of the range have a green background. The red background is not used when the min value is within 80% of the max value.
| dbms | 256us | 1ms | 4ms | 16ms | 64ms | 256ms | 1s | 4s | 16s | gt | max |
|---|---|---|---|---|---|---|---|---|---|---|---|
| pg174_o2nofp.cx10a_c32r128 | 39.608 | 45.333 | 14.875 | 0.072 | 0.106 | 0.005 | 4.902 | ||||
| pg18b1git_o2nofp.cx10b_c32r128 | 38.063 | 48.149 | 13.603 | 0.099 | 0.087 | 3.638 | |||||
| pg18b1git_o2nofp.cx10cw4_c32r128 | 38.333 | 48.448 | 13.045 | 0.073 | 0.099 | 0.002 | 6.595 | ||||
| pg18b1git_o2nofp.cx10d_c32r128 | 35.404 | 49.869 | 14.561 | 0.063 | 0.101 | 0.002 | 4.399 |
Delete response time histogram: each cell has the percentage of responses that take <= the time in the header and max is the max response time in seconds. For max values in the top 25% of the range have a red background and in the bottom 25% of the range have a green background. The red background is not used when the min value is within 80% of the max value.
| dbms | 256us | 1ms | 4ms | 16ms | 64ms | 256ms | 1s | 4s | 16s | gt | max |
|---|---|---|---|---|---|---|---|---|---|---|---|
| pg174_o2nofp.cx10a_c32r128 | 37.097 | 58.707 | 4.116 | 0.023 | 0.057 | 0.001 | 4.049 | ||||
| pg18b1git_o2nofp.cx10b_c32r128 | 36.498 | 61.188 | 2.227 | 0.043 | 0.044 | 2.167 | |||||
| pg18b1git_o2nofp.cx10cw4_c32r128 | 35.435 | 62.349 | 2.136 | 0.025 | 0.055 | 3.920 | |||||
| pg18b1git_o2nofp.cx10d_c32r128 | 33.903 | 63.471 | 2.544 | 0.026 | 0.055 | nonzero | 4.084 |
Performance metrics for the DBMS listed above. Some are normalized by throughput, others are not. Legend for results is here.
ips	qps	rps	rmbps	wps	wmbps	rpq	rkbpq	wpi	wkbpi	csps	cpups	cspq	cpupq	dbgb1	dbgb2	rss	maxop	p50	p99	tag
18452	205917	24582	197.9	26689.7	563.1	0.119	0.984	1.446	31.248	683968	63.1	3.322	147	788.9	932.0	76.9	3.985	10852	0	pg174_o2nofp.cx10a_c32r128
18721	205339	24968	201.1	26863.2	568.4	0.122	1.003	1.435	31.090	677203	64.5	3.298	151	788.4	936.3	77.2	2.134	10836	1550	pg18b1git_o2nofp.cx10b_c32r128
18692	206986	24939	200.5	26613.1	559.4	0.120	0.992	1.424	30.646	680252	64.6	3.286	150	789.7	885.7	79.5	3.952	11000	671	pg18b1git_o2nofp.cx10cw4_c32r128
18585	204709	24758	199.1	26766.4	564.9	0.121	0.996	1.440	31.124	674235	64.2	3.294	151	789.5	937.4	77.1	2.868	10740	80	pg18b1git_o2nofp.cx10d_c32r128
qp1000.L6
qp1000.L6: point queries with 1000 insert/s per client. Graphs for performance per 1-second interval are here.
Average throughput:
Query response time histogram: each cell has the percentage of responses that take <= the time in the header and max is the max response time in seconds. For max values in the top 25% of the range have a red background and in the bottom 25% of the range have a green background. The red background is not used when the min value is within 80% of the max value.
| dbms | 256us | 1ms | 4ms | 16ms | 64ms | 256ms | 1s | 4s | 16s | gt | max |
|---|---|---|---|---|---|---|---|---|---|---|---|
| pg174_o2nofp.cx10a_c32r128 | 0.002 | 73.334 | 18.588 | 7.940 | 0.089 | 0.042 | 0.004 | 3.932 | |||
| pg18b1git_o2nofp.cx10b_c32r128 | 0.002 | 73.684 | 18.324 | 7.860 | 0.083 | 0.044 | 0.003 | 0.001 | 6.061 | ||
| pg18b1git_o2nofp.cx10cw4_c32r128 | 0.002 | 72.814 | 18.693 | 8.367 | 0.082 | 0.038 | 0.003 | 0.001 | 7.582 | ||
| pg18b1git_o2nofp.cx10d_c32r128 | 0.001 | 72.654 | 19.266 | 7.952 | 0.089 | 0.033 | 0.004 | 1.960 |
Insert response time histogram: each cell has the percentage of responses that take <= the time in the header and max is the max response time in seconds. For max values in the top 25% of the range have a red background and in the bottom 25% of the range have a green background. The red background is not used when the min value is within 80% of the max value.
| dbms | 256us | 1ms | 4ms | 16ms | 64ms | 256ms | 1s | 4s | 16s | gt | max |
|---|---|---|---|---|---|---|---|---|---|---|---|
| pg174_o2nofp.cx10a_c32r128 | 10.694 | 80.744 | 8.140 | 0.378 | 0.043 | 3.951 | |||||
| pg18b1git_o2nofp.cx10b_c32r128 | 11.698 | 79.938 | 7.933 | 0.388 | 0.037 | 0.006 | 6.139 | ||||
| pg18b1git_o2nofp.cx10cw4_c32r128 | 11.228 | 79.839 | 8.539 | 0.354 | 0.036 | 0.004 | 7.247 | ||||
| pg18b1git_o2nofp.cx10d_c32r128 | 10.886 | 80.638 | 8.121 | 0.316 | 0.039 | 2.206 |
Delete response time histogram: each cell has the percentage of responses that take <= the time in the header and max is the max response time in seconds. For max values in the top 25% of the range have a red background and in the bottom 25% of the range have a green background. The red background is not used when the min value is within 80% of the max value.
| dbms | 256us | 1ms | 4ms | 16ms | 64ms | 256ms | 1s | 4s | 16s | gt | max |
|---|---|---|---|---|---|---|---|---|---|---|---|
| pg174_o2nofp.cx10a_c32r128 | 0.011 | 97.912 | 1.754 | 0.295 | 0.028 | 3.950 | |||||
| pg18b1git_o2nofp.cx10b_c32r128 | 0.011 | 98.226 | 1.430 | 0.314 | 0.017 | 0.003 | 6.023 | ||||
| pg18b1git_o2nofp.cx10cw4_c32r128 | 0.009 | 98.281 | 1.433 | 0.254 | 0.022 | 3.413 | |||||
| pg18b1git_o2nofp.cx10d_c32r128 | 0.013 | 98.250 | 1.467 | 0.250 | 0.020 | 1.979 |
Performance metrics for the DBMS listed above. Some are normalized by throughput, others are not. Legend for results is here.
ips	qps	rps	rmbps	wps	wmbps	rpq	rkbpq	wpi	wkbpi	csps	cpups	cspq	cpupq	dbgb1	dbgb2	rss	maxop	p50	p99	tag
19262	3154	82686	649.4	39450.4	576.3	26.217	210.834	2.048	30.640	196397	61.1	62.271	9299	793.2	889.2	64.1	3.932	160	16	pg174_o2nofp.cx10a_c32r128
19128	3156	82614	648.8	39211.7	574.8	26.174	210.493	2.050	30.771	196958	61.1	62.401	9292	792.7	888.8	60.2	6.061	160	16	pg18b1git_o2nofp.cx10b_c32r128
19048	3079	81202	637.7	39229.7	578.4	26.374	212.099	2.060	31.093	192190	61.7	62.424	9619	794.1	890.1	58.2	7.582	160	16	pg18b1git_o2nofp.cx10cw4_c32r128
19324	3149	82889	650.9	39404.9	579.4	26.320	211.639	2.039	30.702	197669	62.0	62.766	9450	793.9	889.9	56.5	1.960	160	32	pg18b1git_o2nofp.cx10d_c32r128
l.i0
l.i0: load without secondary indexes
Performance metrics for all DBMS, not just the ones listed above. Some are normalized by throughput, others are not. Legend for results is here.
ips	qps	rps	rmbps	wps	wmbps	rpq	rkbpq	wpi	wkbpi	csps	cpups	cspq	cpupq	dbgb1	dbgb2	rss	maxop	p50	p99	tag
2058672	0	1750	14.0	8661.4	829.9	0.001	0.007	0.004	0.413	376027	57.4	0.183	13	382.7	478.8	93.1	1.117	109782	50646	pg174_o2nofp.cx10a_c32r128
2027369	0	1737	13.9	8469.4	808.8	0.001	0.007	0.004	0.409	329202	56.3	0.162	13	382.7	478.8	90.7	1.364	111243	33164	pg18b1git_o2nofp.cx10b_c32r128
2041858	0	1678	13.5	8552.2	812.7	0.001	0.007	0.004	0.408	344523	56.7	0.169	13	382.7	478.8	93.6	1.365	110576	36860	pg18b1git_o2nofp.cx10cw4_c32r128
2041858	0	1706	13.7	8545.8	817.5	0.001	0.007	0.004	0.410	356846	56.8	0.175	13	382.7	478.8	94.3	1.649	111334	29568	pg18b1git_o2nofp.cx10d_c32r128
l.x
l.x: create secondary indexes
Performance metrics for all DBMS, not just the ones listed above. Some are normalized by throughput, others are not. Legend for results is here.
ips	qps	rps	rmbps	wps	wmbps	rpq	rkbpq	wpi	wkbpi	csps	cpups	cspq	cpupq	dbgb1	dbgb2	rss	maxop	p50	p99	tag
3430532	0	11204	1091.2	8707.9	972.9	0.003	0.326	0.003	0.290	89895	23.7	0.026	3	768.4	863.7	29.6	0.044	NA	NA	pg174_o2nofp.cx10a_c32r128
3384095	0	11064	1077.3	8628.5	966.9	0.003	0.326	0.003	0.293	90258	23.5	0.027	3	768.4	863.7	40.2	0.027	NA	NA	pg18b1git_o2nofp.cx10b_c32r128
3407155	0	11443	1082.0	8729.2	975.8	0.003	0.325	0.003	0.293	94770	23.7	0.028	3	768.4	863.7	46.5	0.114	NA	NA	pg18b1git_o2nofp.cx10cw4_c32r128
3690037	0	12327	1171.8	9319.7	1050.6	0.003	0.325	0.003	0.292	117363	26.1	0.032	3	768.4	863.7	20.5	0.021	NA	NA	pg18b1git_o2nofp.cx10d_c32r128
l.i1
l.i1: continue load after secondary indexes created with 50 inserts per transaction
Performance metrics for all DBMS, not just the ones listed above. Some are normalized by throughput, others are not. Legend for results is here.
ips	qps	rps	rmbps	wps	wmbps	rpq	rkbpq	wpi	wkbpi	csps	cpups	cspq	cpupq	dbgb1	dbgb2	rss	maxop	p50	p99	tag
24286	0	30647	243.5	35938.3	787.5	1.262	10.266	1.480	33.203	84303	30.8	3.471	609	781.5	877.6	88.0	3.337	1149	0	pg174_o2nofp.cx10a_c32r128
24031	0	30351	242.1	35649.1	786.8	1.263	10.318	1.483	33.526	86522	30.2	3.600	603	781.5	877.6	85.5	3.597	1199	0	pg18b1git_o2nofp.cx10b_c32r128
23704	0	30066	240.6	35205.8	779.3	1.268	10.395	1.485	33.664	84821	30.8	3.578	624	781.5	877.6	89.9	3.797	1199	0	pg18b1git_o2nofp.cx10cw4_c32r128
24118	0	30527	243.1	35779.2	785.1	1.266	10.322	1.483	33.334	86876	31.6	3.602	629	781.5	877.6	85.2	2.735	1249	0	pg18b1git_o2nofp.cx10d_c32r128
l.i2
l.i2: continue load after secondary indexes created with 5 inserts per transaction
Performance metrics for all DBMS, not just the ones listed above. Some are normalized by throughput, others are not. Legend for results is here.
ips	qps	rps	rmbps	wps	wmbps	rpq	rkbpq	wpi	wkbpi	csps	cpups	cspq	cpupq	dbgb1	dbgb2	rss	maxop	p50	p99	tag
2460	0	3054	26.6	4689.6	74.7	1.241	11.071	1.907	31.093	18669	28.2	7.590	5503	784.8	880.9	84.2	1.798	210	115	pg174_o2nofp.cx10a_c32r128
2450	0	3078	28.2	4613.2	73.1	1.256	11.768	1.883	30.559	18546	27.8	7.570	5447	784.8	880.8	77.4	2.436	215	175	pg18b1git_o2nofp.cx10b_c32r128
2263	0	2867	26.7	4056.9	66.0	1.267	12.070	1.792	29.860	17533	34.9	7.746	7401	784.7	880.7	89.9	3.944	215	190	pg18b1git_o2nofp.cx10cw4_c32r128
2399	0	2936	23.4	4542.7	71.1	1.224	9.983	1.893	30.367	18298	29.5	7.627	5902	784.9	880.9	77.9	2.607	215	165	pg18b1git_o2nofp.cx10d_c32r128
qr100.L1
qr100.L1: range queries with 100 insert/s per client
Performance metrics for all DBMS, not just the ones listed above. Some are normalized by throughput, others are not. Legend for results is here.
ips	qps	rps	rmbps	wps	wmbps	rpq	rkbpq	wpi	wkbpi	csps	cpups	cspq	cpupq	dbgb1	dbgb2	rss	maxop	p50	p99	tag
1977	373754	2715	21.8	1251.8	36.2	0.007	0.060	0.633	18.764	1422112	42.8	3.805	55	784.9	881.0	95.1	1.310	19163	17197	pg174_o2nofp.cx10a_c32r128
1977	364958	2667	21.5	1294.4	36.6	0.007	0.060	0.655	18.978	1389056	43.1	3.806	57	784.9	880.9	95.7	0.011	18828	17022	pg18b1git_o2nofp.cx10b_c32r128
1977	365876	2667	21.4	1270.4	36.4	0.007	0.060	0.643	18.859	1392140	43.0	3.805	56	784.8	880.8	96.2	0.283	18739	16926	pg18b1git_o2nofp.cx10cw4_c32r128
1977	369429	2670	21.5	1280.4	36.5	0.007	0.060	0.648	18.905	1405775	43.0	3.805	56	785.0	881.0	95.7	0.357	18732	17027	pg18b1git_o2nofp.cx10d_c32r128
qp100.L2
qp100.L2: point queries with 100 insert/s per client
Performance metrics for all DBMS, not just the ones listed above. Some are normalized by throughput, others are not. Legend for results is here.
ips	qps	rps	rmbps	wps	wmbps	rpq	rkbpq	wpi	wkbpi	csps	cpups	cspq	cpupq	dbgb1	dbgb2	rss	maxop	p50	p99	tag
1977	9268	129015	1012.7	6684.9	77.0	13.920	111.886	3.381	39.903	291038	23.7	31.402	1227	785.0	881.1	91.0	2.357	479	240	pg174_o2nofp.cx10a_c32r128
1977	9114	126987	996.8	6703.5	76.9	13.932	111.983	3.391	39.829	287142	23.6	31.504	1243	785.0	881.0	90.9	4.489	479	64	pg18b1git_o2nofp.cx10b_c32r128
1976	8818	123157	966.7	6739.6	77.8	13.966	112.251	3.411	40.345	279052	24.1	31.645	1312	784.9	880.9	91.1	2.444	463	112	pg18b1git_o2nofp.cx10cw4_c32r128
1977	9095	126722	994.6	6725.3	77.1	13.933	111.984	3.402	39.915	285912	24.1	31.435	1272	785.1	881.1	90.6	3.325	479	192	pg18b1git_o2nofp.cx10d_c32r128
qr500.L3
qr500.L3: range queries with 500 insert/s per client
Performance metrics for all DBMS, not just the ones listed above. Some are normalized by throughput, others are not. Legend for results is here.
ips	qps	rps	rmbps	wps	wmbps	rpq	rkbpq	wpi	wkbpi	csps	cpups	cspq	cpupq	dbgb1	dbgb2	rss	maxop	p50	p99	tag
9885	331273	13840	111.6	14431.7	242.7	0.042	0.345	1.460	25.143	1243650	49.0	3.754	71	785.5	881.6	85.7	1.017	17006	14400	pg174_o2nofp.cx10a_c32r128
9874	322046	13810	111.4	14421.7	242.3	0.043	0.354	1.461	25.125	1209505	48.7	3.756	73	785.4	881.4	86.6	1.775	16505	14145	pg18b1git_o2nofp.cx10b_c32r128
9868	322634	13808	111.3	14411.6	242.2	0.043	0.353	1.460	25.131	1209288	48.7	3.748	72	785.4	881.4	86.1	1.783	16558	14065	pg18b1git_o2nofp.cx10cw4_c32r128
9847	326308	13769	111.0	14371.8	241.6	0.042	0.348	1.460	25.125	1225131	48.7	3.755	72	785.6	881.6	87.2	2.326	16702	13729	pg18b1git_o2nofp.cx10d_c32r128
qp500.L4
qp500.L4: point queries with 500 insert/s per client
Performance metrics for all DBMS, not just the ones listed above. Some are normalized by throughput, others are not. Legend for results is here.
ips	qps	rps	rmbps	wps	wmbps	rpq	rkbpq	wpi	wkbpi	csps	cpups	cspq	cpupq	dbgb1	dbgb2	rss	maxop	p50	p99	tag
9879	5814	102452	804.7	22454.8	302.0	17.623	141.748	2.273	31.301	236296	37.6	40.646	3105	786.1	882.1	28.8	1.124	304	144	pg174_o2nofp.cx10a_c32r128
9879	5731	101294	795.6	22339.7	301.0	17.676	142.171	2.261	31.198	234079	37.6	40.846	3149	785.8	881.9	28.9	1.468	288	128	pg18b1git_o2nofp.cx10b_c32r128
9879	5587	99331	779.7	22475.6	301.8	17.780	142.909	2.275	31.287	230669	37.7	41.290	3239	786.5	882.6	31.5	2.640	288	96	pg18b1git_o2nofp.cx10cw4_c32r128
9879	5682	100633	790.3	22317.9	300.9	17.711	142.427	2.259	31.192	233226	37.9	41.047	3202	786.4	882.4	27.1	1.295	288	128	pg18b1git_o2nofp.cx10d_c32r128
qr1000.L5
qr1000.L5: range queries with 1000 insert/s per client
Performance metrics for all DBMS, not just the ones listed above. Some are normalized by throughput, others are not. Legend for results is here.
ips	qps	rps	rmbps	wps	wmbps	rpq	rkbpq	wpi	wkbpi	csps	cpups	cspq	cpupq	dbgb1	dbgb2	rss	maxop	p50	p99	tag
18452	205917	24582	197.9	26689.7	563.1	0.119	0.984	1.446	31.248	683968	63.1	3.322	147	788.9	932.0	76.9	3.985	10852	0	pg174_o2nofp.cx10a_c32r128
18721	205339	24968	201.1	26863.2	568.4	0.122	1.003	1.435	31.090	677203	64.5	3.298	151	788.4	936.3	77.2	2.134	10836	1550	pg18b1git_o2nofp.cx10b_c32r128
18692	206986	24939	200.5	26613.1	559.4	0.120	0.992	1.424	30.646	680252	64.6	3.286	150	789.7	885.7	79.5	3.952	11000	671	pg18b1git_o2nofp.cx10cw4_c32r128
18585	204709	24758	199.1	26766.4	564.9	0.121	0.996	1.440	31.124	674235	64.2	3.294	151	789.5	937.4	77.1	2.868	10740	80	pg18b1git_o2nofp.cx10d_c32r128
qp1000.L6
qp1000.L6: point queries with 1000 insert/s per client
Performance metrics for all DBMS, not just the ones listed above. Some are normalized by throughput, others are not. Legend for results is here.
ips	qps	rps	rmbps	wps	wmbps	rpq	rkbpq	wpi	wkbpi	csps	cpups	cspq	cpupq	dbgb1	dbgb2	rss	maxop	p50	p99	tag
19262	3154	82686	649.4	39450.4	576.3	26.217	210.834	2.048	30.640	196397	61.1	62.271	9299	793.2	889.2	64.1	3.932	160	16	pg174_o2nofp.cx10a_c32r128
19128	3156	82614	648.8	39211.7	574.8	26.174	210.493	2.050	30.771	196958	61.1	62.401	9292	792.7	888.8	60.2	6.061	160	16	pg18b1git_o2nofp.cx10b_c32r128
19048	3079	81202	637.7	39229.7	578.4	26.374	212.099	2.060	31.093	192190	61.7	62.424	9619	794.1	890.1	58.2	7.582	160	16	pg18b1git_o2nofp.cx10cw4_c32r128
19324	3149	82889	650.9	39404.9	579.4	26.320	211.639	2.039	30.702	197669	62.0	62.766	9450	793.9	889.9	56.5	1.960	160	32	pg18b1git_o2nofp.cx10d_c32r128
l.i0
- l.i0: load without secondary indexes
- Legend for results is here.
- Each entry lists the percentage of responses that fit in that bucket (slower than max time for previous bucket, faster than min time for next bucket).
Insert response time histogram
256us	1ms	4ms	16ms	64ms	256ms	1s	4s	16s	gt	max	tag
0.000	89.140	10.546	0.233	0.069	0.007	0.004	nonzero	0.000	0.000	1.117	pg174_o2nofp.cx10a_c32r128
0.000	90.157	9.328	0.411	0.093	0.005	0.007	nonzero	0.000	0.000	1.364	pg18b1git_o2nofp.cx10b_c32r128
0.000	90.358	9.210	0.324	0.096	0.005	0.006	nonzero	0.000	0.000	1.365	pg18b1git_o2nofp.cx10cw4_c32r128
0.000	90.449	9.151	0.306	0.083	0.005	0.006	nonzero	0.000	0.000	1.649	pg18b1git_o2nofp.cx10d_c32r128
l.x
- l.x: create secondary indexes
- Legend for results is here.
- Each entry lists the percentage of responses that fit in that bucket (slower than max time for previous bucket, faster than min time for next bucket).
TODO - determine whether there is data for create index response time
l.i1
- l.i1: continue load after secondary indexes created with 50 inserts per transaction
- Legend for results is here.
- Each entry lists the percentage of responses that fit in that bucket (slower than max time for previous bucket, faster than min time for next bucket).
Insert response time histogram
256us	1ms	4ms	16ms	64ms	256ms	1s	4s	16s	gt	max	tag
0.000	0.000	0.000	20.454	69.471	9.881	0.094	0.100	0.000	0.000	3.337	pg174_o2nofp.cx10a_c32r128
0.000	0.000	0.000	16.385	73.728	9.666	0.103	0.119	0.000	0.000	3.597	pg18b1git_o2nofp.cx10b_c32r128
0.000	0.000	0.000	17.045	72.482	10.279	0.077	0.117	0.000	0.000	3.797	pg18b1git_o2nofp.cx10cw4_c32r128
0.000	0.000	0.000	17.577	73.102	9.133	0.082	0.106	0.000	0.000	2.735	pg18b1git_o2nofp.cx10d_c32r128
Delete response time histogram
256us	1ms	4ms	16ms	64ms	256ms	1s	4s	16s	gt	max	tag
0.000	2.408	8.548	22.836	62.612	3.498	0.046	0.052	0.000	0.000	2.607	pg174_o2nofp.cx10a_c32r128
0.000	2.431	9.028	23.327	64.040	1.078	0.034	0.062	0.000	0.000	2.819	pg18b1git_o2nofp.cx10b_c32r128
0.000	2.435	8.627	24.347	62.836	1.659	0.034	0.062	0.000	0.000	2.752	pg18b1git_o2nofp.cx10cw4_c32r128
0.000	2.492	9.288	21.702	64.753	1.663	0.034	0.067	0.000	0.000	2.751	pg18b1git_o2nofp.cx10d_c32r128
l.i2
- l.i2: continue load after secondary indexes created with 5 inserts per transaction
- Legend for results is here.
- Each entry lists the percentage of responses that fit in that bucket (slower than max time for previous bucket, faster than min time for next bucket).
Insert response time histogram
256us	1ms	4ms	16ms	64ms	256ms	1s	4s	16s	gt	max	tag
0.074	39.749	59.985	0.043	0.106	0.020	0.020	0.002	0.000	0.000	1.798	pg174_o2nofp.cx10a_c32r128
0.183	38.771	60.801	0.091	0.105	0.022	0.024	0.003	0.000	0.000	2.436	pg18b1git_o2nofp.cx10b_c32r128
0.150	36.556	63.115	0.069	0.091	0.010	0.007	0.002	0.000	0.000	3.944	pg18b1git_o2nofp.cx10cw4_c32r128
nonzero	38.944	60.972	0.011	0.012	0.024	0.032	0.005	0.000	0.000	2.607	pg18b1git_o2nofp.cx10d_c32r128
Delete response time histogram
256us	1ms	4ms	16ms	64ms	256ms	1s	4s	16s	gt	max	tag
0.083	1.517	1.252	2.080	95.066	0.002	nonzero	nonzero	0.000	0.000	2.187	pg174_o2nofp.cx10a_c32r128
0.144	2.908	2.877	0.050	94.020	0.002	0.001	nonzero	0.000	0.000	1.959	pg18b1git_o2nofp.cx10b_c32r128
0.104	2.314	4.971	0.190	92.417	0.003	nonzero	nonzero	0.000	0.000	1.394	pg18b1git_o2nofp.cx10cw4_c32r128
0.000	0.000	0.000	0.045	99.953	0.001	nonzero	nonzero	0.000	0.000	1.348	pg18b1git_o2nofp.cx10d_c32r128
qr100.L1
- qr100.L1: range queries with 100 insert/s per client
- Legend for results is here.
- Each entry lists the percentage of responses that fit in that bucket (slower than max time for previous bucket, faster than min time for next bucket).
Query response time histogram
256us	1ms	4ms	16ms	64ms	256ms	1s	4s	16s	gt	max	tag
99.993	0.006	0.001	nonzero	nonzero	0.000	nonzero	nonzero	0.000	0.000	1.310	pg174_o2nofp.cx10a_c32r128
99.993	0.006	0.001	nonzero	0.000	0.000	0.000	0.000	0.000	0.000	0.011	pg18b1git_o2nofp.cx10b_c32r128
99.993	0.006	0.001	nonzero	nonzero	nonzero	nonzero	0.000	0.000	0.000	0.283	pg18b1git_o2nofp.cx10cw4_c32r128
99.993	0.006	0.001	nonzero	nonzero	nonzero	nonzero	0.000	0.000	0.000	0.357	pg18b1git_o2nofp.cx10d_c32r128
Insert response time histogram
256us	1ms	4ms	16ms	64ms	256ms	1s	4s	16s	gt	max	tag
0.000	0.000	0.000	98.929	1.060	0.008	0.000	0.003	0.000	0.000	1.139	pg174_o2nofp.cx10a_c32r128
0.000	0.000	0.000	98.862	1.121	0.017	0.000	0.000	0.000	0.000	0.222	pg18b1git_o2nofp.cx10b_c32r128
0.000	0.000	0.000	98.447	1.553	0.000	0.000	0.000	0.000	0.000	0.063	pg18b1git_o2nofp.cx10cw4_c32r128
0.000	0.000	0.000	98.674	1.322	0.004	0.000	0.000	0.000	0.000	0.236	pg18b1git_o2nofp.cx10d_c32r128
Delete response time histogram
256us	1ms	4ms	16ms	64ms	256ms	1s	4s	16s	gt	max	tag
0.000	44.775	55.163	0.061	0.000	0.001	0.000	0.000	0.000	0.000	0.153	pg174_o2nofp.cx10a_c32r128
0.000	46.454	53.490	0.056	0.000	0.000	0.000	0.000	0.000	0.000	0.013	pg18b1git_o2nofp.cx10b_c32r128
0.000	46.374	53.583	0.040	0.003	0.000	0.000	0.000	0.000	0.000	0.018	pg18b1git_o2nofp.cx10cw4_c32r128
0.000	45.240	54.711	0.047	0.001	0.000	0.000	0.000	0.000	0.000	0.021	pg18b1git_o2nofp.cx10d_c32r128
qp100.L2
- qp100.L2: point queries with 100 insert/s per client
- Legend for results is here.
- Each entry lists the percentage of responses that fit in that bucket (slower than max time for previous bucket, faster than min time for next bucket).
Query response time histogram
256us	1ms	4ms	16ms	64ms	256ms	1s	4s	16s	gt	max	tag
nonzero	2.913	94.241	0.418	2.425	0.001	0.001	0.001	0.000	0.000	2.357	pg174_o2nofp.cx10a_c32r128
nonzero	2.708	94.426	0.434	2.428	0.002	0.002	0.001	nonzero	0.000	4.489	pg18b1git_o2nofp.cx10b_c32r128
nonzero	2.431	94.503	0.445	2.617	0.003	0.001	0.002	0.000	0.000	2.444	pg18b1git_o2nofp.cx10cw4_c32r128
nonzero	2.746	94.471	0.362	2.417	0.002	0.002	0.001	0.000	0.000	3.325	pg18b1git_o2nofp.cx10d_c32r128
Insert response time histogram
256us	1ms	4ms	16ms	64ms	256ms	1s	4s	16s	gt	max	tag
0.000	0.000	0.000	64.375	35.250	0.067	0.218	0.090	0.000	0.000	1.934	pg174_o2nofp.cx10a_c32r128
0.000	0.000	0.000	62.574	36.690	0.219	0.326	0.163	0.028	0.000	4.152	pg18b1git_o2nofp.cx10b_c32r128
0.000	0.000	0.000	60.053	39.215	0.217	0.321	0.194	0.000	0.000	2.133	pg18b1git_o2nofp.cx10cw4_c32r128
0.000	0.000	0.000	65.315	34.174	0.139	0.199	0.174	0.000	0.000	2.495	pg18b1git_o2nofp.cx10d_c32r128
Delete response time histogram
256us	1ms	4ms	16ms	64ms	256ms	1s	4s	16s	gt	max	tag
0.000	0.000	92.510	4.175	3.307	0.000	0.008	0.000	0.000	0.000	0.605	pg174_o2nofp.cx10a_c32r128
0.000	0.000	92.847	4.043	3.022	0.007	0.071	0.010	0.000	0.000	3.113	pg18b1git_o2nofp.cx10b_c32r128
0.000	0.000	91.811	4.603	3.519	0.026	0.029	0.011	0.000	0.000	2.099	pg18b1git_o2nofp.cx10cw4_c32r128
0.000	0.000	93.674	2.918	3.306	0.058	0.042	0.003	0.000	0.000	2.033	pg18b1git_o2nofp.cx10d_c32r128
qr500.L3
- qr500.L3: range queries with 500 insert/s per client
- Legend for results is here.
- Each entry lists the percentage of responses that fit in that bucket (slower than max time for previous bucket, faster than min time for next bucket).
Query response time histogram
256us	1ms	4ms	16ms	64ms	256ms	1s	4s	16s	gt	max	tag
99.962	0.030	0.006	0.001	0.001	nonzero	nonzero	nonzero	0.000	0.000	1.017	pg174_o2nofp.cx10a_c32r128
99.960	0.032	0.006	0.002	0.001	nonzero	nonzero	nonzero	0.000	0.000	1.775	pg18b1git_o2nofp.cx10b_c32r128
99.957	0.034	0.006	0.002	0.001	nonzero	nonzero	nonzero	0.000	0.000	1.783	pg18b1git_o2nofp.cx10cw4_c32r128
99.959	0.032	0.006	0.002	0.001	nonzero	nonzero	nonzero	0.000	0.000	2.326	pg18b1git_o2nofp.cx10d_c32r128
Insert response time histogram
256us	1ms	4ms	16ms	64ms	256ms	1s	4s	16s	gt	max	tag
0.000	0.000	0.000	80.888	18.229	0.413	0.451	0.019	0.000	0.000	1.848	pg174_o2nofp.cx10a_c32r128
0.000	0.000	0.000	80.306	18.927	0.382	0.316	0.069	0.000	0.000	2.459	pg18b1git_o2nofp.cx10b_c32r128
0.000	0.000	0.000	79.210	19.996	0.410	0.348	0.036	0.000	0.000	1.992	pg18b1git_o2nofp.cx10cw4_c32r128
0.000	0.000	0.000	82.242	16.737	0.474	0.428	0.118	0.001	0.000	4.090	pg18b1git_o2nofp.cx10d_c32r128
Delete response time histogram
256us	1ms	4ms	16ms	64ms	256ms	1s	4s	16s	gt	max	tag
0.000	0.000	32.891	65.945	1.136	0.011	0.016	nonzero	0.000	0.000	1.089	pg174_o2nofp.cx10a_c32r128
0.000	0.000	38.681	60.082	1.213	0.010	0.010	0.005	0.000	0.000	2.113	pg18b1git_o2nofp.cx10b_c32r128
0.000	0.000	35.861	62.660	1.458	0.007	0.009	0.004	0.000	0.000	1.893	pg18b1git_o2nofp.cx10cw4_c32r128
0.000	0.000	37.603	60.737	1.634	0.009	0.011	0.007	0.000	0.000	2.098	pg18b1git_o2nofp.cx10d_c32r128
qp500.L4
- qp500.L4: point queries with 500 insert/s per client
- Legend for results is here.
- Each entry lists the percentage of responses that fit in that bucket (slower than max time for previous bucket, faster than min time for next bucket).
Query response time histogram
256us	1ms	4ms	16ms	64ms	256ms	1s	4s	16s	gt	max	tag
0.000	0.263	93.848	1.470	4.401	0.010	0.008	nonzero	0.000	0.000	1.124	pg174_o2nofp.cx10a_c32r128
0.000	0.233	93.938	1.336	4.473	0.012	0.008	0.001	0.000	0.000	1.468	pg18b1git_o2nofp.cx10b_c32r128
0.000	0.207	93.899	1.173	4.689	0.019	0.011	0.001	0.000	0.000	2.640	pg18b1git_o2nofp.cx10cw4_c32r128
0.000	0.212	94.035	1.193	4.543	0.010	0.006	nonzero	0.000	0.000	1.295	pg18b1git_o2nofp.cx10d_c32r128
Insert response time histogram
256us	1ms	4ms	16ms	64ms	256ms	1s	4s	16s	gt	max	tag
0.000	0.000	0.000	34.973	64.321	0.448	0.249	0.010	0.000	0.000	1.243	pg174_o2nofp.cx10a_c32r128
0.000	0.000	0.000	39.388	59.969	0.386	0.240	0.017	0.000	0.000	1.663	pg18b1git_o2nofp.cx10b_c32r128
0.000	0.000	0.000	48.277	50.938	0.452	0.301	0.032	0.000	0.000	2.333	pg18b1git_o2nofp.cx10cw4_c32r128
0.000	0.000	0.000	45.771	53.783	0.283	0.137	0.026	0.000	0.000	1.911	pg18b1git_o2nofp.cx10d_c32r128
Delete response time histogram
256us	1ms	4ms	16ms	64ms	256ms	1s	4s	16s	gt	max	tag
0.000	0.000	0.000	69.511	30.172	0.170	0.141	0.006	0.000	0.000	1.139	pg174_o2nofp.cx10a_c32r128
0.000	0.000	0.000	70.066	29.664	0.138	0.128	0.004	0.000	0.000	1.362	pg18b1git_o2nofp.cx10b_c32r128
0.000	0.000	0.000	71.626	28.064	0.149	0.156	0.006	0.000	0.000	2.250	pg18b1git_o2nofp.cx10cw4_c32r128
0.000	0.000	0.000	70.032	29.792	0.083	0.092	0.001	0.000	0.000	1.135	pg18b1git_o2nofp.cx10d_c32r128
qr1000.L5
- qr1000.L5: range queries with 1000 insert/s per client
- Legend for results is here.
- Each entry lists the percentage of responses that fit in that bucket (slower than max time for previous bucket, faster than min time for next bucket).
Query response time histogram
256us	1ms	4ms	16ms	64ms	256ms	1s	4s	16s	gt	max	tag
99.568	0.326	0.039	0.043	0.024	nonzero	nonzero	nonzero	0.000	0.000	3.985	pg174_o2nofp.cx10a_c32r128
99.558	0.345	0.040	0.038	0.020	nonzero	nonzero	nonzero	0.000	0.000	2.134	pg18b1git_o2nofp.cx10b_c32r128
99.562	0.342	0.040	0.038	0.018	nonzero	nonzero	nonzero	0.000	0.000	3.952	pg18b1git_o2nofp.cx10cw4_c32r128
99.542	0.356	0.041	0.041	0.021	nonzero	nonzero	nonzero	0.000	0.000	2.868	pg18b1git_o2nofp.cx10d_c32r128
Insert response time histogram
256us	1ms	4ms	16ms	64ms	256ms	1s	4s	16s	gt	max	tag
0.000	0.000	0.000	39.608	45.333	14.875	0.072	0.106	0.005	0.000	4.902	pg174_o2nofp.cx10a_c32r128
0.000	0.000	0.000	38.063	48.149	13.603	0.099	0.087	0.000	0.000	3.638	pg18b1git_o2nofp.cx10b_c32r128
0.000	0.000	0.000	38.333	48.448	13.045	0.073	0.099	0.002	0.000	6.595	pg18b1git_o2nofp.cx10cw4_c32r128
0.000	0.000	0.000	35.404	49.869	14.561	0.063	0.101	0.002	0.000	4.399	pg18b1git_o2nofp.cx10d_c32r128
Delete response time histogram
256us	1ms	4ms	16ms	64ms	256ms	1s	4s	16s	gt	max	tag
0.000	0.000	0.000	37.097	58.707	4.116	0.023	0.057	0.001	0.000	4.049	pg174_o2nofp.cx10a_c32r128
0.000	0.000	0.000	36.498	61.188	2.227	0.043	0.044	0.000	0.000	2.167	pg18b1git_o2nofp.cx10b_c32r128
0.000	0.000	0.000	35.435	62.349	2.136	0.025	0.055	0.000	0.000	3.920	pg18b1git_o2nofp.cx10cw4_c32r128
0.000	0.000	0.000	33.903	63.471	2.544	0.026	0.055	nonzero	0.000	4.084	pg18b1git_o2nofp.cx10d_c32r128
qp1000.L6
- qp1000.L6: point queries with 1000 insert/s per client
- Legend for results is here.
- Each entry lists the percentage of responses that fit in that bucket (slower than max time for previous bucket, faster than min time for next bucket).
Query response time histogram
256us	1ms	4ms	16ms	64ms	256ms	1s	4s	16s	gt	max	tag
0.000	0.002	73.334	18.588	7.940	0.089	0.042	0.004	0.000	0.000	3.932	pg174_o2nofp.cx10a_c32r128
0.000	0.002	73.684	18.324	7.860	0.083	0.044	0.003	0.001	0.000	6.061	pg18b1git_o2nofp.cx10b_c32r128
0.000	0.002	72.814	18.693	8.367	0.082	0.038	0.003	0.001	0.000	7.582	pg18b1git_o2nofp.cx10cw4_c32r128
0.000	0.001	72.654	19.266	7.952	0.089	0.033	0.004	0.000	0.000	1.960	pg18b1git_o2nofp.cx10d_c32r128
Insert response time histogram
256us	1ms	4ms	16ms	64ms	256ms	1s	4s	16s	gt	max	tag
0.000	0.000	0.000	10.694	80.744	8.140	0.378	0.043	0.000	0.000	3.951	pg174_o2nofp.cx10a_c32r128
0.000	0.000	0.000	11.698	79.938	7.933	0.388	0.037	0.006	0.000	6.139	pg18b1git_o2nofp.cx10b_c32r128
0.000	0.000	0.000	11.228	79.839	8.539	0.354	0.036	0.004	0.000	7.247	pg18b1git_o2nofp.cx10cw4_c32r128
0.000	0.000	0.000	10.886	80.638	8.121	0.316	0.039	0.000	0.000	2.206	pg18b1git_o2nofp.cx10d_c32r128
Delete response time histogram
256us	1ms	4ms	16ms	64ms	256ms	1s	4s	16s	gt	max	tag
0.000	0.000	0.000	0.011	97.912	1.754	0.295	0.028	0.000	0.000	3.950	pg174_o2nofp.cx10a_c32r128
0.000	0.000	0.000	0.011	98.226	1.430	0.314	0.017	0.003	0.000	6.023	pg18b1git_o2nofp.cx10b_c32r128
0.000	0.000	0.000	0.009	98.281	1.433	0.254	0.022	0.000	0.000	3.413	pg18b1git_o2nofp.cx10cw4_c32r128
0.000	0.000	0.000	0.013	98.250	1.467	0.250	0.020	0.000	0.000	1.979	pg18b1git_o2nofp.cx10d_c32r128