Introduction
This is a report for the insert benchmark with 800M docs and 1 client(s). It is generated by scripts (bash, awk, sed) and Tufte might not be impressed. An overview of the insert benchmark is here and a short update is here. Below, by DBMS, I mean DBMS+version.config. An example is my8020.c10b40 where my means MySQL, 8020 is version 8.0.20 and c10b40 is the name for the configuration file.
The test server has 8 AMD cores, 32G RAM and an NVMe SSD. It is described here as the PN53. The benchmark was run with 1 client and there were 1 or 3 connections per client (1 for queries or inserts without rate limits, 1+1 for rate limited inserts+deletes). It uses 1 table. It loads 800M rows per table without secondary indexes, creates 3 secondary indexes per table, then inserts 4m+1m rows per table with a delete per insert to avoid growing the table. It then does 6 read+write tests for 1800s each that do queries as fast as possible with 100,100,500,500,1000,1000 inserts/s and the same for deletes/s per client concurrent with the queries. The database is larger than memory. Clients and the DBMS share one server. The per-database configs are in the per-database subdirectories here.
The tested DBMS are:
- pg140_o2nofp.cx10a_c8r32 - Postgres 14.0 with the cx10a_c8r32 config
- pg1418_o2nofp.cx10a_c8r32 - Postgres 14.18 with the cx10a_c8r32 config
- pg150_o2nofp.cx10a_c8r32 - Postgres 15.0 with the cx10a_c8r32 config
- pg1513_o2nofp.cx10a_c8r32 - Postgres 15.13 with the cx10a_c8r32 config
- pg160_o2nofp.cx10a_c8r32 - Postgres 16.0 with the cx10a_c8r32 config
- pg169_o2nofp.cx10a_c8r32 - Postgres 16.9 with the cx10a_c8r32 config
- pg170_o2nofp.cx10a_c8r32 - Postgres 17.0 with the cx10a_c8r32 config
- pg175_o2nofp.cx10a_c8r32 - Postgres 17.5 with the cx10a_c8r32 config
- pg18beta1_o2nofp.cx10b_c8r32 - Postgres 18 beta1 with the cx10b_c8r32 config that uses io_method=sync
Contents
- Summary
- l.i0: load without secondary indexes
- l.x: create secondary indexes
- l.i1: continue load after secondary indexes created with 50 inserts per transaction
- l.i2: continue load after secondary indexes created with 5 inserts per transaction
- qr100.L1: range queries with 100 insert/s per client
- qp100.L2: point queries with 100 insert/s per client
- qr500.L3: range queries with 500 insert/s per client
- qp500.L4: point queries with 500 insert/s per client
- qr1000.L5: range queries with 1000 insert/s per client
- qp1000.L6: point queries with 1000 insert/s per client
Summary
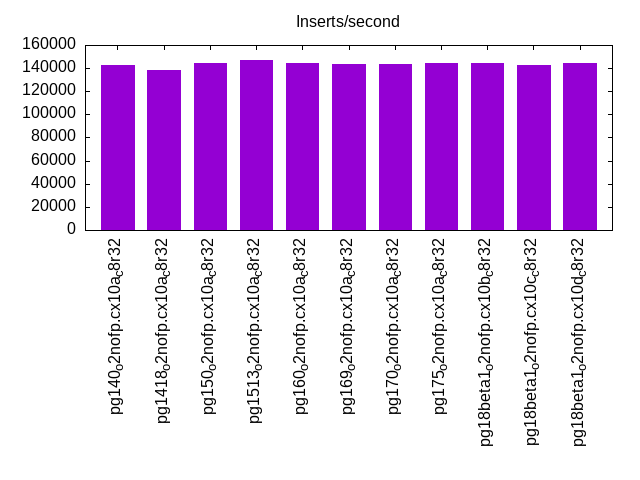
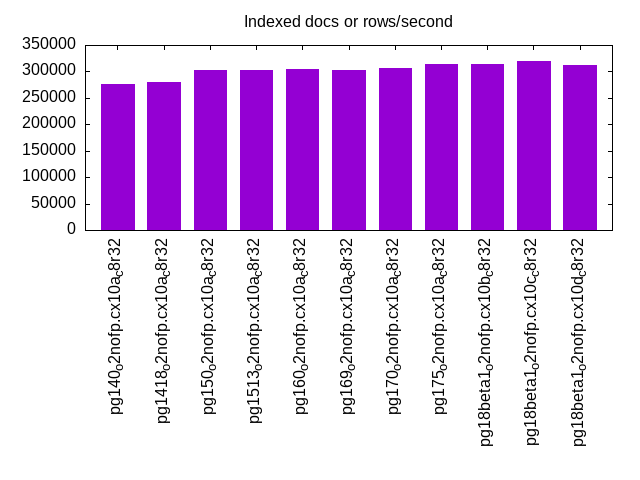
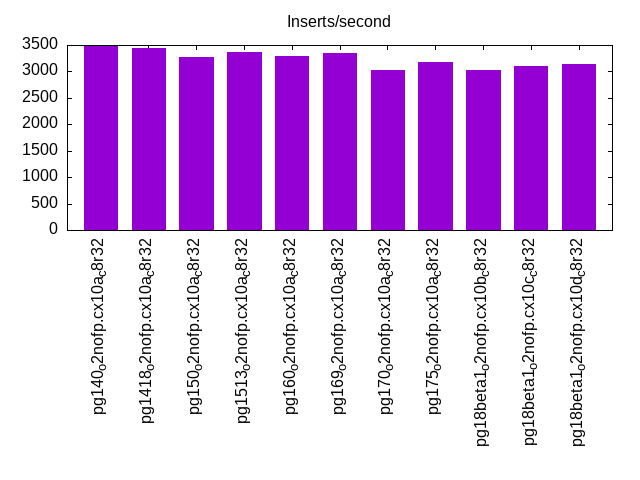
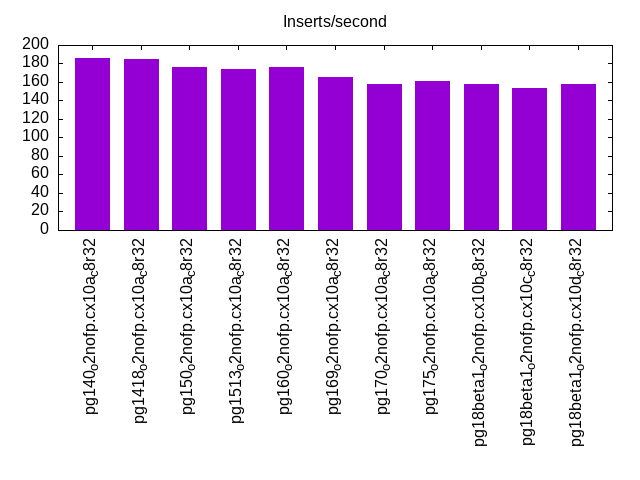
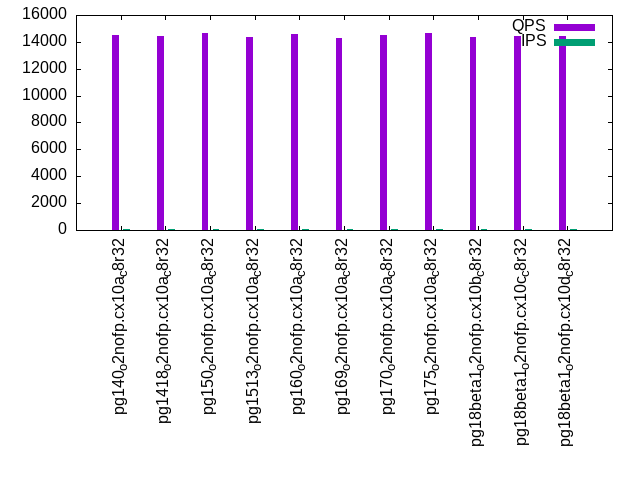
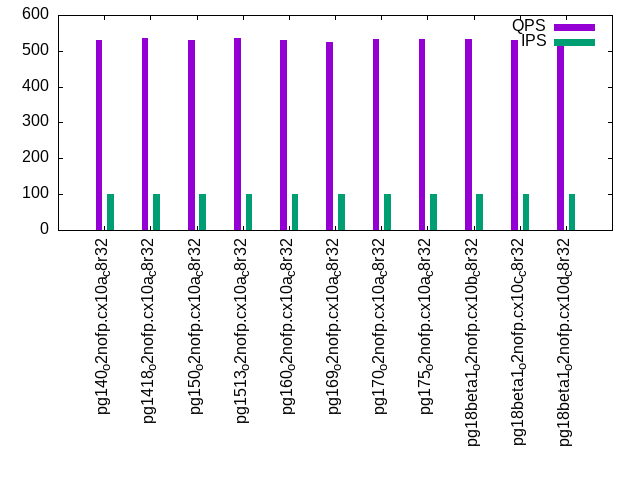
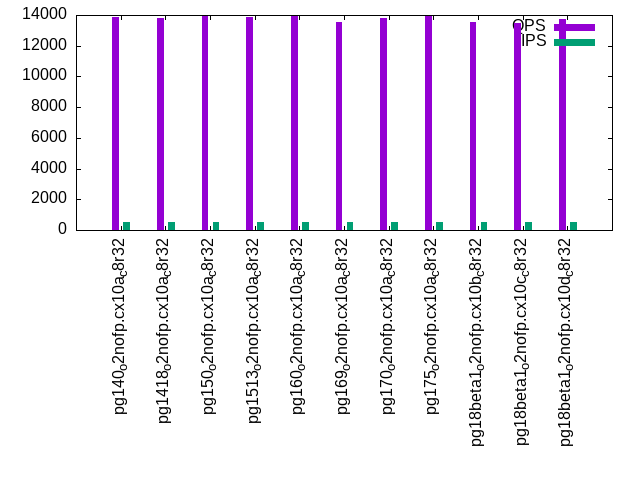
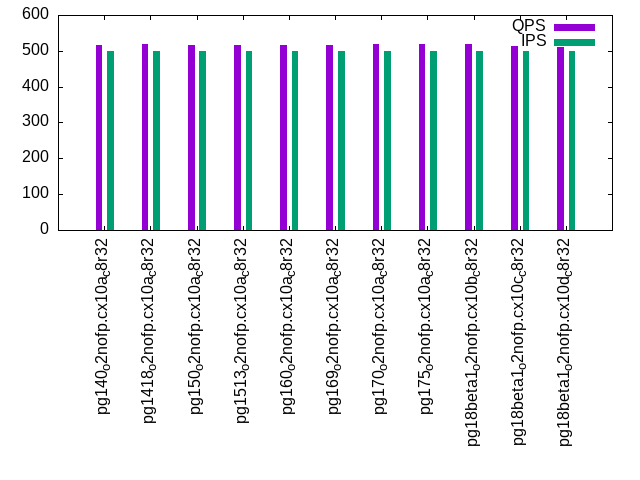
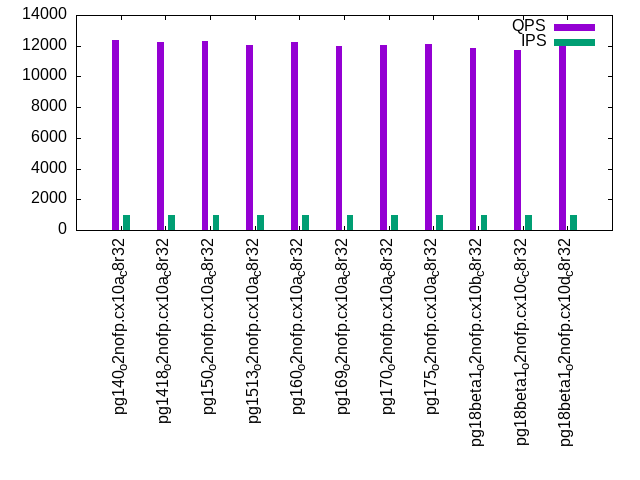
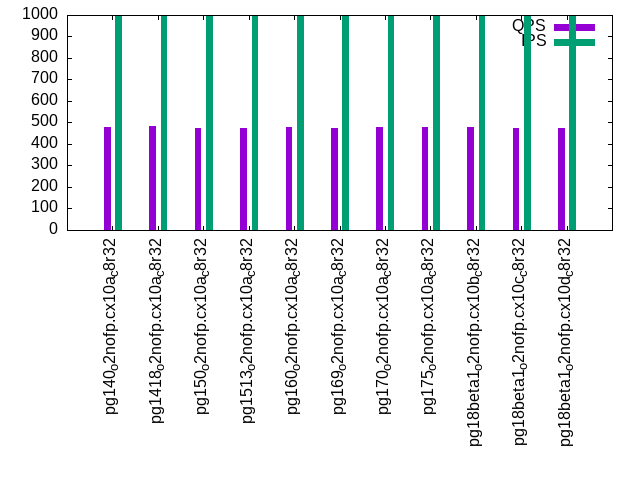
The numbers are inserts/s for l.i0, l.i1 and l.i2, indexed docs (or rows) /s for l.x and queries/s for qr100, qp100 thru qr1000, qp1000" The values are the average rate over the entire test for inserts (IPS) and queries (QPS). The range of values for IPS and QPS is split into 3 parts: bottom 25%, middle 50%, top 25%. Values in the bottom 25% have a red background, values in the top 25% have a green background and values in the middle have no color. A gray background is used for values that can be ignored because the DBMS did not sustain the target insert rate. Red backgrounds are not used when the minimum value is within 80% of the max value.
| dbms | l.i0 | l.x | l.i1 | l.i2 | qr100 | qp100 | qr500 | qp500 | qr1000 | qp1000 |
|---|---|---|---|---|---|---|---|---|---|---|
| pg140_o2nofp.cx10a_c8r32 | 142273 | 276052 | 3475 | 186 | 14541 | 529 | 13850 | 516 | 12356 | 480 |
| pg1418_o2nofp.cx10a_c8r32 | 138768 | 280505 | 3445 | 185 | 14471 | 536 | 13795 | 518 | 12239 | 482 |
| pg150_o2nofp.cx10a_c8r32 | 144639 | 303030 | 3271 | 176 | 14637 | 531 | 13940 | 516 | 12308 | 475 |
| pg1513_o2nofp.cx10a_c8r32 | 146762 | 303030 | 3370 | 174 | 14389 | 537 | 13846 | 516 | 12035 | 475 |
| pg160_o2nofp.cx10a_c8r32 | 144561 | 304646 | 3292 | 176 | 14576 | 531 | 13997 | 517 | 12212 | 477 |
| pg169_o2nofp.cx10a_c8r32 | 143190 | 303490 | 3358 | 165 | 14266 | 526 | 13524 | 516 | 11989 | 475 |
| pg170_o2nofp.cx10a_c8r32 | 143756 | 305927 | 3033 | 158 | 14540 | 534 | 13837 | 518 | 12017 | 481 |
| pg175_o2nofp.cx10a_c8r32 | 144613 | 313357 | 3170 | 161 | 14660 | 532 | 13906 | 518 | 12081 | 481 |
| pg18beta1_o2nofp.cx10b_c8r32 | 144404 | 314465 | 3021 | 158 | 14343 | 534 | 13556 | 518 | 11871 | 478 |
| pg18beta1_o2nofp.cx10c_c8r32 | 142857 | 320384 | 3108 | 154 | 14445 | 529 | 13466 | 513 | 11699 | 473 |
| pg18beta1_o2nofp.cx10d_c8r32 | 144092 | 312867 | 3142 | 158 | 14446 | 530 | 13708 | 512 | 11982 | 473 |
This table has relative throughput, throughput for the DBMS relative to the DBMS in the first line, using the absolute throughput from the previous table. Values less than 0.95 have a yellow background. Values greater than 1.05 have a blue background.
| dbms | l.i0 | l.x | l.i1 | l.i2 | qr100 | qp100 | qr500 | qp500 | qr1000 | qp1000 |
|---|---|---|---|---|---|---|---|---|---|---|
| pg140_o2nofp.cx10a_c8r32 | 1.00 | 1.00 | 1.00 | 1.00 | 1.00 | 1.00 | 1.00 | 1.00 | 1.00 | 1.00 |
| pg1418_o2nofp.cx10a_c8r32 | 0.98 | 1.02 | 0.99 | 0.99 | 1.00 | 1.01 | 1.00 | 1.00 | 0.99 | 1.00 |
| pg150_o2nofp.cx10a_c8r32 | 1.02 | 1.10 | 0.94 | 0.95 | 1.01 | 1.00 | 1.01 | 1.00 | 1.00 | 0.99 |
| pg1513_o2nofp.cx10a_c8r32 | 1.03 | 1.10 | 0.97 | 0.94 | 0.99 | 1.02 | 1.00 | 1.00 | 0.97 | 0.99 |
| pg160_o2nofp.cx10a_c8r32 | 1.02 | 1.10 | 0.95 | 0.95 | 1.00 | 1.00 | 1.01 | 1.00 | 0.99 | 0.99 |
| pg169_o2nofp.cx10a_c8r32 | 1.01 | 1.10 | 0.97 | 0.89 | 0.98 | 0.99 | 0.98 | 1.00 | 0.97 | 0.99 |
| pg170_o2nofp.cx10a_c8r32 | 1.01 | 1.11 | 0.87 | 0.85 | 1.00 | 1.01 | 1.00 | 1.00 | 0.97 | 1.00 |
| pg175_o2nofp.cx10a_c8r32 | 1.02 | 1.14 | 0.91 | 0.87 | 1.01 | 1.01 | 1.00 | 1.00 | 0.98 | 1.00 |
| pg18beta1_o2nofp.cx10b_c8r32 | 1.01 | 1.14 | 0.87 | 0.85 | 0.99 | 1.01 | 0.98 | 1.00 | 0.96 | 1.00 |
| pg18beta1_o2nofp.cx10c_c8r32 | 1.00 | 1.16 | 0.89 | 0.83 | 0.99 | 1.00 | 0.97 | 0.99 | 0.95 | 0.99 |
| pg18beta1_o2nofp.cx10d_c8r32 | 1.01 | 1.13 | 0.90 | 0.85 | 0.99 | 1.00 | 0.99 | 0.99 | 0.97 | 0.99 |
This lists the average rate of inserts/s for the tests that do inserts concurrent with queries. For such tests the query rate is listed in the table above. The read+write tests are setup so that the insert rate should match the target rate every second. Cells that are not at least 95% of the target have a red background to indicate a failure to satisfy the target.
| dbms | qr100.L1 | qp100.L2 | qr500.L3 | qp500.L4 | qr1000.L5 | qp1000.L6 |
|---|---|---|---|---|---|---|
| pg140_o2nofp.cx10a_c8r32 | 100 | 100 | 500 | 500 | 999 | 999 |
| pg1418_o2nofp.cx10a_c8r32 | 100 | 100 | 500 | 500 | 999 | 999 |
| pg150_o2nofp.cx10a_c8r32 | 100 | 100 | 500 | 500 | 999 | 999 |
| pg1513_o2nofp.cx10a_c8r32 | 100 | 100 | 500 | 500 | 999 | 999 |
| pg160_o2nofp.cx10a_c8r32 | 100 | 100 | 500 | 500 | 999 | 999 |
| pg169_o2nofp.cx10a_c8r32 | 100 | 100 | 500 | 500 | 999 | 999 |
| pg170_o2nofp.cx10a_c8r32 | 100 | 100 | 500 | 500 | 999 | 999 |
| pg175_o2nofp.cx10a_c8r32 | 100 | 100 | 500 | 500 | 999 | 999 |
| pg18beta1_o2nofp.cx10b_c8r32 | 100 | 100 | 500 | 500 | 999 | 999 |
| pg18beta1_o2nofp.cx10c_c8r32 | 100 | 100 | 500 | 500 | 999 | 999 |
| pg18beta1_o2nofp.cx10d_c8r32 | 100 | 100 | 500 | 500 | 999 | 999 |
| target | 100 | 100 | 500 | 500 | 1000 | 1000 |
l.i0
l.i0: load without secondary indexes. Graphs for performance per 1-second interval are here.
Average throughput:
Insert response time histogram: each cell has the percentage of responses that take <= the time in the header and max is the max response time in seconds. For the max column values in the top 25% of the range have a red background and in the bottom 25% of the range have a green background. The red background is not used when the min value is within 80% of the max value.
| dbms | 256us | 1ms | 4ms | 16ms | 64ms | 256ms | 1s | 4s | 16s | gt | max |
|---|---|---|---|---|---|---|---|---|---|---|---|
| pg140_o2nofp.cx10a_c8r32 | 99.963 | 0.032 | 0.005 | 0.001 | 0.037 | ||||||
| pg1418_o2nofp.cx10a_c8r32 | 99.967 | 0.028 | 0.005 | 0.001 | 0.060 | ||||||
| pg150_o2nofp.cx10a_c8r32 | 99.888 | 0.098 | 0.012 | 0.002 | nonzero | 0.070 | |||||
| pg1513_o2nofp.cx10a_c8r32 | 99.973 | 0.023 | 0.003 | 0.002 | nonzero | 0.077 | |||||
| pg160_o2nofp.cx10a_c8r32 | 99.972 | 0.023 | 0.003 | 0.002 | 0.061 | ||||||
| pg169_o2nofp.cx10a_c8r32 | 99.967 | 0.027 | 0.004 | 0.002 | 0.048 | ||||||
| pg170_o2nofp.cx10a_c8r32 | 99.970 | 0.024 | 0.004 | 0.003 | 0.058 | ||||||
| pg175_o2nofp.cx10a_c8r32 | 99.974 | 0.021 | 0.003 | 0.001 | nonzero | 0.072 | |||||
| pg18beta1_o2nofp.cx10b_c8r32 | 99.972 | 0.023 | 0.004 | 0.001 | 0.040 | ||||||
| pg18beta1_o2nofp.cx10c_c8r32 | 99.837 | 0.155 | 0.006 | 0.002 | nonzero | 0.069 | |||||
| pg18beta1_o2nofp.cx10d_c8r32 | 99.968 | 0.026 | 0.005 | 0.001 | 0.047 |
Performance metrics for the DBMS listed above. Some are normalized by throughput, others are not. Legend for results is here.
ips	qps	rps	rmbps	wps	wmbps	rpq	rkbpq	wpi	wkbpi	csps	cpups	cspq	cpupq	dbgb1	dbgb2	rss	maxop	p50	p99	tag
142273	0	28	0.2	530.2	58.6	0.000	0.002	0.004	0.422	16737	20.5	0.118	12	76.5	116.6	20.0	0.037	142283	139380	pg140_o2nofp.cx10a_c8r32
138768	0	25	0.2	523.3	57.2	0.000	0.001	0.004	0.422	16284	20.0	0.117	12	76.5	116.6	7.6	0.060	138684	135981	pg1418_o2nofp.cx10a_c8r32
144639	0	27	0.2	541.9	59.5	0.000	0.001	0.004	0.421	17081	20.6	0.118	11	76.5	116.6	0.8	0.070	145680	124483	pg150_o2nofp.cx10a_c8r32
146762	0	28	0.2	549.6	60.3	0.000	0.002	0.004	0.421	17131	20.7	0.117	11	76.5	116.6	2.2	0.077	146783	143480	pg1513_o2nofp.cx10a_c8r32
144561	0	26	0.2	542.9	59.6	0.000	0.001	0.004	0.422	16865	20.6	0.117	11	76.5	116.6	18.9	0.061	144982	141281	pg160_o2nofp.cx10a_c8r32
143190	0	26	0.2	535.7	59.1	0.000	0.001	0.004	0.423	16710	20.4	0.117	11	76.5	116.6	18.1	0.048	143672	140380	pg169_o2nofp.cx10a_c8r32
143756	0	25	0.2	539.0	59.5	0.000	0.001	0.004	0.424	14352	20.5	0.100	11	76.5	116.6	18.5	0.058	144284	140980	pg170_o2nofp.cx10a_c8r32
144613	0	25	0.2	540.5	59.4	0.000	0.001	0.004	0.421	14417	20.5	0.100	11	76.5	116.6	18.2	0.072	145480	140883	pg175_o2nofp.cx10a_c8r32
144404	0	25	0.2	539.0	59.3	0.000	0.001	0.004	0.421	14394	20.4	0.100	11	76.5	116.6	18.4	0.040	145282	140780	pg18beta1_o2nofp.cx10b_c8r32
142857	0	24	0.2	532.2	58.5	0.000	0.001	0.004	0.419	14651	20.7	0.103	12	76.5	116.6	18.5	0.069	143081	132682	pg18beta1_o2nofp.cx10c_c8r32
144092	0	26	0.2	540.4	59.4	0.000	0.001	0.004	0.422	14461	20.5	0.100	11	76.5	116.6	18.9	0.047	144982	140681	pg18beta1_o2nofp.cx10d_c8r32
l.x
l.x: create secondary indexes.
Average throughput:
Performance metrics for the DBMS listed above. Some are normalized by throughput, others are not. Legend for results is here.
ips	qps	rps	rmbps	wps	wmbps	rpq	rkbpq	wpi	wkbpi	csps	cpups	cspq	cpupq	dbgb1	dbgb2	rss	maxop	p50	p99	tag
276052	0	731	90.6	841.6	100.9	0.003	0.336	0.003	0.374	367	12.9	0.001	4	153.6	193.7	23.4	0.004	NA	NA	pg140_o2nofp.cx10a_c8r32
280505	0	742	92.1	860.2	102.4	0.003	0.336	0.003	0.374	375	12.9	0.001	4	153.6	193.7	23.4	0.005	NA	NA	pg1418_o2nofp.cx10a_c8r32
303030	0	834	101.9	958.8	113.2	0.003	0.344	0.003	0.383	425	12.9	0.001	3	153.6	193.7	23.4	0.003	NA	NA	pg150_o2nofp.cx10a_c8r32
303030	0	824	102.1	955.3	113.2	0.003	0.345	0.003	0.382	451	12.9	0.001	3	153.6	193.7	23.4	0.002	NA	NA	pg1513_o2nofp.cx10a_c8r32
304646	0	826	102.6	958.7	114.0	0.003	0.345	0.003	0.383	454	12.9	0.001	3	153.6	193.7	23.5	0.004	NA	NA	pg160_o2nofp.cx10a_c8r32
303490	0	823	102.2	956.0	113.7	0.003	0.345	0.003	0.384	447	12.9	0.001	3	153.6	193.7	23.5	0.003	NA	NA	pg169_o2nofp.cx10a_c8r32
305927	0	828	102.9	968.2	114.0	0.003	0.344	0.003	0.382	353	13.0	0.001	3	153.6	193.7	23.4	0.002	NA	NA	pg170_o2nofp.cx10a_c8r32
313357	0	849	105.5	998.0	116.9	0.003	0.345	0.003	0.382	474	12.9	0.002	3	153.6	193.7	23.4	0.004	NA	NA	pg175_o2nofp.cx10a_c8r32
314465	0	852	105.9	1001.6	117.1	0.003	0.345	0.003	0.381	449	13.0	0.001	3	153.6	193.7	23.4	0.005	NA	NA	pg18beta1_o2nofp.cx10b_c8r32
320384	0	868	107.8	1010.4	119.7	0.003	0.345	0.003	0.382	1270	13.4	0.004	3	153.6	193.7	23.4	0.003	NA	NA	pg18beta1_o2nofp.cx10c_c8r32
312867	0	848	105.3	996.8	116.8	0.003	0.345	0.003	0.382	999	13.4	0.003	3	153.6	193.7	23.4	0.003	NA	NA	pg18beta1_o2nofp.cx10d_c8r32
l.i1
l.i1: continue load after secondary indexes created with 50 inserts per transaction. Graphs for performance per 1-second interval are here.
Average throughput:
Insert response time histogram: each cell has the percentage of responses that take <= the time in the header and max is the max response time in seconds. For the max column values in the top 25% of the range have a red background and in the bottom 25% of the range have a green background. The red background is not used when the min value is within 80% of the max value.
| dbms | 256us | 1ms | 4ms | 16ms | 64ms | 256ms | 1s | 4s | 16s | gt | max |
|---|---|---|---|---|---|---|---|---|---|---|---|
| pg140_o2nofp.cx10a_c8r32 | 98.296 | 1.702 | 0.001 | 0.072 | |||||||
| pg1418_o2nofp.cx10a_c8r32 | 98.259 | 1.741 | 0.050 | ||||||||
| pg150_o2nofp.cx10a_c8r32 | 98.394 | 1.606 | 0.050 | ||||||||
| pg1513_o2nofp.cx10a_c8r32 | 98.338 | 1.663 | 0.053 | ||||||||
| pg160_o2nofp.cx10a_c8r32 | 98.483 | 1.517 | 0.055 | ||||||||
| pg169_o2nofp.cx10a_c8r32 | 98.421 | 1.579 | 0.052 | ||||||||
| pg170_o2nofp.cx10a_c8r32 | 98.601 | 1.399 | 0.050 | ||||||||
| pg175_o2nofp.cx10a_c8r32 | 98.449 | 1.551 | 0.058 | ||||||||
| pg18beta1_o2nofp.cx10b_c8r32 | 98.419 | 1.581 | 0.059 | ||||||||
| pg18beta1_o2nofp.cx10c_c8r32 | 98.323 | 1.678 | 0.054 | ||||||||
| pg18beta1_o2nofp.cx10d_c8r32 | 98.442 | 1.558 | 0.055 |
Delete response time histogram: each cell has the percentage of responses that take <= the time in the header and max is the max response time in seconds. For the max column values in the top 25% of the range have a red background and in the bottom 25% of the range have a green background. The red background is not used when the min value is within 80% of the max value.
| dbms | 256us | 1ms | 4ms | 16ms | 64ms | 256ms | 1s | 4s | 16s | gt | max |
|---|---|---|---|---|---|---|---|---|---|---|---|
| pg140_o2nofp.cx10a_c8r32 | 0.411 | 16.625 | 51.020 | 31.944 | 0.032 | ||||||
| pg1418_o2nofp.cx10a_c8r32 | 0.771 | 16.474 | 50.361 | 32.394 | 0.031 | ||||||
| pg150_o2nofp.cx10a_c8r32 | 0.424 | 15.363 | 48.509 | 35.705 | 0.029 | ||||||
| pg1513_o2nofp.cx10a_c8r32 | 0.419 | 15.585 | 45.519 | 38.477 | 0.030 | ||||||
| pg160_o2nofp.cx10a_c8r32 | 0.323 | 16.511 | 44.464 | 38.703 | 0.030 | ||||||
| pg169_o2nofp.cx10a_c8r32 | 0.504 | 16.212 | 45.129 | 38.155 | 0.030 | ||||||
| pg170_o2nofp.cx10a_c8r32 | 0.476 | 15.440 | 39.611 | 44.472 | 0.037 | ||||||
| pg175_o2nofp.cx10a_c8r32 | 0.429 | 16.102 | 43.014 | 40.455 | 0.033 | ||||||
| pg18beta1_o2nofp.cx10b_c8r32 | 0.511 | 15.054 | 38.488 | 45.948 | 0.034 | ||||||
| pg18beta1_o2nofp.cx10c_c8r32 | 1.014 | 14.866 | 41.444 | 42.676 | 0.033 | ||||||
| pg18beta1_o2nofp.cx10d_c8r32 | 0.573 | 15.326 | 42.014 | 42.087 | 0.033 |
Performance metrics for the DBMS listed above. Some are normalized by throughput, others are not. Legend for results is here.
ips	qps	rps	rmbps	wps	wmbps	rpq	rkbpq	wpi	wkbpi	csps	cpups	cspq	cpupq	dbgb1	dbgb2	rss	maxop	p50	p99	tag
3475	0	4990	39.5	4123.4	70.5	1.436	11.634	1.187	20.774	11453	15.6	3.296	359	154.3	194.3	23.0	0.072	3300	2100	pg140_o2nofp.cx10a_c8r32
3445	0	4950	39.2	4086.5	69.8	1.437	11.646	1.186	20.748	11340	15.5	3.292	360	154.3	194.3	23.0	0.050	3299	2000	pg1418_o2nofp.cx10a_c8r32
3271	0	4704	37.2	3908.6	66.8	1.438	11.661	1.195	20.928	10748	15.4	3.286	377	154.3	194.3	22.8	0.050	3100	1900	pg150_o2nofp.cx10a_c8r32
3370	0	4845	38.4	4031.3	69.0	1.438	11.656	1.196	20.959	11042	15.4	3.277	366	154.3	194.3	22.8	0.053	3000	2050	pg1513_o2nofp.cx10a_c8r32
3292	0	4727	37.4	3902.8	66.7	1.436	11.638	1.185	20.750	10790	15.3	3.277	372	154.3	194.3	23.0	0.055	2900	1800	pg160_o2nofp.cx10a_c8r32
3358	0	4824	38.2	3965.5	67.7	1.436	11.642	1.181	20.634	11044	15.5	3.288	369	154.3	194.3	23.1	0.052	2950	1800	pg169_o2nofp.cx10a_c8r32
3033	0	4362	34.5	3597.8	61.4	1.438	11.660	1.186	20.735	9844	15.1	3.246	398	154.3	194.3	22.9	0.050	2650	1750	pg170_o2nofp.cx10a_c8r32
3170	0	4558	36.1	3791.7	64.9	1.438	11.659	1.196	20.968	10262	15.0	3.238	379	154.3	194.3	22.7	0.058	2650	1850	pg175_o2nofp.cx10a_c8r32
3021	0	4347	34.4	3622.3	62.0	1.439	11.667	1.199	21.008	9796	14.9	3.243	395	154.3	194.3	22.9	0.059	2600	1550	pg18beta1_o2nofp.cx10b_c8r32
3108	0	4469	35.4	3721.0	63.9	1.438	11.657	1.197	21.068	10063	15.0	3.238	386	154.3	194.3	23.0	0.054	2749	1750	pg18beta1_o2nofp.cx10c_c8r32
3142	0	4519	35.8	3742.2	63.9	1.438	11.654	1.191	20.827	10167	14.9	3.236	379	154.3	194.3	22.9	0.055	2600	1800	pg18beta1_o2nofp.cx10d_c8r32
l.i2
l.i2: continue load after secondary indexes created with 5 inserts per transaction. Graphs for performance per 1-second interval are here.
Average throughput:
Insert response time histogram: each cell has the percentage of responses that take <= the time in the header and max is the max response time in seconds. For the max column values in the top 25% of the range have a red background and in the bottom 25% of the range have a green background. The red background is not used when the min value is within 80% of the max value.
| dbms | 256us | 1ms | 4ms | 16ms | 64ms | 256ms | 1s | 4s | 16s | gt | max |
|---|---|---|---|---|---|---|---|---|---|---|---|
| pg140_o2nofp.cx10a_c8r32 | 6.990 | 92.678 | 0.323 | 0.009 | 0.035 | ||||||
| pg1418_o2nofp.cx10a_c8r32 | 6.926 | 92.741 | 0.329 | 0.004 | 0.023 | ||||||
| pg150_o2nofp.cx10a_c8r32 | 7.421 | 92.210 | 0.361 | 0.007 | 0.021 | ||||||
| pg1513_o2nofp.cx10a_c8r32 | 6.992 | 92.626 | 0.373 | 0.009 | 0.023 | ||||||
| pg160_o2nofp.cx10a_c8r32 | 7.101 | 92.616 | 0.275 | 0.008 | 0.033 | ||||||
| pg169_o2nofp.cx10a_c8r32 | 6.834 | 92.853 | 0.304 | 0.008 | 0.032 | ||||||
| pg170_o2nofp.cx10a_c8r32 | 11.276 | 88.670 | 0.050 | 0.003 | 0.037 | ||||||
| pg175_o2nofp.cx10a_c8r32 | 10.545 | 89.403 | 0.048 | 0.004 | 0.025 | ||||||
| pg18beta1_o2nofp.cx10b_c8r32 | 9.489 | 90.456 | 0.052 | 0.003 | 0.027 | ||||||
| pg18beta1_o2nofp.cx10c_c8r32 | 10.748 | 89.200 | 0.050 | 0.003 | 0.036 | ||||||
| pg18beta1_o2nofp.cx10d_c8r32 | 10.649 | 89.303 | 0.047 | 0.002 | 0.022 |
Delete response time histogram: each cell has the percentage of responses that take <= the time in the header and max is the max response time in seconds. For the max column values in the top 25% of the range have a red background and in the bottom 25% of the range have a green background. The red background is not used when the min value is within 80% of the max value.
| dbms | 256us | 1ms | 4ms | 16ms | 64ms | 256ms | 1s | 4s | 16s | gt | max |
|---|---|---|---|---|---|---|---|---|---|---|---|
| pg140_o2nofp.cx10a_c8r32 | 99.999 | 0.001 | 0.099 | ||||||||
| pg1418_o2nofp.cx10a_c8r32 | 99.999 | 0.001 | 0.100 | ||||||||
| pg150_o2nofp.cx10a_c8r32 | 99.999 | 0.001 | 0.101 | ||||||||
| pg1513_o2nofp.cx10a_c8r32 | 99.999 | 0.001 | 0.097 | ||||||||
| pg160_o2nofp.cx10a_c8r32 | 99.999 | 0.001 | 0.098 | ||||||||
| pg169_o2nofp.cx10a_c8r32 | 99.999 | 0.001 | 0.098 | ||||||||
| pg170_o2nofp.cx10a_c8r32 | 99.999 | 0.001 | 0.097 | ||||||||
| pg175_o2nofp.cx10a_c8r32 | 99.999 | 0.001 | 0.097 | ||||||||
| pg18beta1_o2nofp.cx10b_c8r32 | 99.999 | 0.001 | 0.101 | ||||||||
| pg18beta1_o2nofp.cx10c_c8r32 | 99.999 | 0.001 | 0.102 | ||||||||
| pg18beta1_o2nofp.cx10d_c8r32 | 99.999 | 0.001 | 0.104 |
Performance metrics for the DBMS listed above. Some are normalized by throughput, others are not. Legend for results is here.
ips	qps	rps	rmbps	wps	wmbps	rpq	rkbpq	wpi	wkbpi	csps	cpups	cspq	cpupq	dbgb1	dbgb2	rss	maxop	p50	p99	tag
186	0	203	2.1	547.0	8.6	1.095	11.643	2.944	47.192	1451	13.1	7.810	5640	154.5	194.5	3.1	0.035	185	160	pg140_o2nofp.cx10a_c8r32
185	0	199	1.6	535.3	7.3	1.072	8.766	2.889	40.575	1426	13.1	7.697	5656	154.5	194.5	23.3	0.023	185	160	pg1418_o2nofp.cx10a_c8r32
176	0	188	1.5	506.6	7.0	1.072	8.763	2.887	41.073	1297	12.9	7.391	5880	154.4	194.5	23.3	0.021	175	140	pg150_o2nofp.cx10a_c8r32
174	0	186	1.5	500.9	7.0	1.073	8.779	2.884	41.118	1304	12.9	7.505	5941	154.4	194.5	23.3	0.023	175	145	pg1513_o2nofp.cx10a_c8r32
176	0	189	1.5	509.0	7.1	1.073	8.775	2.887	41.104	1314	12.9	7.456	5854	154.4	194.5	23.3	0.033	175	145	pg160_o2nofp.cx10a_c8r32
165	0	177	1.4	487.1	6.8	1.072	8.768	2.945	41.798	1246	12.9	7.531	6239	154.4	194.5	23.3	0.032	165	135	pg169_o2nofp.cx10a_c8r32
158	0	169	1.4	463.9	6.5	1.071	8.759	2.933	41.859	1090	12.8	6.893	6473	154.4	191.7	23.4	0.037	160	130	pg170_o2nofp.cx10a_c8r32
161	0	172	1.4	471.0	6.6	1.072	8.770	2.929	41.733	1109	12.8	6.898	6368	154.4	194.5	23.4	0.025	160	135	pg175_o2nofp.cx10a_c8r32
158	0	170	1.4	465.6	6.5	1.072	8.768	2.939	41.885	1084	12.8	6.841	6465	154.4	191.4	23.4	0.027	160	125	pg18beta1_o2nofp.cx10b_c8r32
154	0	164	1.3	450.5	6.3	1.072	8.761	2.935	41.769	1061	12.8	6.912	6671	154.5	191.4	23.3	0.036	155	120	pg18beta1_o2nofp.cx10c_c8r32
158	0	169	1.3	465.3	6.5	1.072	8.764	2.951	42.065	1086	12.8	6.885	6493	154.4	191.6	23.4	0.022	155	125	pg18beta1_o2nofp.cx10d_c8r32
qr100.L1
qr100.L1: range queries with 100 insert/s per client. Graphs for performance per 1-second interval are here.
Average throughput:
Query response time histogram: each cell has the percentage of responses that take <= the time in the header and max is the max response time in seconds. For max values in the top 25% of the range have a red background and in the bottom 25% of the range have a green background. The red background is not used when the min value is within 80% of the max value.
| dbms | 256us | 1ms | 4ms | 16ms | 64ms | 256ms | 1s | 4s | 16s | gt | max |
|---|---|---|---|---|---|---|---|---|---|---|---|
| pg140_o2nofp.cx10a_c8r32 | 99.994 | 0.006 | nonzero | nonzero | 0.009 | ||||||
| pg1418_o2nofp.cx10a_c8r32 | 99.996 | 0.004 | nonzero | nonzero | 0.010 | ||||||
| pg150_o2nofp.cx10a_c8r32 | 99.996 | 0.003 | nonzero | nonzero | 0.010 | ||||||
| pg1513_o2nofp.cx10a_c8r32 | 99.996 | 0.004 | nonzero | nonzero | 0.009 | ||||||
| pg160_o2nofp.cx10a_c8r32 | 99.996 | 0.003 | nonzero | nonzero | 0.009 | ||||||
| pg169_o2nofp.cx10a_c8r32 | 99.996 | 0.003 | nonzero | nonzero | 0.010 | ||||||
| pg170_o2nofp.cx10a_c8r32 | 99.997 | 0.003 | nonzero | nonzero | 0.009 | ||||||
| pg175_o2nofp.cx10a_c8r32 | 99.997 | 0.003 | nonzero | nonzero | 0.009 | ||||||
| pg18beta1_o2nofp.cx10b_c8r32 | 99.996 | 0.003 | nonzero | nonzero | 0.010 | ||||||
| pg18beta1_o2nofp.cx10c_c8r32 | 99.996 | 0.003 | nonzero | nonzero | 0.010 | ||||||
| pg18beta1_o2nofp.cx10d_c8r32 | 99.996 | 0.003 | nonzero | nonzero | 0.010 |
Insert response time histogram: each cell has the percentage of responses that take <= the time in the header and max is the max response time in seconds. For max values in the top 25% of the range have a red background and in the bottom 25% of the range have a green background. The red background is not used when the min value is within 80% of the max value.
| dbms | 256us | 1ms | 4ms | 16ms | 64ms | 256ms | 1s | 4s | 16s | gt | max |
|---|---|---|---|---|---|---|---|---|---|---|---|
| pg140_o2nofp.cx10a_c8r32 | 56.806 | 43.194 | 0.023 | ||||||||
| pg1418_o2nofp.cx10a_c8r32 | 59.694 | 40.306 | 0.025 | ||||||||
| pg150_o2nofp.cx10a_c8r32 | 56.083 | 43.917 | 0.025 | ||||||||
| pg1513_o2nofp.cx10a_c8r32 | 55.361 | 44.639 | 0.025 | ||||||||
| pg160_o2nofp.cx10a_c8r32 | 55.917 | 44.083 | 0.026 | ||||||||
| pg169_o2nofp.cx10a_c8r32 | 55.556 | 44.444 | 0.026 | ||||||||
| pg170_o2nofp.cx10a_c8r32 | 60.278 | 39.722 | 0.026 | ||||||||
| pg175_o2nofp.cx10a_c8r32 | 60.000 | 40.000 | 0.024 | ||||||||
| pg18beta1_o2nofp.cx10b_c8r32 | 60.361 | 39.639 | 0.024 | ||||||||
| pg18beta1_o2nofp.cx10c_c8r32 | 60.889 | 39.111 | 0.026 | ||||||||
| pg18beta1_o2nofp.cx10d_c8r32 | 59.944 | 40.056 | 0.026 |
Delete response time histogram: each cell has the percentage of responses that take <= the time in the header and max is the max response time in seconds. For max values in the top 25% of the range have a red background and in the bottom 25% of the range have a green background. The red background is not used when the min value is within 80% of the max value.
| dbms | 256us | 1ms | 4ms | 16ms | 64ms | 256ms | 1s | 4s | 16s | gt | max |
|---|---|---|---|---|---|---|---|---|---|---|---|
| pg140_o2nofp.cx10a_c8r32 | 51.889 | 48.056 | 0.056 | 0.010 | |||||||
| pg1418_o2nofp.cx10a_c8r32 | 51.389 | 48.528 | 0.083 | 0.010 | |||||||
| pg150_o2nofp.cx10a_c8r32 | 50.333 | 49.556 | 0.111 | 0.010 | |||||||
| pg1513_o2nofp.cx10a_c8r32 | 53.667 | 46.250 | 0.083 | 0.010 | |||||||
| pg160_o2nofp.cx10a_c8r32 | 51.722 | 48.222 | 0.056 | 0.010 | |||||||
| pg169_o2nofp.cx10a_c8r32 | 44.833 | 55.111 | 0.056 | 0.010 | |||||||
| pg170_o2nofp.cx10a_c8r32 | 51.111 | 48.806 | 0.083 | 0.010 | |||||||
| pg175_o2nofp.cx10a_c8r32 | 44.917 | 55.000 | 0.083 | 0.010 | |||||||
| pg18beta1_o2nofp.cx10b_c8r32 | 48.444 | 51.500 | 0.056 | 0.010 | |||||||
| pg18beta1_o2nofp.cx10c_c8r32 | 51.306 | 48.611 | 0.083 | 0.010 | |||||||
| pg18beta1_o2nofp.cx10d_c8r32 | 45.083 | 54.833 | 0.083 | 0.010 |
Performance metrics for the DBMS listed above. Some are normalized by throughput, others are not. Legend for results is here.
ips	qps	rps	rmbps	wps	wmbps	rpq	rkbpq	wpi	wkbpi	csps	cpups	cspq	cpupq	dbgb1	dbgb2	rss	maxop	p50	p99	tag
100	14541	112	0.9	48.5	1.7	0.008	0.066	0.485	17.778	55824	12.4	3.839	68	154.5	192.5	23.3	0.009	14526	14254	pg140_o2nofp.cx10a_c8r32
100	14471	112	0.9	45.4	1.7	0.008	0.066	0.454	17.504	55549	12.5	3.839	69	154.5	192.2	23.3	0.010	14478	14238	pg1418_o2nofp.cx10a_c8r32
100	14637	111	0.9	44.9	1.7	0.008	0.065	0.449	17.424	56121	12.4	3.834	68	154.5	191.7	23.3	0.010	14622	14446	pg150_o2nofp.cx10a_c8r32
100	14389	111	0.9	42.1	1.7	0.008	0.066	0.421	17.188	55176	12.5	3.835	69	154.5	191.7	23.3	0.009	14398	14126	pg1513_o2nofp.cx10a_c8r32
100	14576	111	0.9	44.0	1.7	0.008	0.065	0.440	17.360	55919	12.4	3.836	68	154.5	192.4	23.3	0.009	14574	14302	pg160_o2nofp.cx10a_c8r32
100	14266	112	0.9	39.5	1.7	0.008	0.067	0.395	16.972	54739	12.6	3.837	71	154.5	193.3	23.3	0.010	14254	14030	pg169_o2nofp.cx10a_c8r32
100	14540	112	0.9	64.4	1.9	0.008	0.066	0.644	19.202	55740	12.6	3.834	69	154.5	190.7	23.4	0.009	14558	14286	pg170_o2nofp.cx10a_c8r32
100	14660	112	0.9	64.7	1.9	0.008	0.065	0.647	19.241	56201	12.4	3.834	68	154.5	192.2	23.4	0.009	14654	14414	pg175_o2nofp.cx10a_c8r32
100	14343	111	0.9	65.3	1.9	0.008	0.065	0.653	19.290	55024	12.6	3.836	70	154.5	192.1	23.4	0.010	14334	14094	pg18beta1_o2nofp.cx10b_c8r32
100	14445	112	0.9	67.0	1.9	0.008	0.064	0.670	19.435	55381	12.5	3.834	69	154.5	189.9	23.4	0.010	14446	14174	pg18beta1_o2nofp.cx10c_c8r32
100	14446	111	0.9	66.3	1.9	0.008	0.064	0.664	19.391	55417	12.6	3.836	70	154.5	193.1	23.4	0.010	14430	14206	pg18beta1_o2nofp.cx10d_c8r32
qp100.L2
qp100.L2: point queries with 100 insert/s per client. Graphs for performance per 1-second interval are here.
Average throughput:
Query response time histogram: each cell has the percentage of responses that take <= the time in the header and max is the max response time in seconds. For max values in the top 25% of the range have a red background and in the bottom 25% of the range have a green background. The red background is not used when the min value is within 80% of the max value.
| dbms | 256us | 1ms | 4ms | 16ms | 64ms | 256ms | 1s | 4s | 16s | gt | max |
|---|---|---|---|---|---|---|---|---|---|---|---|
| pg140_o2nofp.cx10a_c8r32 | 0.643 | 99.326 | 0.021 | 0.009 | 0.021 | ||||||
| pg1418_o2nofp.cx10a_c8r32 | 0.789 | 99.200 | 0.011 | 0.008 | |||||||
| pg150_o2nofp.cx10a_c8r32 | 0.698 | 99.290 | 0.012 | 0.008 | |||||||
| pg1513_o2nofp.cx10a_c8r32 | 0.810 | 99.179 | 0.011 | 0.007 | |||||||
| pg160_o2nofp.cx10a_c8r32 | 0.737 | 99.252 | 0.011 | 0.008 | |||||||
| pg169_o2nofp.cx10a_c8r32 | 0.642 | 99.341 | 0.018 | 0.008 | |||||||
| pg170_o2nofp.cx10a_c8r32 | 0.778 | 99.210 | 0.011 | 0.011 | |||||||
| pg175_o2nofp.cx10a_c8r32 | 0.724 | 99.266 | 0.010 | 0.007 | |||||||
| pg18beta1_o2nofp.cx10b_c8r32 | 0.777 | 99.211 | 0.012 | 0.008 | |||||||
| pg18beta1_o2nofp.cx10c_c8r32 | 0.720 | 99.268 | 0.012 | 0.007 | |||||||
| pg18beta1_o2nofp.cx10d_c8r32 | 0.783 | 99.206 | 0.011 | 0.007 |
Insert response time histogram: each cell has the percentage of responses that take <= the time in the header and max is the max response time in seconds. For max values in the top 25% of the range have a red background and in the bottom 25% of the range have a green background. The red background is not used when the min value is within 80% of the max value.
| dbms | 256us | 1ms | 4ms | 16ms | 64ms | 256ms | 1s | 4s | 16s | gt | max |
|---|---|---|---|---|---|---|---|---|---|---|---|
| pg140_o2nofp.cx10a_c8r32 | 91.750 | 8.250 | 0.027 | ||||||||
| pg1418_o2nofp.cx10a_c8r32 | 92.278 | 7.722 | 0.021 | ||||||||
| pg150_o2nofp.cx10a_c8r32 | 93.000 | 7.000 | 0.023 | ||||||||
| pg1513_o2nofp.cx10a_c8r32 | 92.417 | 7.583 | 0.020 | ||||||||
| pg160_o2nofp.cx10a_c8r32 | 91.361 | 8.639 | 0.024 | ||||||||
| pg169_o2nofp.cx10a_c8r32 | 93.028 | 6.972 | 0.020 | ||||||||
| pg170_o2nofp.cx10a_c8r32 | 99.583 | 0.417 | 0.024 | ||||||||
| pg175_o2nofp.cx10a_c8r32 | 99.472 | 0.528 | 0.019 | ||||||||
| pg18beta1_o2nofp.cx10b_c8r32 | 99.444 | 0.556 | 0.019 | ||||||||
| pg18beta1_o2nofp.cx10c_c8r32 | 99.444 | 0.556 | 0.020 | ||||||||
| pg18beta1_o2nofp.cx10d_c8r32 | 99.556 | 0.444 | 0.019 |
Delete response time histogram: each cell has the percentage of responses that take <= the time in the header and max is the max response time in seconds. For max values in the top 25% of the range have a red background and in the bottom 25% of the range have a green background. The red background is not used when the min value is within 80% of the max value.
| dbms | 256us | 1ms | 4ms | 16ms | 64ms | 256ms | 1s | 4s | 16s | gt | max |
|---|---|---|---|---|---|---|---|---|---|---|---|
| pg140_o2nofp.cx10a_c8r32 | 99.861 | 0.139 | 0.010 | ||||||||
| pg1418_o2nofp.cx10a_c8r32 | 99.972 | 0.028 | 0.008 | ||||||||
| pg150_o2nofp.cx10a_c8r32 | 99.972 | 0.028 | 0.009 | ||||||||
| pg1513_o2nofp.cx10a_c8r32 | 0.028 | 99.944 | 0.028 | 0.009 | |||||||
| pg160_o2nofp.cx10a_c8r32 | 99.972 | 0.028 | 0.008 | ||||||||
| pg169_o2nofp.cx10a_c8r32 | 99.972 | 0.028 | 0.008 | ||||||||
| pg170_o2nofp.cx10a_c8r32 | 99.972 | 0.028 | 0.008 | ||||||||
| pg175_o2nofp.cx10a_c8r32 | 99.222 | 0.778 | 0.008 | ||||||||
| pg18beta1_o2nofp.cx10b_c8r32 | 99.972 | 0.028 | 0.008 | ||||||||
| pg18beta1_o2nofp.cx10c_c8r32 | 97.750 | 2.250 | 0.009 | ||||||||
| pg18beta1_o2nofp.cx10d_c8r32 | 99.972 | 0.028 | 0.009 |
Performance metrics for the DBMS listed above. Some are normalized by throughput, others are not. Legend for results is here.
ips	qps	rps	rmbps	wps	wmbps	rpq	rkbpq	wpi	wkbpi	csps	cpups	cspq	cpupq	dbgb1	dbgb2	rss	maxop	p50	p99	tag
100	529	6909	54.3	369.2	4.2	13.062	105.120	3.696	43.480	15624	4.0	29.540	605	154.5	192.5	23.3	0.021	544	368	pg140_o2nofp.cx10a_c8r32
100	536	6991	55.0	372.1	4.3	13.050	105.064	3.725	43.678	15804	3.7	29.502	553	154.5	192.3	23.3	0.008	560	368	pg1418_o2nofp.cx10a_c8r32
100	531	6952	54.7	368.4	4.2	13.103	105.522	3.688	43.356	15646	3.6	29.487	543	154.5	191.7	23.3	0.008	544	368	pg150_o2nofp.cx10a_c8r32
100	537	6999	55.0	371.7	4.3	13.043	105.003	3.717	43.576	15752	3.7	29.354	552	154.5	191.7	23.3	0.007	560	368	pg1513_o2nofp.cx10a_c8r32
100	531	6935	54.5	369.3	4.2	13.055	105.082	3.697	43.430	15611	3.7	29.388	557	154.5	192.4	23.3	0.008	560	352	pg160_o2nofp.cx10a_c8r32
100	526	6876	54.1	373.9	4.3	13.060	105.152	3.743	43.798	15478	3.7	29.397	562	154.5	193.3	23.3	0.008	544	352	pg169_o2nofp.cx10a_c8r32
100	534	6962	54.7	346.4	4.1	13.038	104.959	3.464	41.574	15666	3.7	29.337	554	154.5	190.7	23.4	0.011	560	368	pg170_o2nofp.cx10a_c8r32
100	532	6939	54.6	345.9	4.1	13.046	105.026	3.459	41.571	15612	3.6	29.351	541	154.5	192.3	23.4	0.007	560	368	pg175_o2nofp.cx10a_c8r32
100	534	6957	54.7	345.6	4.1	13.037	104.962	3.456	41.526	15655	3.7	29.339	555	154.5	192.1	23.4	0.008	560	368	pg18beta1_o2nofp.cx10b_c8r32
100	529	6938	54.5	343.9	4.0	13.106	105.501	3.439	41.408	15603	3.7	29.473	559	154.5	189.9	23.4	0.007	560	352	pg18beta1_o2nofp.cx10c_c8r32
100	530	6911	54.3	344.3	4.0	13.043	104.957	3.443	41.452	15550	3.7	29.346	559	154.5	193.1	23.4	0.007	560	352	pg18beta1_o2nofp.cx10d_c8r32
qr500.L3
qr500.L3: range queries with 500 insert/s per client. Graphs for performance per 1-second interval are here.
Average throughput:
Query response time histogram: each cell has the percentage of responses that take <= the time in the header and max is the max response time in seconds. For max values in the top 25% of the range have a red background and in the bottom 25% of the range have a green background. The red background is not used when the min value is within 80% of the max value.
| dbms | 256us | 1ms | 4ms | 16ms | 64ms | 256ms | 1s | 4s | 16s | gt | max |
|---|---|---|---|---|---|---|---|---|---|---|---|
| pg140_o2nofp.cx10a_c8r32 | 99.981 | 0.018 | nonzero | nonzero | nonzero | 0.017 | |||||
| pg1418_o2nofp.cx10a_c8r32 | 99.983 | 0.016 | nonzero | nonzero | nonzero | 0.033 | |||||
| pg150_o2nofp.cx10a_c8r32 | 99.983 | 0.017 | nonzero | nonzero | nonzero | 0.042 | |||||
| pg1513_o2nofp.cx10a_c8r32 | 99.982 | 0.017 | nonzero | 0.001 | nonzero | 0.031 | |||||
| pg160_o2nofp.cx10a_c8r32 | 99.982 | 0.017 | nonzero | 0.001 | nonzero | 0.045 | |||||
| pg169_o2nofp.cx10a_c8r32 | 99.980 | 0.019 | nonzero | 0.001 | nonzero | 0.033 | |||||
| pg170_o2nofp.cx10a_c8r32 | 99.984 | 0.015 | nonzero | nonzero | nonzero | 0.020 | |||||
| pg175_o2nofp.cx10a_c8r32 | 99.985 | 0.015 | nonzero | nonzero | nonzero | 0.025 | |||||
| pg18beta1_o2nofp.cx10b_c8r32 | 99.983 | 0.016 | nonzero | nonzero | nonzero | 0.032 | |||||
| pg18beta1_o2nofp.cx10c_c8r32 | 99.983 | 0.016 | nonzero | nonzero | nonzero | 0.025 | |||||
| pg18beta1_o2nofp.cx10d_c8r32 | 99.983 | 0.017 | nonzero | nonzero | nonzero | 0.036 |
Insert response time histogram: each cell has the percentage of responses that take <= the time in the header and max is the max response time in seconds. For max values in the top 25% of the range have a red background and in the bottom 25% of the range have a green background. The red background is not used when the min value is within 80% of the max value.
| dbms | 256us | 1ms | 4ms | 16ms | 64ms | 256ms | 1s | 4s | 16s | gt | max |
|---|---|---|---|---|---|---|---|---|---|---|---|
| pg140_o2nofp.cx10a_c8r32 | 92.678 | 7.322 | 0.035 | ||||||||
| pg1418_o2nofp.cx10a_c8r32 | 91.606 | 8.394 | 0.033 | ||||||||
| pg150_o2nofp.cx10a_c8r32 | 91.611 | 8.389 | 0.031 | ||||||||
| pg1513_o2nofp.cx10a_c8r32 | 91.439 | 8.561 | 0.031 | ||||||||
| pg160_o2nofp.cx10a_c8r32 | 91.633 | 8.367 | 0.030 | ||||||||
| pg169_o2nofp.cx10a_c8r32 | 91.511 | 8.489 | 0.028 | ||||||||
| pg170_o2nofp.cx10a_c8r32 | 93.439 | 6.561 | 0.025 | ||||||||
| pg175_o2nofp.cx10a_c8r32 | 93.489 | 6.511 | 0.025 | ||||||||
| pg18beta1_o2nofp.cx10b_c8r32 | 93.417 | 6.583 | 0.030 | ||||||||
| pg18beta1_o2nofp.cx10c_c8r32 | 93.828 | 6.172 | 0.031 | ||||||||
| pg18beta1_o2nofp.cx10d_c8r32 | 93.722 | 6.278 | 0.030 |
Delete response time histogram: each cell has the percentage of responses that take <= the time in the header and max is the max response time in seconds. For max values in the top 25% of the range have a red background and in the bottom 25% of the range have a green background. The red background is not used when the min value is within 80% of the max value.
| dbms | 256us | 1ms | 4ms | 16ms | 64ms | 256ms | 1s | 4s | 16s | gt | max |
|---|---|---|---|---|---|---|---|---|---|---|---|
| pg140_o2nofp.cx10a_c8r32 | 45.978 | 54.022 | 0.014 | ||||||||
| pg1418_o2nofp.cx10a_c8r32 | 46.656 | 53.344 | 0.015 | ||||||||
| pg150_o2nofp.cx10a_c8r32 | 43.067 | 56.933 | 0.014 | ||||||||
| pg1513_o2nofp.cx10a_c8r32 | 43.083 | 56.917 | 0.014 | ||||||||
| pg160_o2nofp.cx10a_c8r32 | 42.817 | 57.183 | 0.015 | ||||||||
| pg169_o2nofp.cx10a_c8r32 | 42.800 | 57.200 | 0.015 | ||||||||
| pg170_o2nofp.cx10a_c8r32 | 43.072 | 56.928 | 0.014 | ||||||||
| pg175_o2nofp.cx10a_c8r32 | 42.394 | 57.606 | 0.014 | ||||||||
| pg18beta1_o2nofp.cx10b_c8r32 | 40.789 | 59.211 | 0.015 | ||||||||
| pg18beta1_o2nofp.cx10c_c8r32 | 41.406 | 58.594 | 0.015 | ||||||||
| pg18beta1_o2nofp.cx10d_c8r32 | 36.750 | 63.250 | 0.015 |
Performance metrics for the DBMS listed above. Some are normalized by throughput, others are not. Legend for results is here.
ips	qps	rps	rmbps	wps	wmbps	rpq	rkbpq	wpi	wkbpi	csps	cpups	cspq	cpupq	dbgb1	dbgb2	rss	maxop	p50	p99	tag
500	13850	869	6.9	282.7	8.6	0.063	0.512	0.565	17.631	54779	13.6	3.955	79	154.6	190.1	23.3	0.017	13854	13342	pg140_o2nofp.cx10a_c8r32
500	13795	869	6.9	276.6	8.5	0.063	0.514	0.553	17.463	54567	13.6	3.955	79	154.6	190.4	23.3	0.033	13806	13294	pg1418_o2nofp.cx10a_c8r32
500	13940	869	6.9	277.3	8.5	0.062	0.509	0.555	17.519	55126	13.6	3.955	78	154.6	190.3	23.3	0.042	13950	13421	pg150_o2nofp.cx10a_c8r32
500	13846	868	6.9	271.2	8.5	0.063	0.512	0.542	17.340	54724	13.6	3.952	79	154.6	190.3	23.3	0.031	13839	13326	pg1513_o2nofp.cx10a_c8r32
500	13997	870	6.9	274.8	8.5	0.062	0.507	0.550	17.458	55329	13.6	3.953	78	154.6	190.5	23.3	0.045	14014	13438	pg160_o2nofp.cx10a_c8r32
500	13524	870	6.9	257.8	8.3	0.064	0.524	0.516	17.073	53497	13.7	3.956	81	154.6	190.9	23.3	0.033	13534	12990	pg169_o2nofp.cx10a_c8r32
500	13837	868	6.9	345.2	9.3	0.063	0.512	0.691	19.074	54688	13.7	3.952	79	154.6	188.3	23.4	0.020	13854	13326	pg170_o2nofp.cx10a_c8r32
500	13906	869	6.9	345.5	9.3	0.062	0.510	0.691	19.081	54947	13.7	3.951	79	154.6	190.4	23.4	0.025	13934	13422	pg175_o2nofp.cx10a_c8r32
500	13556	869	6.9	347.2	9.3	0.064	0.524	0.694	19.110	53588	13.7	3.953	81	154.6	190.3	23.4	0.032	13582	13038	pg18beta1_o2nofp.cx10b_c8r32
500	13466	868	6.9	350.6	9.4	0.064	0.526	0.702	19.202	53269	13.7	3.956	81	154.6	190.0	23.4	0.025	13470	12958	pg18beta1_o2nofp.cx10c_c8r32
500	13708	869	6.9	349.7	9.4	0.063	0.518	0.699	19.171	54168	13.8	3.951	81	154.6	190.7	23.4	0.036	13710	13166	pg18beta1_o2nofp.cx10d_c8r32
qp500.L4
qp500.L4: point queries with 500 insert/s per client. Graphs for performance per 1-second interval are here.
Average throughput:
Query response time histogram: each cell has the percentage of responses that take <= the time in the header and max is the max response time in seconds. For max values in the top 25% of the range have a red background and in the bottom 25% of the range have a green background. The red background is not used when the min value is within 80% of the max value.
| dbms | 256us | 1ms | 4ms | 16ms | 64ms | 256ms | 1s | 4s | 16s | gt | max |
|---|---|---|---|---|---|---|---|---|---|---|---|
| pg140_o2nofp.cx10a_c8r32 | 0.365 | 99.602 | 0.027 | 0.005 | 0.019 | ||||||
| pg1418_o2nofp.cx10a_c8r32 | 0.406 | 99.585 | 0.010 | 0.008 | |||||||
| pg150_o2nofp.cx10a_c8r32 | 0.386 | 99.603 | 0.011 | 0.009 | |||||||
| pg1513_o2nofp.cx10a_c8r32 | 0.369 | 99.621 | 0.010 | 0.008 | |||||||
| pg160_o2nofp.cx10a_c8r32 | 0.382 | 99.610 | 0.008 | 0.008 | |||||||
| pg169_o2nofp.cx10a_c8r32 | 0.365 | 99.625 | 0.010 | 0.007 | |||||||
| pg170_o2nofp.cx10a_c8r32 | 0.390 | 99.599 | 0.011 | 0.008 | |||||||
| pg175_o2nofp.cx10a_c8r32 | 0.415 | 99.576 | 0.009 | 0.007 | |||||||
| pg18beta1_o2nofp.cx10b_c8r32 | 0.422 | 99.569 | 0.009 | 0.007 | |||||||
| pg18beta1_o2nofp.cx10c_c8r32 | 0.386 | 99.605 | 0.009 | 0.008 | |||||||
| pg18beta1_o2nofp.cx10d_c8r32 | 0.390 | 99.600 | 0.009 | 0.008 |
Insert response time histogram: each cell has the percentage of responses that take <= the time in the header and max is the max response time in seconds. For max values in the top 25% of the range have a red background and in the bottom 25% of the range have a green background. The red background is not used when the min value is within 80% of the max value.
| dbms | 256us | 1ms | 4ms | 16ms | 64ms | 256ms | 1s | 4s | 16s | gt | max |
|---|---|---|---|---|---|---|---|---|---|---|---|
| pg140_o2nofp.cx10a_c8r32 | 99.350 | 0.650 | 0.024 | ||||||||
| pg1418_o2nofp.cx10a_c8r32 | 99.750 | 0.250 | 0.018 | ||||||||
| pg150_o2nofp.cx10a_c8r32 | 99.700 | 0.300 | 0.019 | ||||||||
| pg1513_o2nofp.cx10a_c8r32 | 99.711 | 0.289 | 0.020 | ||||||||
| pg160_o2nofp.cx10a_c8r32 | 99.711 | 0.289 | 0.020 | ||||||||
| pg169_o2nofp.cx10a_c8r32 | 99.711 | 0.289 | 0.021 | ||||||||
| pg170_o2nofp.cx10a_c8r32 | 99.744 | 0.256 | 0.021 | ||||||||
| pg175_o2nofp.cx10a_c8r32 | 99.761 | 0.239 | 0.020 | ||||||||
| pg18beta1_o2nofp.cx10b_c8r32 | 99.739 | 0.261 | 0.018 | ||||||||
| pg18beta1_o2nofp.cx10c_c8r32 | 99.767 | 0.233 | 0.019 | ||||||||
| pg18beta1_o2nofp.cx10d_c8r32 | 99.656 | 0.344 | 0.020 |
Delete response time histogram: each cell has the percentage of responses that take <= the time in the header and max is the max response time in seconds. For max values in the top 25% of the range have a red background and in the bottom 25% of the range have a green background. The red background is not used when the min value is within 80% of the max value.
| dbms | 256us | 1ms | 4ms | 16ms | 64ms | 256ms | 1s | 4s | 16s | gt | max |
|---|---|---|---|---|---|---|---|---|---|---|---|
| pg140_o2nofp.cx10a_c8r32 | 98.306 | 1.694 | 0.043 | ||||||||
| pg1418_o2nofp.cx10a_c8r32 | 98.339 | 1.661 | 0.042 | ||||||||
| pg150_o2nofp.cx10a_c8r32 | 98.561 | 1.439 | 0.043 | ||||||||
| pg1513_o2nofp.cx10a_c8r32 | 98.906 | 1.094 | 0.042 | ||||||||
| pg160_o2nofp.cx10a_c8r32 | 97.600 | 2.400 | 0.042 | ||||||||
| pg169_o2nofp.cx10a_c8r32 | 98.256 | 1.744 | 0.043 | ||||||||
| pg170_o2nofp.cx10a_c8r32 | 90.006 | 9.994 | 0.041 | ||||||||
| pg175_o2nofp.cx10a_c8r32 | 94.533 | 5.467 | 0.042 | ||||||||
| pg18beta1_o2nofp.cx10b_c8r32 | 89.694 | 10.306 | 0.043 | ||||||||
| pg18beta1_o2nofp.cx10c_c8r32 | 87.944 | 12.056 | 0.043 | ||||||||
| pg18beta1_o2nofp.cx10d_c8r32 | 88.894 | 11.106 | 0.044 |
Performance metrics for the DBMS listed above. Some are normalized by throughput, others are not. Legend for results is here.
ips	qps	rps	rmbps	wps	wmbps	rpq	rkbpq	wpi	wkbpi	csps	cpups	cspq	cpupq	dbgb1	dbgb2	rss	maxop	p50	p99	tag
500	516	7637	59.9	1616.8	18.8	14.814	119.029	3.234	38.478	17126	6.0	33.222	931	154.6	188.7	23.3	0.019	528	400	pg140_o2nofp.cx10a_c8r32
500	518	7682	60.3	1625.7	18.9	14.815	119.059	3.253	38.646	17221	5.7	33.214	880	154.6	189.1	23.3	0.008	528	416	pg1418_o2nofp.cx10a_c8r32
500	516	7676	60.3	1619.4	18.8	14.874	119.569	3.241	38.541	17144	5.7	33.218	884	154.6	189.0	23.3	0.009	528	400	pg150_o2nofp.cx10a_c8r32
500	516	7644	60.0	1626.9	18.9	14.829	119.160	3.256	38.653	17069	5.7	33.112	885	154.6	189.0	23.3	0.008	528	416	pg1513_o2nofp.cx10a_c8r32
500	517	7652	60.1	1622.1	18.8	14.813	119.033	3.244	38.562	17083	5.9	33.069	914	154.6	189.1	23.3	0.008	528	416	pg160_o2nofp.cx10a_c8r32
500	516	7642	60.0	1641.1	19.0	14.813	119.054	3.282	38.870	17063	5.8	33.074	899	154.6	189.3	23.3	0.007	528	416	pg169_o2nofp.cx10a_c8r32
500	518	7665	60.2	1548.2	18.2	14.809	119.008	3.098	37.335	17093	5.6	33.024	865	154.6	186.8	23.4	0.008	528	416	pg170_o2nofp.cx10a_c8r32
500	518	7671	60.2	1547.0	18.2	14.806	118.980	3.096	37.329	17108	5.6	33.020	865	154.6	188.7	23.4	0.007	528	416	pg175_o2nofp.cx10a_c8r32
500	518	7669	60.2	1546.5	18.2	14.806	118.999	3.095	37.315	17105	5.7	33.022	880	154.6	188.7	23.4	0.007	528	416	pg18beta1_o2nofp.cx10b_c8r32
500	513	7640	59.9	1541.8	18.2	14.903	119.759	3.085	37.235	17023	5.7	33.209	890	154.6	188.3	23.4	0.008	528	416	pg18beta1_o2nofp.cx10c_c8r32
500	512	7599	59.6	1543.7	18.2	14.830	119.165	3.087	37.257	16941	6.0	33.063	937	154.6	188.8	23.4	0.008	528	416	pg18beta1_o2nofp.cx10d_c8r32
qr1000.L5
qr1000.L5: range queries with 1000 insert/s per client. Graphs for performance per 1-second interval are here.
Average throughput:
Query response time histogram: each cell has the percentage of responses that take <= the time in the header and max is the max response time in seconds. For max values in the top 25% of the range have a red background and in the bottom 25% of the range have a green background. The red background is not used when the min value is within 80% of the max value.
| dbms | 256us | 1ms | 4ms | 16ms | 64ms | 256ms | 1s | 4s | 16s | gt | max |
|---|---|---|---|---|---|---|---|---|---|---|---|
| pg140_o2nofp.cx10a_c8r32 | 99.944 | 0.052 | 0.002 | 0.001 | nonzero | nonzero | 0.098 | ||||
| pg1418_o2nofp.cx10a_c8r32 | 99.949 | 0.047 | 0.003 | 0.001 | nonzero | nonzero | 0.101 | ||||
| pg150_o2nofp.cx10a_c8r32 | 99.950 | 0.046 | 0.003 | 0.001 | nonzero | nonzero | 0.088 | ||||
| pg1513_o2nofp.cx10a_c8r32 | 99.946 | 0.050 | 0.003 | 0.002 | nonzero | nonzero | 0.089 | ||||
| pg160_o2nofp.cx10a_c8r32 | 99.949 | 0.047 | 0.003 | 0.001 | nonzero | nonzero | 0.085 | ||||
| pg169_o2nofp.cx10a_c8r32 | 99.947 | 0.049 | 0.003 | 0.001 | nonzero | nonzero | 0.090 | ||||
| pg170_o2nofp.cx10a_c8r32 | 99.953 | 0.044 | 0.003 | 0.001 | nonzero | nonzero | 0.091 | ||||
| pg175_o2nofp.cx10a_c8r32 | 99.955 | 0.041 | 0.002 | 0.001 | nonzero | nonzero | 0.096 | ||||
| pg18beta1_o2nofp.cx10b_c8r32 | 99.950 | 0.046 | 0.003 | 0.001 | nonzero | nonzero | 0.091 | ||||
| pg18beta1_o2nofp.cx10c_c8r32 | 99.949 | 0.047 | 0.003 | 0.001 | nonzero | nonzero | 0.091 | ||||
| pg18beta1_o2nofp.cx10d_c8r32 | 99.951 | 0.045 | 0.003 | 0.001 | nonzero | nonzero | 0.089 |
Insert response time histogram: each cell has the percentage of responses that take <= the time in the header and max is the max response time in seconds. For max values in the top 25% of the range have a red background and in the bottom 25% of the range have a green background. The red background is not used when the min value is within 80% of the max value.
| dbms | 256us | 1ms | 4ms | 16ms | 64ms | 256ms | 1s | 4s | 16s | gt | max |
|---|---|---|---|---|---|---|---|---|---|---|---|
| pg140_o2nofp.cx10a_c8r32 | 96.631 | 3.369 | 0.025 | ||||||||
| pg1418_o2nofp.cx10a_c8r32 | 96.864 | 3.136 | 0.023 | ||||||||
| pg150_o2nofp.cx10a_c8r32 | 96.750 | 3.250 | 0.023 | ||||||||
| pg1513_o2nofp.cx10a_c8r32 | 96.783 | 3.217 | 0.023 | ||||||||
| pg160_o2nofp.cx10a_c8r32 | 97.022 | 2.978 | 0.023 | ||||||||
| pg169_o2nofp.cx10a_c8r32 | 96.897 | 3.103 | 0.023 | ||||||||
| pg170_o2nofp.cx10a_c8r32 | 96.956 | 3.044 | 0.022 | ||||||||
| pg175_o2nofp.cx10a_c8r32 | 96.619 | 3.381 | 0.022 | ||||||||
| pg18beta1_o2nofp.cx10b_c8r32 | 97.022 | 2.978 | 0.022 | ||||||||
| pg18beta1_o2nofp.cx10c_c8r32 | 96.753 | 3.247 | 0.028 | ||||||||
| pg18beta1_o2nofp.cx10d_c8r32 | 97.064 | 2.936 | 0.022 |
Delete response time histogram: each cell has the percentage of responses that take <= the time in the header and max is the max response time in seconds. For max values in the top 25% of the range have a red background and in the bottom 25% of the range have a green background. The red background is not used when the min value is within 80% of the max value.
| dbms | 256us | 1ms | 4ms | 16ms | 64ms | 256ms | 1s | 4s | 16s | gt | max |
|---|---|---|---|---|---|---|---|---|---|---|---|
| pg140_o2nofp.cx10a_c8r32 | 22.044 | 77.956 | 0.063 | ||||||||
| pg1418_o2nofp.cx10a_c8r32 | 24.975 | 75.022 | 0.003 | 0.064 | |||||||
| pg150_o2nofp.cx10a_c8r32 | 15.197 | 84.803 | 0.064 | ||||||||
| pg1513_o2nofp.cx10a_c8r32 | 16.161 | 83.839 | 0.063 | ||||||||
| pg160_o2nofp.cx10a_c8r32 | 11.361 | 88.639 | 0.063 | ||||||||
| pg169_o2nofp.cx10a_c8r32 | 14.219 | 85.781 | 0.064 | ||||||||
| pg170_o2nofp.cx10a_c8r32 | 4.267 | 95.733 | 0.061 | ||||||||
| pg175_o2nofp.cx10a_c8r32 | 8.806 | 91.194 | 0.062 | ||||||||
| pg18beta1_o2nofp.cx10b_c8r32 | 4.936 | 95.061 | 0.003 | 0.065 | |||||||
| pg18beta1_o2nofp.cx10c_c8r32 | 8.806 | 91.192 | 0.003 | 0.066 | |||||||
| pg18beta1_o2nofp.cx10d_c8r32 | 4.400 | 95.597 | 0.003 | 0.066 |
Performance metrics for the DBMS listed above. Some are normalized by throughput, others are not. Legend for results is here.
ips	qps	rps	rmbps	wps	wmbps	rpq	rkbpq	wpi	wkbpi	csps	cpups	cspq	cpupq	dbgb1	dbgb2	rss	maxop	p50	p99	tag
999	12356	1489	11.9	895.5	18.4	0.120	0.990	0.896	18.883	50560	18.6	4.092	120	154.8	187.8	23.3	0.098	12366	11630	pg140_o2nofp.cx10a_c8r32
999	12239	1488	11.9	880.8	18.2	0.122	0.999	0.882	18.703	50137	18.4	4.097	120	154.8	188.2	23.3	0.101	12254	11486	pg1418_o2nofp.cx10a_c8r32
999	12308	1488	11.9	886.1	18.3	0.121	0.993	0.887	18.775	50365	18.7	4.092	122	154.8	188.1	23.3	0.088	12318	11598	pg150_o2nofp.cx10a_c8r32
999	12035	1489	11.9	875.9	18.2	0.124	1.016	0.877	18.640	49321	18.7	4.098	124	154.8	188.1	23.3	0.089	12062	11278	pg1513_o2nofp.cx10a_c8r32
999	12212	1488	11.9	884.0	18.3	0.122	1.001	0.885	18.739	49975	19.0	4.092	124	154.8	188.2	23.3	0.085	12222	11391	pg160_o2nofp.cx10a_c8r32
999	11989	1488	11.9	863.0	18.0	0.124	1.019	0.864	18.455	49114	18.8	4.097	125	154.8	188.4	23.3	0.090	12014	11182	pg169_o2nofp.cx10a_c8r32
999	12017	1488	11.9	951.0	19.2	0.124	1.017	0.952	19.693	49178	19.4	4.092	129	154.8	186.1	23.4	0.091	12030	11278	pg170_o2nofp.cx10a_c8r32
999	12081	1489	11.9	953.1	19.2	0.123	1.013	0.954	19.709	49400	19.2	4.089	127	154.8	187.8	23.4	0.096	12094	11295	pg175_o2nofp.cx10a_c8r32
999	11871	1490	12.0	950.7	19.2	0.125	1.031	0.952	19.707	48631	19.4	4.097	131	154.8	187.8	23.4	0.091	11886	11118	pg18beta1_o2nofp.cx10b_c8r32
999	11699	1488	11.9	953.2	19.3	0.127	1.045	0.954	19.732	47945	19.1	4.098	131	154.8	187.4	23.4	0.091	11710	10958	pg18beta1_o2nofp.cx10c_c8r32
999	11982	1488	11.9	952.1	19.2	0.124	1.020	0.953	19.713	49028	19.4	4.092	130	154.8	187.9	23.4	0.089	11998	11198	pg18beta1_o2nofp.cx10d_c8r32
qp1000.L6
qp1000.L6: point queries with 1000 insert/s per client. Graphs for performance per 1-second interval are here.
Average throughput:
Query response time histogram: each cell has the percentage of responses that take <= the time in the header and max is the max response time in seconds. For max values in the top 25% of the range have a red background and in the bottom 25% of the range have a green background. The red background is not used when the min value is within 80% of the max value.
| dbms | 256us | 1ms | 4ms | 16ms | 64ms | 256ms | 1s | 4s | 16s | gt | max |
|---|---|---|---|---|---|---|---|---|---|---|---|
| pg140_o2nofp.cx10a_c8r32 | 0.147 | 99.338 | 0.510 | 0.005 | 0.038 | ||||||
| pg1418_o2nofp.cx10a_c8r32 | 0.165 | 99.301 | 0.533 | 0.002 | 0.044 | ||||||
| pg150_o2nofp.cx10a_c8r32 | 0.151 | 98.887 | 0.959 | 0.003 | 0.042 | ||||||
| pg1513_o2nofp.cx10a_c8r32 | 0.148 | 98.841 | 1.008 | 0.003 | 0.038 | ||||||
| pg160_o2nofp.cx10a_c8r32 | 0.151 | 99.060 | 0.786 | 0.002 | 0.040 | ||||||
| pg169_o2nofp.cx10a_c8r32 | 0.147 | 98.849 | 1.001 | 0.003 | 0.039 | ||||||
| pg170_o2nofp.cx10a_c8r32 | 0.174 | 99.122 | 0.702 | 0.002 | 0.046 | ||||||
| pg175_o2nofp.cx10a_c8r32 | 0.172 | 99.156 | 0.669 | 0.002 | 0.044 | ||||||
| pg18beta1_o2nofp.cx10b_c8r32 | 0.164 | 99.071 | 0.763 | 0.002 | 0.042 | ||||||
| pg18beta1_o2nofp.cx10c_c8r32 | 0.145 | 99.022 | 0.831 | 0.002 | 0.043 | ||||||
| pg18beta1_o2nofp.cx10d_c8r32 | 0.154 | 99.005 | 0.838 | 0.002 | 0.043 |
Insert response time histogram: each cell has the percentage of responses that take <= the time in the header and max is the max response time in seconds. For max values in the top 25% of the range have a red background and in the bottom 25% of the range have a green background. The red background is not used when the min value is within 80% of the max value.
| dbms | 256us | 1ms | 4ms | 16ms | 64ms | 256ms | 1s | 4s | 16s | gt | max |
|---|---|---|---|---|---|---|---|---|---|---|---|
| pg140_o2nofp.cx10a_c8r32 | 98.978 | 1.022 | 0.052 | ||||||||
| pg1418_o2nofp.cx10a_c8r32 | 99.000 | 1.000 | 0.046 | ||||||||
| pg150_o2nofp.cx10a_c8r32 | 98.011 | 1.989 | 0.055 | ||||||||
| pg1513_o2nofp.cx10a_c8r32 | 97.792 | 2.208 | 0.051 | ||||||||
| pg160_o2nofp.cx10a_c8r32 | 98.269 | 1.731 | 0.052 | ||||||||
| pg169_o2nofp.cx10a_c8r32 | 97.911 | 2.089 | 0.051 | ||||||||
| pg170_o2nofp.cx10a_c8r32 | 98.939 | 1.061 | 0.058 | ||||||||
| pg175_o2nofp.cx10a_c8r32 | 98.964 | 1.036 | 0.053 | ||||||||
| pg18beta1_o2nofp.cx10b_c8r32 | 98.744 | 1.256 | 0.063 | ||||||||
| pg18beta1_o2nofp.cx10c_c8r32 | 98.575 | 1.425 | 0.054 | ||||||||
| pg18beta1_o2nofp.cx10d_c8r32 | 98.608 | 1.392 | 0.047 |
Delete response time histogram: each cell has the percentage of responses that take <= the time in the header and max is the max response time in seconds. For max values in the top 25% of the range have a red background and in the bottom 25% of the range have a green background. The red background is not used when the min value is within 80% of the max value.
| dbms | 256us | 1ms | 4ms | 16ms | 64ms | 256ms | 1s | 4s | 16s | gt | max |
|---|---|---|---|---|---|---|---|---|---|---|---|
| pg140_o2nofp.cx10a_c8r32 | 99.997 | 0.003 | 0.101 | ||||||||
| pg1418_o2nofp.cx10a_c8r32 | 99.997 | 0.003 | 0.103 | ||||||||
| pg150_o2nofp.cx10a_c8r32 | 99.997 | 0.003 | 0.104 | ||||||||
| pg1513_o2nofp.cx10a_c8r32 | 99.997 | 0.003 | 0.101 | ||||||||
| pg160_o2nofp.cx10a_c8r32 | 99.997 | 0.003 | 0.101 | ||||||||
| pg169_o2nofp.cx10a_c8r32 | 99.994 | 0.006 | 0.100 | ||||||||
| pg170_o2nofp.cx10a_c8r32 | 99.997 | 0.003 | 0.098 | ||||||||
| pg175_o2nofp.cx10a_c8r32 | 99.997 | 0.003 | 0.098 | ||||||||
| pg18beta1_o2nofp.cx10b_c8r32 | 99.997 | 0.003 | 0.106 | ||||||||
| pg18beta1_o2nofp.cx10c_c8r32 | 99.997 | 0.003 | 0.107 | ||||||||
| pg18beta1_o2nofp.cx10d_c8r32 | 99.997 | 0.003 | 0.105 |
Performance metrics for the DBMS listed above. Some are normalized by throughput, others are not. Legend for results is here.
ips	qps	rps	rmbps	wps	wmbps	rpq	rkbpq	wpi	wkbpi	csps	cpups	cspq	cpupq	dbgb1	dbgb2	rss	maxop	p50	p99	tag
999	480	8368	65.6	2770.3	34.9	17.440	140.100	2.774	35.767	18722	13.4	39.020	2234	155.0	192.3	23.3	0.038	496	352	pg140_o2nofp.cx10a_c8r32
999	482	8398	65.9	2785.3	34.9	17.424	139.974	2.789	35.769	18754	12.7	38.908	2108	155.0	192.5	23.3	0.044	496	352	pg1418_o2nofp.cx10a_c8r32
999	475	8330	65.4	2774.5	34.8	17.544	140.956	2.776	35.662	18539	13.2	39.046	2224	155.0	192.4	23.3	0.042	496	352	pg150_o2nofp.cx10a_c8r32
999	475	8308	65.2	2788.5	35.0	17.495	140.545	2.792	35.884	18484	13.1	38.922	2207	155.0	192.5	23.3	0.038	496	352	pg1513_o2nofp.cx10a_c8r32
999	477	8329	65.3	2777.4	34.8	17.458	140.243	2.779	35.640	18525	13.4	38.829	2247	155.0	192.4	23.3	0.040	496	352	pg160_o2nofp.cx10a_c8r32
999	475	8298	65.1	2801.8	35.0	17.480	140.456	2.803	35.877	18458	13.3	38.883	2241	155.0	192.6	23.3	0.039	480	368	pg169_o2nofp.cx10a_c8r32
999	481	8372	65.7	2720.0	34.7	17.413	139.891	2.722	35.514	18553	14.0	38.589	2329	155.0	190.9	23.4	0.046	496	352	pg170_o2nofp.cx10a_c8r32
999	481	8382	65.8	2711.0	33.7	17.418	139.922	2.713	34.493	18572	13.8	38.596	2294	155.0	190.9	23.4	0.044	496	368	pg175_o2nofp.cx10a_c8r32
999	478	8338	65.4	2710.8	33.6	17.448	140.180	2.712	34.465	18465	14.3	38.639	2394	155.0	190.9	23.4	0.042	496	352	pg18beta1_o2nofp.cx10b_c8r32
999	473	8313	65.2	2710.3	33.7	17.578	141.222	2.714	34.556	18402	14.1	38.914	2385	155.0	190.6	23.4	0.043	480	352	pg18beta1_o2nofp.cx10c_c8r32
999	473	8283	65.0	2708.4	33.5	17.508	140.637	2.712	34.334	18341	14.3	38.768	2418	155.0	190.7	23.4	0.043	480	352	pg18beta1_o2nofp.cx10d_c8r32
l.i0
l.i0: load without secondary indexes
Performance metrics for all DBMS, not just the ones listed above. Some are normalized by throughput, others are not. Legend for results is here.
ips	qps	rps	rmbps	wps	wmbps	rpq	rkbpq	wpi	wkbpi	csps	cpups	cspq	cpupq	dbgb1	dbgb2	rss	maxop	p50	p99	tag
142273	0	28	0.2	530.2	58.6	0.000	0.002	0.004	0.422	16737	20.5	0.118	12	76.5	116.6	20.0	0.037	142283	139380	pg140_o2nofp.cx10a_c8r32
138768	0	25	0.2	523.3	57.2	0.000	0.001	0.004	0.422	16284	20.0	0.117	12	76.5	116.6	7.6	0.060	138684	135981	pg1418_o2nofp.cx10a_c8r32
144639	0	27	0.2	541.9	59.5	0.000	0.001	0.004	0.421	17081	20.6	0.118	11	76.5	116.6	0.8	0.070	145680	124483	pg150_o2nofp.cx10a_c8r32
146762	0	28	0.2	549.6	60.3	0.000	0.002	0.004	0.421	17131	20.7	0.117	11	76.5	116.6	2.2	0.077	146783	143480	pg1513_o2nofp.cx10a_c8r32
144561	0	26	0.2	542.9	59.6	0.000	0.001	0.004	0.422	16865	20.6	0.117	11	76.5	116.6	18.9	0.061	144982	141281	pg160_o2nofp.cx10a_c8r32
143190	0	26	0.2	535.7	59.1	0.000	0.001	0.004	0.423	16710	20.4	0.117	11	76.5	116.6	18.1	0.048	143672	140380	pg169_o2nofp.cx10a_c8r32
143756	0	25	0.2	539.0	59.5	0.000	0.001	0.004	0.424	14352	20.5	0.100	11	76.5	116.6	18.5	0.058	144284	140980	pg170_o2nofp.cx10a_c8r32
144613	0	25	0.2	540.5	59.4	0.000	0.001	0.004	0.421	14417	20.5	0.100	11	76.5	116.6	18.2	0.072	145480	140883	pg175_o2nofp.cx10a_c8r32
144404	0	25	0.2	539.0	59.3	0.000	0.001	0.004	0.421	14394	20.4	0.100	11	76.5	116.6	18.4	0.040	145282	140780	pg18beta1_o2nofp.cx10b_c8r32
142857	0	24	0.2	532.2	58.5	0.000	0.001	0.004	0.419	14651	20.7	0.103	12	76.5	116.6	18.5	0.069	143081	132682	pg18beta1_o2nofp.cx10c_c8r32
144092	0	26	0.2	540.4	59.4	0.000	0.001	0.004	0.422	14461	20.5	0.100	11	76.5	116.6	18.9	0.047	144982	140681	pg18beta1_o2nofp.cx10d_c8r32
l.x
l.x: create secondary indexes
Performance metrics for all DBMS, not just the ones listed above. Some are normalized by throughput, others are not. Legend for results is here.
ips	qps	rps	rmbps	wps	wmbps	rpq	rkbpq	wpi	wkbpi	csps	cpups	cspq	cpupq	dbgb1	dbgb2	rss	maxop	p50	p99	tag
276052	0	731	90.6	841.6	100.9	0.003	0.336	0.003	0.374	367	12.9	0.001	4	153.6	193.7	23.4	0.004	NA	NA	pg140_o2nofp.cx10a_c8r32
280505	0	742	92.1	860.2	102.4	0.003	0.336	0.003	0.374	375	12.9	0.001	4	153.6	193.7	23.4	0.005	NA	NA	pg1418_o2nofp.cx10a_c8r32
303030	0	834	101.9	958.8	113.2	0.003	0.344	0.003	0.383	425	12.9	0.001	3	153.6	193.7	23.4	0.003	NA	NA	pg150_o2nofp.cx10a_c8r32
303030	0	824	102.1	955.3	113.2	0.003	0.345	0.003	0.382	451	12.9	0.001	3	153.6	193.7	23.4	0.002	NA	NA	pg1513_o2nofp.cx10a_c8r32
304646	0	826	102.6	958.7	114.0	0.003	0.345	0.003	0.383	454	12.9	0.001	3	153.6	193.7	23.5	0.004	NA	NA	pg160_o2nofp.cx10a_c8r32
303490	0	823	102.2	956.0	113.7	0.003	0.345	0.003	0.384	447	12.9	0.001	3	153.6	193.7	23.5	0.003	NA	NA	pg169_o2nofp.cx10a_c8r32
305927	0	828	102.9	968.2	114.0	0.003	0.344	0.003	0.382	353	13.0	0.001	3	153.6	193.7	23.4	0.002	NA	NA	pg170_o2nofp.cx10a_c8r32
313357	0	849	105.5	998.0	116.9	0.003	0.345	0.003	0.382	474	12.9	0.002	3	153.6	193.7	23.4	0.004	NA	NA	pg175_o2nofp.cx10a_c8r32
314465	0	852	105.9	1001.6	117.1	0.003	0.345	0.003	0.381	449	13.0	0.001	3	153.6	193.7	23.4	0.005	NA	NA	pg18beta1_o2nofp.cx10b_c8r32
320384	0	868	107.8	1010.4	119.7	0.003	0.345	0.003	0.382	1270	13.4	0.004	3	153.6	193.7	23.4	0.003	NA	NA	pg18beta1_o2nofp.cx10c_c8r32
312867	0	848	105.3	996.8	116.8	0.003	0.345	0.003	0.382	999	13.4	0.003	3	153.6	193.7	23.4	0.003	NA	NA	pg18beta1_o2nofp.cx10d_c8r32
l.i1
l.i1: continue load after secondary indexes created with 50 inserts per transaction
Performance metrics for all DBMS, not just the ones listed above. Some are normalized by throughput, others are not. Legend for results is here.
ips	qps	rps	rmbps	wps	wmbps	rpq	rkbpq	wpi	wkbpi	csps	cpups	cspq	cpupq	dbgb1	dbgb2	rss	maxop	p50	p99	tag
3475	0	4990	39.5	4123.4	70.5	1.436	11.634	1.187	20.774	11453	15.6	3.296	359	154.3	194.3	23.0	0.072	3300	2100	pg140_o2nofp.cx10a_c8r32
3445	0	4950	39.2	4086.5	69.8	1.437	11.646	1.186	20.748	11340	15.5	3.292	360	154.3	194.3	23.0	0.050	3299	2000	pg1418_o2nofp.cx10a_c8r32
3271	0	4704	37.2	3908.6	66.8	1.438	11.661	1.195	20.928	10748	15.4	3.286	377	154.3	194.3	22.8	0.050	3100	1900	pg150_o2nofp.cx10a_c8r32
3370	0	4845	38.4	4031.3	69.0	1.438	11.656	1.196	20.959	11042	15.4	3.277	366	154.3	194.3	22.8	0.053	3000	2050	pg1513_o2nofp.cx10a_c8r32
3292	0	4727	37.4	3902.8	66.7	1.436	11.638	1.185	20.750	10790	15.3	3.277	372	154.3	194.3	23.0	0.055	2900	1800	pg160_o2nofp.cx10a_c8r32
3358	0	4824	38.2	3965.5	67.7	1.436	11.642	1.181	20.634	11044	15.5	3.288	369	154.3	194.3	23.1	0.052	2950	1800	pg169_o2nofp.cx10a_c8r32
3033	0	4362	34.5	3597.8	61.4	1.438	11.660	1.186	20.735	9844	15.1	3.246	398	154.3	194.3	22.9	0.050	2650	1750	pg170_o2nofp.cx10a_c8r32
3170	0	4558	36.1	3791.7	64.9	1.438	11.659	1.196	20.968	10262	15.0	3.238	379	154.3	194.3	22.7	0.058	2650	1850	pg175_o2nofp.cx10a_c8r32
3021	0	4347	34.4	3622.3	62.0	1.439	11.667	1.199	21.008	9796	14.9	3.243	395	154.3	194.3	22.9	0.059	2600	1550	pg18beta1_o2nofp.cx10b_c8r32
3108	0	4469	35.4	3721.0	63.9	1.438	11.657	1.197	21.068	10063	15.0	3.238	386	154.3	194.3	23.0	0.054	2749	1750	pg18beta1_o2nofp.cx10c_c8r32
3142	0	4519	35.8	3742.2	63.9	1.438	11.654	1.191	20.827	10167	14.9	3.236	379	154.3	194.3	22.9	0.055	2600	1800	pg18beta1_o2nofp.cx10d_c8r32
l.i2
l.i2: continue load after secondary indexes created with 5 inserts per transaction
Performance metrics for all DBMS, not just the ones listed above. Some are normalized by throughput, others are not. Legend for results is here.
ips	qps	rps	rmbps	wps	wmbps	rpq	rkbpq	wpi	wkbpi	csps	cpups	cspq	cpupq	dbgb1	dbgb2	rss	maxop	p50	p99	tag
186	0	203	2.1	547.0	8.6	1.095	11.643	2.944	47.192	1451	13.1	7.810	5640	154.5	194.5	3.1	0.035	185	160	pg140_o2nofp.cx10a_c8r32
185	0	199	1.6	535.3	7.3	1.072	8.766	2.889	40.575	1426	13.1	7.697	5656	154.5	194.5	23.3	0.023	185	160	pg1418_o2nofp.cx10a_c8r32
176	0	188	1.5	506.6	7.0	1.072	8.763	2.887	41.073	1297	12.9	7.391	5880	154.4	194.5	23.3	0.021	175	140	pg150_o2nofp.cx10a_c8r32
174	0	186	1.5	500.9	7.0	1.073	8.779	2.884	41.118	1304	12.9	7.505	5941	154.4	194.5	23.3	0.023	175	145	pg1513_o2nofp.cx10a_c8r32
176	0	189	1.5	509.0	7.1	1.073	8.775	2.887	41.104	1314	12.9	7.456	5854	154.4	194.5	23.3	0.033	175	145	pg160_o2nofp.cx10a_c8r32
165	0	177	1.4	487.1	6.8	1.072	8.768	2.945	41.798	1246	12.9	7.531	6239	154.4	194.5	23.3	0.032	165	135	pg169_o2nofp.cx10a_c8r32
158	0	169	1.4	463.9	6.5	1.071	8.759	2.933	41.859	1090	12.8	6.893	6473	154.4	191.7	23.4	0.037	160	130	pg170_o2nofp.cx10a_c8r32
161	0	172	1.4	471.0	6.6	1.072	8.770	2.929	41.733	1109	12.8	6.898	6368	154.4	194.5	23.4	0.025	160	135	pg175_o2nofp.cx10a_c8r32
158	0	170	1.4	465.6	6.5	1.072	8.768	2.939	41.885	1084	12.8	6.841	6465	154.4	191.4	23.4	0.027	160	125	pg18beta1_o2nofp.cx10b_c8r32
154	0	164	1.3	450.5	6.3	1.072	8.761	2.935	41.769	1061	12.8	6.912	6671	154.5	191.4	23.3	0.036	155	120	pg18beta1_o2nofp.cx10c_c8r32
158	0	169	1.3	465.3	6.5	1.072	8.764	2.951	42.065	1086	12.8	6.885	6493	154.4	191.6	23.4	0.022	155	125	pg18beta1_o2nofp.cx10d_c8r32
qr100.L1
qr100.L1: range queries with 100 insert/s per client
Performance metrics for all DBMS, not just the ones listed above. Some are normalized by throughput, others are not. Legend for results is here.
ips	qps	rps	rmbps	wps	wmbps	rpq	rkbpq	wpi	wkbpi	csps	cpups	cspq	cpupq	dbgb1	dbgb2	rss	maxop	p50	p99	tag
100	14541	112	0.9	48.5	1.7	0.008	0.066	0.485	17.778	55824	12.4	3.839	68	154.5	192.5	23.3	0.009	14526	14254	pg140_o2nofp.cx10a_c8r32
100	14471	112	0.9	45.4	1.7	0.008	0.066	0.454	17.504	55549	12.5	3.839	69	154.5	192.2	23.3	0.010	14478	14238	pg1418_o2nofp.cx10a_c8r32
100	14637	111	0.9	44.9	1.7	0.008	0.065	0.449	17.424	56121	12.4	3.834	68	154.5	191.7	23.3	0.010	14622	14446	pg150_o2nofp.cx10a_c8r32
100	14389	111	0.9	42.1	1.7	0.008	0.066	0.421	17.188	55176	12.5	3.835	69	154.5	191.7	23.3	0.009	14398	14126	pg1513_o2nofp.cx10a_c8r32
100	14576	111	0.9	44.0	1.7	0.008	0.065	0.440	17.360	55919	12.4	3.836	68	154.5	192.4	23.3	0.009	14574	14302	pg160_o2nofp.cx10a_c8r32
100	14266	112	0.9	39.5	1.7	0.008	0.067	0.395	16.972	54739	12.6	3.837	71	154.5	193.3	23.3	0.010	14254	14030	pg169_o2nofp.cx10a_c8r32
100	14540	112	0.9	64.4	1.9	0.008	0.066	0.644	19.202	55740	12.6	3.834	69	154.5	190.7	23.4	0.009	14558	14286	pg170_o2nofp.cx10a_c8r32
100	14660	112	0.9	64.7	1.9	0.008	0.065	0.647	19.241	56201	12.4	3.834	68	154.5	192.2	23.4	0.009	14654	14414	pg175_o2nofp.cx10a_c8r32
100	14343	111	0.9	65.3	1.9	0.008	0.065	0.653	19.290	55024	12.6	3.836	70	154.5	192.1	23.4	0.010	14334	14094	pg18beta1_o2nofp.cx10b_c8r32
100	14445	112	0.9	67.0	1.9	0.008	0.064	0.670	19.435	55381	12.5	3.834	69	154.5	189.9	23.4	0.010	14446	14174	pg18beta1_o2nofp.cx10c_c8r32
100	14446	111	0.9	66.3	1.9	0.008	0.064	0.664	19.391	55417	12.6	3.836	70	154.5	193.1	23.4	0.010	14430	14206	pg18beta1_o2nofp.cx10d_c8r32
qp100.L2
qp100.L2: point queries with 100 insert/s per client
Performance metrics for all DBMS, not just the ones listed above. Some are normalized by throughput, others are not. Legend for results is here.
ips	qps	rps	rmbps	wps	wmbps	rpq	rkbpq	wpi	wkbpi	csps	cpups	cspq	cpupq	dbgb1	dbgb2	rss	maxop	p50	p99	tag
100	529	6909	54.3	369.2	4.2	13.062	105.120	3.696	43.480	15624	4.0	29.540	605	154.5	192.5	23.3	0.021	544	368	pg140_o2nofp.cx10a_c8r32
100	536	6991	55.0	372.1	4.3	13.050	105.064	3.725	43.678	15804	3.7	29.502	553	154.5	192.3	23.3	0.008	560	368	pg1418_o2nofp.cx10a_c8r32
100	531	6952	54.7	368.4	4.2	13.103	105.522	3.688	43.356	15646	3.6	29.487	543	154.5	191.7	23.3	0.008	544	368	pg150_o2nofp.cx10a_c8r32
100	537	6999	55.0	371.7	4.3	13.043	105.003	3.717	43.576	15752	3.7	29.354	552	154.5	191.7	23.3	0.007	560	368	pg1513_o2nofp.cx10a_c8r32
100	531	6935	54.5	369.3	4.2	13.055	105.082	3.697	43.430	15611	3.7	29.388	557	154.5	192.4	23.3	0.008	560	352	pg160_o2nofp.cx10a_c8r32
100	526	6876	54.1	373.9	4.3	13.060	105.152	3.743	43.798	15478	3.7	29.397	562	154.5	193.3	23.3	0.008	544	352	pg169_o2nofp.cx10a_c8r32
100	534	6962	54.7	346.4	4.1	13.038	104.959	3.464	41.574	15666	3.7	29.337	554	154.5	190.7	23.4	0.011	560	368	pg170_o2nofp.cx10a_c8r32
100	532	6939	54.6	345.9	4.1	13.046	105.026	3.459	41.571	15612	3.6	29.351	541	154.5	192.3	23.4	0.007	560	368	pg175_o2nofp.cx10a_c8r32
100	534	6957	54.7	345.6	4.1	13.037	104.962	3.456	41.526	15655	3.7	29.339	555	154.5	192.1	23.4	0.008	560	368	pg18beta1_o2nofp.cx10b_c8r32
100	529	6938	54.5	343.9	4.0	13.106	105.501	3.439	41.408	15603	3.7	29.473	559	154.5	189.9	23.4	0.007	560	352	pg18beta1_o2nofp.cx10c_c8r32
100	530	6911	54.3	344.3	4.0	13.043	104.957	3.443	41.452	15550	3.7	29.346	559	154.5	193.1	23.4	0.007	560	352	pg18beta1_o2nofp.cx10d_c8r32
qr500.L3
qr500.L3: range queries with 500 insert/s per client
Performance metrics for all DBMS, not just the ones listed above. Some are normalized by throughput, others are not. Legend for results is here.
ips	qps	rps	rmbps	wps	wmbps	rpq	rkbpq	wpi	wkbpi	csps	cpups	cspq	cpupq	dbgb1	dbgb2	rss	maxop	p50	p99	tag
500	13850	869	6.9	282.7	8.6	0.063	0.512	0.565	17.631	54779	13.6	3.955	79	154.6	190.1	23.3	0.017	13854	13342	pg140_o2nofp.cx10a_c8r32
500	13795	869	6.9	276.6	8.5	0.063	0.514	0.553	17.463	54567	13.6	3.955	79	154.6	190.4	23.3	0.033	13806	13294	pg1418_o2nofp.cx10a_c8r32
500	13940	869	6.9	277.3	8.5	0.062	0.509	0.555	17.519	55126	13.6	3.955	78	154.6	190.3	23.3	0.042	13950	13421	pg150_o2nofp.cx10a_c8r32
500	13846	868	6.9	271.2	8.5	0.063	0.512	0.542	17.340	54724	13.6	3.952	79	154.6	190.3	23.3	0.031	13839	13326	pg1513_o2nofp.cx10a_c8r32
500	13997	870	6.9	274.8	8.5	0.062	0.507	0.550	17.458	55329	13.6	3.953	78	154.6	190.5	23.3	0.045	14014	13438	pg160_o2nofp.cx10a_c8r32
500	13524	870	6.9	257.8	8.3	0.064	0.524	0.516	17.073	53497	13.7	3.956	81	154.6	190.9	23.3	0.033	13534	12990	pg169_o2nofp.cx10a_c8r32
500	13837	868	6.9	345.2	9.3	0.063	0.512	0.691	19.074	54688	13.7	3.952	79	154.6	188.3	23.4	0.020	13854	13326	pg170_o2nofp.cx10a_c8r32
500	13906	869	6.9	345.5	9.3	0.062	0.510	0.691	19.081	54947	13.7	3.951	79	154.6	190.4	23.4	0.025	13934	13422	pg175_o2nofp.cx10a_c8r32
500	13556	869	6.9	347.2	9.3	0.064	0.524	0.694	19.110	53588	13.7	3.953	81	154.6	190.3	23.4	0.032	13582	13038	pg18beta1_o2nofp.cx10b_c8r32
500	13466	868	6.9	350.6	9.4	0.064	0.526	0.702	19.202	53269	13.7	3.956	81	154.6	190.0	23.4	0.025	13470	12958	pg18beta1_o2nofp.cx10c_c8r32
500	13708	869	6.9	349.7	9.4	0.063	0.518	0.699	19.171	54168	13.8	3.951	81	154.6	190.7	23.4	0.036	13710	13166	pg18beta1_o2nofp.cx10d_c8r32
qp500.L4
qp500.L4: point queries with 500 insert/s per client
Performance metrics for all DBMS, not just the ones listed above. Some are normalized by throughput, others are not. Legend for results is here.
ips	qps	rps	rmbps	wps	wmbps	rpq	rkbpq	wpi	wkbpi	csps	cpups	cspq	cpupq	dbgb1	dbgb2	rss	maxop	p50	p99	tag
500	516	7637	59.9	1616.8	18.8	14.814	119.029	3.234	38.478	17126	6.0	33.222	931	154.6	188.7	23.3	0.019	528	400	pg140_o2nofp.cx10a_c8r32
500	518	7682	60.3	1625.7	18.9	14.815	119.059	3.253	38.646	17221	5.7	33.214	880	154.6	189.1	23.3	0.008	528	416	pg1418_o2nofp.cx10a_c8r32
500	516	7676	60.3	1619.4	18.8	14.874	119.569	3.241	38.541	17144	5.7	33.218	884	154.6	189.0	23.3	0.009	528	400	pg150_o2nofp.cx10a_c8r32
500	516	7644	60.0	1626.9	18.9	14.829	119.160	3.256	38.653	17069	5.7	33.112	885	154.6	189.0	23.3	0.008	528	416	pg1513_o2nofp.cx10a_c8r32
500	517	7652	60.1	1622.1	18.8	14.813	119.033	3.244	38.562	17083	5.9	33.069	914	154.6	189.1	23.3	0.008	528	416	pg160_o2nofp.cx10a_c8r32
500	516	7642	60.0	1641.1	19.0	14.813	119.054	3.282	38.870	17063	5.8	33.074	899	154.6	189.3	23.3	0.007	528	416	pg169_o2nofp.cx10a_c8r32
500	518	7665	60.2	1548.2	18.2	14.809	119.008	3.098	37.335	17093	5.6	33.024	865	154.6	186.8	23.4	0.008	528	416	pg170_o2nofp.cx10a_c8r32
500	518	7671	60.2	1547.0	18.2	14.806	118.980	3.096	37.329	17108	5.6	33.020	865	154.6	188.7	23.4	0.007	528	416	pg175_o2nofp.cx10a_c8r32
500	518	7669	60.2	1546.5	18.2	14.806	118.999	3.095	37.315	17105	5.7	33.022	880	154.6	188.7	23.4	0.007	528	416	pg18beta1_o2nofp.cx10b_c8r32
500	513	7640	59.9	1541.8	18.2	14.903	119.759	3.085	37.235	17023	5.7	33.209	890	154.6	188.3	23.4	0.008	528	416	pg18beta1_o2nofp.cx10c_c8r32
500	512	7599	59.6	1543.7	18.2	14.830	119.165	3.087	37.257	16941	6.0	33.063	937	154.6	188.8	23.4	0.008	528	416	pg18beta1_o2nofp.cx10d_c8r32
qr1000.L5
qr1000.L5: range queries with 1000 insert/s per client
Performance metrics for all DBMS, not just the ones listed above. Some are normalized by throughput, others are not. Legend for results is here.
ips	qps	rps	rmbps	wps	wmbps	rpq	rkbpq	wpi	wkbpi	csps	cpups	cspq	cpupq	dbgb1	dbgb2	rss	maxop	p50	p99	tag
999	12356	1489	11.9	895.5	18.4	0.120	0.990	0.896	18.883	50560	18.6	4.092	120	154.8	187.8	23.3	0.098	12366	11630	pg140_o2nofp.cx10a_c8r32
999	12239	1488	11.9	880.8	18.2	0.122	0.999	0.882	18.703	50137	18.4	4.097	120	154.8	188.2	23.3	0.101	12254	11486	pg1418_o2nofp.cx10a_c8r32
999	12308	1488	11.9	886.1	18.3	0.121	0.993	0.887	18.775	50365	18.7	4.092	122	154.8	188.1	23.3	0.088	12318	11598	pg150_o2nofp.cx10a_c8r32
999	12035	1489	11.9	875.9	18.2	0.124	1.016	0.877	18.640	49321	18.7	4.098	124	154.8	188.1	23.3	0.089	12062	11278	pg1513_o2nofp.cx10a_c8r32
999	12212	1488	11.9	884.0	18.3	0.122	1.001	0.885	18.739	49975	19.0	4.092	124	154.8	188.2	23.3	0.085	12222	11391	pg160_o2nofp.cx10a_c8r32
999	11989	1488	11.9	863.0	18.0	0.124	1.019	0.864	18.455	49114	18.8	4.097	125	154.8	188.4	23.3	0.090	12014	11182	pg169_o2nofp.cx10a_c8r32
999	12017	1488	11.9	951.0	19.2	0.124	1.017	0.952	19.693	49178	19.4	4.092	129	154.8	186.1	23.4	0.091	12030	11278	pg170_o2nofp.cx10a_c8r32
999	12081	1489	11.9	953.1	19.2	0.123	1.013	0.954	19.709	49400	19.2	4.089	127	154.8	187.8	23.4	0.096	12094	11295	pg175_o2nofp.cx10a_c8r32
999	11871	1490	12.0	950.7	19.2	0.125	1.031	0.952	19.707	48631	19.4	4.097	131	154.8	187.8	23.4	0.091	11886	11118	pg18beta1_o2nofp.cx10b_c8r32
999	11699	1488	11.9	953.2	19.3	0.127	1.045	0.954	19.732	47945	19.1	4.098	131	154.8	187.4	23.4	0.091	11710	10958	pg18beta1_o2nofp.cx10c_c8r32
999	11982	1488	11.9	952.1	19.2	0.124	1.020	0.953	19.713	49028	19.4	4.092	130	154.8	187.9	23.4	0.089	11998	11198	pg18beta1_o2nofp.cx10d_c8r32
qp1000.L6
qp1000.L6: point queries with 1000 insert/s per client
Performance metrics for all DBMS, not just the ones listed above. Some are normalized by throughput, others are not. Legend for results is here.
ips	qps	rps	rmbps	wps	wmbps	rpq	rkbpq	wpi	wkbpi	csps	cpups	cspq	cpupq	dbgb1	dbgb2	rss	maxop	p50	p99	tag
999	480	8368	65.6	2770.3	34.9	17.440	140.100	2.774	35.767	18722	13.4	39.020	2234	155.0	192.3	23.3	0.038	496	352	pg140_o2nofp.cx10a_c8r32
999	482	8398	65.9	2785.3	34.9	17.424	139.974	2.789	35.769	18754	12.7	38.908	2108	155.0	192.5	23.3	0.044	496	352	pg1418_o2nofp.cx10a_c8r32
999	475	8330	65.4	2774.5	34.8	17.544	140.956	2.776	35.662	18539	13.2	39.046	2224	155.0	192.4	23.3	0.042	496	352	pg150_o2nofp.cx10a_c8r32
999	475	8308	65.2	2788.5	35.0	17.495	140.545	2.792	35.884	18484	13.1	38.922	2207	155.0	192.5	23.3	0.038	496	352	pg1513_o2nofp.cx10a_c8r32
999	477	8329	65.3	2777.4	34.8	17.458	140.243	2.779	35.640	18525	13.4	38.829	2247	155.0	192.4	23.3	0.040	496	352	pg160_o2nofp.cx10a_c8r32
999	475	8298	65.1	2801.8	35.0	17.480	140.456	2.803	35.877	18458	13.3	38.883	2241	155.0	192.6	23.3	0.039	480	368	pg169_o2nofp.cx10a_c8r32
999	481	8372	65.7	2720.0	34.7	17.413	139.891	2.722	35.514	18553	14.0	38.589	2329	155.0	190.9	23.4	0.046	496	352	pg170_o2nofp.cx10a_c8r32
999	481	8382	65.8	2711.0	33.7	17.418	139.922	2.713	34.493	18572	13.8	38.596	2294	155.0	190.9	23.4	0.044	496	368	pg175_o2nofp.cx10a_c8r32
999	478	8338	65.4	2710.8	33.6	17.448	140.180	2.712	34.465	18465	14.3	38.639	2394	155.0	190.9	23.4	0.042	496	352	pg18beta1_o2nofp.cx10b_c8r32
999	473	8313	65.2	2710.3	33.7	17.578	141.222	2.714	34.556	18402	14.1	38.914	2385	155.0	190.6	23.4	0.043	480	352	pg18beta1_o2nofp.cx10c_c8r32
999	473	8283	65.0	2708.4	33.5	17.508	140.637	2.712	34.334	18341	14.3	38.768	2418	155.0	190.7	23.4	0.043	480	352	pg18beta1_o2nofp.cx10d_c8r32
l.i0
- l.i0: load without secondary indexes
- Legend for results is here.
- Each entry lists the percentage of responses that fit in that bucket (slower than max time for previous bucket, faster than min time for next bucket).
Insert response time histogram
256us	1ms	4ms	16ms	64ms	256ms	1s	4s	16s	gt	max	tag
0.000	99.963	0.032	0.005	0.001	0.000	0.000	0.000	0.000	0.000	0.037	pg140_o2nofp.cx10a_c8r32
0.000	99.967	0.028	0.005	0.001	0.000	0.000	0.000	0.000	0.000	0.060	pg1418_o2nofp.cx10a_c8r32
0.000	99.888	0.098	0.012	0.002	nonzero	0.000	0.000	0.000	0.000	0.070	pg150_o2nofp.cx10a_c8r32
0.000	99.973	0.023	0.003	0.002	nonzero	0.000	0.000	0.000	0.000	0.077	pg1513_o2nofp.cx10a_c8r32
0.000	99.972	0.023	0.003	0.002	0.000	0.000	0.000	0.000	0.000	0.061	pg160_o2nofp.cx10a_c8r32
0.000	99.967	0.027	0.004	0.002	0.000	0.000	0.000	0.000	0.000	0.048	pg169_o2nofp.cx10a_c8r32
0.000	99.970	0.024	0.004	0.003	0.000	0.000	0.000	0.000	0.000	0.058	pg170_o2nofp.cx10a_c8r32
0.000	99.974	0.021	0.003	0.001	nonzero	0.000	0.000	0.000	0.000	0.072	pg175_o2nofp.cx10a_c8r32
0.000	99.972	0.023	0.004	0.001	0.000	0.000	0.000	0.000	0.000	0.040	pg18beta1_o2nofp.cx10b_c8r32
0.000	99.837	0.155	0.006	0.002	nonzero	0.000	0.000	0.000	0.000	0.069	pg18beta1_o2nofp.cx10c_c8r32
0.000	99.968	0.026	0.005	0.001	0.000	0.000	0.000	0.000	0.000	0.047	pg18beta1_o2nofp.cx10d_c8r32
l.x
- l.x: create secondary indexes
- Legend for results is here.
- Each entry lists the percentage of responses that fit in that bucket (slower than max time for previous bucket, faster than min time for next bucket).
TODO - determine whether there is data for create index response time
l.i1
- l.i1: continue load after secondary indexes created with 50 inserts per transaction
- Legend for results is here.
- Each entry lists the percentage of responses that fit in that bucket (slower than max time for previous bucket, faster than min time for next bucket).
Insert response time histogram
256us	1ms	4ms	16ms	64ms	256ms	1s	4s	16s	gt	max	tag
0.000	0.000	0.000	98.296	1.702	0.001	0.000	0.000	0.000	0.000	0.072	pg140_o2nofp.cx10a_c8r32
0.000	0.000	0.000	98.259	1.741	0.000	0.000	0.000	0.000	0.000	0.050	pg1418_o2nofp.cx10a_c8r32
0.000	0.000	0.000	98.394	1.606	0.000	0.000	0.000	0.000	0.000	0.050	pg150_o2nofp.cx10a_c8r32
0.000	0.000	0.000	98.338	1.663	0.000	0.000	0.000	0.000	0.000	0.053	pg1513_o2nofp.cx10a_c8r32
0.000	0.000	0.000	98.483	1.517	0.000	0.000	0.000	0.000	0.000	0.055	pg160_o2nofp.cx10a_c8r32
0.000	0.000	0.000	98.421	1.579	0.000	0.000	0.000	0.000	0.000	0.052	pg169_o2nofp.cx10a_c8r32
0.000	0.000	0.000	98.601	1.399	0.000	0.000	0.000	0.000	0.000	0.050	pg170_o2nofp.cx10a_c8r32
0.000	0.000	0.000	98.449	1.551	0.000	0.000	0.000	0.000	0.000	0.058	pg175_o2nofp.cx10a_c8r32
0.000	0.000	0.000	98.419	1.581	0.000	0.000	0.000	0.000	0.000	0.059	pg18beta1_o2nofp.cx10b_c8r32
0.000	0.000	0.000	98.323	1.678	0.000	0.000	0.000	0.000	0.000	0.054	pg18beta1_o2nofp.cx10c_c8r32
0.000	0.000	0.000	98.442	1.558	0.000	0.000	0.000	0.000	0.000	0.055	pg18beta1_o2nofp.cx10d_c8r32
Delete response time histogram
256us	1ms	4ms	16ms	64ms	256ms	1s	4s	16s	gt	max	tag
0.000	0.411	16.625	51.020	31.944	0.000	0.000	0.000	0.000	0.000	0.032	pg140_o2nofp.cx10a_c8r32
0.000	0.771	16.474	50.361	32.394	0.000	0.000	0.000	0.000	0.000	0.031	pg1418_o2nofp.cx10a_c8r32
0.000	0.424	15.363	48.509	35.705	0.000	0.000	0.000	0.000	0.000	0.029	pg150_o2nofp.cx10a_c8r32
0.000	0.419	15.585	45.519	38.477	0.000	0.000	0.000	0.000	0.000	0.030	pg1513_o2nofp.cx10a_c8r32
0.000	0.323	16.511	44.464	38.703	0.000	0.000	0.000	0.000	0.000	0.030	pg160_o2nofp.cx10a_c8r32
0.000	0.504	16.212	45.129	38.155	0.000	0.000	0.000	0.000	0.000	0.030	pg169_o2nofp.cx10a_c8r32
0.000	0.476	15.440	39.611	44.472	0.000	0.000	0.000	0.000	0.000	0.037	pg170_o2nofp.cx10a_c8r32
0.000	0.429	16.102	43.014	40.455	0.000	0.000	0.000	0.000	0.000	0.033	pg175_o2nofp.cx10a_c8r32
0.000	0.511	15.054	38.488	45.948	0.000	0.000	0.000	0.000	0.000	0.034	pg18beta1_o2nofp.cx10b_c8r32
0.000	1.014	14.866	41.444	42.676	0.000	0.000	0.000	0.000	0.000	0.033	pg18beta1_o2nofp.cx10c_c8r32
0.000	0.573	15.326	42.014	42.087	0.000	0.000	0.000	0.000	0.000	0.033	pg18beta1_o2nofp.cx10d_c8r32
l.i2
- l.i2: continue load after secondary indexes created with 5 inserts per transaction
- Legend for results is here.
- Each entry lists the percentage of responses that fit in that bucket (slower than max time for previous bucket, faster than min time for next bucket).
Insert response time histogram
256us	1ms	4ms	16ms	64ms	256ms	1s	4s	16s	gt	max	tag
0.000	6.990	92.678	0.323	0.009	0.000	0.000	0.000	0.000	0.000	0.035	pg140_o2nofp.cx10a_c8r32
0.000	6.926	92.741	0.329	0.004	0.000	0.000	0.000	0.000	0.000	0.023	pg1418_o2nofp.cx10a_c8r32
0.000	7.421	92.210	0.361	0.007	0.000	0.000	0.000	0.000	0.000	0.021	pg150_o2nofp.cx10a_c8r32
0.000	6.992	92.626	0.373	0.009	0.000	0.000	0.000	0.000	0.000	0.023	pg1513_o2nofp.cx10a_c8r32
0.000	7.101	92.616	0.275	0.008	0.000	0.000	0.000	0.000	0.000	0.033	pg160_o2nofp.cx10a_c8r32
0.000	6.834	92.853	0.304	0.008	0.000	0.000	0.000	0.000	0.000	0.032	pg169_o2nofp.cx10a_c8r32
0.000	11.276	88.670	0.050	0.003	0.000	0.000	0.000	0.000	0.000	0.037	pg170_o2nofp.cx10a_c8r32
0.000	10.545	89.403	0.048	0.004	0.000	0.000	0.000	0.000	0.000	0.025	pg175_o2nofp.cx10a_c8r32
0.000	9.489	90.456	0.052	0.003	0.000	0.000	0.000	0.000	0.000	0.027	pg18beta1_o2nofp.cx10b_c8r32
0.000	10.748	89.200	0.050	0.003	0.000	0.000	0.000	0.000	0.000	0.036	pg18beta1_o2nofp.cx10c_c8r32
0.000	10.649	89.303	0.047	0.002	0.000	0.000	0.000	0.000	0.000	0.022	pg18beta1_o2nofp.cx10d_c8r32
Delete response time histogram
256us	1ms	4ms	16ms	64ms	256ms	1s	4s	16s	gt	max	tag
0.000	0.000	0.000	0.000	99.999	0.001	0.000	0.000	0.000	0.000	0.099	pg140_o2nofp.cx10a_c8r32
0.000	0.000	0.000	0.000	99.999	0.001	0.000	0.000	0.000	0.000	0.100	pg1418_o2nofp.cx10a_c8r32
0.000	0.000	0.000	0.000	99.999	0.001	0.000	0.000	0.000	0.000	0.101	pg150_o2nofp.cx10a_c8r32
0.000	0.000	0.000	0.000	99.999	0.001	0.000	0.000	0.000	0.000	0.097	pg1513_o2nofp.cx10a_c8r32
0.000	0.000	0.000	0.000	99.999	0.001	0.000	0.000	0.000	0.000	0.098	pg160_o2nofp.cx10a_c8r32
0.000	0.000	0.000	0.000	99.999	0.001	0.000	0.000	0.000	0.000	0.098	pg169_o2nofp.cx10a_c8r32
0.000	0.000	0.000	0.000	99.999	0.001	0.000	0.000	0.000	0.000	0.097	pg170_o2nofp.cx10a_c8r32
0.000	0.000	0.000	0.000	99.999	0.001	0.000	0.000	0.000	0.000	0.097	pg175_o2nofp.cx10a_c8r32
0.000	0.000	0.000	0.000	99.999	0.001	0.000	0.000	0.000	0.000	0.101	pg18beta1_o2nofp.cx10b_c8r32
0.000	0.000	0.000	0.000	99.999	0.001	0.000	0.000	0.000	0.000	0.102	pg18beta1_o2nofp.cx10c_c8r32
0.000	0.000	0.000	0.000	99.999	0.001	0.000	0.000	0.000	0.000	0.104	pg18beta1_o2nofp.cx10d_c8r32
qr100.L1
- qr100.L1: range queries with 100 insert/s per client
- Legend for results is here.
- Each entry lists the percentage of responses that fit in that bucket (slower than max time for previous bucket, faster than min time for next bucket).
Query response time histogram
256us	1ms	4ms	16ms	64ms	256ms	1s	4s	16s	gt	max	tag
99.994	0.006	nonzero	nonzero	0.000	0.000	0.000	0.000	0.000	0.000	0.009	pg140_o2nofp.cx10a_c8r32
99.996	0.004	nonzero	nonzero	0.000	0.000	0.000	0.000	0.000	0.000	0.010	pg1418_o2nofp.cx10a_c8r32
99.996	0.003	nonzero	nonzero	0.000	0.000	0.000	0.000	0.000	0.000	0.010	pg150_o2nofp.cx10a_c8r32
99.996	0.004	nonzero	nonzero	0.000	0.000	0.000	0.000	0.000	0.000	0.009	pg1513_o2nofp.cx10a_c8r32
99.996	0.003	nonzero	nonzero	0.000	0.000	0.000	0.000	0.000	0.000	0.009	pg160_o2nofp.cx10a_c8r32
99.996	0.003	nonzero	nonzero	0.000	0.000	0.000	0.000	0.000	0.000	0.010	pg169_o2nofp.cx10a_c8r32
99.997	0.003	nonzero	nonzero	0.000	0.000	0.000	0.000	0.000	0.000	0.009	pg170_o2nofp.cx10a_c8r32
99.997	0.003	nonzero	nonzero	0.000	0.000	0.000	0.000	0.000	0.000	0.009	pg175_o2nofp.cx10a_c8r32
99.996	0.003	nonzero	nonzero	0.000	0.000	0.000	0.000	0.000	0.000	0.010	pg18beta1_o2nofp.cx10b_c8r32
99.996	0.003	nonzero	nonzero	0.000	0.000	0.000	0.000	0.000	0.000	0.010	pg18beta1_o2nofp.cx10c_c8r32
99.996	0.003	nonzero	nonzero	0.000	0.000	0.000	0.000	0.000	0.000	0.010	pg18beta1_o2nofp.cx10d_c8r32
Insert response time histogram
256us	1ms	4ms	16ms	64ms	256ms	1s	4s	16s	gt	max	tag
0.000	0.000	0.000	56.806	43.194	0.000	0.000	0.000	0.000	0.000	0.023	pg140_o2nofp.cx10a_c8r32
0.000	0.000	0.000	59.694	40.306	0.000	0.000	0.000	0.000	0.000	0.025	pg1418_o2nofp.cx10a_c8r32
0.000	0.000	0.000	56.083	43.917	0.000	0.000	0.000	0.000	0.000	0.025	pg150_o2nofp.cx10a_c8r32
0.000	0.000	0.000	55.361	44.639	0.000	0.000	0.000	0.000	0.000	0.025	pg1513_o2nofp.cx10a_c8r32
0.000	0.000	0.000	55.917	44.083	0.000	0.000	0.000	0.000	0.000	0.026	pg160_o2nofp.cx10a_c8r32
0.000	0.000	0.000	55.556	44.444	0.000	0.000	0.000	0.000	0.000	0.026	pg169_o2nofp.cx10a_c8r32
0.000	0.000	0.000	60.278	39.722	0.000	0.000	0.000	0.000	0.000	0.026	pg170_o2nofp.cx10a_c8r32
0.000	0.000	0.000	60.000	40.000	0.000	0.000	0.000	0.000	0.000	0.024	pg175_o2nofp.cx10a_c8r32
0.000	0.000	0.000	60.361	39.639	0.000	0.000	0.000	0.000	0.000	0.024	pg18beta1_o2nofp.cx10b_c8r32
0.000	0.000	0.000	60.889	39.111	0.000	0.000	0.000	0.000	0.000	0.026	pg18beta1_o2nofp.cx10c_c8r32
0.000	0.000	0.000	59.944	40.056	0.000	0.000	0.000	0.000	0.000	0.026	pg18beta1_o2nofp.cx10d_c8r32
Delete response time histogram
256us	1ms	4ms	16ms	64ms	256ms	1s	4s	16s	gt	max	tag
0.000	51.889	48.056	0.056	0.000	0.000	0.000	0.000	0.000	0.000	0.010	pg140_o2nofp.cx10a_c8r32
0.000	51.389	48.528	0.083	0.000	0.000	0.000	0.000	0.000	0.000	0.010	pg1418_o2nofp.cx10a_c8r32
0.000	50.333	49.556	0.111	0.000	0.000	0.000	0.000	0.000	0.000	0.010	pg150_o2nofp.cx10a_c8r32
0.000	53.667	46.250	0.083	0.000	0.000	0.000	0.000	0.000	0.000	0.010	pg1513_o2nofp.cx10a_c8r32
0.000	51.722	48.222	0.056	0.000	0.000	0.000	0.000	0.000	0.000	0.010	pg160_o2nofp.cx10a_c8r32
0.000	44.833	55.111	0.056	0.000	0.000	0.000	0.000	0.000	0.000	0.010	pg169_o2nofp.cx10a_c8r32
0.000	51.111	48.806	0.083	0.000	0.000	0.000	0.000	0.000	0.000	0.010	pg170_o2nofp.cx10a_c8r32
0.000	44.917	55.000	0.083	0.000	0.000	0.000	0.000	0.000	0.000	0.010	pg175_o2nofp.cx10a_c8r32
0.000	48.444	51.500	0.056	0.000	0.000	0.000	0.000	0.000	0.000	0.010	pg18beta1_o2nofp.cx10b_c8r32
0.000	51.306	48.611	0.083	0.000	0.000	0.000	0.000	0.000	0.000	0.010	pg18beta1_o2nofp.cx10c_c8r32
0.000	45.083	54.833	0.083	0.000	0.000	0.000	0.000	0.000	0.000	0.010	pg18beta1_o2nofp.cx10d_c8r32
qp100.L2
- qp100.L2: point queries with 100 insert/s per client
- Legend for results is here.
- Each entry lists the percentage of responses that fit in that bucket (slower than max time for previous bucket, faster than min time for next bucket).
Query response time histogram
256us	1ms	4ms	16ms	64ms	256ms	1s	4s	16s	gt	max	tag
0.000	0.643	99.326	0.021	0.009	0.000	0.000	0.000	0.000	0.000	0.021	pg140_o2nofp.cx10a_c8r32
0.000	0.789	99.200	0.011	0.000	0.000	0.000	0.000	0.000	0.000	0.008	pg1418_o2nofp.cx10a_c8r32
0.000	0.698	99.290	0.012	0.000	0.000	0.000	0.000	0.000	0.000	0.008	pg150_o2nofp.cx10a_c8r32
0.000	0.810	99.179	0.011	0.000	0.000	0.000	0.000	0.000	0.000	0.007	pg1513_o2nofp.cx10a_c8r32
0.000	0.737	99.252	0.011	0.000	0.000	0.000	0.000	0.000	0.000	0.008	pg160_o2nofp.cx10a_c8r32
0.000	0.642	99.341	0.018	0.000	0.000	0.000	0.000	0.000	0.000	0.008	pg169_o2nofp.cx10a_c8r32
0.000	0.778	99.210	0.011	0.000	0.000	0.000	0.000	0.000	0.000	0.011	pg170_o2nofp.cx10a_c8r32
0.000	0.724	99.266	0.010	0.000	0.000	0.000	0.000	0.000	0.000	0.007	pg175_o2nofp.cx10a_c8r32
0.000	0.777	99.211	0.012	0.000	0.000	0.000	0.000	0.000	0.000	0.008	pg18beta1_o2nofp.cx10b_c8r32
0.000	0.720	99.268	0.012	0.000	0.000	0.000	0.000	0.000	0.000	0.007	pg18beta1_o2nofp.cx10c_c8r32
0.000	0.783	99.206	0.011	0.000	0.000	0.000	0.000	0.000	0.000	0.007	pg18beta1_o2nofp.cx10d_c8r32
Insert response time histogram
256us	1ms	4ms	16ms	64ms	256ms	1s	4s	16s	gt	max	tag
0.000	0.000	0.000	91.750	8.250	0.000	0.000	0.000	0.000	0.000	0.027	pg140_o2nofp.cx10a_c8r32
0.000	0.000	0.000	92.278	7.722	0.000	0.000	0.000	0.000	0.000	0.021	pg1418_o2nofp.cx10a_c8r32
0.000	0.000	0.000	93.000	7.000	0.000	0.000	0.000	0.000	0.000	0.023	pg150_o2nofp.cx10a_c8r32
0.000	0.000	0.000	92.417	7.583	0.000	0.000	0.000	0.000	0.000	0.020	pg1513_o2nofp.cx10a_c8r32
0.000	0.000	0.000	91.361	8.639	0.000	0.000	0.000	0.000	0.000	0.024	pg160_o2nofp.cx10a_c8r32
0.000	0.000	0.000	93.028	6.972	0.000	0.000	0.000	0.000	0.000	0.020	pg169_o2nofp.cx10a_c8r32
0.000	0.000	0.000	99.583	0.417	0.000	0.000	0.000	0.000	0.000	0.024	pg170_o2nofp.cx10a_c8r32
0.000	0.000	0.000	99.472	0.528	0.000	0.000	0.000	0.000	0.000	0.019	pg175_o2nofp.cx10a_c8r32
0.000	0.000	0.000	99.444	0.556	0.000	0.000	0.000	0.000	0.000	0.019	pg18beta1_o2nofp.cx10b_c8r32
0.000	0.000	0.000	99.444	0.556	0.000	0.000	0.000	0.000	0.000	0.020	pg18beta1_o2nofp.cx10c_c8r32
0.000	0.000	0.000	99.556	0.444	0.000	0.000	0.000	0.000	0.000	0.019	pg18beta1_o2nofp.cx10d_c8r32
Delete response time histogram
256us	1ms	4ms	16ms	64ms	256ms	1s	4s	16s	gt	max	tag
0.000	0.000	99.861	0.139	0.000	0.000	0.000	0.000	0.000	0.000	0.010	pg140_o2nofp.cx10a_c8r32
0.000	0.000	99.972	0.028	0.000	0.000	0.000	0.000	0.000	0.000	0.008	pg1418_o2nofp.cx10a_c8r32
0.000	0.000	99.972	0.028	0.000	0.000	0.000	0.000	0.000	0.000	0.009	pg150_o2nofp.cx10a_c8r32
0.000	0.028	99.944	0.028	0.000	0.000	0.000	0.000	0.000	0.000	0.009	pg1513_o2nofp.cx10a_c8r32
0.000	0.000	99.972	0.028	0.000	0.000	0.000	0.000	0.000	0.000	0.008	pg160_o2nofp.cx10a_c8r32
0.000	0.000	99.972	0.028	0.000	0.000	0.000	0.000	0.000	0.000	0.008	pg169_o2nofp.cx10a_c8r32
0.000	0.000	99.972	0.028	0.000	0.000	0.000	0.000	0.000	0.000	0.008	pg170_o2nofp.cx10a_c8r32
0.000	0.000	99.222	0.778	0.000	0.000	0.000	0.000	0.000	0.000	0.008	pg175_o2nofp.cx10a_c8r32
0.000	0.000	99.972	0.028	0.000	0.000	0.000	0.000	0.000	0.000	0.008	pg18beta1_o2nofp.cx10b_c8r32
0.000	0.000	97.750	2.250	0.000	0.000	0.000	0.000	0.000	0.000	0.009	pg18beta1_o2nofp.cx10c_c8r32
0.000	0.000	99.972	0.028	0.000	0.000	0.000	0.000	0.000	0.000	0.009	pg18beta1_o2nofp.cx10d_c8r32
qr500.L3
- qr500.L3: range queries with 500 insert/s per client
- Legend for results is here.
- Each entry lists the percentage of responses that fit in that bucket (slower than max time for previous bucket, faster than min time for next bucket).
Query response time histogram
256us	1ms	4ms	16ms	64ms	256ms	1s	4s	16s	gt	max	tag
99.981	0.018	nonzero	nonzero	nonzero	0.000	0.000	0.000	0.000	0.000	0.017	pg140_o2nofp.cx10a_c8r32
99.983	0.016	nonzero	nonzero	nonzero	0.000	0.000	0.000	0.000	0.000	0.033	pg1418_o2nofp.cx10a_c8r32
99.983	0.017	nonzero	nonzero	nonzero	0.000	0.000	0.000	0.000	0.000	0.042	pg150_o2nofp.cx10a_c8r32
99.982	0.017	nonzero	0.001	nonzero	0.000	0.000	0.000	0.000	0.000	0.031	pg1513_o2nofp.cx10a_c8r32
99.982	0.017	nonzero	0.001	nonzero	0.000	0.000	0.000	0.000	0.000	0.045	pg160_o2nofp.cx10a_c8r32
99.980	0.019	nonzero	0.001	nonzero	0.000	0.000	0.000	0.000	0.000	0.033	pg169_o2nofp.cx10a_c8r32
99.984	0.015	nonzero	nonzero	nonzero	0.000	0.000	0.000	0.000	0.000	0.020	pg170_o2nofp.cx10a_c8r32
99.985	0.015	nonzero	nonzero	nonzero	0.000	0.000	0.000	0.000	0.000	0.025	pg175_o2nofp.cx10a_c8r32
99.983	0.016	nonzero	nonzero	nonzero	0.000	0.000	0.000	0.000	0.000	0.032	pg18beta1_o2nofp.cx10b_c8r32
99.983	0.016	nonzero	nonzero	nonzero	0.000	0.000	0.000	0.000	0.000	0.025	pg18beta1_o2nofp.cx10c_c8r32
99.983	0.017	nonzero	nonzero	nonzero	0.000	0.000	0.000	0.000	0.000	0.036	pg18beta1_o2nofp.cx10d_c8r32
Insert response time histogram
256us	1ms	4ms	16ms	64ms	256ms	1s	4s	16s	gt	max	tag
0.000	0.000	0.000	92.678	7.322	0.000	0.000	0.000	0.000	0.000	0.035	pg140_o2nofp.cx10a_c8r32
0.000	0.000	0.000	91.606	8.394	0.000	0.000	0.000	0.000	0.000	0.033	pg1418_o2nofp.cx10a_c8r32
0.000	0.000	0.000	91.611	8.389	0.000	0.000	0.000	0.000	0.000	0.031	pg150_o2nofp.cx10a_c8r32
0.000	0.000	0.000	91.439	8.561	0.000	0.000	0.000	0.000	0.000	0.031	pg1513_o2nofp.cx10a_c8r32
0.000	0.000	0.000	91.633	8.367	0.000	0.000	0.000	0.000	0.000	0.030	pg160_o2nofp.cx10a_c8r32
0.000	0.000	0.000	91.511	8.489	0.000	0.000	0.000	0.000	0.000	0.028	pg169_o2nofp.cx10a_c8r32
0.000	0.000	0.000	93.439	6.561	0.000	0.000	0.000	0.000	0.000	0.025	pg170_o2nofp.cx10a_c8r32
0.000	0.000	0.000	93.489	6.511	0.000	0.000	0.000	0.000	0.000	0.025	pg175_o2nofp.cx10a_c8r32
0.000	0.000	0.000	93.417	6.583	0.000	0.000	0.000	0.000	0.000	0.030	pg18beta1_o2nofp.cx10b_c8r32
0.000	0.000	0.000	93.828	6.172	0.000	0.000	0.000	0.000	0.000	0.031	pg18beta1_o2nofp.cx10c_c8r32
0.000	0.000	0.000	93.722	6.278	0.000	0.000	0.000	0.000	0.000	0.030	pg18beta1_o2nofp.cx10d_c8r32
Delete response time histogram
256us	1ms	4ms	16ms	64ms	256ms	1s	4s	16s	gt	max	tag
0.000	0.000	45.978	54.022	0.000	0.000	0.000	0.000	0.000	0.000	0.014	pg140_o2nofp.cx10a_c8r32
0.000	0.000	46.656	53.344	0.000	0.000	0.000	0.000	0.000	0.000	0.015	pg1418_o2nofp.cx10a_c8r32
0.000	0.000	43.067	56.933	0.000	0.000	0.000	0.000	0.000	0.000	0.014	pg150_o2nofp.cx10a_c8r32
0.000	0.000	43.083	56.917	0.000	0.000	0.000	0.000	0.000	0.000	0.014	pg1513_o2nofp.cx10a_c8r32
0.000	0.000	42.817	57.183	0.000	0.000	0.000	0.000	0.000	0.000	0.015	pg160_o2nofp.cx10a_c8r32
0.000	0.000	42.800	57.200	0.000	0.000	0.000	0.000	0.000	0.000	0.015	pg169_o2nofp.cx10a_c8r32
0.000	0.000	43.072	56.928	0.000	0.000	0.000	0.000	0.000	0.000	0.014	pg170_o2nofp.cx10a_c8r32
0.000	0.000	42.394	57.606	0.000	0.000	0.000	0.000	0.000	0.000	0.014	pg175_o2nofp.cx10a_c8r32
0.000	0.000	40.789	59.211	0.000	0.000	0.000	0.000	0.000	0.000	0.015	pg18beta1_o2nofp.cx10b_c8r32
0.000	0.000	41.406	58.594	0.000	0.000	0.000	0.000	0.000	0.000	0.015	pg18beta1_o2nofp.cx10c_c8r32
0.000	0.000	36.750	63.250	0.000	0.000	0.000	0.000	0.000	0.000	0.015	pg18beta1_o2nofp.cx10d_c8r32
qp500.L4
- qp500.L4: point queries with 500 insert/s per client
- Legend for results is here.
- Each entry lists the percentage of responses that fit in that bucket (slower than max time for previous bucket, faster than min time for next bucket).
Query response time histogram
256us	1ms	4ms	16ms	64ms	256ms	1s	4s	16s	gt	max	tag
0.000	0.365	99.602	0.027	0.005	0.000	0.000	0.000	0.000	0.000	0.019	pg140_o2nofp.cx10a_c8r32
0.000	0.406	99.585	0.010	0.000	0.000	0.000	0.000	0.000	0.000	0.008	pg1418_o2nofp.cx10a_c8r32
0.000	0.386	99.603	0.011	0.000	0.000	0.000	0.000	0.000	0.000	0.009	pg150_o2nofp.cx10a_c8r32
0.000	0.369	99.621	0.010	0.000	0.000	0.000	0.000	0.000	0.000	0.008	pg1513_o2nofp.cx10a_c8r32
0.000	0.382	99.610	0.008	0.000	0.000	0.000	0.000	0.000	0.000	0.008	pg160_o2nofp.cx10a_c8r32
0.000	0.365	99.625	0.010	0.000	0.000	0.000	0.000	0.000	0.000	0.007	pg169_o2nofp.cx10a_c8r32
0.000	0.390	99.599	0.011	0.000	0.000	0.000	0.000	0.000	0.000	0.008	pg170_o2nofp.cx10a_c8r32
0.000	0.415	99.576	0.009	0.000	0.000	0.000	0.000	0.000	0.000	0.007	pg175_o2nofp.cx10a_c8r32
0.000	0.422	99.569	0.009	0.000	0.000	0.000	0.000	0.000	0.000	0.007	pg18beta1_o2nofp.cx10b_c8r32
0.000	0.386	99.605	0.009	0.000	0.000	0.000	0.000	0.000	0.000	0.008	pg18beta1_o2nofp.cx10c_c8r32
0.000	0.390	99.600	0.009	0.000	0.000	0.000	0.000	0.000	0.000	0.008	pg18beta1_o2nofp.cx10d_c8r32
Insert response time histogram
256us	1ms	4ms	16ms	64ms	256ms	1s	4s	16s	gt	max	tag
0.000	0.000	0.000	99.350	0.650	0.000	0.000	0.000	0.000	0.000	0.024	pg140_o2nofp.cx10a_c8r32
0.000	0.000	0.000	99.750	0.250	0.000	0.000	0.000	0.000	0.000	0.018	pg1418_o2nofp.cx10a_c8r32
0.000	0.000	0.000	99.700	0.300	0.000	0.000	0.000	0.000	0.000	0.019	pg150_o2nofp.cx10a_c8r32
0.000	0.000	0.000	99.711	0.289	0.000	0.000	0.000	0.000	0.000	0.020	pg1513_o2nofp.cx10a_c8r32
0.000	0.000	0.000	99.711	0.289	0.000	0.000	0.000	0.000	0.000	0.020	pg160_o2nofp.cx10a_c8r32
0.000	0.000	0.000	99.711	0.289	0.000	0.000	0.000	0.000	0.000	0.021	pg169_o2nofp.cx10a_c8r32
0.000	0.000	0.000	99.744	0.256	0.000	0.000	0.000	0.000	0.000	0.021	pg170_o2nofp.cx10a_c8r32
0.000	0.000	0.000	99.761	0.239	0.000	0.000	0.000	0.000	0.000	0.020	pg175_o2nofp.cx10a_c8r32
0.000	0.000	0.000	99.739	0.261	0.000	0.000	0.000	0.000	0.000	0.018	pg18beta1_o2nofp.cx10b_c8r32
0.000	0.000	0.000	99.767	0.233	0.000	0.000	0.000	0.000	0.000	0.019	pg18beta1_o2nofp.cx10c_c8r32
0.000	0.000	0.000	99.656	0.344	0.000	0.000	0.000	0.000	0.000	0.020	pg18beta1_o2nofp.cx10d_c8r32
Delete response time histogram
256us	1ms	4ms	16ms	64ms	256ms	1s	4s	16s	gt	max	tag
0.000	0.000	0.000	98.306	1.694	0.000	0.000	0.000	0.000	0.000	0.043	pg140_o2nofp.cx10a_c8r32
0.000	0.000	0.000	98.339	1.661	0.000	0.000	0.000	0.000	0.000	0.042	pg1418_o2nofp.cx10a_c8r32
0.000	0.000	0.000	98.561	1.439	0.000	0.000	0.000	0.000	0.000	0.043	pg150_o2nofp.cx10a_c8r32
0.000	0.000	0.000	98.906	1.094	0.000	0.000	0.000	0.000	0.000	0.042	pg1513_o2nofp.cx10a_c8r32
0.000	0.000	0.000	97.600	2.400	0.000	0.000	0.000	0.000	0.000	0.042	pg160_o2nofp.cx10a_c8r32
0.000	0.000	0.000	98.256	1.744	0.000	0.000	0.000	0.000	0.000	0.043	pg169_o2nofp.cx10a_c8r32
0.000	0.000	0.000	90.006	9.994	0.000	0.000	0.000	0.000	0.000	0.041	pg170_o2nofp.cx10a_c8r32
0.000	0.000	0.000	94.533	5.467	0.000	0.000	0.000	0.000	0.000	0.042	pg175_o2nofp.cx10a_c8r32
0.000	0.000	0.000	89.694	10.306	0.000	0.000	0.000	0.000	0.000	0.043	pg18beta1_o2nofp.cx10b_c8r32
0.000	0.000	0.000	87.944	12.056	0.000	0.000	0.000	0.000	0.000	0.043	pg18beta1_o2nofp.cx10c_c8r32
0.000	0.000	0.000	88.894	11.106	0.000	0.000	0.000	0.000	0.000	0.044	pg18beta1_o2nofp.cx10d_c8r32
qr1000.L5
- qr1000.L5: range queries with 1000 insert/s per client
- Legend for results is here.
- Each entry lists the percentage of responses that fit in that bucket (slower than max time for previous bucket, faster than min time for next bucket).
Query response time histogram
256us	1ms	4ms	16ms	64ms	256ms	1s	4s	16s	gt	max	tag
99.944	0.052	0.002	0.001	nonzero	nonzero	0.000	0.000	0.000	0.000	0.098	pg140_o2nofp.cx10a_c8r32
99.949	0.047	0.003	0.001	nonzero	nonzero	0.000	0.000	0.000	0.000	0.101	pg1418_o2nofp.cx10a_c8r32
99.950	0.046	0.003	0.001	nonzero	nonzero	0.000	0.000	0.000	0.000	0.088	pg150_o2nofp.cx10a_c8r32
99.946	0.050	0.003	0.002	nonzero	nonzero	0.000	0.000	0.000	0.000	0.089	pg1513_o2nofp.cx10a_c8r32
99.949	0.047	0.003	0.001	nonzero	nonzero	0.000	0.000	0.000	0.000	0.085	pg160_o2nofp.cx10a_c8r32
99.947	0.049	0.003	0.001	nonzero	nonzero	0.000	0.000	0.000	0.000	0.090	pg169_o2nofp.cx10a_c8r32
99.953	0.044	0.003	0.001	nonzero	nonzero	0.000	0.000	0.000	0.000	0.091	pg170_o2nofp.cx10a_c8r32
99.955	0.041	0.002	0.001	nonzero	nonzero	0.000	0.000	0.000	0.000	0.096	pg175_o2nofp.cx10a_c8r32
99.950	0.046	0.003	0.001	nonzero	nonzero	0.000	0.000	0.000	0.000	0.091	pg18beta1_o2nofp.cx10b_c8r32
99.949	0.047	0.003	0.001	nonzero	nonzero	0.000	0.000	0.000	0.000	0.091	pg18beta1_o2nofp.cx10c_c8r32
99.951	0.045	0.003	0.001	nonzero	nonzero	0.000	0.000	0.000	0.000	0.089	pg18beta1_o2nofp.cx10d_c8r32
Insert response time histogram
256us	1ms	4ms	16ms	64ms	256ms	1s	4s	16s	gt	max	tag
0.000	0.000	0.000	96.631	3.369	0.000	0.000	0.000	0.000	0.000	0.025	pg140_o2nofp.cx10a_c8r32
0.000	0.000	0.000	96.864	3.136	0.000	0.000	0.000	0.000	0.000	0.023	pg1418_o2nofp.cx10a_c8r32
0.000	0.000	0.000	96.750	3.250	0.000	0.000	0.000	0.000	0.000	0.023	pg150_o2nofp.cx10a_c8r32
0.000	0.000	0.000	96.783	3.217	0.000	0.000	0.000	0.000	0.000	0.023	pg1513_o2nofp.cx10a_c8r32
0.000	0.000	0.000	97.022	2.978	0.000	0.000	0.000	0.000	0.000	0.023	pg160_o2nofp.cx10a_c8r32
0.000	0.000	0.000	96.897	3.103	0.000	0.000	0.000	0.000	0.000	0.023	pg169_o2nofp.cx10a_c8r32
0.000	0.000	0.000	96.956	3.044	0.000	0.000	0.000	0.000	0.000	0.022	pg170_o2nofp.cx10a_c8r32
0.000	0.000	0.000	96.619	3.381	0.000	0.000	0.000	0.000	0.000	0.022	pg175_o2nofp.cx10a_c8r32
0.000	0.000	0.000	97.022	2.978	0.000	0.000	0.000	0.000	0.000	0.022	pg18beta1_o2nofp.cx10b_c8r32
0.000	0.000	0.000	96.753	3.247	0.000	0.000	0.000	0.000	0.000	0.028	pg18beta1_o2nofp.cx10c_c8r32
0.000	0.000	0.000	97.064	2.936	0.000	0.000	0.000	0.000	0.000	0.022	pg18beta1_o2nofp.cx10d_c8r32
Delete response time histogram
256us	1ms	4ms	16ms	64ms	256ms	1s	4s	16s	gt	max	tag
0.000	0.000	0.000	22.044	77.956	0.000	0.000	0.000	0.000	0.000	0.063	pg140_o2nofp.cx10a_c8r32
0.000	0.000	0.000	24.975	75.022	0.003	0.000	0.000	0.000	0.000	0.064	pg1418_o2nofp.cx10a_c8r32
0.000	0.000	0.000	15.197	84.803	0.000	0.000	0.000	0.000	0.000	0.064	pg150_o2nofp.cx10a_c8r32
0.000	0.000	0.000	16.161	83.839	0.000	0.000	0.000	0.000	0.000	0.063	pg1513_o2nofp.cx10a_c8r32
0.000	0.000	0.000	11.361	88.639	0.000	0.000	0.000	0.000	0.000	0.063	pg160_o2nofp.cx10a_c8r32
0.000	0.000	0.000	14.219	85.781	0.000	0.000	0.000	0.000	0.000	0.064	pg169_o2nofp.cx10a_c8r32
0.000	0.000	0.000	4.267	95.733	0.000	0.000	0.000	0.000	0.000	0.061	pg170_o2nofp.cx10a_c8r32
0.000	0.000	0.000	8.806	91.194	0.000	0.000	0.000	0.000	0.000	0.062	pg175_o2nofp.cx10a_c8r32
0.000	0.000	0.000	4.936	95.061	0.003	0.000	0.000	0.000	0.000	0.065	pg18beta1_o2nofp.cx10b_c8r32
0.000	0.000	0.000	8.806	91.192	0.003	0.000	0.000	0.000	0.000	0.066	pg18beta1_o2nofp.cx10c_c8r32
0.000	0.000	0.000	4.400	95.597	0.003	0.000	0.000	0.000	0.000	0.066	pg18beta1_o2nofp.cx10d_c8r32
qp1000.L6
- qp1000.L6: point queries with 1000 insert/s per client
- Legend for results is here.
- Each entry lists the percentage of responses that fit in that bucket (slower than max time for previous bucket, faster than min time for next bucket).
Query response time histogram
256us	1ms	4ms	16ms	64ms	256ms	1s	4s	16s	gt	max	tag
0.000	0.147	99.338	0.510	0.005	0.000	0.000	0.000	0.000	0.000	0.038	pg140_o2nofp.cx10a_c8r32
0.000	0.165	99.301	0.533	0.002	0.000	0.000	0.000	0.000	0.000	0.044	pg1418_o2nofp.cx10a_c8r32
0.000	0.151	98.887	0.959	0.003	0.000	0.000	0.000	0.000	0.000	0.042	pg150_o2nofp.cx10a_c8r32
0.000	0.148	98.841	1.008	0.003	0.000	0.000	0.000	0.000	0.000	0.038	pg1513_o2nofp.cx10a_c8r32
0.000	0.151	99.060	0.786	0.002	0.000	0.000	0.000	0.000	0.000	0.040	pg160_o2nofp.cx10a_c8r32
0.000	0.147	98.849	1.001	0.003	0.000	0.000	0.000	0.000	0.000	0.039	pg169_o2nofp.cx10a_c8r32
0.000	0.174	99.122	0.702	0.002	0.000	0.000	0.000	0.000	0.000	0.046	pg170_o2nofp.cx10a_c8r32
0.000	0.172	99.156	0.669	0.002	0.000	0.000	0.000	0.000	0.000	0.044	pg175_o2nofp.cx10a_c8r32
0.000	0.164	99.071	0.763	0.002	0.000	0.000	0.000	0.000	0.000	0.042	pg18beta1_o2nofp.cx10b_c8r32
0.000	0.145	99.022	0.831	0.002	0.000	0.000	0.000	0.000	0.000	0.043	pg18beta1_o2nofp.cx10c_c8r32
0.000	0.154	99.005	0.838	0.002	0.000	0.000	0.000	0.000	0.000	0.043	pg18beta1_o2nofp.cx10d_c8r32
Insert response time histogram
256us	1ms	4ms	16ms	64ms	256ms	1s	4s	16s	gt	max	tag
0.000	0.000	0.000	98.978	1.022	0.000	0.000	0.000	0.000	0.000	0.052	pg140_o2nofp.cx10a_c8r32
0.000	0.000	0.000	99.000	1.000	0.000	0.000	0.000	0.000	0.000	0.046	pg1418_o2nofp.cx10a_c8r32
0.000	0.000	0.000	98.011	1.989	0.000	0.000	0.000	0.000	0.000	0.055	pg150_o2nofp.cx10a_c8r32
0.000	0.000	0.000	97.792	2.208	0.000	0.000	0.000	0.000	0.000	0.051	pg1513_o2nofp.cx10a_c8r32
0.000	0.000	0.000	98.269	1.731	0.000	0.000	0.000	0.000	0.000	0.052	pg160_o2nofp.cx10a_c8r32
0.000	0.000	0.000	97.911	2.089	0.000	0.000	0.000	0.000	0.000	0.051	pg169_o2nofp.cx10a_c8r32
0.000	0.000	0.000	98.939	1.061	0.000	0.000	0.000	0.000	0.000	0.058	pg170_o2nofp.cx10a_c8r32
0.000	0.000	0.000	98.964	1.036	0.000	0.000	0.000	0.000	0.000	0.053	pg175_o2nofp.cx10a_c8r32
0.000	0.000	0.000	98.744	1.256	0.000	0.000	0.000	0.000	0.000	0.063	pg18beta1_o2nofp.cx10b_c8r32
0.000	0.000	0.000	98.575	1.425	0.000	0.000	0.000	0.000	0.000	0.054	pg18beta1_o2nofp.cx10c_c8r32
0.000	0.000	0.000	98.608	1.392	0.000	0.000	0.000	0.000	0.000	0.047	pg18beta1_o2nofp.cx10d_c8r32
Delete response time histogram
256us	1ms	4ms	16ms	64ms	256ms	1s	4s	16s	gt	max	tag
0.000	0.000	0.000	0.000	99.997	0.003	0.000	0.000	0.000	0.000	0.101	pg140_o2nofp.cx10a_c8r32
0.000	0.000	0.000	0.000	99.997	0.003	0.000	0.000	0.000	0.000	0.103	pg1418_o2nofp.cx10a_c8r32
0.000	0.000	0.000	0.000	99.997	0.003	0.000	0.000	0.000	0.000	0.104	pg150_o2nofp.cx10a_c8r32
0.000	0.000	0.000	0.000	99.997	0.003	0.000	0.000	0.000	0.000	0.101	pg1513_o2nofp.cx10a_c8r32
0.000	0.000	0.000	0.000	99.997	0.003	0.000	0.000	0.000	0.000	0.101	pg160_o2nofp.cx10a_c8r32
0.000	0.000	0.000	0.000	99.994	0.006	0.000	0.000	0.000	0.000	0.100	pg169_o2nofp.cx10a_c8r32
0.000	0.000	0.000	0.000	99.997	0.003	0.000	0.000	0.000	0.000	0.098	pg170_o2nofp.cx10a_c8r32
0.000	0.000	0.000	0.000	99.997	0.003	0.000	0.000	0.000	0.000	0.098	pg175_o2nofp.cx10a_c8r32
0.000	0.000	0.000	0.000	99.997	0.003	0.000	0.000	0.000	0.000	0.106	pg18beta1_o2nofp.cx10b_c8r32
0.000	0.000	0.000	0.000	99.997	0.003	0.000	0.000	0.000	0.000	0.107	pg18beta1_o2nofp.cx10c_c8r32
0.000	0.000	0.000	0.000	99.997	0.003	0.000	0.000	0.000	0.000	0.105	pg18beta1_o2nofp.cx10d_c8r32