Introduction
This is a report for the insert benchmark with 4000M docs and 20 client(s). It is generated by scripts (bash, awk, sed) and Tufte might not be impressed. An overview of the insert benchmark is here and a short update is here. Below, by DBMS, I mean DBMS+version.config. An example is my8020.c10b40 where my means MySQL, 8020 is version 8.0.20 and c10b40 is the name for the configuration file.
The test server has 48 AMD cores, 128G RAM and RAID 10 with 2 NVMe devices. It is described here. The benchmark was run with 20 clients and there were 1 or 3 connections per client (1 for queries or inserts without rate limits, 1+1 for rate limited inserts+deletes). It uses 20 tables with a table per client. It loads 200M rows per table without secondary indexes, creates 3 secondary indexes per table, then inserts 4m+1m rows per table with a delete per insert to avoid growing the table. It then does 6 read+write tests for 1800s each that do queries as fast as possible with 100,100,500,500,1000,1000 inserts/s and the same for deletes/s per client concurrent with the queries. The database is larger than memory. Clients and the DBMS share one server. The per-database configs are in the per-database subdirectories here.
The tested DBMS are:
- pg18b1git_o2nofp.cx10cw2_c32r128 - Postgres 18 beta1 with the cx10cw2_c32r128 config with io_method=workers, io_workers=2
- pg18b1git_o2nofp.cx10cw4_c32r128 - Postgres 18 beta1 with the cx10cw2_c32r128 config with io_method=workers, io_workers=4
- pg18b1git_o2nofp.cx10cw6_c32r128 - Postgres 18 beta1 with the cx10cw2_c32r128 config with io_method=workers, io_workers=6
- pg18b1git_o2nofp.cx10cw8_c32r128 - Postgres 18 beta1 with the cx10cw2_c32r128 config with io_method=workers, io_workers=8
- pg18b1git_o2nofp.cx10cw16_c32r128 - Postgres 18 beta1 with the cx10cw2_c32r128 config with io_method=workers, io_workers=16
- pg18b1git_o2nofp.cx10cw32_c32r128 - Postgres 18 beta1 with the cx10cw2_c32r128 config with io_method=workers, io_workers=32
Contents
- Summary
- l.i0: load without secondary indexes
- l.x: create secondary indexes
- l.i1: continue load after secondary indexes created with 50 inserts per transaction
- l.i2: continue load after secondary indexes created with 5 inserts per transaction
- qr100.L1: range queries with 100 insert/s per client
- qp100.L2: point queries with 100 insert/s per client
- qr500.L3: range queries with 500 insert/s per client
- qp500.L4: point queries with 500 insert/s per client
- qr1000.L5: range queries with 1000 insert/s per client
- qp1000.L6: point queries with 1000 insert/s per client
Summary
The numbers are inserts/s for l.i0, l.i1 and l.i2, indexed docs (or rows) /s for l.x and queries/s for qr100, qp100 thru qr1000, qp1000" The values are the average rate over the entire test for inserts (IPS) and queries (QPS). The range of values for IPS and QPS is split into 3 parts: bottom 25%, middle 50%, top 25%. Values in the bottom 25% have a red background, values in the top 25% have a green background and values in the middle have no color. A gray background is used for values that can be ignored because the DBMS did not sustain the target insert rate. Red backgrounds are not used when the minimum value is within 80% of the max value.
| dbms | l.i0 | l.x | l.i1 | l.i2 | qr100 | qp100 | qr500 | qp500 | qr1000 | qp1000 |
|---|---|---|---|---|---|---|---|---|---|---|
| pg18b1git_o2nofp.cx10cw2_c32r128 | 1983143 | 3225806 | 24184 | 2697 | 369931 | 9001 | 329729 | 5608 | 205202 | 3114 |
| pg18b1git_o2nofp.cx10cw4_c32r128 | 2041858 | 3407155 | 23704 | 2263 | 365876 | 8818 | 322634 | 5587 | 206986 | 3079 |
| pg18b1git_o2nofp.cx10cw6_c32r128 | 2037697 | 3372681 | 23824 | 2569 | 365755 | 8794 | 322853 | 5482 | 204611 | 2944 |
| pg18b1git_o2nofp.cx10cw8_c32r128 | 2019182 | 3439381 | 23859 | 2433 | 367619 | 8772 | 324101 | 5431 | 204173 | 2901 |
| pg18b1git_o2nofp.cx10cw16_c32r128 | 2054443 | 3626473 | 23128 | 2372 | 366520 | 8456 | 320333 | 5002 | 200698 | 2666 |
| pg18b1git_o2nofp.cx10cw32_c32r128 | 1986097 | 3593890 | 22766 | 2385 | 364525 | 8115 | 319975 | 4545 | 198266 | 2354 |
This table has relative throughput, throughput for the DBMS relative to the DBMS in the first line, using the absolute throughput from the previous table. Values less than 0.95 have a yellow background. Values greater than 1.05 have a blue background.
| dbms | l.i0 | l.x | l.i1 | l.i2 | qr100 | qp100 | qr500 | qp500 | qr1000 | qp1000 |
|---|---|---|---|---|---|---|---|---|---|---|
| pg18b1git_o2nofp.cx10cw2_c32r128 | 1.00 | 1.00 | 1.00 | 1.00 | 1.00 | 1.00 | 1.00 | 1.00 | 1.00 | 1.00 |
| pg18b1git_o2nofp.cx10cw4_c32r128 | 1.03 | 1.06 | 0.98 | 0.84 | 0.99 | 0.98 | 0.98 | 1.00 | 1.01 | 0.99 |
| pg18b1git_o2nofp.cx10cw6_c32r128 | 1.03 | 1.05 | 0.99 | 0.95 | 0.99 | 0.98 | 0.98 | 0.98 | 1.00 | 0.95 |
| pg18b1git_o2nofp.cx10cw8_c32r128 | 1.02 | 1.07 | 0.99 | 0.90 | 0.99 | 0.97 | 0.98 | 0.97 | 0.99 | 0.93 |
| pg18b1git_o2nofp.cx10cw16_c32r128 | 1.04 | 1.12 | 0.96 | 0.88 | 0.99 | 0.94 | 0.97 | 0.89 | 0.98 | 0.86 |
| pg18b1git_o2nofp.cx10cw32_c32r128 | 1.00 | 1.11 | 0.94 | 0.88 | 0.99 | 0.90 | 0.97 | 0.81 | 0.97 | 0.76 |
This lists the average rate of inserts/s for the tests that do inserts concurrent with queries. For such tests the query rate is listed in the table above. The read+write tests are setup so that the insert rate should match the target rate every second. Cells that are not at least 95% of the target have a red background to indicate a failure to satisfy the target.
| dbms | qr100.L1 | qp100.L2 | qr500.L3 | qp500.L4 | qr1000.L5 | qp1000.L6 |
|---|---|---|---|---|---|---|
| pg18b1git_o2nofp.cx10cw2_c32r128 | 1977 | 1977 | 9868 | 9868 | 18595 | 19139 |
| pg18b1git_o2nofp.cx10cw4_c32r128 | 1977 | 1976 | 9868 | 9879 | 18692 | 19048 |
| pg18b1git_o2nofp.cx10cw6_c32r128 | 1977 | 1977 | 9868 | 9852 | 18614 | 18977 |
| pg18b1git_o2nofp.cx10cw8_c32r128 | 1976 | 1976 | 9868 | 9858 | 18480 | 19027 |
| pg18b1git_o2nofp.cx10cw16_c32r128 | 1977 | 1977 | 9858 | 9836 | 18163 | 18967 |
| pg18b1git_o2nofp.cx10cw32_c32r128 | 1977 | 1976 | 9858 | 9815 | 18036 | 18072 |
| target | 2000 | 2000 | 10000 | 10000 | 20000 | 20000 |
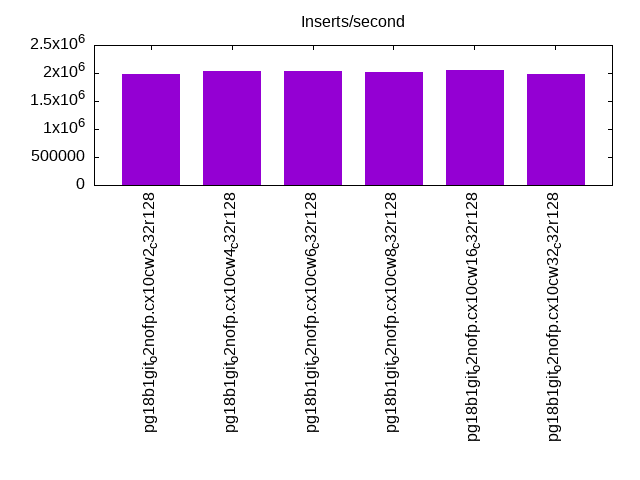
l.i0
l.i0: load without secondary indexes. Graphs for performance per 1-second interval are here.
Average throughput:
Insert response time histogram: each cell has the percentage of responses that take <= the time in the header and max is the max response time in seconds. For the max column values in the top 25% of the range have a red background and in the bottom 25% of the range have a green background. The red background is not used when the min value is within 80% of the max value.
| dbms | 256us | 1ms | 4ms | 16ms | 64ms | 256ms | 1s | 4s | 16s | gt | max |
|---|---|---|---|---|---|---|---|---|---|---|---|
| pg18b1git_o2nofp.cx10cw2_c32r128 | 88.965 | 10.278 | 0.656 | 0.088 | 0.008 | 0.006 | nonzero | 1.575 | |||
| pg18b1git_o2nofp.cx10cw4_c32r128 | 90.358 | 9.210 | 0.324 | 0.096 | 0.005 | 0.006 | nonzero | 1.365 | |||
| pg18b1git_o2nofp.cx10cw6_c32r128 | 90.316 | 9.254 | 0.331 | 0.087 | 0.005 | 0.006 | nonzero | 2.298 | |||
| pg18b1git_o2nofp.cx10cw8_c32r128 | 90.185 | 9.244 | 0.462 | 0.095 | 0.007 | 0.007 | 0.978 | ||||
| pg18b1git_o2nofp.cx10cw16_c32r128 | 91.026 | 8.590 | 0.288 | 0.084 | 0.006 | 0.006 | nonzero | 1.405 | |||
| pg18b1git_o2nofp.cx10cw32_c32r128 | 89.882 | 9.482 | 0.528 | 0.094 | 0.006 | 0.007 | nonzero | 1.302 |
Performance metrics for the DBMS listed above. Some are normalized by throughput, others are not. Legend for results is here.
ips	qps	rps	rmbps	wps	wmbps	rpq	rkbpq	wpi	wkbpi	csps	cpups	cspq	cpupq	dbgb1	dbgb2	rss	maxop	p50	p99	tag
1983143	0	1702	13.6	8304.3	793.1	0.001	0.007	0.004	0.410	324892	55.0	0.164	13	382.7	478.8	91.5	1.575	108525	36260	pg18b1git_o2nofp.cx10cw2_c32r128
2041858	0	1678	13.5	8552.2	812.7	0.001	0.007	0.004	0.408	344523	56.7	0.169	13	382.7	478.8	93.6	1.365	110576	36860	pg18b1git_o2nofp.cx10cw4_c32r128
2037697	0	1755	14.1	8607.2	817.6	0.001	0.007	0.004	0.411	354470	56.8	0.174	13	382.7	478.8	92.5	2.298	111081	31965	pg18b1git_o2nofp.cx10cw6_c32r128
2019182	0	1745	14.0	8475.2	806.6	0.001	0.007	0.004	0.409	332152	55.9	0.164	13	382.7	478.8	91.2	0.978	110916	32365	pg18b1git_o2nofp.cx10cw8_c32r128
2054443	0	1717	13.8	8625.0	821.3	0.001	0.007	0.004	0.409	342544	57.4	0.167	13	382.7	478.8	93.2	1.405	111380	35395	pg18b1git_o2nofp.cx10cw16_c32r128
1986097	0	1719	13.8	8349.5	797.9	0.001	0.007	0.004	0.411	314516	55.5	0.158	13	382.7	478.8	90.8	1.302	108983	31666	pg18b1git_o2nofp.cx10cw32_c32r128
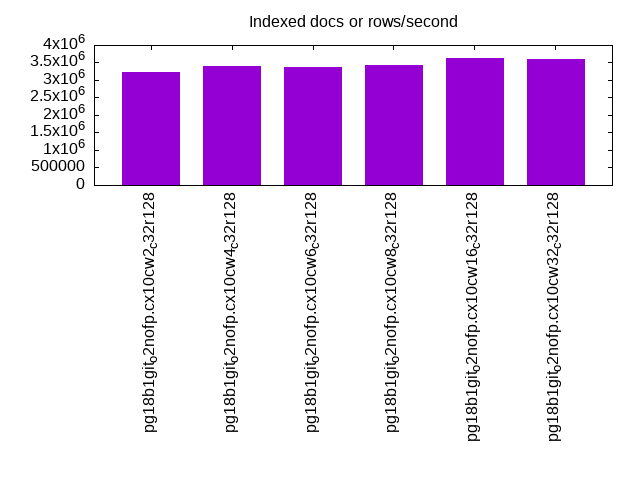
l.x
l.x: create secondary indexes.
Average throughput:
Performance metrics for the DBMS listed above. Some are normalized by throughput, others are not. Legend for results is here.
ips	qps	rps	rmbps	wps	wmbps	rpq	rkbpq	wpi	wkbpi	csps	cpups	cspq	cpupq	dbgb1	dbgb2	rss	maxop	p50	p99	tag
3225806	0	10846	1025.2	8328.2	919.7	0.003	0.325	0.003	0.292	89540	23.2	0.028	3	768.4	863.7	41.9	0.021	NA	NA	pg18b1git_o2nofp.cx10cw2_c32r128
3407155	0	11443	1082.0	8729.2	975.8	0.003	0.325	0.003	0.293	94770	23.7	0.028	3	768.4	863.7	46.5	0.114	NA	NA	pg18b1git_o2nofp.cx10cw4_c32r128
3372681	0	11295	1072.9	8644.0	962.6	0.003	0.326	0.003	0.292	96210	23.9	0.029	3	768.4	863.7	48.9	0.080	NA	NA	pg18b1git_o2nofp.cx10cw6_c32r128
3439381	0	11554	1095.7	8822.0	981.8	0.003	0.326	0.003	0.292	99132	24.8	0.029	3	768.4	863.7	59.7	0.037	NA	NA	pg18b1git_o2nofp.cx10cw8_c32r128
3626473	0	12097	1150.6	9167.0	1034.4	0.003	0.325	0.003	0.292	108480	26.5	0.030	4	768.4	863.7	53.1	0.284	NA	NA	pg18b1git_o2nofp.cx10cw16_c32r128
3593890	0	11942	1145.1	9197.0	1029.7	0.003	0.326	0.003	0.293	117007	27.2	0.033	4	768.4	863.7	55.1	0.249	NA	NA	pg18b1git_o2nofp.cx10cw32_c32r128
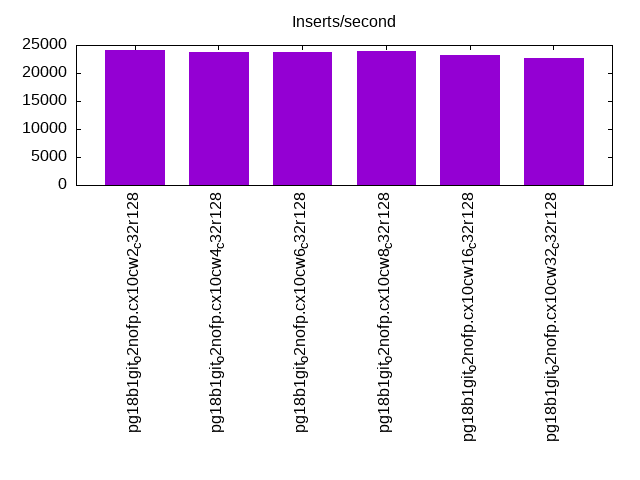
l.i1
l.i1: continue load after secondary indexes created with 50 inserts per transaction. Graphs for performance per 1-second interval are here.
Average throughput:
Insert response time histogram: each cell has the percentage of responses that take <= the time in the header and max is the max response time in seconds. For the max column values in the top 25% of the range have a red background and in the bottom 25% of the range have a green background. The red background is not used when the min value is within 80% of the max value.
| dbms | 256us | 1ms | 4ms | 16ms | 64ms | 256ms | 1s | 4s | 16s | gt | max |
|---|---|---|---|---|---|---|---|---|---|---|---|
| pg18b1git_o2nofp.cx10cw2_c32r128 | 15.513 | 73.455 | 10.821 | 0.087 | 0.123 | 3.790 | |||||
| pg18b1git_o2nofp.cx10cw4_c32r128 | 17.045 | 72.482 | 10.279 | 0.077 | 0.117 | 3.797 | |||||
| pg18b1git_o2nofp.cx10cw6_c32r128 | 15.895 | 73.265 | 10.666 | 0.064 | 0.109 | 3.416 | |||||
| pg18b1git_o2nofp.cx10cw8_c32r128 | 15.387 | 73.539 | 10.888 | 0.064 | 0.122 | nonzero | 4.509 | ||||
| pg18b1git_o2nofp.cx10cw16_c32r128 | 15.735 | 71.544 | 12.533 | 0.064 | 0.125 | 3.323 | |||||
| pg18b1git_o2nofp.cx10cw32_c32r128 | 13.313 | 70.912 | 15.562 | 0.101 | 0.111 | 0.001 | 5.672 |
Delete response time histogram: each cell has the percentage of responses that take <= the time in the header and max is the max response time in seconds. For the max column values in the top 25% of the range have a red background and in the bottom 25% of the range have a green background. The red background is not used when the min value is within 80% of the max value.
| dbms | 256us | 1ms | 4ms | 16ms | 64ms | 256ms | 1s | 4s | 16s | gt | max |
|---|---|---|---|---|---|---|---|---|---|---|---|
| pg18b1git_o2nofp.cx10cw2_c32r128 | 2.368 | 9.271 | 24.109 | 63.138 | 1.014 | 0.032 | 0.068 | 3.465 | |||
| pg18b1git_o2nofp.cx10cw4_c32r128 | 2.435 | 8.627 | 24.347 | 62.836 | 1.659 | 0.034 | 0.062 | 2.752 | |||
| pg18b1git_o2nofp.cx10cw6_c32r128 | 2.453 | 8.527 | 24.078 | 63.185 | 1.657 | 0.027 | 0.073 | 2.628 | |||
| pg18b1git_o2nofp.cx10cw8_c32r128 | 2.487 | 8.172 | 25.636 | 62.478 | 1.126 | 0.028 | 0.073 | 2.579 | |||
| pg18b1git_o2nofp.cx10cw16_c32r128 | 2.446 | 9.037 | 22.090 | 63.874 | 2.443 | 0.031 | 0.078 | 2.206 | |||
| pg18b1git_o2nofp.cx10cw32_c32r128 | 2.364 | 8.048 | 25.909 | 61.843 | 1.730 | 0.052 | 0.054 | 2.705 |
Performance metrics for the DBMS listed above. Some are normalized by throughput, others are not. Legend for results is here.
ips	qps	rps	rmbps	wps	wmbps	rpq	rkbpq	wpi	wkbpi	csps	cpups	cspq	cpupq	dbgb1	dbgb2	rss	maxop	p50	p99	tag
24184	0	30502	242.8	35848.0	787.0	1.261	10.281	1.482	33.325	86671	29.8	3.584	591	781.5	921.4	81.8	3.790	1199	0	pg18b1git_o2nofp.cx10cw2_c32r128
23704	0	30066	240.6	35205.8	779.3	1.268	10.395	1.485	33.664	84821	30.8	3.578	624	781.5	877.6	89.9	3.797	1199	0	pg18b1git_o2nofp.cx10cw4_c32r128
23824	0	30091	239.8	35061.5	775.0	1.263	10.307	1.472	33.313	85309	30.7	3.581	619	781.5	877.6	84.8	3.416	1199	0	pg18b1git_o2nofp.cx10cw6_c32r128
23859	0	30153	239.7	35597.7	778.7	1.264	10.288	1.492	33.420	85119	29.9	3.568	602	781.5	877.6	85.9	4.509	1199	0	pg18b1git_o2nofp.cx10cw8_c32r128
23128	0	29362	233.9	34293.7	753.2	1.270	10.354	1.483	33.349	83140	32.5	3.595	675	781.5	877.6	83.8	3.323	1149	0	pg18b1git_o2nofp.cx10cw16_c32r128
22766	0	28829	229.9	33560.5	746.0	1.266	10.341	1.474	33.553	81065	30.9	3.561	651	781.5	920.7	76.0	5.672	1100	0	pg18b1git_o2nofp.cx10cw32_c32r128
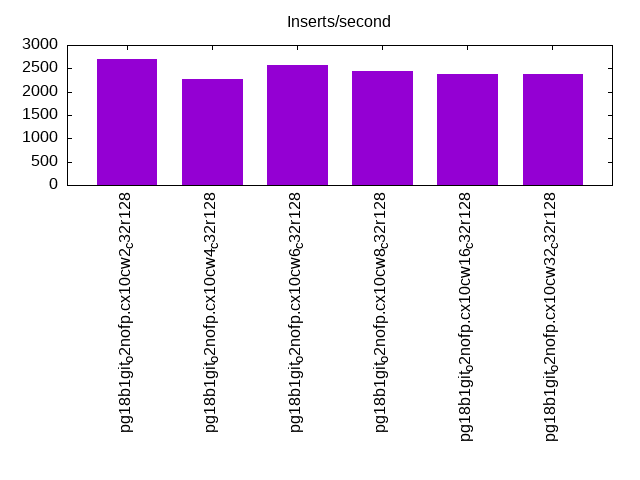
l.i2
l.i2: continue load after secondary indexes created with 5 inserts per transaction. Graphs for performance per 1-second interval are here.
Average throughput:
Insert response time histogram: each cell has the percentage of responses that take <= the time in the header and max is the max response time in seconds. For the max column values in the top 25% of the range have a red background and in the bottom 25% of the range have a green background. The red background is not used when the min value is within 80% of the max value.
| dbms | 256us | 1ms | 4ms | 16ms | 64ms | 256ms | 1s | 4s | 16s | gt | max |
|---|---|---|---|---|---|---|---|---|---|---|---|
| pg18b1git_o2nofp.cx10cw2_c32r128 | 0.238 | 36.854 | 62.670 | 0.059 | 0.111 | 0.025 | 0.038 | 0.005 | 1.759 | ||
| pg18b1git_o2nofp.cx10cw4_c32r128 | 0.150 | 36.556 | 63.115 | 0.069 | 0.091 | 0.010 | 0.007 | 0.002 | 3.944 | ||
| pg18b1git_o2nofp.cx10cw6_c32r128 | 0.068 | 36.274 | 63.454 | 0.038 | 0.102 | 0.023 | 0.034 | 0.007 | nonzero | 4.397 | |
| pg18b1git_o2nofp.cx10cw8_c32r128 | 0.031 | 37.047 | 62.609 | 0.108 | 0.139 | 0.024 | 0.035 | 0.007 | nonzero | 4.046 | |
| pg18b1git_o2nofp.cx10cw16_c32r128 | 0.014 | 39.341 | 60.520 | 0.029 | 0.036 | 0.016 | 0.029 | 0.013 | nonzero | 4.536 | |
| pg18b1git_o2nofp.cx10cw32_c32r128 | nonzero | 33.425 | 66.181 | 0.095 | 0.099 | 0.038 | 0.091 | 0.071 | 3.492 |
Delete response time histogram: each cell has the percentage of responses that take <= the time in the header and max is the max response time in seconds. For the max column values in the top 25% of the range have a red background and in the bottom 25% of the range have a green background. The red background is not used when the min value is within 80% of the max value.
| dbms | 256us | 1ms | 4ms | 16ms | 64ms | 256ms | 1s | 4s | 16s | gt | max |
|---|---|---|---|---|---|---|---|---|---|---|---|
| pg18b1git_o2nofp.cx10cw2_c32r128 | 0.094 | 2.385 | 3.286 | 0.060 | 94.171 | 0.002 | 0.001 | nonzero | 1.232 | ||
| pg18b1git_o2nofp.cx10cw4_c32r128 | 0.104 | 2.314 | 4.971 | 0.190 | 92.417 | 0.003 | nonzero | nonzero | 1.394 | ||
| pg18b1git_o2nofp.cx10cw6_c32r128 | 0.049 | 1.555 | 2.080 | 0.579 | 95.735 | 0.001 | 0.001 | nonzero | 1.097 | ||
| pg18b1git_o2nofp.cx10cw8_c32r128 | 0.196 | 2.121 | 1.599 | 0.047 | 96.033 | 0.003 | 0.002 | nonzero | 1.663 | ||
| pg18b1git_o2nofp.cx10cw16_c32r128 | 0.241 | 1.271 | 0.002 | 0.020 | 98.464 | 0.002 | nonzero | nonzero | 2.111 | ||
| pg18b1git_o2nofp.cx10cw32_c32r128 | 0.338 | 99.659 | 0.001 | 0.002 | 0.001 | 2.740 |
Performance metrics for the DBMS listed above. Some are normalized by throughput, others are not. Legend for results is here.
ips	qps	rps	rmbps	wps	wmbps	rpq	rkbpq	wpi	wkbpi	csps	cpups	cspq	cpupq	dbgb1	dbgb2	rss	maxop	p50	p99	tag
2697	0	3468	33.8	5374.1	83.6	1.286	12.836	1.992	31.725	20871	29.7	7.738	5285	784.8	880.8	79.0	1.759	215	155	pg18b1git_o2nofp.cx10cw2_c32r128
2263	0	2867	26.7	4056.9	66.0	1.267	12.070	1.792	29.860	17533	34.9	7.746	7401	784.7	880.7	89.9	3.944	215	190	pg18b1git_o2nofp.cx10cw4_c32r128
2569	0	3186	27.7	4966.0	79.0	1.240	11.054	1.933	31.496	19661	29.2	7.652	5455	784.8	880.8	77.2	4.397	215	145	pg18b1git_o2nofp.cx10cw6_c32r128
2433	0	3253	34.0	4901.9	80.1	1.337	14.313	2.015	33.698	19419	28.9	7.981	5702	784.8	880.9	81.9	4.046	215	135	pg18b1git_o2nofp.cx10cw8_c32r128
2372	0	3097	31.8	4688.1	76.3	1.306	13.724	1.977	32.959	18685	31.3	7.878	6334	784.9	880.9	72.8	4.536	210	110	pg18b1git_o2nofp.cx10cw16_c32r128
2385	0	2959	23.5	4865.8	72.8	1.241	10.074	2.040	31.258	18438	25.5	7.731	5132	784.9	880.9	75.5	3.492	215	0	pg18b1git_o2nofp.cx10cw32_c32r128
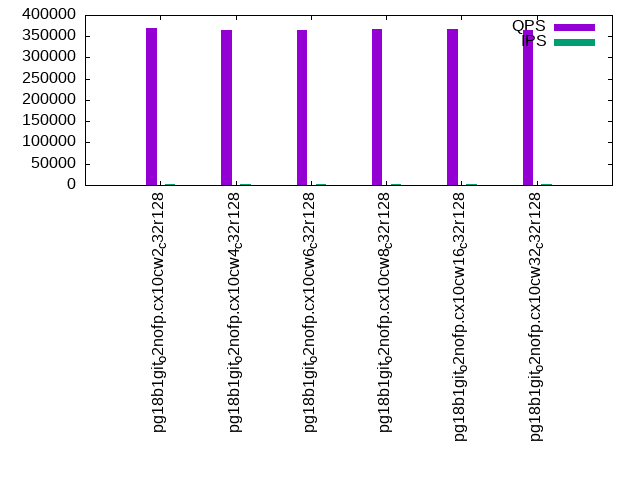
qr100.L1
qr100.L1: range queries with 100 insert/s per client. Graphs for performance per 1-second interval are here.
Average throughput:
Query response time histogram: each cell has the percentage of responses that take <= the time in the header and max is the max response time in seconds. For max values in the top 25% of the range have a red background and in the bottom 25% of the range have a green background. The red background is not used when the min value is within 80% of the max value.
| dbms | 256us | 1ms | 4ms | 16ms | 64ms | 256ms | 1s | 4s | 16s | gt | max |
|---|---|---|---|---|---|---|---|---|---|---|---|
| pg18b1git_o2nofp.cx10cw2_c32r128 | 99.993 | 0.006 | 0.001 | nonzero | nonzero | nonzero | 0.190 | ||||
| pg18b1git_o2nofp.cx10cw4_c32r128 | 99.993 | 0.006 | 0.001 | nonzero | nonzero | nonzero | nonzero | 0.283 | |||
| pg18b1git_o2nofp.cx10cw6_c32r128 | 99.993 | 0.006 | 0.001 | nonzero | nonzero | nonzero | 0.218 | ||||
| pg18b1git_o2nofp.cx10cw8_c32r128 | 99.992 | 0.007 | 0.001 | nonzero | nonzero | nonzero | 0.228 | ||||
| pg18b1git_o2nofp.cx10cw16_c32r128 | 99.992 | 0.007 | 0.001 | nonzero | nonzero | 0.059 | |||||
| pg18b1git_o2nofp.cx10cw32_c32r128 | 99.993 | 0.006 | 0.001 | nonzero | nonzero | nonzero | nonzero | 0.477 |
Insert response time histogram: each cell has the percentage of responses that take <= the time in the header and max is the max response time in seconds. For max values in the top 25% of the range have a red background and in the bottom 25% of the range have a green background. The red background is not used when the min value is within 80% of the max value.
| dbms | 256us | 1ms | 4ms | 16ms | 64ms | 256ms | 1s | 4s | 16s | gt | max |
|---|---|---|---|---|---|---|---|---|---|---|---|
| pg18b1git_o2nofp.cx10cw2_c32r128 | 98.785 | 1.183 | 0.028 | 0.004 | 0.386 | ||||||
| pg18b1git_o2nofp.cx10cw4_c32r128 | 98.447 | 1.553 | 0.063 | ||||||||
| pg18b1git_o2nofp.cx10cw6_c32r128 | 98.728 | 1.265 | 0.007 | 0.180 | |||||||
| pg18b1git_o2nofp.cx10cw8_c32r128 | 97.747 | 2.242 | 0.010 | 0.001 | 0.500 | ||||||
| pg18b1git_o2nofp.cx10cw16_c32r128 | 96.056 | 3.913 | 0.032 | 0.199 | |||||||
| pg18b1git_o2nofp.cx10cw32_c32r128 | 99.303 | 0.657 | 0.035 | 0.006 | 0.388 |
Delete response time histogram: each cell has the percentage of responses that take <= the time in the header and max is the max response time in seconds. For max values in the top 25% of the range have a red background and in the bottom 25% of the range have a green background. The red background is not used when the min value is within 80% of the max value.
| dbms | 256us | 1ms | 4ms | 16ms | 64ms | 256ms | 1s | 4s | 16s | gt | max |
|---|---|---|---|---|---|---|---|---|---|---|---|
| pg18b1git_o2nofp.cx10cw2_c32r128 | 47.119 | 52.817 | 0.064 | 0.013 | |||||||
| pg18b1git_o2nofp.cx10cw4_c32r128 | 46.374 | 53.583 | 0.040 | 0.003 | 0.018 | ||||||
| pg18b1git_o2nofp.cx10cw6_c32r128 | 43.446 | 56.464 | 0.088 | 0.003 | 0.029 | ||||||
| pg18b1git_o2nofp.cx10cw8_c32r128 | 43.722 | 56.199 | 0.079 | 0.014 | |||||||
| pg18b1git_o2nofp.cx10cw16_c32r128 | 47.047 | 52.865 | 0.088 | 0.015 | |||||||
| pg18b1git_o2nofp.cx10cw32_c32r128 | 42.683 | 57.250 | 0.064 | 0.001 | 0.001 | 0.121 |
Performance metrics for the DBMS listed above. Some are normalized by throughput, others are not. Legend for results is here.
ips	qps	rps	rmbps	wps	wmbps	rpq	rkbpq	wpi	wkbpi	csps	cpups	cspq	cpupq	dbgb1	dbgb2	rss	maxop	p50	p99	tag
1977	369931	2670	21.4	1253.5	36.3	0.007	0.059	0.634	18.786	1407752	43.2	3.805	56	785.0	881.1	95.7	0.190	18844	16915	pg18b1git_o2nofp.cx10cw2_c32r128
1977	365876	2667	21.4	1270.4	36.4	0.007	0.060	0.643	18.859	1392140	43.0	3.805	56	784.8	880.8	96.2	0.283	18739	16926	pg18b1git_o2nofp.cx10cw4_c32r128
1977	365755	2671	21.5	1278.4	36.5	0.007	0.060	0.647	18.898	1391644	43.1	3.805	57	784.9	881.0	96.2	0.218	18540	16654	pg18b1git_o2nofp.cx10cw6_c32r128
1976	367619	2668	21.5	1341.9	37.1	0.007	0.060	0.679	19.212	1399263	43.0	3.806	56	784.9	881.0	95.6	0.228	18604	16942	pg18b1git_o2nofp.cx10cw8_c32r128
1977	366520	2670	21.5	1295.9	36.7	0.007	0.060	0.656	18.987	1394745	43.2	3.805	57	785.0	881.0	95.7	0.059	18684	16894	pg18b1git_o2nofp.cx10cw16_c32r128
1977	364525	2664	21.4	1288.7	36.6	0.007	0.060	0.652	18.939	1387749	43.2	3.807	57	785.0	881.0	96.2	0.477	18604	16862	pg18b1git_o2nofp.cx10cw32_c32r128
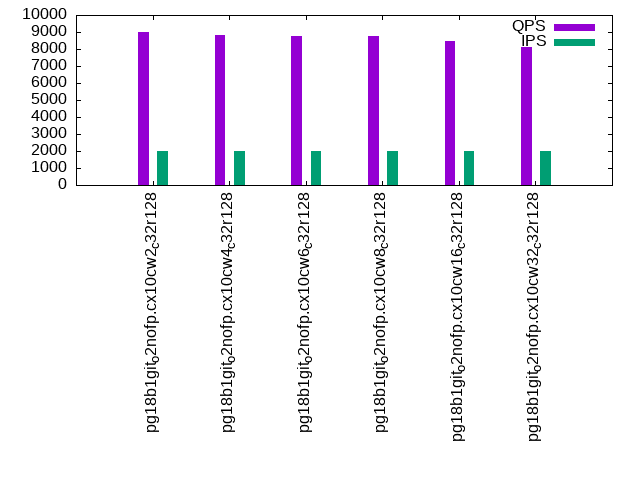
qp100.L2
qp100.L2: point queries with 100 insert/s per client. Graphs for performance per 1-second interval are here.
Average throughput:
Query response time histogram: each cell has the percentage of responses that take <= the time in the header and max is the max response time in seconds. For max values in the top 25% of the range have a red background and in the bottom 25% of the range have a green background. The red background is not used when the min value is within 80% of the max value.
| dbms | 256us | 1ms | 4ms | 16ms | 64ms | 256ms | 1s | 4s | 16s | gt | max |
|---|---|---|---|---|---|---|---|---|---|---|---|
| pg18b1git_o2nofp.cx10cw2_c32r128 | 2.628 | 94.426 | 0.415 | 2.529 | 0.001 | 0.001 | 0.001 | 3.119 | |||
| pg18b1git_o2nofp.cx10cw4_c32r128 | nonzero | 2.431 | 94.503 | 0.445 | 2.617 | 0.003 | 0.001 | 0.002 | 2.444 | ||
| pg18b1git_o2nofp.cx10cw6_c32r128 | 2.465 | 94.444 | 0.429 | 2.658 | 0.002 | 0.001 | 0.001 | 3.376 | |||
| pg18b1git_o2nofp.cx10cw8_c32r128 | nonzero | 2.473 | 94.345 | 0.564 | 2.612 | 0.003 | 0.001 | 0.002 | 3.804 | ||
| pg18b1git_o2nofp.cx10cw16_c32r128 | nonzero | 2.264 | 94.229 | 0.630 | 2.872 | 0.002 | 0.001 | 0.001 | 2.954 | ||
| pg18b1git_o2nofp.cx10cw32_c32r128 | nonzero | 2.025 | 93.827 | 0.950 | 3.194 | 0.002 | 0.001 | 0.001 | 3.127 |
Insert response time histogram: each cell has the percentage of responses that take <= the time in the header and max is the max response time in seconds. For max values in the top 25% of the range have a red background and in the bottom 25% of the range have a green background. The red background is not used when the min value is within 80% of the max value.
| dbms | 256us | 1ms | 4ms | 16ms | 64ms | 256ms | 1s | 4s | 16s | gt | max |
|---|---|---|---|---|---|---|---|---|---|---|---|
| pg18b1git_o2nofp.cx10cw2_c32r128 | 64.172 | 35.421 | 0.163 | 0.160 | 0.085 | 3.045 | |||||
| pg18b1git_o2nofp.cx10cw4_c32r128 | 60.053 | 39.215 | 0.217 | 0.321 | 0.194 | 2.133 | |||||
| pg18b1git_o2nofp.cx10cw6_c32r128 | 61.103 | 38.388 | 0.157 | 0.233 | 0.119 | 2.600 | |||||
| pg18b1git_o2nofp.cx10cw8_c32r128 | 60.001 | 39.314 | 0.147 | 0.257 | 0.281 | 3.284 | |||||
| pg18b1git_o2nofp.cx10cw16_c32r128 | 52.644 | 46.772 | 0.225 | 0.219 | 0.139 | 2.953 | |||||
| pg18b1git_o2nofp.cx10cw32_c32r128 | 52.718 | 46.585 | 0.321 | 0.186 | 0.190 | 2.735 |
Delete response time histogram: each cell has the percentage of responses that take <= the time in the header and max is the max response time in seconds. For max values in the top 25% of the range have a red background and in the bottom 25% of the range have a green background. The red background is not used when the min value is within 80% of the max value.
| dbms | 256us | 1ms | 4ms | 16ms | 64ms | 256ms | 1s | 4s | 16s | gt | max |
|---|---|---|---|---|---|---|---|---|---|---|---|
| pg18b1git_o2nofp.cx10cw2_c32r128 | 94.907 | 1.811 | 3.257 | 0.015 | 0.003 | 0.007 | 2.023 | ||||
| pg18b1git_o2nofp.cx10cw4_c32r128 | 91.811 | 4.603 | 3.519 | 0.026 | 0.029 | 0.011 | 2.099 | ||||
| pg18b1git_o2nofp.cx10cw6_c32r128 | 92.222 | 4.304 | 3.432 | 0.001 | 0.035 | 0.006 | 2.562 | ||||
| pg18b1git_o2nofp.cx10cw8_c32r128 | 92.831 | 4.217 | 2.913 | 0.013 | 0.015 | 0.013 | 2.193 | ||||
| pg18b1git_o2nofp.cx10cw16_c32r128 | 93.869 | 2.785 | 3.257 | 0.021 | 0.064 | 0.004 | 1.832 | ||||
| pg18b1git_o2nofp.cx10cw32_c32r128 | 91.860 | 4.533 | 3.499 | 0.068 | 0.029 | 0.011 | 2.398 |
Performance metrics for the DBMS listed above. Some are normalized by throughput, others are not. Legend for results is here.
ips	qps	rps	rmbps	wps	wmbps	rpq	rkbpq	wpi	wkbpi	csps	cpups	cspq	cpupq	dbgb1	dbgb2	rss	maxop	p50	p99	tag
1977	9001	125482	984.6	6769.8	77.5	13.941	112.014	3.424	40.128	283580	24.2	31.507	1291	785.3	881.4	90.9	3.119	463	240	pg18b1git_o2nofp.cx10cw2_c32r128
1976	8818	123157	966.7	6739.6	77.8	13.966	112.251	3.411	40.345	279052	24.1	31.645	1312	784.9	880.9	91.1	2.444	463	112	pg18b1git_o2nofp.cx10cw4_c32r128
1977	8794	122736	962.8	6712.7	77.0	13.957	112.120	3.396	39.878	278133	24.3	31.629	1326	785.0	881.1	91.2	3.376	448	144	pg18b1git_o2nofp.cx10cw6_c32r128
1976	8772	122514	961.0	6679.1	76.6	13.966	112.179	3.380	39.704	277872	23.7	31.676	1297	785.0	881.1	90.9	3.804	463	32	pg18b1git_o2nofp.cx10cw8_c32r128
1977	8456	118278	927.3	6693.2	76.7	13.987	112.288	3.386	39.746	269340	24.7	31.852	1402	785.0	881.1	90.8	2.954	432	192	pg18b1git_o2nofp.cx10cw16_c32r128
1976	8115	113819	891.5	6711.2	76.8	14.026	112.501	3.397	39.792	261165	25.5	32.183	1508	785.1	881.1	90.5	3.127	416	176	pg18b1git_o2nofp.cx10cw32_c32r128
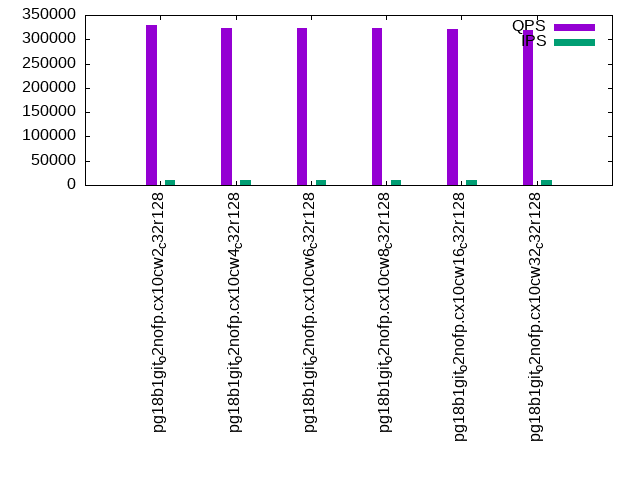
qr500.L3
qr500.L3: range queries with 500 insert/s per client. Graphs for performance per 1-second interval are here.
Average throughput:
Query response time histogram: each cell has the percentage of responses that take <= the time in the header and max is the max response time in seconds. For max values in the top 25% of the range have a red background and in the bottom 25% of the range have a green background. The red background is not used when the min value is within 80% of the max value.
| dbms | 256us | 1ms | 4ms | 16ms | 64ms | 256ms | 1s | 4s | 16s | gt | max |
|---|---|---|---|---|---|---|---|---|---|---|---|
| pg18b1git_o2nofp.cx10cw2_c32r128 | 99.969 | 0.024 | 0.005 | 0.001 | 0.001 | nonzero | nonzero | nonzero | 1.978 | ||
| pg18b1git_o2nofp.cx10cw4_c32r128 | 99.957 | 0.034 | 0.006 | 0.002 | 0.001 | nonzero | nonzero | nonzero | 1.783 | ||
| pg18b1git_o2nofp.cx10cw6_c32r128 | 99.958 | 0.033 | 0.006 | 0.002 | 0.001 | nonzero | nonzero | nonzero | 2.308 | ||
| pg18b1git_o2nofp.cx10cw8_c32r128 | 99.960 | 0.032 | 0.006 | 0.002 | 0.001 | nonzero | nonzero | nonzero | 1.933 | ||
| pg18b1git_o2nofp.cx10cw16_c32r128 | 99.955 | 0.035 | 0.007 | 0.002 | 0.001 | nonzero | nonzero | nonzero | 1.568 | ||
| pg18b1git_o2nofp.cx10cw32_c32r128 | 99.958 | 0.032 | 0.007 | 0.002 | 0.001 | nonzero | nonzero | nonzero | 1.911 |
Insert response time histogram: each cell has the percentage of responses that take <= the time in the header and max is the max response time in seconds. For max values in the top 25% of the range have a red background and in the bottom 25% of the range have a green background. The red background is not used when the min value is within 80% of the max value.
| dbms | 256us | 1ms | 4ms | 16ms | 64ms | 256ms | 1s | 4s | 16s | gt | max |
|---|---|---|---|---|---|---|---|---|---|---|---|
| pg18b1git_o2nofp.cx10cw2_c32r128 | 87.235 | 11.881 | 0.359 | 0.473 | 0.052 | 3.386 | |||||
| pg18b1git_o2nofp.cx10cw4_c32r128 | 79.210 | 19.996 | 0.410 | 0.348 | 0.036 | 1.992 | |||||
| pg18b1git_o2nofp.cx10cw6_c32r128 | 80.510 | 18.661 | 0.379 | 0.376 | 0.074 | 2.565 | |||||
| pg18b1git_o2nofp.cx10cw8_c32r128 | 80.981 | 18.149 | 0.400 | 0.371 | 0.099 | 2.273 | |||||
| pg18b1git_o2nofp.cx10cw16_c32r128 | 75.111 | 24.156 | 0.390 | 0.288 | 0.055 | 2.754 | |||||
| pg18b1git_o2nofp.cx10cw32_c32r128 | 80.849 | 18.352 | 0.416 | 0.276 | 0.107 | 2.646 |
Delete response time histogram: each cell has the percentage of responses that take <= the time in the header and max is the max response time in seconds. For max values in the top 25% of the range have a red background and in the bottom 25% of the range have a green background. The red background is not used when the min value is within 80% of the max value.
| dbms | 256us | 1ms | 4ms | 16ms | 64ms | 256ms | 1s | 4s | 16s | gt | max |
|---|---|---|---|---|---|---|---|---|---|---|---|
| pg18b1git_o2nofp.cx10cw2_c32r128 | 40.582 | 58.581 | 0.821 | 0.007 | 0.008 | 0.001 | 1.726 | ||||
| pg18b1git_o2nofp.cx10cw4_c32r128 | 35.861 | 62.660 | 1.458 | 0.007 | 0.009 | 0.004 | 1.893 | ||||
| pg18b1git_o2nofp.cx10cw6_c32r128 | 31.063 | 67.309 | 1.613 | 0.005 | 0.009 | 0.001 | 1.882 | ||||
| pg18b1git_o2nofp.cx10cw8_c32r128 | 34.033 | 64.462 | 1.483 | 0.009 | 0.008 | 0.005 | 2.154 | ||||
| pg18b1git_o2nofp.cx10cw16_c32r128 | 36.889 | 61.275 | 1.819 | 0.010 | 0.006 | 0.001 | 2.260 | ||||
| pg18b1git_o2nofp.cx10cw32_c32r128 | 30.335 | 67.704 | 1.938 | 0.008 | 0.010 | 0.005 | 2.091 |
Performance metrics for the DBMS listed above. Some are normalized by throughput, others are not. Legend for results is here.
ips	qps	rps	rmbps	wps	wmbps	rpq	rkbpq	wpi	wkbpi	csps	cpups	cspq	cpupq	dbgb1	dbgb2	rss	maxop	p50	p99	tag
9868	329729	13790	110.5	14432.9	242.8	0.042	0.343	1.463	25.192	1249152	48.8	3.788	71	786.7	882.8	87.3	1.978	16868	14289	pg18b1git_o2nofp.cx10cw2_c32r128
9868	322634	13808	111.3	14411.6	242.2	0.043	0.353	1.460	25.131	1209288	48.7	3.748	72	785.4	881.4	86.1	1.783	16558	14065	pg18b1git_o2nofp.cx10cw4_c32r128
9868	322853	13802	111.1	14413.8	242.4	0.043	0.352	1.461	25.148	1209673	49.1	3.747	73	785.7	881.8	86.3	2.308	16462	13959	pg18b1git_o2nofp.cx10cw6_c32r128
9868	324101	13808	111.3	14417.1	242.0	0.043	0.352	1.461	25.110	1218864	49.1	3.761	73	785.5	881.5	85.8	1.933	16404	13809	pg18b1git_o2nofp.cx10cw8_c32r128
9858	320333	13803	111.3	14401.7	242.1	0.043	0.356	1.461	25.150	1200727	49.1	3.748	74	785.4	881.5	86.0	1.568	16270	13761	pg18b1git_o2nofp.cx10cw16_c32r128
9858	319975	13802	111.1	14449.1	242.5	0.043	0.355	1.466	25.190	1201136	49.4	3.754	74	785.6	881.6	85.9	1.911	16143	13745	pg18b1git_o2nofp.cx10cw32_c32r128
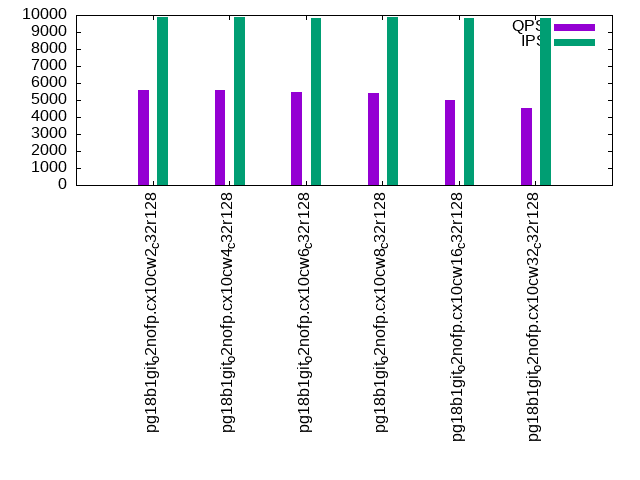
qp500.L4
qp500.L4: point queries with 500 insert/s per client. Graphs for performance per 1-second interval are here.
Average throughput:
Query response time histogram: each cell has the percentage of responses that take <= the time in the header and max is the max response time in seconds. For max values in the top 25% of the range have a red background and in the bottom 25% of the range have a green background. The red background is not used when the min value is within 80% of the max value.
| dbms | 256us | 1ms | 4ms | 16ms | 64ms | 256ms | 1s | 4s | 16s | gt | max |
|---|---|---|---|---|---|---|---|---|---|---|---|
| pg18b1git_o2nofp.cx10cw2_c32r128 | 0.222 | 93.773 | 1.399 | 4.584 | 0.012 | 0.008 | 0.003 | 2.334 | |||
| pg18b1git_o2nofp.cx10cw4_c32r128 | 0.207 | 93.899 | 1.173 | 4.689 | 0.019 | 0.011 | 0.001 | 2.640 | |||
| pg18b1git_o2nofp.cx10cw6_c32r128 | 0.202 | 93.548 | 1.430 | 4.792 | 0.016 | 0.011 | 0.001 | nonzero | 5.199 | ||
| pg18b1git_o2nofp.cx10cw8_c32r128 | 0.194 | 93.435 | 1.442 | 4.897 | 0.020 | 0.011 | 0.002 | 2.872 | |||
| pg18b1git_o2nofp.cx10cw16_c32r128 | 0.138 | 91.575 | 2.942 | 5.292 | 0.034 | 0.018 | 0.001 | nonzero | 5.365 | ||
| pg18b1git_o2nofp.cx10cw32_c32r128 | 0.094 | 89.425 | 4.029 | 6.386 | 0.042 | 0.023 | 0.001 | nonzero | 8.207 |
Insert response time histogram: each cell has the percentage of responses that take <= the time in the header and max is the max response time in seconds. For max values in the top 25% of the range have a red background and in the bottom 25% of the range have a green background. The red background is not used when the min value is within 80% of the max value.
| dbms | 256us | 1ms | 4ms | 16ms | 64ms | 256ms | 1s | 4s | 16s | gt | max |
|---|---|---|---|---|---|---|---|---|---|---|---|
| pg18b1git_o2nofp.cx10cw2_c32r128 | 37.164 | 61.968 | 0.565 | 0.211 | 0.093 | 2.368 | |||||
| pg18b1git_o2nofp.cx10cw4_c32r128 | 48.277 | 50.938 | 0.452 | 0.301 | 0.032 | 2.333 | |||||
| pg18b1git_o2nofp.cx10cw6_c32r128 | 39.637 | 59.510 | 0.527 | 0.274 | 0.045 | 0.006 | 5.085 | ||||
| pg18b1git_o2nofp.cx10cw8_c32r128 | 39.414 | 59.696 | 0.553 | 0.284 | 0.053 | 2.792 | |||||
| pg18b1git_o2nofp.cx10cw16_c32r128 | 20.813 | 76.796 | 1.776 | 0.557 | 0.053 | 0.006 | 5.578 | ||||
| pg18b1git_o2nofp.cx10cw32_c32r128 | 17.881 | 77.431 | 4.001 | 0.644 | 0.033 | 0.011 | 9.222 |
Delete response time histogram: each cell has the percentage of responses that take <= the time in the header and max is the max response time in seconds. For max values in the top 25% of the range have a red background and in the bottom 25% of the range have a green background. The red background is not used when the min value is within 80% of the max value.
| dbms | 256us | 1ms | 4ms | 16ms | 64ms | 256ms | 1s | 4s | 16s | gt | max |
|---|---|---|---|---|---|---|---|---|---|---|---|
| pg18b1git_o2nofp.cx10cw2_c32r128 | 67.555 | 32.152 | 0.129 | 0.129 | 0.035 | 2.084 | |||||
| pg18b1git_o2nofp.cx10cw4_c32r128 | 71.626 | 28.064 | 0.149 | 0.156 | 0.006 | 2.250 | |||||
| pg18b1git_o2nofp.cx10cw6_c32r128 | 69.581 | 30.071 | 0.178 | 0.154 | 0.015 | nonzero | 4.637 | ||||
| pg18b1git_o2nofp.cx10cw8_c32r128 | 70.166 | 29.515 | 0.178 | 0.132 | 0.009 | 2.702 | |||||
| pg18b1git_o2nofp.cx10cw16_c32r128 | 57.211 | 42.110 | 0.396 | 0.261 | 0.017 | 0.006 | 5.323 | ||||
| pg18b1git_o2nofp.cx10cw32_c32r128 | 61.488 | 37.557 | 0.658 | 0.285 | 0.011 | 0.001 | 8.346 |
Performance metrics for the DBMS listed above. Some are normalized by throughput, others are not. Legend for results is here.
ips	qps	rps	rmbps	wps	wmbps	rpq	rkbpq	wpi	wkbpi	csps	cpups	cspq	cpupq	dbgb1	dbgb2	rss	maxop	p50	p99	tag
9868	5608	99436	780.4	22354.8	300.9	17.730	142.497	2.265	31.223	230377	37.7	41.078	3227	788.2	884.3	29.3	2.334	288	96	pg18b1git_o2nofp.cx10cw2_c32r128
9879	5587	99331	779.7	22475.6	301.8	17.780	142.909	2.275	31.287	230669	37.7	41.290	3239	786.5	882.6	31.5	2.640	288	96	pg18b1git_o2nofp.cx10cw4_c32r128
9852	5482	97818	768.2	22320.2	300.1	17.844	143.496	2.266	31.192	228127	38.2	41.615	3345	786.5	882.5	31.2	5.199	288	80	pg18b1git_o2nofp.cx10cw6_c32r128
9858	5431	97097	762.4	22420.7	300.7	17.879	143.752	2.274	31.241	227200	38.1	41.836	3368	786.2	882.2	31.5	2.872	288	48	pg18b1git_o2nofp.cx10cw8_c32r128
9836	5002	91146	715.8	22282.5	298.8	18.221	146.520	2.265	31.103	219703	39.3	43.920	3771	786.0	882.0	30.8	5.365	256	48	pg18b1git_o2nofp.cx10cw16_c32r128
9815	4545	84746	665.3	22069.2	296.3	18.645	149.898	2.249	30.910	205566	41.2	45.227	4351	786.1	882.2	25.4	8.207	224	32	pg18b1git_o2nofp.cx10cw32_c32r128
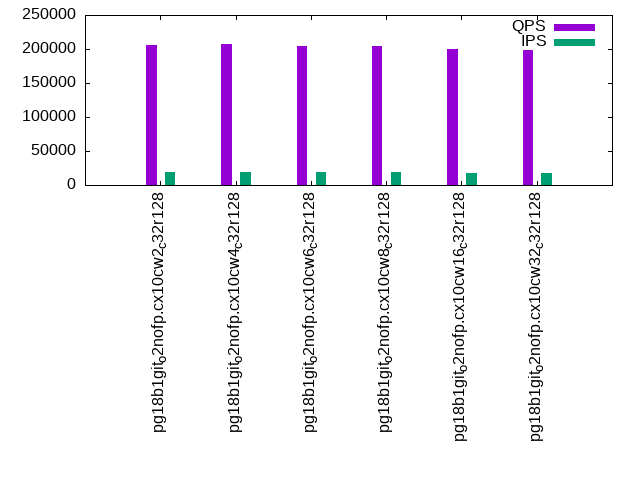
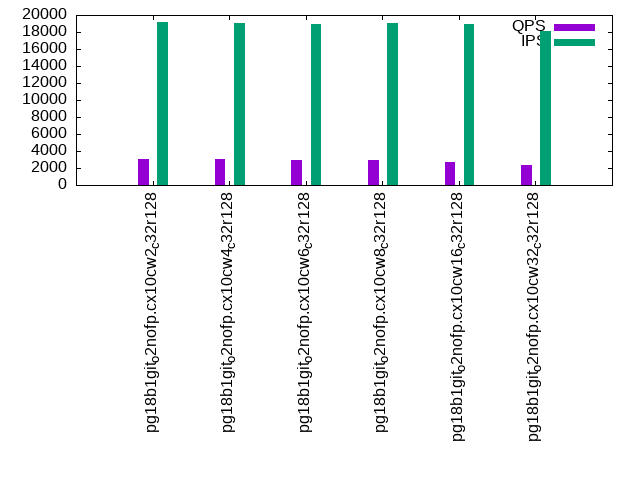
qr1000.L5
qr1000.L5: range queries with 1000 insert/s per client. Graphs for performance per 1-second interval are here.
Average throughput:
Query response time histogram: each cell has the percentage of responses that take <= the time in the header and max is the max response time in seconds. For max values in the top 25% of the range have a red background and in the bottom 25% of the range have a green background. The red background is not used when the min value is within 80% of the max value.
| dbms | 256us | 1ms | 4ms | 16ms | 64ms | 256ms | 1s | 4s | 16s | gt | max |
|---|---|---|---|---|---|---|---|---|---|---|---|
| pg18b1git_o2nofp.cx10cw2_c32r128 | 99.544 | 0.354 | 0.041 | 0.040 | 0.020 | nonzero | nonzero | nonzero | 2.818 | ||
| pg18b1git_o2nofp.cx10cw4_c32r128 | 99.562 | 0.342 | 0.040 | 0.038 | 0.018 | nonzero | nonzero | nonzero | 3.952 | ||
| pg18b1git_o2nofp.cx10cw6_c32r128 | 99.550 | 0.349 | 0.040 | 0.039 | 0.021 | nonzero | nonzero | nonzero | 1.967 | ||
| pg18b1git_o2nofp.cx10cw8_c32r128 | 99.548 | 0.349 | 0.041 | 0.041 | 0.021 | nonzero | nonzero | nonzero | 2.126 | ||
| pg18b1git_o2nofp.cx10cw16_c32r128 | 99.526 | 0.364 | 0.043 | 0.044 | 0.021 | nonzero | nonzero | nonzero | 2.069 | ||
| pg18b1git_o2nofp.cx10cw32_c32r128 | 99.509 | 0.373 | 0.047 | 0.048 | 0.022 | nonzero | nonzero | nonzero | 2.837 |
Insert response time histogram: each cell has the percentage of responses that take <= the time in the header and max is the max response time in seconds. For max values in the top 25% of the range have a red background and in the bottom 25% of the range have a green background. The red background is not used when the min value is within 80% of the max value.
| dbms | 256us | 1ms | 4ms | 16ms | 64ms | 256ms | 1s | 4s | 16s | gt | max |
|---|---|---|---|---|---|---|---|---|---|---|---|
| pg18b1git_o2nofp.cx10cw2_c32r128 | 36.730 | 48.079 | 14.999 | 0.096 | 0.095 | 3.463 | |||||
| pg18b1git_o2nofp.cx10cw4_c32r128 | 38.333 | 48.448 | 13.045 | 0.073 | 0.099 | 0.002 | 6.595 | ||||
| pg18b1git_o2nofp.cx10cw6_c32r128 | 37.472 | 47.364 | 14.999 | 0.074 | 0.090 | nonzero | 4.039 | ||||
| pg18b1git_o2nofp.cx10cw8_c32r128 | 35.697 | 48.392 | 15.723 | 0.081 | 0.106 | 0.002 | 5.161 | ||||
| pg18b1git_o2nofp.cx10cw16_c32r128 | 32.190 | 50.541 | 17.052 | 0.097 | 0.113 | 0.007 | 8.444 | ||||
| pg18b1git_o2nofp.cx10cw32_c32r128 | 30.520 | 49.642 | 19.582 | 0.166 | 0.087 | 0.003 | 7.697 |
Delete response time histogram: each cell has the percentage of responses that take <= the time in the header and max is the max response time in seconds. For max values in the top 25% of the range have a red background and in the bottom 25% of the range have a green background. The red background is not used when the min value is within 80% of the max value.
| dbms | 256us | 1ms | 4ms | 16ms | 64ms | 256ms | 1s | 4s | 16s | gt | max |
|---|---|---|---|---|---|---|---|---|---|---|---|
| pg18b1git_o2nofp.cx10cw2_c32r128 | 35.902 | 61.398 | 2.618 | 0.036 | 0.045 | 3.050 | |||||
| pg18b1git_o2nofp.cx10cw4_c32r128 | 35.435 | 62.349 | 2.136 | 0.025 | 0.055 | 3.920 | |||||
| pg18b1git_o2nofp.cx10cw6_c32r128 | 36.629 | 60.784 | 2.511 | 0.023 | 0.053 | 2.000 | |||||
| pg18b1git_o2nofp.cx10cw8_c32r128 | 36.062 | 61.203 | 2.638 | 0.043 | 0.053 | 2.128 | |||||
| pg18b1git_o2nofp.cx10cw16_c32r128 | 32.817 | 64.544 | 2.544 | 0.044 | 0.051 | 1.830 | |||||
| pg18b1git_o2nofp.cx10cw32_c32r128 | 30.939 | 66.261 | 2.676 | 0.084 | 0.040 | 3.050 |
Performance metrics for the DBMS listed above. Some are normalized by throughput, others are not. Legend for results is here.
ips	qps	rps	rmbps	wps	wmbps	rpq	rkbpq	wpi	wkbpi	csps	cpups	cspq	cpupq	dbgb1	dbgb2	rss	maxop	p50	p99	tag
18595	205202	24767	199.1	27197.3	568.9	0.121	0.994	1.463	31.331	676568	64.2	3.297	150	791.3	934.8	77.1	2.818	10658	1806	pg18b1git_o2nofp.cx10cw2_c32r128
18692	206986	24939	200.5	26613.1	559.4	0.120	0.992	1.424	30.646	680252	64.6	3.286	150	789.7	885.7	79.5	3.952	11000	671	pg18b1git_o2nofp.cx10cw4_c32r128
18614	204611	24828	199.5	26775.9	565.3	0.121	0.999	1.438	31.097	673905	64.6	3.294	152	789.6	938.0	78.3	1.967	10648	847	pg18b1git_o2nofp.cx10cw6_c32r128
18480	204173	24648	198.3	26902.3	565.7	0.121	0.994	1.456	31.345	671099	64.5	3.287	152	788.9	934.3	76.2	2.126	10665	1646	pg18b1git_o2nofp.cx10cw8_c32r128
18163	200698	24201	194.6	26590.5	557.9	0.121	0.993	1.464	31.452	655868	64.8	3.268	155	788.8	930.8	76.7	2.069	10421	1117	pg18b1git_o2nofp.cx10cw16_c32r128
18036	198266	24030	192.9	26369.5	558.3	0.121	0.996	1.462	31.696	639240	65.7	3.224	159	789.1	922.0	79.1	2.837	10144	2062	pg18b1git_o2nofp.cx10cw32_c32r128
qp1000.L6
qp1000.L6: point queries with 1000 insert/s per client. Graphs for performance per 1-second interval are here.
Average throughput:
Query response time histogram: each cell has the percentage of responses that take <= the time in the header and max is the max response time in seconds. For max values in the top 25% of the range have a red background and in the bottom 25% of the range have a green background. The red background is not used when the min value is within 80% of the max value.
| dbms | 256us | 1ms | 4ms | 16ms | 64ms | 256ms | 1s | 4s | 16s | gt | max |
|---|---|---|---|---|---|---|---|---|---|---|---|
| pg18b1git_o2nofp.cx10cw2_c32r128 | 0.002 | 72.974 | 18.856 | 8.017 | 0.097 | 0.051 | 0.002 | nonzero | 4.093 | ||
| pg18b1git_o2nofp.cx10cw4_c32r128 | 0.002 | 72.814 | 18.693 | 8.367 | 0.082 | 0.038 | 0.003 | 0.001 | 7.582 | ||
| pg18b1git_o2nofp.cx10cw6_c32r128 | 0.002 | 71.591 | 19.419 | 8.789 | 0.130 | 0.065 | 0.004 | 2.696 | |||
| pg18b1git_o2nofp.cx10cw8_c32r128 | 0.001 | 70.976 | 19.845 | 8.985 | 0.121 | 0.069 | 0.004 | 3.617 | |||
| pg18b1git_o2nofp.cx10cw16_c32r128 | 0.001 | 67.139 | 22.108 | 10.522 | 0.166 | 0.060 | 0.003 | nonzero | 4.090 | ||
| pg18b1git_o2nofp.cx10cw32_c32r128 | 0.001 | 62.619 | 23.440 | 13.616 | 0.253 | 0.069 | 0.003 | 1.465 |
Insert response time histogram: each cell has the percentage of responses that take <= the time in the header and max is the max response time in seconds. For max values in the top 25% of the range have a red background and in the bottom 25% of the range have a green background. The red background is not used when the min value is within 80% of the max value.
| dbms | 256us | 1ms | 4ms | 16ms | 64ms | 256ms | 1s | 4s | 16s | gt | max |
|---|---|---|---|---|---|---|---|---|---|---|---|
| pg18b1git_o2nofp.cx10cw2_c32r128 | 10.869 | 80.165 | 8.464 | 0.458 | 0.042 | 0.003 | 4.152 | ||||
| pg18b1git_o2nofp.cx10cw4_c32r128 | 11.228 | 79.839 | 8.539 | 0.354 | 0.036 | 0.004 | 7.247 | ||||
| pg18b1git_o2nofp.cx10cw6_c32r128 | 10.075 | 79.064 | 10.241 | 0.574 | 0.046 | 2.685 | |||||
| pg18b1git_o2nofp.cx10cw8_c32r128 | 9.615 | 80.057 | 9.709 | 0.565 | 0.054 | 3.676 | |||||
| pg18b1git_o2nofp.cx10cw16_c32r128 | 8.025 | 77.981 | 13.447 | 0.515 | 0.032 | 0.001 | 4.102 | ||||
| pg18b1git_o2nofp.cx10cw32_c32r128 | 6.437 | 69.861 | 23.076 | 0.599 | 0.027 | 1.566 |
Delete response time histogram: each cell has the percentage of responses that take <= the time in the header and max is the max response time in seconds. For max values in the top 25% of the range have a red background and in the bottom 25% of the range have a green background. The red background is not used when the min value is within 80% of the max value.
| dbms | 256us | 1ms | 4ms | 16ms | 64ms | 256ms | 1s | 4s | 16s | gt | max |
|---|---|---|---|---|---|---|---|---|---|---|---|
| pg18b1git_o2nofp.cx10cw2_c32r128 | 0.009 | 98.037 | 1.580 | 0.353 | 0.019 | 0.002 | 4.117 | ||||
| pg18b1git_o2nofp.cx10cw4_c32r128 | 0.009 | 98.281 | 1.433 | 0.254 | 0.022 | 3.413 | |||||
| pg18b1git_o2nofp.cx10cw6_c32r128 | 0.015 | 97.581 | 1.948 | 0.436 | 0.021 | 2.080 | |||||
| pg18b1git_o2nofp.cx10cw8_c32r128 | 0.010 | 97.697 | 1.820 | 0.451 | 0.022 | 3.600 | |||||
| pg18b1git_o2nofp.cx10cw16_c32r128 | 0.007 | 97.491 | 2.152 | 0.339 | 0.011 | 2.514 | |||||
| pg18b1git_o2nofp.cx10cw32_c32r128 | 0.005 | 97.049 | 2.626 | 0.308 | 0.012 | 1.485 |
Performance metrics for the DBMS listed above. Some are normalized by throughput, others are not. Legend for results is here.
ips	qps	rps	rmbps	wps	wmbps	rpq	rkbpq	wpi	wkbpi	csps	cpups	cspq	cpupq	dbgb1	dbgb2	rss	maxop	p50	p99	tag
19139	3114	81949	643.6	39545.6	576.0	26.316	211.628	2.066	30.817	194945	61.1	62.601	9418	795.7	891.7	58.9	4.093	160	32	pg18b1git_o2nofp.cx10cw2_c32r128
19048	3079	81202	637.7	39229.7	578.4	26.374	212.099	2.060	31.093	192190	61.7	62.424	9619	794.1	890.1	58.2	7.582	160	16	pg18b1git_o2nofp.cx10cw4_c32r128
18977	2944	79050	620.8	38763.0	567.8	26.854	215.949	2.043	30.639	186072	62.0	63.210	10110	794.0	890.0	61.7	2.696	144	32	pg18b1git_o2nofp.cx10cw6_c32r128
19027	2901	78494	616.5	38968.5	567.0	27.059	217.638	2.048	30.516	184876	61.9	63.733	10243	793.2	889.3	52.1	3.617	144	32	pg18b1git_o2nofp.cx10cw8_c32r128
18967	2666	74748	587.1	37815.8	558.1	28.037	225.518	1.994	30.129	175658	64.7	65.888	11649	793.1	889.1	57.9	4.090	128	32	pg18b1git_o2nofp.cx10cw16_c32r128
18072	2354	68257	536.1	36005.1	536.2	28.994	233.207	1.992	30.380	159853	66.2	67.901	13498	793.5	889.5	51.8	1.465	112	48	pg18b1git_o2nofp.cx10cw32_c32r128
l.i0
l.i0: load without secondary indexes
Performance metrics for all DBMS, not just the ones listed above. Some are normalized by throughput, others are not. Legend for results is here.
ips	qps	rps	rmbps	wps	wmbps	rpq	rkbpq	wpi	wkbpi	csps	cpups	cspq	cpupq	dbgb1	dbgb2	rss	maxop	p50	p99	tag
1983143	0	1702	13.6	8304.3	793.1	0.001	0.007	0.004	0.410	324892	55.0	0.164	13	382.7	478.8	91.5	1.575	108525	36260	pg18b1git_o2nofp.cx10cw2_c32r128
2041858	0	1678	13.5	8552.2	812.7	0.001	0.007	0.004	0.408	344523	56.7	0.169	13	382.7	478.8	93.6	1.365	110576	36860	pg18b1git_o2nofp.cx10cw4_c32r128
2037697	0	1755	14.1	8607.2	817.6	0.001	0.007	0.004	0.411	354470	56.8	0.174	13	382.7	478.8	92.5	2.298	111081	31965	pg18b1git_o2nofp.cx10cw6_c32r128
2019182	0	1745	14.0	8475.2	806.6	0.001	0.007	0.004	0.409	332152	55.9	0.164	13	382.7	478.8	91.2	0.978	110916	32365	pg18b1git_o2nofp.cx10cw8_c32r128
2054443	0	1717	13.8	8625.0	821.3	0.001	0.007	0.004	0.409	342544	57.4	0.167	13	382.7	478.8	93.2	1.405	111380	35395	pg18b1git_o2nofp.cx10cw16_c32r128
1986097	0	1719	13.8	8349.5	797.9	0.001	0.007	0.004	0.411	314516	55.5	0.158	13	382.7	478.8	90.8	1.302	108983	31666	pg18b1git_o2nofp.cx10cw32_c32r128
l.x
l.x: create secondary indexes
Performance metrics for all DBMS, not just the ones listed above. Some are normalized by throughput, others are not. Legend for results is here.
ips	qps	rps	rmbps	wps	wmbps	rpq	rkbpq	wpi	wkbpi	csps	cpups	cspq	cpupq	dbgb1	dbgb2	rss	maxop	p50	p99	tag
3225806	0	10846	1025.2	8328.2	919.7	0.003	0.325	0.003	0.292	89540	23.2	0.028	3	768.4	863.7	41.9	0.021	NA	NA	pg18b1git_o2nofp.cx10cw2_c32r128
3407155	0	11443	1082.0	8729.2	975.8	0.003	0.325	0.003	0.293	94770	23.7	0.028	3	768.4	863.7	46.5	0.114	NA	NA	pg18b1git_o2nofp.cx10cw4_c32r128
3372681	0	11295	1072.9	8644.0	962.6	0.003	0.326	0.003	0.292	96210	23.9	0.029	3	768.4	863.7	48.9	0.080	NA	NA	pg18b1git_o2nofp.cx10cw6_c32r128
3439381	0	11554	1095.7	8822.0	981.8	0.003	0.326	0.003	0.292	99132	24.8	0.029	3	768.4	863.7	59.7	0.037	NA	NA	pg18b1git_o2nofp.cx10cw8_c32r128
3626473	0	12097	1150.6	9167.0	1034.4	0.003	0.325	0.003	0.292	108480	26.5	0.030	4	768.4	863.7	53.1	0.284	NA	NA	pg18b1git_o2nofp.cx10cw16_c32r128
3593890	0	11942	1145.1	9197.0	1029.7	0.003	0.326	0.003	0.293	117007	27.2	0.033	4	768.4	863.7	55.1	0.249	NA	NA	pg18b1git_o2nofp.cx10cw32_c32r128
l.i1
l.i1: continue load after secondary indexes created with 50 inserts per transaction
Performance metrics for all DBMS, not just the ones listed above. Some are normalized by throughput, others are not. Legend for results is here.
ips	qps	rps	rmbps	wps	wmbps	rpq	rkbpq	wpi	wkbpi	csps	cpups	cspq	cpupq	dbgb1	dbgb2	rss	maxop	p50	p99	tag
24184	0	30502	242.8	35848.0	787.0	1.261	10.281	1.482	33.325	86671	29.8	3.584	591	781.5	921.4	81.8	3.790	1199	0	pg18b1git_o2nofp.cx10cw2_c32r128
23704	0	30066	240.6	35205.8	779.3	1.268	10.395	1.485	33.664	84821	30.8	3.578	624	781.5	877.6	89.9	3.797	1199	0	pg18b1git_o2nofp.cx10cw4_c32r128
23824	0	30091	239.8	35061.5	775.0	1.263	10.307	1.472	33.313	85309	30.7	3.581	619	781.5	877.6	84.8	3.416	1199	0	pg18b1git_o2nofp.cx10cw6_c32r128
23859	0	30153	239.7	35597.7	778.7	1.264	10.288	1.492	33.420	85119	29.9	3.568	602	781.5	877.6	85.9	4.509	1199	0	pg18b1git_o2nofp.cx10cw8_c32r128
23128	0	29362	233.9	34293.7	753.2	1.270	10.354	1.483	33.349	83140	32.5	3.595	675	781.5	877.6	83.8	3.323	1149	0	pg18b1git_o2nofp.cx10cw16_c32r128
22766	0	28829	229.9	33560.5	746.0	1.266	10.341	1.474	33.553	81065	30.9	3.561	651	781.5	920.7	76.0	5.672	1100	0	pg18b1git_o2nofp.cx10cw32_c32r128
l.i2
l.i2: continue load after secondary indexes created with 5 inserts per transaction
Performance metrics for all DBMS, not just the ones listed above. Some are normalized by throughput, others are not. Legend for results is here.
ips	qps	rps	rmbps	wps	wmbps	rpq	rkbpq	wpi	wkbpi	csps	cpups	cspq	cpupq	dbgb1	dbgb2	rss	maxop	p50	p99	tag
2697	0	3468	33.8	5374.1	83.6	1.286	12.836	1.992	31.725	20871	29.7	7.738	5285	784.8	880.8	79.0	1.759	215	155	pg18b1git_o2nofp.cx10cw2_c32r128
2263	0	2867	26.7	4056.9	66.0	1.267	12.070	1.792	29.860	17533	34.9	7.746	7401	784.7	880.7	89.9	3.944	215	190	pg18b1git_o2nofp.cx10cw4_c32r128
2569	0	3186	27.7	4966.0	79.0	1.240	11.054	1.933	31.496	19661	29.2	7.652	5455	784.8	880.8	77.2	4.397	215	145	pg18b1git_o2nofp.cx10cw6_c32r128
2433	0	3253	34.0	4901.9	80.1	1.337	14.313	2.015	33.698	19419	28.9	7.981	5702	784.8	880.9	81.9	4.046	215	135	pg18b1git_o2nofp.cx10cw8_c32r128
2372	0	3097	31.8	4688.1	76.3	1.306	13.724	1.977	32.959	18685	31.3	7.878	6334	784.9	880.9	72.8	4.536	210	110	pg18b1git_o2nofp.cx10cw16_c32r128
2385	0	2959	23.5	4865.8	72.8	1.241	10.074	2.040	31.258	18438	25.5	7.731	5132	784.9	880.9	75.5	3.492	215	0	pg18b1git_o2nofp.cx10cw32_c32r128
qr100.L1
qr100.L1: range queries with 100 insert/s per client
Performance metrics for all DBMS, not just the ones listed above. Some are normalized by throughput, others are not. Legend for results is here.
ips	qps	rps	rmbps	wps	wmbps	rpq	rkbpq	wpi	wkbpi	csps	cpups	cspq	cpupq	dbgb1	dbgb2	rss	maxop	p50	p99	tag
1977	369931	2670	21.4	1253.5	36.3	0.007	0.059	0.634	18.786	1407752	43.2	3.805	56	785.0	881.1	95.7	0.190	18844	16915	pg18b1git_o2nofp.cx10cw2_c32r128
1977	365876	2667	21.4	1270.4	36.4	0.007	0.060	0.643	18.859	1392140	43.0	3.805	56	784.8	880.8	96.2	0.283	18739	16926	pg18b1git_o2nofp.cx10cw4_c32r128
1977	365755	2671	21.5	1278.4	36.5	0.007	0.060	0.647	18.898	1391644	43.1	3.805	57	784.9	881.0	96.2	0.218	18540	16654	pg18b1git_o2nofp.cx10cw6_c32r128
1976	367619	2668	21.5	1341.9	37.1	0.007	0.060	0.679	19.212	1399263	43.0	3.806	56	784.9	881.0	95.6	0.228	18604	16942	pg18b1git_o2nofp.cx10cw8_c32r128
1977	366520	2670	21.5	1295.9	36.7	0.007	0.060	0.656	18.987	1394745	43.2	3.805	57	785.0	881.0	95.7	0.059	18684	16894	pg18b1git_o2nofp.cx10cw16_c32r128
1977	364525	2664	21.4	1288.7	36.6	0.007	0.060	0.652	18.939	1387749	43.2	3.807	57	785.0	881.0	96.2	0.477	18604	16862	pg18b1git_o2nofp.cx10cw32_c32r128
qp100.L2
qp100.L2: point queries with 100 insert/s per client
Performance metrics for all DBMS, not just the ones listed above. Some are normalized by throughput, others are not. Legend for results is here.
ips	qps	rps	rmbps	wps	wmbps	rpq	rkbpq	wpi	wkbpi	csps	cpups	cspq	cpupq	dbgb1	dbgb2	rss	maxop	p50	p99	tag
1977	9001	125482	984.6	6769.8	77.5	13.941	112.014	3.424	40.128	283580	24.2	31.507	1291	785.3	881.4	90.9	3.119	463	240	pg18b1git_o2nofp.cx10cw2_c32r128
1976	8818	123157	966.7	6739.6	77.8	13.966	112.251	3.411	40.345	279052	24.1	31.645	1312	784.9	880.9	91.1	2.444	463	112	pg18b1git_o2nofp.cx10cw4_c32r128
1977	8794	122736	962.8	6712.7	77.0	13.957	112.120	3.396	39.878	278133	24.3	31.629	1326	785.0	881.1	91.2	3.376	448	144	pg18b1git_o2nofp.cx10cw6_c32r128
1976	8772	122514	961.0	6679.1	76.6	13.966	112.179	3.380	39.704	277872	23.7	31.676	1297	785.0	881.1	90.9	3.804	463	32	pg18b1git_o2nofp.cx10cw8_c32r128
1977	8456	118278	927.3	6693.2	76.7	13.987	112.288	3.386	39.746	269340	24.7	31.852	1402	785.0	881.1	90.8	2.954	432	192	pg18b1git_o2nofp.cx10cw16_c32r128
1976	8115	113819	891.5	6711.2	76.8	14.026	112.501	3.397	39.792	261165	25.5	32.183	1508	785.1	881.1	90.5	3.127	416	176	pg18b1git_o2nofp.cx10cw32_c32r128
qr500.L3
qr500.L3: range queries with 500 insert/s per client
Performance metrics for all DBMS, not just the ones listed above. Some are normalized by throughput, others are not. Legend for results is here.
ips	qps	rps	rmbps	wps	wmbps	rpq	rkbpq	wpi	wkbpi	csps	cpups	cspq	cpupq	dbgb1	dbgb2	rss	maxop	p50	p99	tag
9868	329729	13790	110.5	14432.9	242.8	0.042	0.343	1.463	25.192	1249152	48.8	3.788	71	786.7	882.8	87.3	1.978	16868	14289	pg18b1git_o2nofp.cx10cw2_c32r128
9868	322634	13808	111.3	14411.6	242.2	0.043	0.353	1.460	25.131	1209288	48.7	3.748	72	785.4	881.4	86.1	1.783	16558	14065	pg18b1git_o2nofp.cx10cw4_c32r128
9868	322853	13802	111.1	14413.8	242.4	0.043	0.352	1.461	25.148	1209673	49.1	3.747	73	785.7	881.8	86.3	2.308	16462	13959	pg18b1git_o2nofp.cx10cw6_c32r128
9868	324101	13808	111.3	14417.1	242.0	0.043	0.352	1.461	25.110	1218864	49.1	3.761	73	785.5	881.5	85.8	1.933	16404	13809	pg18b1git_o2nofp.cx10cw8_c32r128
9858	320333	13803	111.3	14401.7	242.1	0.043	0.356	1.461	25.150	1200727	49.1	3.748	74	785.4	881.5	86.0	1.568	16270	13761	pg18b1git_o2nofp.cx10cw16_c32r128
9858	319975	13802	111.1	14449.1	242.5	0.043	0.355	1.466	25.190	1201136	49.4	3.754	74	785.6	881.6	85.9	1.911	16143	13745	pg18b1git_o2nofp.cx10cw32_c32r128
qp500.L4
qp500.L4: point queries with 500 insert/s per client
Performance metrics for all DBMS, not just the ones listed above. Some are normalized by throughput, others are not. Legend for results is here.
ips	qps	rps	rmbps	wps	wmbps	rpq	rkbpq	wpi	wkbpi	csps	cpups	cspq	cpupq	dbgb1	dbgb2	rss	maxop	p50	p99	tag
9868	5608	99436	780.4	22354.8	300.9	17.730	142.497	2.265	31.223	230377	37.7	41.078	3227	788.2	884.3	29.3	2.334	288	96	pg18b1git_o2nofp.cx10cw2_c32r128
9879	5587	99331	779.7	22475.6	301.8	17.780	142.909	2.275	31.287	230669	37.7	41.290	3239	786.5	882.6	31.5	2.640	288	96	pg18b1git_o2nofp.cx10cw4_c32r128
9852	5482	97818	768.2	22320.2	300.1	17.844	143.496	2.266	31.192	228127	38.2	41.615	3345	786.5	882.5	31.2	5.199	288	80	pg18b1git_o2nofp.cx10cw6_c32r128
9858	5431	97097	762.4	22420.7	300.7	17.879	143.752	2.274	31.241	227200	38.1	41.836	3368	786.2	882.2	31.5	2.872	288	48	pg18b1git_o2nofp.cx10cw8_c32r128
9836	5002	91146	715.8	22282.5	298.8	18.221	146.520	2.265	31.103	219703	39.3	43.920	3771	786.0	882.0	30.8	5.365	256	48	pg18b1git_o2nofp.cx10cw16_c32r128
9815	4545	84746	665.3	22069.2	296.3	18.645	149.898	2.249	30.910	205566	41.2	45.227	4351	786.1	882.2	25.4	8.207	224	32	pg18b1git_o2nofp.cx10cw32_c32r128
qr1000.L5
qr1000.L5: range queries with 1000 insert/s per client
Performance metrics for all DBMS, not just the ones listed above. Some are normalized by throughput, others are not. Legend for results is here.
ips	qps	rps	rmbps	wps	wmbps	rpq	rkbpq	wpi	wkbpi	csps	cpups	cspq	cpupq	dbgb1	dbgb2	rss	maxop	p50	p99	tag
18595	205202	24767	199.1	27197.3	568.9	0.121	0.994	1.463	31.331	676568	64.2	3.297	150	791.3	934.8	77.1	2.818	10658	1806	pg18b1git_o2nofp.cx10cw2_c32r128
18692	206986	24939	200.5	26613.1	559.4	0.120	0.992	1.424	30.646	680252	64.6	3.286	150	789.7	885.7	79.5	3.952	11000	671	pg18b1git_o2nofp.cx10cw4_c32r128
18614	204611	24828	199.5	26775.9	565.3	0.121	0.999	1.438	31.097	673905	64.6	3.294	152	789.6	938.0	78.3	1.967	10648	847	pg18b1git_o2nofp.cx10cw6_c32r128
18480	204173	24648	198.3	26902.3	565.7	0.121	0.994	1.456	31.345	671099	64.5	3.287	152	788.9	934.3	76.2	2.126	10665	1646	pg18b1git_o2nofp.cx10cw8_c32r128
18163	200698	24201	194.6	26590.5	557.9	0.121	0.993	1.464	31.452	655868	64.8	3.268	155	788.8	930.8	76.7	2.069	10421	1117	pg18b1git_o2nofp.cx10cw16_c32r128
18036	198266	24030	192.9	26369.5	558.3	0.121	0.996	1.462	31.696	639240	65.7	3.224	159	789.1	922.0	79.1	2.837	10144	2062	pg18b1git_o2nofp.cx10cw32_c32r128
qp1000.L6
qp1000.L6: point queries with 1000 insert/s per client
Performance metrics for all DBMS, not just the ones listed above. Some are normalized by throughput, others are not. Legend for results is here.
ips	qps	rps	rmbps	wps	wmbps	rpq	rkbpq	wpi	wkbpi	csps	cpups	cspq	cpupq	dbgb1	dbgb2	rss	maxop	p50	p99	tag
19139	3114	81949	643.6	39545.6	576.0	26.316	211.628	2.066	30.817	194945	61.1	62.601	9418	795.7	891.7	58.9	4.093	160	32	pg18b1git_o2nofp.cx10cw2_c32r128
19048	3079	81202	637.7	39229.7	578.4	26.374	212.099	2.060	31.093	192190	61.7	62.424	9619	794.1	890.1	58.2	7.582	160	16	pg18b1git_o2nofp.cx10cw4_c32r128
18977	2944	79050	620.8	38763.0	567.8	26.854	215.949	2.043	30.639	186072	62.0	63.210	10110	794.0	890.0	61.7	2.696	144	32	pg18b1git_o2nofp.cx10cw6_c32r128
19027	2901	78494	616.5	38968.5	567.0	27.059	217.638	2.048	30.516	184876	61.9	63.733	10243	793.2	889.3	52.1	3.617	144	32	pg18b1git_o2nofp.cx10cw8_c32r128
18967	2666	74748	587.1	37815.8	558.1	28.037	225.518	1.994	30.129	175658	64.7	65.888	11649	793.1	889.1	57.9	4.090	128	32	pg18b1git_o2nofp.cx10cw16_c32r128
18072	2354	68257	536.1	36005.1	536.2	28.994	233.207	1.992	30.380	159853	66.2	67.901	13498	793.5	889.5	51.8	1.465	112	48	pg18b1git_o2nofp.cx10cw32_c32r128
l.i0
- l.i0: load without secondary indexes
- Legend for results is here.
- Each entry lists the percentage of responses that fit in that bucket (slower than max time for previous bucket, faster than min time for next bucket).
Insert response time histogram
256us	1ms	4ms	16ms	64ms	256ms	1s	4s	16s	gt	max	tag
0.000	88.965	10.278	0.656	0.088	0.008	0.006	nonzero	0.000	0.000	1.575	pg18b1git_o2nofp.cx10cw2_c32r128
0.000	90.358	9.210	0.324	0.096	0.005	0.006	nonzero	0.000	0.000	1.365	pg18b1git_o2nofp.cx10cw4_c32r128
0.000	90.316	9.254	0.331	0.087	0.005	0.006	nonzero	0.000	0.000	2.298	pg18b1git_o2nofp.cx10cw6_c32r128
0.000	90.185	9.244	0.462	0.095	0.007	0.007	0.000	0.000	0.000	0.978	pg18b1git_o2nofp.cx10cw8_c32r128
0.000	91.026	8.590	0.288	0.084	0.006	0.006	nonzero	0.000	0.000	1.405	pg18b1git_o2nofp.cx10cw16_c32r128
0.000	89.882	9.482	0.528	0.094	0.006	0.007	nonzero	0.000	0.000	1.302	pg18b1git_o2nofp.cx10cw32_c32r128
l.x
- l.x: create secondary indexes
- Legend for results is here.
- Each entry lists the percentage of responses that fit in that bucket (slower than max time for previous bucket, faster than min time for next bucket).
TODO - determine whether there is data for create index response time
l.i1
- l.i1: continue load after secondary indexes created with 50 inserts per transaction
- Legend for results is here.
- Each entry lists the percentage of responses that fit in that bucket (slower than max time for previous bucket, faster than min time for next bucket).
Insert response time histogram
256us	1ms	4ms	16ms	64ms	256ms	1s	4s	16s	gt	max	tag
0.000	0.000	0.000	15.513	73.455	10.821	0.087	0.123	0.000	0.000	3.790	pg18b1git_o2nofp.cx10cw2_c32r128
0.000	0.000	0.000	17.045	72.482	10.279	0.077	0.117	0.000	0.000	3.797	pg18b1git_o2nofp.cx10cw4_c32r128
0.000	0.000	0.000	15.895	73.265	10.666	0.064	0.109	0.000	0.000	3.416	pg18b1git_o2nofp.cx10cw6_c32r128
0.000	0.000	0.000	15.387	73.539	10.888	0.064	0.122	nonzero	0.000	4.509	pg18b1git_o2nofp.cx10cw8_c32r128
0.000	0.000	0.000	15.735	71.544	12.533	0.064	0.125	0.000	0.000	3.323	pg18b1git_o2nofp.cx10cw16_c32r128
0.000	0.000	0.000	13.313	70.912	15.562	0.101	0.111	0.001	0.000	5.672	pg18b1git_o2nofp.cx10cw32_c32r128
Delete response time histogram
256us	1ms	4ms	16ms	64ms	256ms	1s	4s	16s	gt	max	tag
0.000	2.368	9.271	24.109	63.138	1.014	0.032	0.068	0.000	0.000	3.465	pg18b1git_o2nofp.cx10cw2_c32r128
0.000	2.435	8.627	24.347	62.836	1.659	0.034	0.062	0.000	0.000	2.752	pg18b1git_o2nofp.cx10cw4_c32r128
0.000	2.453	8.527	24.078	63.185	1.657	0.027	0.073	0.000	0.000	2.628	pg18b1git_o2nofp.cx10cw6_c32r128
0.000	2.487	8.172	25.636	62.478	1.126	0.028	0.073	0.000	0.000	2.579	pg18b1git_o2nofp.cx10cw8_c32r128
0.000	2.446	9.037	22.090	63.874	2.443	0.031	0.078	0.000	0.000	2.206	pg18b1git_o2nofp.cx10cw16_c32r128
0.000	2.364	8.048	25.909	61.843	1.730	0.052	0.054	0.000	0.000	2.705	pg18b1git_o2nofp.cx10cw32_c32r128
l.i2
- l.i2: continue load after secondary indexes created with 5 inserts per transaction
- Legend for results is here.
- Each entry lists the percentage of responses that fit in that bucket (slower than max time for previous bucket, faster than min time for next bucket).
Insert response time histogram
256us	1ms	4ms	16ms	64ms	256ms	1s	4s	16s	gt	max	tag
0.238	36.854	62.670	0.059	0.111	0.025	0.038	0.005	0.000	0.000	1.759	pg18b1git_o2nofp.cx10cw2_c32r128
0.150	36.556	63.115	0.069	0.091	0.010	0.007	0.002	0.000	0.000	3.944	pg18b1git_o2nofp.cx10cw4_c32r128
0.068	36.274	63.454	0.038	0.102	0.023	0.034	0.007	nonzero	0.000	4.397	pg18b1git_o2nofp.cx10cw6_c32r128
0.031	37.047	62.609	0.108	0.139	0.024	0.035	0.007	nonzero	0.000	4.046	pg18b1git_o2nofp.cx10cw8_c32r128
0.014	39.341	60.520	0.029	0.036	0.016	0.029	0.013	nonzero	0.000	4.536	pg18b1git_o2nofp.cx10cw16_c32r128
nonzero	33.425	66.181	0.095	0.099	0.038	0.091	0.071	0.000	0.000	3.492	pg18b1git_o2nofp.cx10cw32_c32r128
Delete response time histogram
256us	1ms	4ms	16ms	64ms	256ms	1s	4s	16s	gt	max	tag
0.094	2.385	3.286	0.060	94.171	0.002	0.001	nonzero	0.000	0.000	1.232	pg18b1git_o2nofp.cx10cw2_c32r128
0.104	2.314	4.971	0.190	92.417	0.003	nonzero	nonzero	0.000	0.000	1.394	pg18b1git_o2nofp.cx10cw4_c32r128
0.049	1.555	2.080	0.579	95.735	0.001	0.001	nonzero	0.000	0.000	1.097	pg18b1git_o2nofp.cx10cw6_c32r128
0.196	2.121	1.599	0.047	96.033	0.003	0.002	nonzero	0.000	0.000	1.663	pg18b1git_o2nofp.cx10cw8_c32r128
0.241	1.271	0.002	0.020	98.464	0.002	nonzero	nonzero	0.000	0.000	2.111	pg18b1git_o2nofp.cx10cw16_c32r128
0.000	0.000	0.000	0.338	99.659	0.001	0.002	0.001	0.000	0.000	2.740	pg18b1git_o2nofp.cx10cw32_c32r128
qr100.L1
- qr100.L1: range queries with 100 insert/s per client
- Legend for results is here.
- Each entry lists the percentage of responses that fit in that bucket (slower than max time for previous bucket, faster than min time for next bucket).
Query response time histogram
256us	1ms	4ms	16ms	64ms	256ms	1s	4s	16s	gt	max	tag
99.993	0.006	0.001	nonzero	nonzero	nonzero	0.000	0.000	0.000	0.000	0.190	pg18b1git_o2nofp.cx10cw2_c32r128
99.993	0.006	0.001	nonzero	nonzero	nonzero	nonzero	0.000	0.000	0.000	0.283	pg18b1git_o2nofp.cx10cw4_c32r128
99.993	0.006	0.001	nonzero	nonzero	nonzero	0.000	0.000	0.000	0.000	0.218	pg18b1git_o2nofp.cx10cw6_c32r128
99.992	0.007	0.001	nonzero	nonzero	nonzero	0.000	0.000	0.000	0.000	0.228	pg18b1git_o2nofp.cx10cw8_c32r128
99.992	0.007	0.001	nonzero	nonzero	0.000	0.000	0.000	0.000	0.000	0.059	pg18b1git_o2nofp.cx10cw16_c32r128
99.993	0.006	0.001	nonzero	nonzero	nonzero	nonzero	0.000	0.000	0.000	0.477	pg18b1git_o2nofp.cx10cw32_c32r128
Insert response time histogram
256us	1ms	4ms	16ms	64ms	256ms	1s	4s	16s	gt	max	tag
0.000	0.000	0.000	98.785	1.183	0.028	0.004	0.000	0.000	0.000	0.386	pg18b1git_o2nofp.cx10cw2_c32r128
0.000	0.000	0.000	98.447	1.553	0.000	0.000	0.000	0.000	0.000	0.063	pg18b1git_o2nofp.cx10cw4_c32r128
0.000	0.000	0.000	98.728	1.265	0.007	0.000	0.000	0.000	0.000	0.180	pg18b1git_o2nofp.cx10cw6_c32r128
0.000	0.000	0.000	97.747	2.242	0.010	0.001	0.000	0.000	0.000	0.500	pg18b1git_o2nofp.cx10cw8_c32r128
0.000	0.000	0.000	96.056	3.913	0.032	0.000	0.000	0.000	0.000	0.199	pg18b1git_o2nofp.cx10cw16_c32r128
0.000	0.000	0.000	99.303	0.657	0.035	0.006	0.000	0.000	0.000	0.388	pg18b1git_o2nofp.cx10cw32_c32r128
Delete response time histogram
256us	1ms	4ms	16ms	64ms	256ms	1s	4s	16s	gt	max	tag
0.000	47.119	52.817	0.064	0.000	0.000	0.000	0.000	0.000	0.000	0.013	pg18b1git_o2nofp.cx10cw2_c32r128
0.000	46.374	53.583	0.040	0.003	0.000	0.000	0.000	0.000	0.000	0.018	pg18b1git_o2nofp.cx10cw4_c32r128
0.000	43.446	56.464	0.088	0.003	0.000	0.000	0.000	0.000	0.000	0.029	pg18b1git_o2nofp.cx10cw6_c32r128
0.000	43.722	56.199	0.079	0.000	0.000	0.000	0.000	0.000	0.000	0.014	pg18b1git_o2nofp.cx10cw8_c32r128
0.000	47.047	52.865	0.088	0.000	0.000	0.000	0.000	0.000	0.000	0.015	pg18b1git_o2nofp.cx10cw16_c32r128
0.000	42.683	57.250	0.064	0.001	0.001	0.000	0.000	0.000	0.000	0.121	pg18b1git_o2nofp.cx10cw32_c32r128
qp100.L2
- qp100.L2: point queries with 100 insert/s per client
- Legend for results is here.
- Each entry lists the percentage of responses that fit in that bucket (slower than max time for previous bucket, faster than min time for next bucket).
Query response time histogram
256us	1ms	4ms	16ms	64ms	256ms	1s	4s	16s	gt	max	tag
0.000	2.628	94.426	0.415	2.529	0.001	0.001	0.001	0.000	0.000	3.119	pg18b1git_o2nofp.cx10cw2_c32r128
nonzero	2.431	94.503	0.445	2.617	0.003	0.001	0.002	0.000	0.000	2.444	pg18b1git_o2nofp.cx10cw4_c32r128
0.000	2.465	94.444	0.429	2.658	0.002	0.001	0.001	0.000	0.000	3.376	pg18b1git_o2nofp.cx10cw6_c32r128
nonzero	2.473	94.345	0.564	2.612	0.003	0.001	0.002	0.000	0.000	3.804	pg18b1git_o2nofp.cx10cw8_c32r128
nonzero	2.264	94.229	0.630	2.872	0.002	0.001	0.001	0.000	0.000	2.954	pg18b1git_o2nofp.cx10cw16_c32r128
nonzero	2.025	93.827	0.950	3.194	0.002	0.001	0.001	0.000	0.000	3.127	pg18b1git_o2nofp.cx10cw32_c32r128
Insert response time histogram
256us	1ms	4ms	16ms	64ms	256ms	1s	4s	16s	gt	max	tag
0.000	0.000	0.000	64.172	35.421	0.163	0.160	0.085	0.000	0.000	3.045	pg18b1git_o2nofp.cx10cw2_c32r128
0.000	0.000	0.000	60.053	39.215	0.217	0.321	0.194	0.000	0.000	2.133	pg18b1git_o2nofp.cx10cw4_c32r128
0.000	0.000	0.000	61.103	38.388	0.157	0.233	0.119	0.000	0.000	2.600	pg18b1git_o2nofp.cx10cw6_c32r128
0.000	0.000	0.000	60.001	39.314	0.147	0.257	0.281	0.000	0.000	3.284	pg18b1git_o2nofp.cx10cw8_c32r128
0.000	0.000	0.000	52.644	46.772	0.225	0.219	0.139	0.000	0.000	2.953	pg18b1git_o2nofp.cx10cw16_c32r128
0.000	0.000	0.000	52.718	46.585	0.321	0.186	0.190	0.000	0.000	2.735	pg18b1git_o2nofp.cx10cw32_c32r128
Delete response time histogram
256us	1ms	4ms	16ms	64ms	256ms	1s	4s	16s	gt	max	tag
0.000	0.000	94.907	1.811	3.257	0.015	0.003	0.007	0.000	0.000	2.023	pg18b1git_o2nofp.cx10cw2_c32r128
0.000	0.000	91.811	4.603	3.519	0.026	0.029	0.011	0.000	0.000	2.099	pg18b1git_o2nofp.cx10cw4_c32r128
0.000	0.000	92.222	4.304	3.432	0.001	0.035	0.006	0.000	0.000	2.562	pg18b1git_o2nofp.cx10cw6_c32r128
0.000	0.000	92.831	4.217	2.913	0.013	0.015	0.013	0.000	0.000	2.193	pg18b1git_o2nofp.cx10cw8_c32r128
0.000	0.000	93.869	2.785	3.257	0.021	0.064	0.004	0.000	0.000	1.832	pg18b1git_o2nofp.cx10cw16_c32r128
0.000	0.000	91.860	4.533	3.499	0.068	0.029	0.011	0.000	0.000	2.398	pg18b1git_o2nofp.cx10cw32_c32r128
qr500.L3
- qr500.L3: range queries with 500 insert/s per client
- Legend for results is here.
- Each entry lists the percentage of responses that fit in that bucket (slower than max time for previous bucket, faster than min time for next bucket).
Query response time histogram
256us	1ms	4ms	16ms	64ms	256ms	1s	4s	16s	gt	max	tag
99.969	0.024	0.005	0.001	0.001	nonzero	nonzero	nonzero	0.000	0.000	1.978	pg18b1git_o2nofp.cx10cw2_c32r128
99.957	0.034	0.006	0.002	0.001	nonzero	nonzero	nonzero	0.000	0.000	1.783	pg18b1git_o2nofp.cx10cw4_c32r128
99.958	0.033	0.006	0.002	0.001	nonzero	nonzero	nonzero	0.000	0.000	2.308	pg18b1git_o2nofp.cx10cw6_c32r128
99.960	0.032	0.006	0.002	0.001	nonzero	nonzero	nonzero	0.000	0.000	1.933	pg18b1git_o2nofp.cx10cw8_c32r128
99.955	0.035	0.007	0.002	0.001	nonzero	nonzero	nonzero	0.000	0.000	1.568	pg18b1git_o2nofp.cx10cw16_c32r128
99.958	0.032	0.007	0.002	0.001	nonzero	nonzero	nonzero	0.000	0.000	1.911	pg18b1git_o2nofp.cx10cw32_c32r128
Insert response time histogram
256us	1ms	4ms	16ms	64ms	256ms	1s	4s	16s	gt	max	tag
0.000	0.000	0.000	87.235	11.881	0.359	0.473	0.052	0.000	0.000	3.386	pg18b1git_o2nofp.cx10cw2_c32r128
0.000	0.000	0.000	79.210	19.996	0.410	0.348	0.036	0.000	0.000	1.992	pg18b1git_o2nofp.cx10cw4_c32r128
0.000	0.000	0.000	80.510	18.661	0.379	0.376	0.074	0.000	0.000	2.565	pg18b1git_o2nofp.cx10cw6_c32r128
0.000	0.000	0.000	80.981	18.149	0.400	0.371	0.099	0.000	0.000	2.273	pg18b1git_o2nofp.cx10cw8_c32r128
0.000	0.000	0.000	75.111	24.156	0.390	0.288	0.055	0.000	0.000	2.754	pg18b1git_o2nofp.cx10cw16_c32r128
0.000	0.000	0.000	80.849	18.352	0.416	0.276	0.107	0.000	0.000	2.646	pg18b1git_o2nofp.cx10cw32_c32r128
Delete response time histogram
256us	1ms	4ms	16ms	64ms	256ms	1s	4s	16s	gt	max	tag
0.000	0.000	40.582	58.581	0.821	0.007	0.008	0.001	0.000	0.000	1.726	pg18b1git_o2nofp.cx10cw2_c32r128
0.000	0.000	35.861	62.660	1.458	0.007	0.009	0.004	0.000	0.000	1.893	pg18b1git_o2nofp.cx10cw4_c32r128
0.000	0.000	31.063	67.309	1.613	0.005	0.009	0.001	0.000	0.000	1.882	pg18b1git_o2nofp.cx10cw6_c32r128
0.000	0.000	34.033	64.462	1.483	0.009	0.008	0.005	0.000	0.000	2.154	pg18b1git_o2nofp.cx10cw8_c32r128
0.000	0.000	36.889	61.275	1.819	0.010	0.006	0.001	0.000	0.000	2.260	pg18b1git_o2nofp.cx10cw16_c32r128
0.000	0.000	30.335	67.704	1.938	0.008	0.010	0.005	0.000	0.000	2.091	pg18b1git_o2nofp.cx10cw32_c32r128
qp500.L4
- qp500.L4: point queries with 500 insert/s per client
- Legend for results is here.
- Each entry lists the percentage of responses that fit in that bucket (slower than max time for previous bucket, faster than min time for next bucket).
Query response time histogram
256us	1ms	4ms	16ms	64ms	256ms	1s	4s	16s	gt	max	tag
0.000	0.222	93.773	1.399	4.584	0.012	0.008	0.003	0.000	0.000	2.334	pg18b1git_o2nofp.cx10cw2_c32r128
0.000	0.207	93.899	1.173	4.689	0.019	0.011	0.001	0.000	0.000	2.640	pg18b1git_o2nofp.cx10cw4_c32r128
0.000	0.202	93.548	1.430	4.792	0.016	0.011	0.001	nonzero	0.000	5.199	pg18b1git_o2nofp.cx10cw6_c32r128
0.000	0.194	93.435	1.442	4.897	0.020	0.011	0.002	0.000	0.000	2.872	pg18b1git_o2nofp.cx10cw8_c32r128
0.000	0.138	91.575	2.942	5.292	0.034	0.018	0.001	nonzero	0.000	5.365	pg18b1git_o2nofp.cx10cw16_c32r128
0.000	0.094	89.425	4.029	6.386	0.042	0.023	0.001	nonzero	0.000	8.207	pg18b1git_o2nofp.cx10cw32_c32r128
Insert response time histogram
256us	1ms	4ms	16ms	64ms	256ms	1s	4s	16s	gt	max	tag
0.000	0.000	0.000	37.164	61.968	0.565	0.211	0.093	0.000	0.000	2.368	pg18b1git_o2nofp.cx10cw2_c32r128
0.000	0.000	0.000	48.277	50.938	0.452	0.301	0.032	0.000	0.000	2.333	pg18b1git_o2nofp.cx10cw4_c32r128
0.000	0.000	0.000	39.637	59.510	0.527	0.274	0.045	0.006	0.000	5.085	pg18b1git_o2nofp.cx10cw6_c32r128
0.000	0.000	0.000	39.414	59.696	0.553	0.284	0.053	0.000	0.000	2.792	pg18b1git_o2nofp.cx10cw8_c32r128
0.000	0.000	0.000	20.813	76.796	1.776	0.557	0.053	0.006	0.000	5.578	pg18b1git_o2nofp.cx10cw16_c32r128
0.000	0.000	0.000	17.881	77.431	4.001	0.644	0.033	0.011	0.000	9.222	pg18b1git_o2nofp.cx10cw32_c32r128
Delete response time histogram
256us	1ms	4ms	16ms	64ms	256ms	1s	4s	16s	gt	max	tag
0.000	0.000	0.000	67.555	32.152	0.129	0.129	0.035	0.000	0.000	2.084	pg18b1git_o2nofp.cx10cw2_c32r128
0.000	0.000	0.000	71.626	28.064	0.149	0.156	0.006	0.000	0.000	2.250	pg18b1git_o2nofp.cx10cw4_c32r128
0.000	0.000	0.000	69.581	30.071	0.178	0.154	0.015	nonzero	0.000	4.637	pg18b1git_o2nofp.cx10cw6_c32r128
0.000	0.000	0.000	70.166	29.515	0.178	0.132	0.009	0.000	0.000	2.702	pg18b1git_o2nofp.cx10cw8_c32r128
0.000	0.000	0.000	57.211	42.110	0.396	0.261	0.017	0.006	0.000	5.323	pg18b1git_o2nofp.cx10cw16_c32r128
0.000	0.000	0.000	61.488	37.557	0.658	0.285	0.011	0.001	0.000	8.346	pg18b1git_o2nofp.cx10cw32_c32r128
qr1000.L5
- qr1000.L5: range queries with 1000 insert/s per client
- Legend for results is here.
- Each entry lists the percentage of responses that fit in that bucket (slower than max time for previous bucket, faster than min time for next bucket).
Query response time histogram
256us	1ms	4ms	16ms	64ms	256ms	1s	4s	16s	gt	max	tag
99.544	0.354	0.041	0.040	0.020	nonzero	nonzero	nonzero	0.000	0.000	2.818	pg18b1git_o2nofp.cx10cw2_c32r128
99.562	0.342	0.040	0.038	0.018	nonzero	nonzero	nonzero	0.000	0.000	3.952	pg18b1git_o2nofp.cx10cw4_c32r128
99.550	0.349	0.040	0.039	0.021	nonzero	nonzero	nonzero	0.000	0.000	1.967	pg18b1git_o2nofp.cx10cw6_c32r128
99.548	0.349	0.041	0.041	0.021	nonzero	nonzero	nonzero	0.000	0.000	2.126	pg18b1git_o2nofp.cx10cw8_c32r128
99.526	0.364	0.043	0.044	0.021	nonzero	nonzero	nonzero	0.000	0.000	2.069	pg18b1git_o2nofp.cx10cw16_c32r128
99.509	0.373	0.047	0.048	0.022	nonzero	nonzero	nonzero	0.000	0.000	2.837	pg18b1git_o2nofp.cx10cw32_c32r128
Insert response time histogram
256us	1ms	4ms	16ms	64ms	256ms	1s	4s	16s	gt	max	tag
0.000	0.000	0.000	36.730	48.079	14.999	0.096	0.095	0.000	0.000	3.463	pg18b1git_o2nofp.cx10cw2_c32r128
0.000	0.000	0.000	38.333	48.448	13.045	0.073	0.099	0.002	0.000	6.595	pg18b1git_o2nofp.cx10cw4_c32r128
0.000	0.000	0.000	37.472	47.364	14.999	0.074	0.090	nonzero	0.000	4.039	pg18b1git_o2nofp.cx10cw6_c32r128
0.000	0.000	0.000	35.697	48.392	15.723	0.081	0.106	0.002	0.000	5.161	pg18b1git_o2nofp.cx10cw8_c32r128
0.000	0.000	0.000	32.190	50.541	17.052	0.097	0.113	0.007	0.000	8.444	pg18b1git_o2nofp.cx10cw16_c32r128
0.000	0.000	0.000	30.520	49.642	19.582	0.166	0.087	0.003	0.000	7.697	pg18b1git_o2nofp.cx10cw32_c32r128
Delete response time histogram
256us	1ms	4ms	16ms	64ms	256ms	1s	4s	16s	gt	max	tag
0.000	0.000	0.000	35.902	61.398	2.618	0.036	0.045	0.000	0.000	3.050	pg18b1git_o2nofp.cx10cw2_c32r128
0.000	0.000	0.000	35.435	62.349	2.136	0.025	0.055	0.000	0.000	3.920	pg18b1git_o2nofp.cx10cw4_c32r128
0.000	0.000	0.000	36.629	60.784	2.511	0.023	0.053	0.000	0.000	2.000	pg18b1git_o2nofp.cx10cw6_c32r128
0.000	0.000	0.000	36.062	61.203	2.638	0.043	0.053	0.000	0.000	2.128	pg18b1git_o2nofp.cx10cw8_c32r128
0.000	0.000	0.000	32.817	64.544	2.544	0.044	0.051	0.000	0.000	1.830	pg18b1git_o2nofp.cx10cw16_c32r128
0.000	0.000	0.000	30.939	66.261	2.676	0.084	0.040	0.000	0.000	3.050	pg18b1git_o2nofp.cx10cw32_c32r128
qp1000.L6
- qp1000.L6: point queries with 1000 insert/s per client
- Legend for results is here.
- Each entry lists the percentage of responses that fit in that bucket (slower than max time for previous bucket, faster than min time for next bucket).
Query response time histogram
256us	1ms	4ms	16ms	64ms	256ms	1s	4s	16s	gt	max	tag
0.000	0.002	72.974	18.856	8.017	0.097	0.051	0.002	nonzero	0.000	4.093	pg18b1git_o2nofp.cx10cw2_c32r128
0.000	0.002	72.814	18.693	8.367	0.082	0.038	0.003	0.001	0.000	7.582	pg18b1git_o2nofp.cx10cw4_c32r128
0.000	0.002	71.591	19.419	8.789	0.130	0.065	0.004	0.000	0.000	2.696	pg18b1git_o2nofp.cx10cw6_c32r128
0.000	0.001	70.976	19.845	8.985	0.121	0.069	0.004	0.000	0.000	3.617	pg18b1git_o2nofp.cx10cw8_c32r128
0.000	0.001	67.139	22.108	10.522	0.166	0.060	0.003	nonzero	0.000	4.090	pg18b1git_o2nofp.cx10cw16_c32r128
0.000	0.001	62.619	23.440	13.616	0.253	0.069	0.003	0.000	0.000	1.465	pg18b1git_o2nofp.cx10cw32_c32r128
Insert response time histogram
256us	1ms	4ms	16ms	64ms	256ms	1s	4s	16s	gt	max	tag
0.000	0.000	0.000	10.869	80.165	8.464	0.458	0.042	0.003	0.000	4.152	pg18b1git_o2nofp.cx10cw2_c32r128
0.000	0.000	0.000	11.228	79.839	8.539	0.354	0.036	0.004	0.000	7.247	pg18b1git_o2nofp.cx10cw4_c32r128
0.000	0.000	0.000	10.075	79.064	10.241	0.574	0.046	0.000	0.000	2.685	pg18b1git_o2nofp.cx10cw6_c32r128
0.000	0.000	0.000	9.615	80.057	9.709	0.565	0.054	0.000	0.000	3.676	pg18b1git_o2nofp.cx10cw8_c32r128
0.000	0.000	0.000	8.025	77.981	13.447	0.515	0.032	0.001	0.000	4.102	pg18b1git_o2nofp.cx10cw16_c32r128
0.000	0.000	0.000	6.437	69.861	23.076	0.599	0.027	0.000	0.000	1.566	pg18b1git_o2nofp.cx10cw32_c32r128
Delete response time histogram
256us	1ms	4ms	16ms	64ms	256ms	1s	4s	16s	gt	max	tag
0.000	0.000	0.000	0.009	98.037	1.580	0.353	0.019	0.002	0.000	4.117	pg18b1git_o2nofp.cx10cw2_c32r128
0.000	0.000	0.000	0.009	98.281	1.433	0.254	0.022	0.000	0.000	3.413	pg18b1git_o2nofp.cx10cw4_c32r128
0.000	0.000	0.000	0.015	97.581	1.948	0.436	0.021	0.000	0.000	2.080	pg18b1git_o2nofp.cx10cw6_c32r128
0.000	0.000	0.000	0.010	97.697	1.820	0.451	0.022	0.000	0.000	3.600	pg18b1git_o2nofp.cx10cw8_c32r128
0.000	0.000	0.000	0.007	97.491	2.152	0.339	0.011	0.000	0.000	2.514	pg18b1git_o2nofp.cx10cw16_c32r128
0.000	0.000	0.000	0.005	97.049	2.626	0.308	0.012	0.000	0.000	1.485	pg18b1git_o2nofp.cx10cw32_c32r128