Introduction
This is a report for the insert benchmark with 800M docs and 1 client(s). It is generated by scripts (bash, awk, sed) and Tufte might not be impressed. An overview of the insert benchmark is here and a short update is here. Below, by DBMS, I mean DBMS+version.config. An example is my8020.c10b40 where my means MySQL, 8020 is version 8.0.20 and c10b40 is the name for the configuration file.
The test server has 8 AMD cores, 32G RAM and an NVMe SSD. It is described here as the PN53. The benchmark was run with 1 client and there were 1 or 3 connections per client (1 for queries or inserts without rate limits, 1+1 for rate limited inserts+deletes). It uses 1 table. It loads 800M rows per table without secondary indexes, creates 3 secondary indexes per table, then inserts 4m+1m rows per table with a delete per insert to avoid growing the table. It then does 6 read+write tests for 1800s each that do queries as fast as possible with 100,100,500,500,1000,1000 inserts/s and the same for deletes/s per client concurrent with the queries. The database is larger than memory. Clients and the DBMS share one server. The per-database configs are in the per-database subdirectories here.
The tested DBMS are:
- pg175_o2nofp.cx10a_c8r32 - Postgres 17.5 with the cx10a_c8r32 config
- pg18beta1_o2nofp.cx10b_c8r32 - Postgres 18 beta1 with the cx10b_c8r32 config that uses io_method=sync
- pg18beta1_o2nofp.cx10c_c8r32 - Postgres 18 beta1 with the cx10b_c8r32 config that uses io_method=worker and io_workers=16
- pg18beta1_o2nofp.cx10d_c8r32 - Postgres 18 beta1 with the cx10b_c8r32 config that uses io_method=io_uring
Contents
- Summary
- l.i0: load without secondary indexes
- l.x: create secondary indexes
- l.i1: continue load after secondary indexes created with 50 inserts per transaction
- l.i2: continue load after secondary indexes created with 5 inserts per transaction
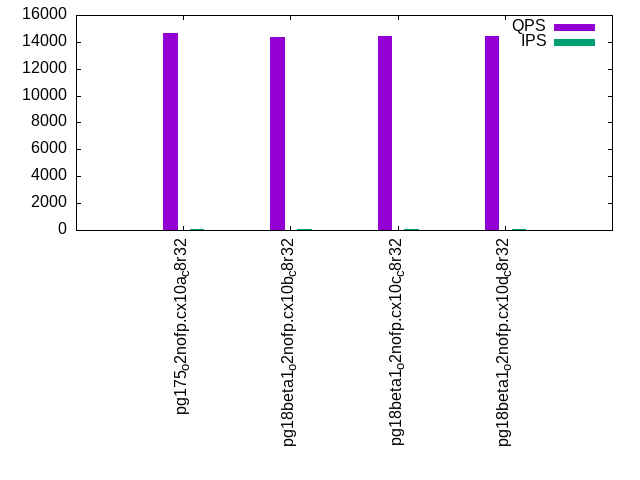
- qr100.L1: range queries with 100 insert/s per client
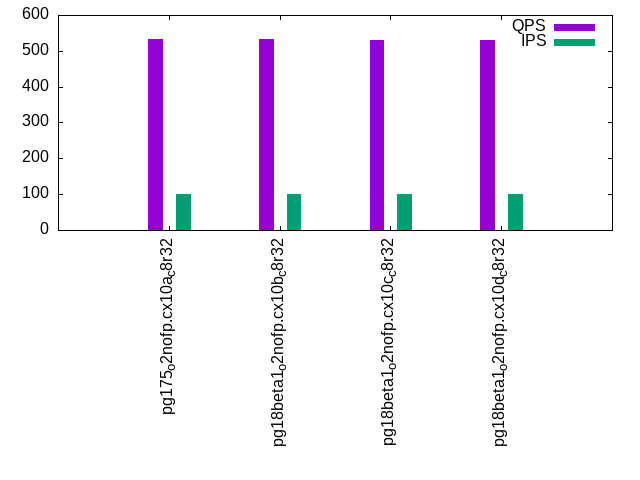
- qp100.L2: point queries with 100 insert/s per client
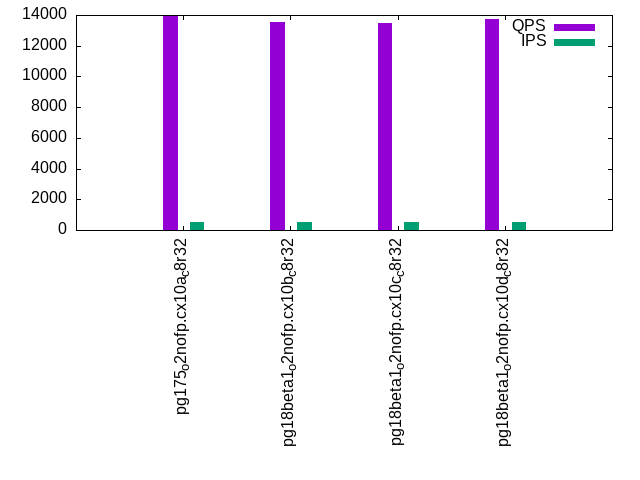
- qr500.L3: range queries with 500 insert/s per client
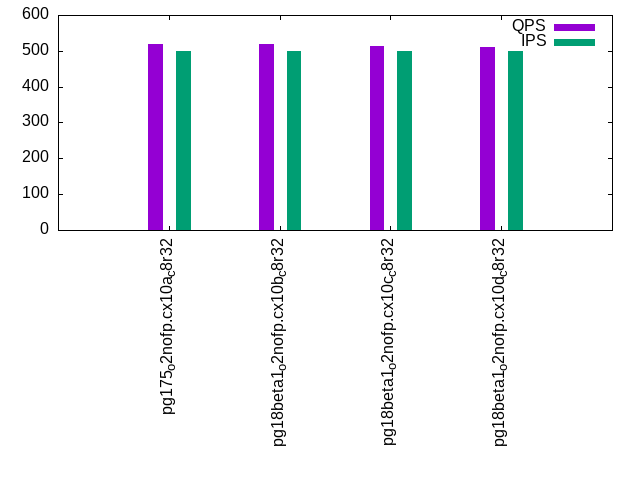
- qp500.L4: point queries with 500 insert/s per client
- qr1000.L5: range queries with 1000 insert/s per client
- qp1000.L6: point queries with 1000 insert/s per client
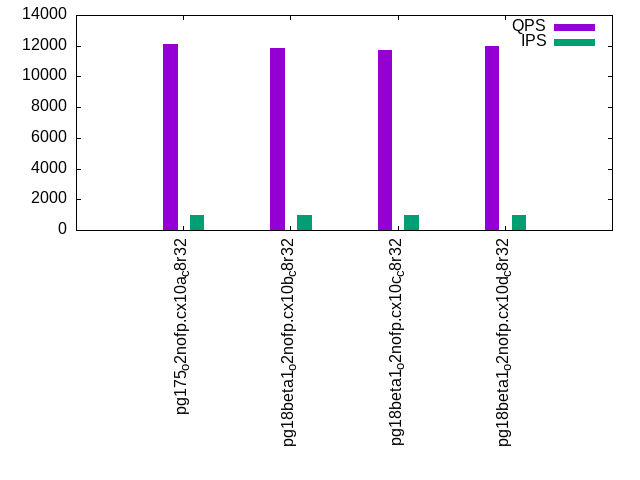
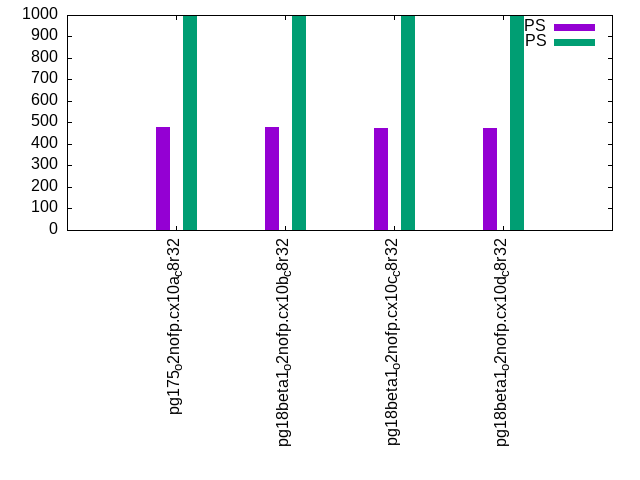
Summary
The numbers are inserts/s for l.i0, l.i1 and l.i2, indexed docs (or rows) /s for l.x and queries/s for qr100, qp100 thru qr1000, qp1000" The values are the average rate over the entire test for inserts (IPS) and queries (QPS). The range of values for IPS and QPS is split into 3 parts: bottom 25%, middle 50%, top 25%. Values in the bottom 25% have a red background, values in the top 25% have a green background and values in the middle have no color. A gray background is used for values that can be ignored because the DBMS did not sustain the target insert rate. Red backgrounds are not used when the minimum value is within 80% of the max value.
| dbms | l.i0 | l.x | l.i1 | l.i2 | qr100 | qp100 | qr500 | qp500 | qr1000 | qp1000 |
|---|---|---|---|---|---|---|---|---|---|---|
| pg175_o2nofp.cx10a_c8r32 | 144613 | 313357 | 3170 | 161 | 14660 | 532 | 13906 | 518 | 12081 | 481 |
| pg18beta1_o2nofp.cx10b_c8r32 | 144404 | 314465 | 3021 | 158 | 14343 | 534 | 13556 | 518 | 11871 | 478 |
| pg18beta1_o2nofp.cx10c_c8r32 | 142857 | 320384 | 3108 | 154 | 14445 | 529 | 13466 | 513 | 11699 | 473 |
| pg18beta1_o2nofp.cx10d_c8r32 | 144092 | 312867 | 3142 | 158 | 14446 | 530 | 13708 | 512 | 11982 | 473 |
This table has relative throughput, throughput for the DBMS relative to the DBMS in the first line, using the absolute throughput from the previous table. Values less than 0.95 have a yellow background. Values greater than 1.05 have a blue background.
| dbms | l.i0 | l.x | l.i1 | l.i2 | qr100 | qp100 | qr500 | qp500 | qr1000 | qp1000 |
|---|---|---|---|---|---|---|---|---|---|---|
| pg175_o2nofp.cx10a_c8r32 | 1.00 | 1.00 | 1.00 | 1.00 | 1.00 | 1.00 | 1.00 | 1.00 | 1.00 | 1.00 |
| pg18beta1_o2nofp.cx10b_c8r32 | 1.00 | 1.00 | 0.95 | 0.98 | 0.98 | 1.00 | 0.97 | 1.00 | 0.98 | 0.99 |
| pg18beta1_o2nofp.cx10c_c8r32 | 0.99 | 1.02 | 0.98 | 0.96 | 0.99 | 0.99 | 0.97 | 0.99 | 0.97 | 0.98 |
| pg18beta1_o2nofp.cx10d_c8r32 | 1.00 | 1.00 | 0.99 | 0.98 | 0.99 | 1.00 | 0.99 | 0.99 | 0.99 | 0.98 |
This lists the average rate of inserts/s for the tests that do inserts concurrent with queries. For such tests the query rate is listed in the table above. The read+write tests are setup so that the insert rate should match the target rate every second. Cells that are not at least 95% of the target have a red background to indicate a failure to satisfy the target.
| dbms | qr100.L1 | qp100.L2 | qr500.L3 | qp500.L4 | qr1000.L5 | qp1000.L6 |
|---|---|---|---|---|---|---|
| pg175_o2nofp.cx10a_c8r32 | 100 | 100 | 500 | 500 | 999 | 999 |
| pg18beta1_o2nofp.cx10b_c8r32 | 100 | 100 | 500 | 500 | 999 | 999 |
| pg18beta1_o2nofp.cx10c_c8r32 | 100 | 100 | 500 | 500 | 999 | 999 |
| pg18beta1_o2nofp.cx10d_c8r32 | 100 | 100 | 500 | 500 | 999 | 999 |
| target | 100 | 100 | 500 | 500 | 1000 | 1000 |
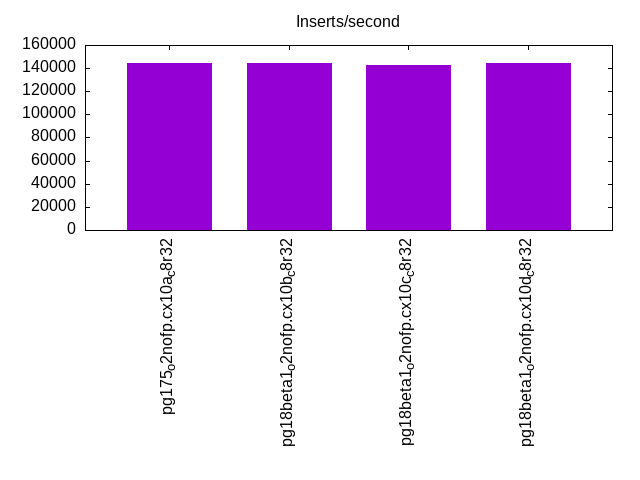
l.i0
l.i0: load without secondary indexes. Graphs for performance per 1-second interval are here.
Average throughput:
Insert response time histogram: each cell has the percentage of responses that take <= the time in the header and max is the max response time in seconds. For the max column values in the top 25% of the range have a red background and in the bottom 25% of the range have a green background. The red background is not used when the min value is within 80% of the max value.
| dbms | 256us | 1ms | 4ms | 16ms | 64ms | 256ms | 1s | 4s | 16s | gt | max |
|---|---|---|---|---|---|---|---|---|---|---|---|
| pg175_o2nofp.cx10a_c8r32 | 99.974 | 0.021 | 0.003 | 0.001 | nonzero | 0.072 | |||||
| pg18beta1_o2nofp.cx10b_c8r32 | 99.972 | 0.023 | 0.004 | 0.001 | 0.040 | ||||||
| pg18beta1_o2nofp.cx10c_c8r32 | 99.837 | 0.155 | 0.006 | 0.002 | nonzero | 0.069 | |||||
| pg18beta1_o2nofp.cx10d_c8r32 | 99.968 | 0.026 | 0.005 | 0.001 | 0.047 |
Performance metrics for the DBMS listed above. Some are normalized by throughput, others are not. Legend for results is here.
ips	qps	rps	rmbps	wps	wmbps	rpq	rkbpq	wpi	wkbpi	csps	cpups	cspq	cpupq	dbgb1	dbgb2	rss	maxop	p50	p99	tag
144613	0	25	0.2	540.5	59.4	0.000	0.001	0.004	0.421	14417	20.5	0.100	11	76.5	116.6	18.2	0.072	145480	140883	pg175_o2nofp.cx10a_c8r32
144404	0	25	0.2	539.0	59.3	0.000	0.001	0.004	0.421	14394	20.4	0.100	11	76.5	116.6	18.4	0.040	145282	140780	pg18beta1_o2nofp.cx10b_c8r32
142857	0	24	0.2	532.2	58.5	0.000	0.001	0.004	0.419	14651	20.7	0.103	12	76.5	116.6	18.5	0.069	143081	132682	pg18beta1_o2nofp.cx10c_c8r32
144092	0	26	0.2	540.4	59.4	0.000	0.001	0.004	0.422	14461	20.5	0.100	11	76.5	116.6	18.9	0.047	144982	140681	pg18beta1_o2nofp.cx10d_c8r32
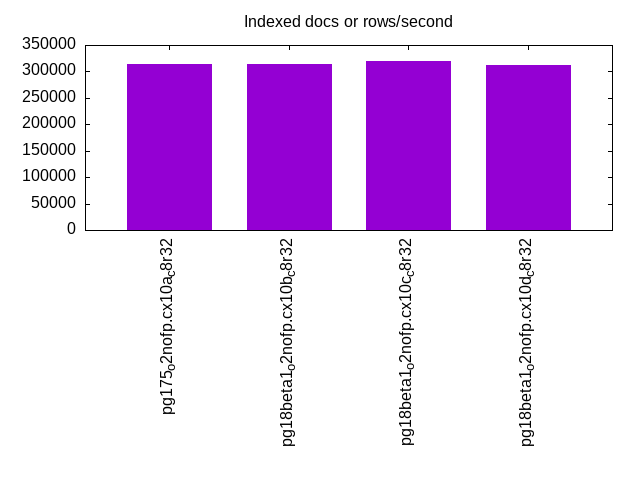
l.x
l.x: create secondary indexes.
Average throughput:
Performance metrics for the DBMS listed above. Some are normalized by throughput, others are not. Legend for results is here.
ips	qps	rps	rmbps	wps	wmbps	rpq	rkbpq	wpi	wkbpi	csps	cpups	cspq	cpupq	dbgb1	dbgb2	rss	maxop	p50	p99	tag
313357	0	849	105.5	998.0	116.9	0.003	0.345	0.003	0.382	474	12.9	0.002	3	153.6	193.7	23.4	0.004	NA	NA	pg175_o2nofp.cx10a_c8r32
314465	0	852	105.9	1001.6	117.1	0.003	0.345	0.003	0.381	449	13.0	0.001	3	153.6	193.7	23.4	0.005	NA	NA	pg18beta1_o2nofp.cx10b_c8r32
320384	0	868	107.8	1010.4	119.7	0.003	0.345	0.003	0.382	1270	13.4	0.004	3	153.6	193.7	23.4	0.003	NA	NA	pg18beta1_o2nofp.cx10c_c8r32
312867	0	848	105.3	996.8	116.8	0.003	0.345	0.003	0.382	999	13.4	0.003	3	153.6	193.7	23.4	0.003	NA	NA	pg18beta1_o2nofp.cx10d_c8r32
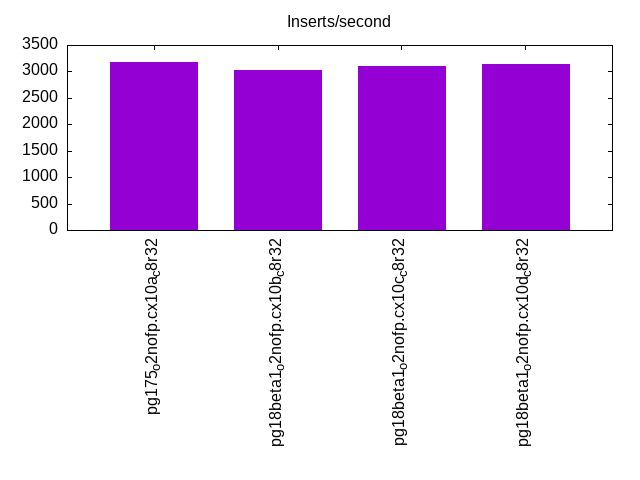
l.i1
l.i1: continue load after secondary indexes created with 50 inserts per transaction. Graphs for performance per 1-second interval are here.
Average throughput:
Insert response time histogram: each cell has the percentage of responses that take <= the time in the header and max is the max response time in seconds. For the max column values in the top 25% of the range have a red background and in the bottom 25% of the range have a green background. The red background is not used when the min value is within 80% of the max value.
| dbms | 256us | 1ms | 4ms | 16ms | 64ms | 256ms | 1s | 4s | 16s | gt | max |
|---|---|---|---|---|---|---|---|---|---|---|---|
| pg175_o2nofp.cx10a_c8r32 | 98.449 | 1.551 | 0.058 | ||||||||
| pg18beta1_o2nofp.cx10b_c8r32 | 98.419 | 1.581 | 0.059 | ||||||||
| pg18beta1_o2nofp.cx10c_c8r32 | 98.323 | 1.678 | 0.054 | ||||||||
| pg18beta1_o2nofp.cx10d_c8r32 | 98.442 | 1.558 | 0.055 |
Delete response time histogram: each cell has the percentage of responses that take <= the time in the header and max is the max response time in seconds. For the max column values in the top 25% of the range have a red background and in the bottom 25% of the range have a green background. The red background is not used when the min value is within 80% of the max value.
| dbms | 256us | 1ms | 4ms | 16ms | 64ms | 256ms | 1s | 4s | 16s | gt | max |
|---|---|---|---|---|---|---|---|---|---|---|---|
| pg175_o2nofp.cx10a_c8r32 | 0.429 | 16.102 | 43.014 | 40.455 | 0.033 | ||||||
| pg18beta1_o2nofp.cx10b_c8r32 | 0.511 | 15.054 | 38.488 | 45.948 | 0.034 | ||||||
| pg18beta1_o2nofp.cx10c_c8r32 | 1.014 | 14.866 | 41.444 | 42.676 | 0.033 | ||||||
| pg18beta1_o2nofp.cx10d_c8r32 | 0.573 | 15.326 | 42.014 | 42.087 | 0.033 |
Performance metrics for the DBMS listed above. Some are normalized by throughput, others are not. Legend for results is here.
ips	qps	rps	rmbps	wps	wmbps	rpq	rkbpq	wpi	wkbpi	csps	cpups	cspq	cpupq	dbgb1	dbgb2	rss	maxop	p50	p99	tag
3170	0	4558	36.1	3791.7	64.9	1.438	11.659	1.196	20.968	10262	15.0	3.238	379	154.3	194.3	22.7	0.058	2650	1850	pg175_o2nofp.cx10a_c8r32
3021	0	4347	34.4	3622.3	62.0	1.439	11.667	1.199	21.008	9796	14.9	3.243	395	154.3	194.3	22.9	0.059	2600	1550	pg18beta1_o2nofp.cx10b_c8r32
3108	0	4469	35.4	3721.0	63.9	1.438	11.657	1.197	21.068	10063	15.0	3.238	386	154.3	194.3	23.0	0.054	2749	1750	pg18beta1_o2nofp.cx10c_c8r32
3142	0	4519	35.8	3742.2	63.9	1.438	11.654	1.191	20.827	10167	14.9	3.236	379	154.3	194.3	22.9	0.055	2600	1800	pg18beta1_o2nofp.cx10d_c8r32
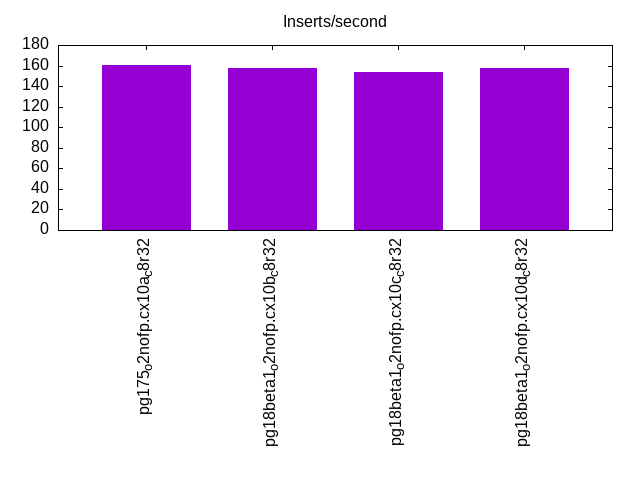
l.i2
l.i2: continue load after secondary indexes created with 5 inserts per transaction. Graphs for performance per 1-second interval are here.
Average throughput:
Insert response time histogram: each cell has the percentage of responses that take <= the time in the header and max is the max response time in seconds. For the max column values in the top 25% of the range have a red background and in the bottom 25% of the range have a green background. The red background is not used when the min value is within 80% of the max value.
| dbms | 256us | 1ms | 4ms | 16ms | 64ms | 256ms | 1s | 4s | 16s | gt | max |
|---|---|---|---|---|---|---|---|---|---|---|---|
| pg175_o2nofp.cx10a_c8r32 | 10.545 | 89.403 | 0.048 | 0.004 | 0.025 | ||||||
| pg18beta1_o2nofp.cx10b_c8r32 | 9.489 | 90.456 | 0.052 | 0.003 | 0.027 | ||||||
| pg18beta1_o2nofp.cx10c_c8r32 | 10.748 | 89.200 | 0.050 | 0.003 | 0.036 | ||||||
| pg18beta1_o2nofp.cx10d_c8r32 | 10.649 | 89.303 | 0.047 | 0.002 | 0.022 |
Delete response time histogram: each cell has the percentage of responses that take <= the time in the header and max is the max response time in seconds. For the max column values in the top 25% of the range have a red background and in the bottom 25% of the range have a green background. The red background is not used when the min value is within 80% of the max value.
| dbms | 256us | 1ms | 4ms | 16ms | 64ms | 256ms | 1s | 4s | 16s | gt | max |
|---|---|---|---|---|---|---|---|---|---|---|---|
| pg175_o2nofp.cx10a_c8r32 | 99.999 | 0.001 | 0.097 | ||||||||
| pg18beta1_o2nofp.cx10b_c8r32 | 99.999 | 0.001 | 0.101 | ||||||||
| pg18beta1_o2nofp.cx10c_c8r32 | 99.999 | 0.001 | 0.102 | ||||||||
| pg18beta1_o2nofp.cx10d_c8r32 | 99.999 | 0.001 | 0.104 |
Performance metrics for the DBMS listed above. Some are normalized by throughput, others are not. Legend for results is here.
ips	qps	rps	rmbps	wps	wmbps	rpq	rkbpq	wpi	wkbpi	csps	cpups	cspq	cpupq	dbgb1	dbgb2	rss	maxop	p50	p99	tag
161	0	172	1.4	471.0	6.6	1.072	8.770	2.929	41.733	1109	12.8	6.898	6368	154.4	194.5	23.4	0.025	160	135	pg175_o2nofp.cx10a_c8r32
158	0	170	1.4	465.6	6.5	1.072	8.768	2.939	41.885	1084	12.8	6.841	6465	154.4	191.4	23.4	0.027	160	125	pg18beta1_o2nofp.cx10b_c8r32
154	0	164	1.3	450.5	6.3	1.072	8.761	2.935	41.769	1061	12.8	6.912	6671	154.5	191.4	23.3	0.036	155	120	pg18beta1_o2nofp.cx10c_c8r32
158	0	169	1.3	465.3	6.5	1.072	8.764	2.951	42.065	1086	12.8	6.885	6493	154.4	191.6	23.4	0.022	155	125	pg18beta1_o2nofp.cx10d_c8r32
qr100.L1
qr100.L1: range queries with 100 insert/s per client. Graphs for performance per 1-second interval are here.
Average throughput:
Query response time histogram: each cell has the percentage of responses that take <= the time in the header and max is the max response time in seconds. For max values in the top 25% of the range have a red background and in the bottom 25% of the range have a green background. The red background is not used when the min value is within 80% of the max value.
| dbms | 256us | 1ms | 4ms | 16ms | 64ms | 256ms | 1s | 4s | 16s | gt | max |
|---|---|---|---|---|---|---|---|---|---|---|---|
| pg175_o2nofp.cx10a_c8r32 | 99.997 | 0.003 | nonzero | nonzero | 0.009 | ||||||
| pg18beta1_o2nofp.cx10b_c8r32 | 99.996 | 0.003 | nonzero | nonzero | 0.010 | ||||||
| pg18beta1_o2nofp.cx10c_c8r32 | 99.996 | 0.003 | nonzero | nonzero | 0.010 | ||||||
| pg18beta1_o2nofp.cx10d_c8r32 | 99.996 | 0.003 | nonzero | nonzero | 0.010 |
Insert response time histogram: each cell has the percentage of responses that take <= the time in the header and max is the max response time in seconds. For max values in the top 25% of the range have a red background and in the bottom 25% of the range have a green background. The red background is not used when the min value is within 80% of the max value.
| dbms | 256us | 1ms | 4ms | 16ms | 64ms | 256ms | 1s | 4s | 16s | gt | max |
|---|---|---|---|---|---|---|---|---|---|---|---|
| pg175_o2nofp.cx10a_c8r32 | 60.000 | 40.000 | 0.024 | ||||||||
| pg18beta1_o2nofp.cx10b_c8r32 | 60.361 | 39.639 | 0.024 | ||||||||
| pg18beta1_o2nofp.cx10c_c8r32 | 60.889 | 39.111 | 0.026 | ||||||||
| pg18beta1_o2nofp.cx10d_c8r32 | 59.944 | 40.056 | 0.026 |
Delete response time histogram: each cell has the percentage of responses that take <= the time in the header and max is the max response time in seconds. For max values in the top 25% of the range have a red background and in the bottom 25% of the range have a green background. The red background is not used when the min value is within 80% of the max value.
| dbms | 256us | 1ms | 4ms | 16ms | 64ms | 256ms | 1s | 4s | 16s | gt | max |
|---|---|---|---|---|---|---|---|---|---|---|---|
| pg175_o2nofp.cx10a_c8r32 | 44.917 | 55.000 | 0.083 | 0.010 | |||||||
| pg18beta1_o2nofp.cx10b_c8r32 | 48.444 | 51.500 | 0.056 | 0.010 | |||||||
| pg18beta1_o2nofp.cx10c_c8r32 | 51.306 | 48.611 | 0.083 | 0.010 | |||||||
| pg18beta1_o2nofp.cx10d_c8r32 | 45.083 | 54.833 | 0.083 | 0.010 |
Performance metrics for the DBMS listed above. Some are normalized by throughput, others are not. Legend for results is here.
ips	qps	rps	rmbps	wps	wmbps	rpq	rkbpq	wpi	wkbpi	csps	cpups	cspq	cpupq	dbgb1	dbgb2	rss	maxop	p50	p99	tag
100	14660	112	0.9	64.7	1.9	0.008	0.065	0.647	19.241	56201	12.4	3.834	68	154.5	192.2	23.4	0.009	14654	14414	pg175_o2nofp.cx10a_c8r32
100	14343	111	0.9	65.3	1.9	0.008	0.065	0.653	19.290	55024	12.6	3.836	70	154.5	192.1	23.4	0.010	14334	14094	pg18beta1_o2nofp.cx10b_c8r32
100	14445	112	0.9	67.0	1.9	0.008	0.064	0.670	19.435	55381	12.5	3.834	69	154.5	189.9	23.4	0.010	14446	14174	pg18beta1_o2nofp.cx10c_c8r32
100	14446	111	0.9	66.3	1.9	0.008	0.064	0.664	19.391	55417	12.6	3.836	70	154.5	193.1	23.4	0.010	14430	14206	pg18beta1_o2nofp.cx10d_c8r32
qp100.L2
qp100.L2: point queries with 100 insert/s per client. Graphs for performance per 1-second interval are here.
Average throughput:
Query response time histogram: each cell has the percentage of responses that take <= the time in the header and max is the max response time in seconds. For max values in the top 25% of the range have a red background and in the bottom 25% of the range have a green background. The red background is not used when the min value is within 80% of the max value.
| dbms | 256us | 1ms | 4ms | 16ms | 64ms | 256ms | 1s | 4s | 16s | gt | max |
|---|---|---|---|---|---|---|---|---|---|---|---|
| pg175_o2nofp.cx10a_c8r32 | 0.724 | 99.266 | 0.010 | 0.007 | |||||||
| pg18beta1_o2nofp.cx10b_c8r32 | 0.777 | 99.211 | 0.012 | 0.008 | |||||||
| pg18beta1_o2nofp.cx10c_c8r32 | 0.720 | 99.268 | 0.012 | 0.007 | |||||||
| pg18beta1_o2nofp.cx10d_c8r32 | 0.783 | 99.206 | 0.011 | 0.007 |
Insert response time histogram: each cell has the percentage of responses that take <= the time in the header and max is the max response time in seconds. For max values in the top 25% of the range have a red background and in the bottom 25% of the range have a green background. The red background is not used when the min value is within 80% of the max value.
| dbms | 256us | 1ms | 4ms | 16ms | 64ms | 256ms | 1s | 4s | 16s | gt | max |
|---|---|---|---|---|---|---|---|---|---|---|---|
| pg175_o2nofp.cx10a_c8r32 | 99.472 | 0.528 | 0.019 | ||||||||
| pg18beta1_o2nofp.cx10b_c8r32 | 99.444 | 0.556 | 0.019 | ||||||||
| pg18beta1_o2nofp.cx10c_c8r32 | 99.444 | 0.556 | 0.020 | ||||||||
| pg18beta1_o2nofp.cx10d_c8r32 | 99.556 | 0.444 | 0.019 |
Delete response time histogram: each cell has the percentage of responses that take <= the time in the header and max is the max response time in seconds. For max values in the top 25% of the range have a red background and in the bottom 25% of the range have a green background. The red background is not used when the min value is within 80% of the max value.
| dbms | 256us | 1ms | 4ms | 16ms | 64ms | 256ms | 1s | 4s | 16s | gt | max |
|---|---|---|---|---|---|---|---|---|---|---|---|
| pg175_o2nofp.cx10a_c8r32 | 99.222 | 0.778 | 0.008 | ||||||||
| pg18beta1_o2nofp.cx10b_c8r32 | 99.972 | 0.028 | 0.008 | ||||||||
| pg18beta1_o2nofp.cx10c_c8r32 | 97.750 | 2.250 | 0.009 | ||||||||
| pg18beta1_o2nofp.cx10d_c8r32 | 99.972 | 0.028 | 0.009 |
Performance metrics for the DBMS listed above. Some are normalized by throughput, others are not. Legend for results is here.
ips	qps	rps	rmbps	wps	wmbps	rpq	rkbpq	wpi	wkbpi	csps	cpups	cspq	cpupq	dbgb1	dbgb2	rss	maxop	p50	p99	tag
100	532	6939	54.6	345.9	4.1	13.046	105.026	3.459	41.571	15612	3.6	29.351	541	154.5	192.3	23.4	0.007	560	368	pg175_o2nofp.cx10a_c8r32
100	534	6957	54.7	345.6	4.1	13.037	104.962	3.456	41.526	15655	3.7	29.339	555	154.5	192.1	23.4	0.008	560	368	pg18beta1_o2nofp.cx10b_c8r32
100	529	6938	54.5	343.9	4.0	13.106	105.501	3.439	41.408	15603	3.7	29.473	559	154.5	189.9	23.4	0.007	560	352	pg18beta1_o2nofp.cx10c_c8r32
100	530	6911	54.3	344.3	4.0	13.043	104.957	3.443	41.452	15550	3.7	29.346	559	154.5	193.1	23.4	0.007	560	352	pg18beta1_o2nofp.cx10d_c8r32
qr500.L3
qr500.L3: range queries with 500 insert/s per client. Graphs for performance per 1-second interval are here.
Average throughput:
Query response time histogram: each cell has the percentage of responses that take <= the time in the header and max is the max response time in seconds. For max values in the top 25% of the range have a red background and in the bottom 25% of the range have a green background. The red background is not used when the min value is within 80% of the max value.
| dbms | 256us | 1ms | 4ms | 16ms | 64ms | 256ms | 1s | 4s | 16s | gt | max |
|---|---|---|---|---|---|---|---|---|---|---|---|
| pg175_o2nofp.cx10a_c8r32 | 99.985 | 0.015 | nonzero | nonzero | nonzero | 0.025 | |||||
| pg18beta1_o2nofp.cx10b_c8r32 | 99.983 | 0.016 | nonzero | nonzero | nonzero | 0.032 | |||||
| pg18beta1_o2nofp.cx10c_c8r32 | 99.983 | 0.016 | nonzero | nonzero | nonzero | 0.025 | |||||
| pg18beta1_o2nofp.cx10d_c8r32 | 99.983 | 0.017 | nonzero | nonzero | nonzero | 0.036 |
Insert response time histogram: each cell has the percentage of responses that take <= the time in the header and max is the max response time in seconds. For max values in the top 25% of the range have a red background and in the bottom 25% of the range have a green background. The red background is not used when the min value is within 80% of the max value.
| dbms | 256us | 1ms | 4ms | 16ms | 64ms | 256ms | 1s | 4s | 16s | gt | max |
|---|---|---|---|---|---|---|---|---|---|---|---|
| pg175_o2nofp.cx10a_c8r32 | 93.489 | 6.511 | 0.025 | ||||||||
| pg18beta1_o2nofp.cx10b_c8r32 | 93.417 | 6.583 | 0.030 | ||||||||
| pg18beta1_o2nofp.cx10c_c8r32 | 93.828 | 6.172 | 0.031 | ||||||||
| pg18beta1_o2nofp.cx10d_c8r32 | 93.722 | 6.278 | 0.030 |
Delete response time histogram: each cell has the percentage of responses that take <= the time in the header and max is the max response time in seconds. For max values in the top 25% of the range have a red background and in the bottom 25% of the range have a green background. The red background is not used when the min value is within 80% of the max value.
| dbms | 256us | 1ms | 4ms | 16ms | 64ms | 256ms | 1s | 4s | 16s | gt | max |
|---|---|---|---|---|---|---|---|---|---|---|---|
| pg175_o2nofp.cx10a_c8r32 | 42.394 | 57.606 | 0.014 | ||||||||
| pg18beta1_o2nofp.cx10b_c8r32 | 40.789 | 59.211 | 0.015 | ||||||||
| pg18beta1_o2nofp.cx10c_c8r32 | 41.406 | 58.594 | 0.015 | ||||||||
| pg18beta1_o2nofp.cx10d_c8r32 | 36.750 | 63.250 | 0.015 |
Performance metrics for the DBMS listed above. Some are normalized by throughput, others are not. Legend for results is here.
ips	qps	rps	rmbps	wps	wmbps	rpq	rkbpq	wpi	wkbpi	csps	cpups	cspq	cpupq	dbgb1	dbgb2	rss	maxop	p50	p99	tag
500	13906	869	6.9	345.5	9.3	0.062	0.510	0.691	19.081	54947	13.7	3.951	79	154.6	190.4	23.4	0.025	13934	13422	pg175_o2nofp.cx10a_c8r32
500	13556	869	6.9	347.2	9.3	0.064	0.524	0.694	19.110	53588	13.7	3.953	81	154.6	190.3	23.4	0.032	13582	13038	pg18beta1_o2nofp.cx10b_c8r32
500	13466	868	6.9	350.6	9.4	0.064	0.526	0.702	19.202	53269	13.7	3.956	81	154.6	190.0	23.4	0.025	13470	12958	pg18beta1_o2nofp.cx10c_c8r32
500	13708	869	6.9	349.7	9.4	0.063	0.518	0.699	19.171	54168	13.8	3.951	81	154.6	190.7	23.4	0.036	13710	13166	pg18beta1_o2nofp.cx10d_c8r32
qp500.L4
qp500.L4: point queries with 500 insert/s per client. Graphs for performance per 1-second interval are here.
Average throughput:
Query response time histogram: each cell has the percentage of responses that take <= the time in the header and max is the max response time in seconds. For max values in the top 25% of the range have a red background and in the bottom 25% of the range have a green background. The red background is not used when the min value is within 80% of the max value.
| dbms | 256us | 1ms | 4ms | 16ms | 64ms | 256ms | 1s | 4s | 16s | gt | max |
|---|---|---|---|---|---|---|---|---|---|---|---|
| pg175_o2nofp.cx10a_c8r32 | 0.415 | 99.576 | 0.009 | 0.007 | |||||||
| pg18beta1_o2nofp.cx10b_c8r32 | 0.422 | 99.569 | 0.009 | 0.007 | |||||||
| pg18beta1_o2nofp.cx10c_c8r32 | 0.386 | 99.605 | 0.009 | 0.008 | |||||||
| pg18beta1_o2nofp.cx10d_c8r32 | 0.390 | 99.600 | 0.009 | 0.008 |
Insert response time histogram: each cell has the percentage of responses that take <= the time in the header and max is the max response time in seconds. For max values in the top 25% of the range have a red background and in the bottom 25% of the range have a green background. The red background is not used when the min value is within 80% of the max value.
| dbms | 256us | 1ms | 4ms | 16ms | 64ms | 256ms | 1s | 4s | 16s | gt | max |
|---|---|---|---|---|---|---|---|---|---|---|---|
| pg175_o2nofp.cx10a_c8r32 | 99.761 | 0.239 | 0.020 | ||||||||
| pg18beta1_o2nofp.cx10b_c8r32 | 99.739 | 0.261 | 0.018 | ||||||||
| pg18beta1_o2nofp.cx10c_c8r32 | 99.767 | 0.233 | 0.019 | ||||||||
| pg18beta1_o2nofp.cx10d_c8r32 | 99.656 | 0.344 | 0.020 |
Delete response time histogram: each cell has the percentage of responses that take <= the time in the header and max is the max response time in seconds. For max values in the top 25% of the range have a red background and in the bottom 25% of the range have a green background. The red background is not used when the min value is within 80% of the max value.
| dbms | 256us | 1ms | 4ms | 16ms | 64ms | 256ms | 1s | 4s | 16s | gt | max |
|---|---|---|---|---|---|---|---|---|---|---|---|
| pg175_o2nofp.cx10a_c8r32 | 94.533 | 5.467 | 0.042 | ||||||||
| pg18beta1_o2nofp.cx10b_c8r32 | 89.694 | 10.306 | 0.043 | ||||||||
| pg18beta1_o2nofp.cx10c_c8r32 | 87.944 | 12.056 | 0.043 | ||||||||
| pg18beta1_o2nofp.cx10d_c8r32 | 88.894 | 11.106 | 0.044 |
Performance metrics for the DBMS listed above. Some are normalized by throughput, others are not. Legend for results is here.
ips	qps	rps	rmbps	wps	wmbps	rpq	rkbpq	wpi	wkbpi	csps	cpups	cspq	cpupq	dbgb1	dbgb2	rss	maxop	p50	p99	tag
500	518	7671	60.2	1547.0	18.2	14.806	118.980	3.096	37.329	17108	5.6	33.020	865	154.6	188.7	23.4	0.007	528	416	pg175_o2nofp.cx10a_c8r32
500	518	7669	60.2	1546.5	18.2	14.806	118.999	3.095	37.315	17105	5.7	33.022	880	154.6	188.7	23.4	0.007	528	416	pg18beta1_o2nofp.cx10b_c8r32
500	513	7640	59.9	1541.8	18.2	14.903	119.759	3.085	37.235	17023	5.7	33.209	890	154.6	188.3	23.4	0.008	528	416	pg18beta1_o2nofp.cx10c_c8r32
500	512	7599	59.6	1543.7	18.2	14.830	119.165	3.087	37.257	16941	6.0	33.063	937	154.6	188.8	23.4	0.008	528	416	pg18beta1_o2nofp.cx10d_c8r32
qr1000.L5
qr1000.L5: range queries with 1000 insert/s per client. Graphs for performance per 1-second interval are here.
Average throughput:
Query response time histogram: each cell has the percentage of responses that take <= the time in the header and max is the max response time in seconds. For max values in the top 25% of the range have a red background and in the bottom 25% of the range have a green background. The red background is not used when the min value is within 80% of the max value.
| dbms | 256us | 1ms | 4ms | 16ms | 64ms | 256ms | 1s | 4s | 16s | gt | max |
|---|---|---|---|---|---|---|---|---|---|---|---|
| pg175_o2nofp.cx10a_c8r32 | 99.955 | 0.041 | 0.002 | 0.001 | nonzero | nonzero | 0.096 | ||||
| pg18beta1_o2nofp.cx10b_c8r32 | 99.950 | 0.046 | 0.003 | 0.001 | nonzero | nonzero | 0.091 | ||||
| pg18beta1_o2nofp.cx10c_c8r32 | 99.949 | 0.047 | 0.003 | 0.001 | nonzero | nonzero | 0.091 | ||||
| pg18beta1_o2nofp.cx10d_c8r32 | 99.951 | 0.045 | 0.003 | 0.001 | nonzero | nonzero | 0.089 |
Insert response time histogram: each cell has the percentage of responses that take <= the time in the header and max is the max response time in seconds. For max values in the top 25% of the range have a red background and in the bottom 25% of the range have a green background. The red background is not used when the min value is within 80% of the max value.
| dbms | 256us | 1ms | 4ms | 16ms | 64ms | 256ms | 1s | 4s | 16s | gt | max |
|---|---|---|---|---|---|---|---|---|---|---|---|
| pg175_o2nofp.cx10a_c8r32 | 96.619 | 3.381 | 0.022 | ||||||||
| pg18beta1_o2nofp.cx10b_c8r32 | 97.022 | 2.978 | 0.022 | ||||||||
| pg18beta1_o2nofp.cx10c_c8r32 | 96.753 | 3.247 | 0.028 | ||||||||
| pg18beta1_o2nofp.cx10d_c8r32 | 97.064 | 2.936 | 0.022 |
Delete response time histogram: each cell has the percentage of responses that take <= the time in the header and max is the max response time in seconds. For max values in the top 25% of the range have a red background and in the bottom 25% of the range have a green background. The red background is not used when the min value is within 80% of the max value.
| dbms | 256us | 1ms | 4ms | 16ms | 64ms | 256ms | 1s | 4s | 16s | gt | max |
|---|---|---|---|---|---|---|---|---|---|---|---|
| pg175_o2nofp.cx10a_c8r32 | 8.806 | 91.194 | 0.062 | ||||||||
| pg18beta1_o2nofp.cx10b_c8r32 | 4.936 | 95.061 | 0.003 | 0.065 | |||||||
| pg18beta1_o2nofp.cx10c_c8r32 | 8.806 | 91.192 | 0.003 | 0.066 | |||||||
| pg18beta1_o2nofp.cx10d_c8r32 | 4.400 | 95.597 | 0.003 | 0.066 |
Performance metrics for the DBMS listed above. Some are normalized by throughput, others are not. Legend for results is here.
ips	qps	rps	rmbps	wps	wmbps	rpq	rkbpq	wpi	wkbpi	csps	cpups	cspq	cpupq	dbgb1	dbgb2	rss	maxop	p50	p99	tag
999	12081	1489	11.9	953.1	19.2	0.123	1.013	0.954	19.709	49400	19.2	4.089	127	154.8	187.8	23.4	0.096	12094	11295	pg175_o2nofp.cx10a_c8r32
999	11871	1490	12.0	950.7	19.2	0.125	1.031	0.952	19.707	48631	19.4	4.097	131	154.8	187.8	23.4	0.091	11886	11118	pg18beta1_o2nofp.cx10b_c8r32
999	11699	1488	11.9	953.2	19.3	0.127	1.045	0.954	19.732	47945	19.1	4.098	131	154.8	187.4	23.4	0.091	11710	10958	pg18beta1_o2nofp.cx10c_c8r32
999	11982	1488	11.9	952.1	19.2	0.124	1.020	0.953	19.713	49028	19.4	4.092	130	154.8	187.9	23.4	0.089	11998	11198	pg18beta1_o2nofp.cx10d_c8r32
qp1000.L6
qp1000.L6: point queries with 1000 insert/s per client. Graphs for performance per 1-second interval are here.
Average throughput:
Query response time histogram: each cell has the percentage of responses that take <= the time in the header and max is the max response time in seconds. For max values in the top 25% of the range have a red background and in the bottom 25% of the range have a green background. The red background is not used when the min value is within 80% of the max value.
| dbms | 256us | 1ms | 4ms | 16ms | 64ms | 256ms | 1s | 4s | 16s | gt | max |
|---|---|---|---|---|---|---|---|---|---|---|---|
| pg175_o2nofp.cx10a_c8r32 | 0.172 | 99.156 | 0.669 | 0.002 | 0.044 | ||||||
| pg18beta1_o2nofp.cx10b_c8r32 | 0.164 | 99.071 | 0.763 | 0.002 | 0.042 | ||||||
| pg18beta1_o2nofp.cx10c_c8r32 | 0.145 | 99.022 | 0.831 | 0.002 | 0.043 | ||||||
| pg18beta1_o2nofp.cx10d_c8r32 | 0.154 | 99.005 | 0.838 | 0.002 | 0.043 |
Insert response time histogram: each cell has the percentage of responses that take <= the time in the header and max is the max response time in seconds. For max values in the top 25% of the range have a red background and in the bottom 25% of the range have a green background. The red background is not used when the min value is within 80% of the max value.
| dbms | 256us | 1ms | 4ms | 16ms | 64ms | 256ms | 1s | 4s | 16s | gt | max |
|---|---|---|---|---|---|---|---|---|---|---|---|
| pg175_o2nofp.cx10a_c8r32 | 98.964 | 1.036 | 0.053 | ||||||||
| pg18beta1_o2nofp.cx10b_c8r32 | 98.744 | 1.256 | 0.063 | ||||||||
| pg18beta1_o2nofp.cx10c_c8r32 | 98.575 | 1.425 | 0.054 | ||||||||
| pg18beta1_o2nofp.cx10d_c8r32 | 98.608 | 1.392 | 0.047 |
Delete response time histogram: each cell has the percentage of responses that take <= the time in the header and max is the max response time in seconds. For max values in the top 25% of the range have a red background and in the bottom 25% of the range have a green background. The red background is not used when the min value is within 80% of the max value.
| dbms | 256us | 1ms | 4ms | 16ms | 64ms | 256ms | 1s | 4s | 16s | gt | max |
|---|---|---|---|---|---|---|---|---|---|---|---|
| pg175_o2nofp.cx10a_c8r32 | 99.997 | 0.003 | 0.098 | ||||||||
| pg18beta1_o2nofp.cx10b_c8r32 | 99.997 | 0.003 | 0.106 | ||||||||
| pg18beta1_o2nofp.cx10c_c8r32 | 99.997 | 0.003 | 0.107 | ||||||||
| pg18beta1_o2nofp.cx10d_c8r32 | 99.997 | 0.003 | 0.105 |
Performance metrics for the DBMS listed above. Some are normalized by throughput, others are not. Legend for results is here.
ips	qps	rps	rmbps	wps	wmbps	rpq	rkbpq	wpi	wkbpi	csps	cpups	cspq	cpupq	dbgb1	dbgb2	rss	maxop	p50	p99	tag
999	481	8382	65.8	2711.0	33.7	17.418	139.922	2.713	34.493	18572	13.8	38.596	2294	155.0	190.9	23.4	0.044	496	368	pg175_o2nofp.cx10a_c8r32
999	478	8338	65.4	2710.8	33.6	17.448	140.180	2.712	34.465	18465	14.3	38.639	2394	155.0	190.9	23.4	0.042	496	352	pg18beta1_o2nofp.cx10b_c8r32
999	473	8313	65.2	2710.3	33.7	17.578	141.222	2.714	34.556	18402	14.1	38.914	2385	155.0	190.6	23.4	0.043	480	352	pg18beta1_o2nofp.cx10c_c8r32
999	473	8283	65.0	2708.4	33.5	17.508	140.637	2.712	34.334	18341	14.3	38.768	2418	155.0	190.7	23.4	0.043	480	352	pg18beta1_o2nofp.cx10d_c8r32
l.i0
l.i0: load without secondary indexes
Performance metrics for all DBMS, not just the ones listed above. Some are normalized by throughput, others are not. Legend for results is here.
ips	qps	rps	rmbps	wps	wmbps	rpq	rkbpq	wpi	wkbpi	csps	cpups	cspq	cpupq	dbgb1	dbgb2	rss	maxop	p50	p99	tag
144613	0	25	0.2	540.5	59.4	0.000	0.001	0.004	0.421	14417	20.5	0.100	11	76.5	116.6	18.2	0.072	145480	140883	pg175_o2nofp.cx10a_c8r32
144404	0	25	0.2	539.0	59.3	0.000	0.001	0.004	0.421	14394	20.4	0.100	11	76.5	116.6	18.4	0.040	145282	140780	pg18beta1_o2nofp.cx10b_c8r32
142857	0	24	0.2	532.2	58.5	0.000	0.001	0.004	0.419	14651	20.7	0.103	12	76.5	116.6	18.5	0.069	143081	132682	pg18beta1_o2nofp.cx10c_c8r32
144092	0	26	0.2	540.4	59.4	0.000	0.001	0.004	0.422	14461	20.5	0.100	11	76.5	116.6	18.9	0.047	144982	140681	pg18beta1_o2nofp.cx10d_c8r32
l.x
l.x: create secondary indexes
Performance metrics for all DBMS, not just the ones listed above. Some are normalized by throughput, others are not. Legend for results is here.
ips	qps	rps	rmbps	wps	wmbps	rpq	rkbpq	wpi	wkbpi	csps	cpups	cspq	cpupq	dbgb1	dbgb2	rss	maxop	p50	p99	tag
313357	0	849	105.5	998.0	116.9	0.003	0.345	0.003	0.382	474	12.9	0.002	3	153.6	193.7	23.4	0.004	NA	NA	pg175_o2nofp.cx10a_c8r32
314465	0	852	105.9	1001.6	117.1	0.003	0.345	0.003	0.381	449	13.0	0.001	3	153.6	193.7	23.4	0.005	NA	NA	pg18beta1_o2nofp.cx10b_c8r32
320384	0	868	107.8	1010.4	119.7	0.003	0.345	0.003	0.382	1270	13.4	0.004	3	153.6	193.7	23.4	0.003	NA	NA	pg18beta1_o2nofp.cx10c_c8r32
312867	0	848	105.3	996.8	116.8	0.003	0.345	0.003	0.382	999	13.4	0.003	3	153.6	193.7	23.4	0.003	NA	NA	pg18beta1_o2nofp.cx10d_c8r32
l.i1
l.i1: continue load after secondary indexes created with 50 inserts per transaction
Performance metrics for all DBMS, not just the ones listed above. Some are normalized by throughput, others are not. Legend for results is here.
ips	qps	rps	rmbps	wps	wmbps	rpq	rkbpq	wpi	wkbpi	csps	cpups	cspq	cpupq	dbgb1	dbgb2	rss	maxop	p50	p99	tag
3170	0	4558	36.1	3791.7	64.9	1.438	11.659	1.196	20.968	10262	15.0	3.238	379	154.3	194.3	22.7	0.058	2650	1850	pg175_o2nofp.cx10a_c8r32
3021	0	4347	34.4	3622.3	62.0	1.439	11.667	1.199	21.008	9796	14.9	3.243	395	154.3	194.3	22.9	0.059	2600	1550	pg18beta1_o2nofp.cx10b_c8r32
3108	0	4469	35.4	3721.0	63.9	1.438	11.657	1.197	21.068	10063	15.0	3.238	386	154.3	194.3	23.0	0.054	2749	1750	pg18beta1_o2nofp.cx10c_c8r32
3142	0	4519	35.8	3742.2	63.9	1.438	11.654	1.191	20.827	10167	14.9	3.236	379	154.3	194.3	22.9	0.055	2600	1800	pg18beta1_o2nofp.cx10d_c8r32
l.i2
l.i2: continue load after secondary indexes created with 5 inserts per transaction
Performance metrics for all DBMS, not just the ones listed above. Some are normalized by throughput, others are not. Legend for results is here.
ips	qps	rps	rmbps	wps	wmbps	rpq	rkbpq	wpi	wkbpi	csps	cpups	cspq	cpupq	dbgb1	dbgb2	rss	maxop	p50	p99	tag
161	0	172	1.4	471.0	6.6	1.072	8.770	2.929	41.733	1109	12.8	6.898	6368	154.4	194.5	23.4	0.025	160	135	pg175_o2nofp.cx10a_c8r32
158	0	170	1.4	465.6	6.5	1.072	8.768	2.939	41.885	1084	12.8	6.841	6465	154.4	191.4	23.4	0.027	160	125	pg18beta1_o2nofp.cx10b_c8r32
154	0	164	1.3	450.5	6.3	1.072	8.761	2.935	41.769	1061	12.8	6.912	6671	154.5	191.4	23.3	0.036	155	120	pg18beta1_o2nofp.cx10c_c8r32
158	0	169	1.3	465.3	6.5	1.072	8.764	2.951	42.065	1086	12.8	6.885	6493	154.4	191.6	23.4	0.022	155	125	pg18beta1_o2nofp.cx10d_c8r32
qr100.L1
qr100.L1: range queries with 100 insert/s per client
Performance metrics for all DBMS, not just the ones listed above. Some are normalized by throughput, others are not. Legend for results is here.
ips	qps	rps	rmbps	wps	wmbps	rpq	rkbpq	wpi	wkbpi	csps	cpups	cspq	cpupq	dbgb1	dbgb2	rss	maxop	p50	p99	tag
100	14660	112	0.9	64.7	1.9	0.008	0.065	0.647	19.241	56201	12.4	3.834	68	154.5	192.2	23.4	0.009	14654	14414	pg175_o2nofp.cx10a_c8r32
100	14343	111	0.9	65.3	1.9	0.008	0.065	0.653	19.290	55024	12.6	3.836	70	154.5	192.1	23.4	0.010	14334	14094	pg18beta1_o2nofp.cx10b_c8r32
100	14445	112	0.9	67.0	1.9	0.008	0.064	0.670	19.435	55381	12.5	3.834	69	154.5	189.9	23.4	0.010	14446	14174	pg18beta1_o2nofp.cx10c_c8r32
100	14446	111	0.9	66.3	1.9	0.008	0.064	0.664	19.391	55417	12.6	3.836	70	154.5	193.1	23.4	0.010	14430	14206	pg18beta1_o2nofp.cx10d_c8r32
qp100.L2
qp100.L2: point queries with 100 insert/s per client
Performance metrics for all DBMS, not just the ones listed above. Some are normalized by throughput, others are not. Legend for results is here.
ips	qps	rps	rmbps	wps	wmbps	rpq	rkbpq	wpi	wkbpi	csps	cpups	cspq	cpupq	dbgb1	dbgb2	rss	maxop	p50	p99	tag
100	532	6939	54.6	345.9	4.1	13.046	105.026	3.459	41.571	15612	3.6	29.351	541	154.5	192.3	23.4	0.007	560	368	pg175_o2nofp.cx10a_c8r32
100	534	6957	54.7	345.6	4.1	13.037	104.962	3.456	41.526	15655	3.7	29.339	555	154.5	192.1	23.4	0.008	560	368	pg18beta1_o2nofp.cx10b_c8r32
100	529	6938	54.5	343.9	4.0	13.106	105.501	3.439	41.408	15603	3.7	29.473	559	154.5	189.9	23.4	0.007	560	352	pg18beta1_o2nofp.cx10c_c8r32
100	530	6911	54.3	344.3	4.0	13.043	104.957	3.443	41.452	15550	3.7	29.346	559	154.5	193.1	23.4	0.007	560	352	pg18beta1_o2nofp.cx10d_c8r32
qr500.L3
qr500.L3: range queries with 500 insert/s per client
Performance metrics for all DBMS, not just the ones listed above. Some are normalized by throughput, others are not. Legend for results is here.
ips	qps	rps	rmbps	wps	wmbps	rpq	rkbpq	wpi	wkbpi	csps	cpups	cspq	cpupq	dbgb1	dbgb2	rss	maxop	p50	p99	tag
500	13906	869	6.9	345.5	9.3	0.062	0.510	0.691	19.081	54947	13.7	3.951	79	154.6	190.4	23.4	0.025	13934	13422	pg175_o2nofp.cx10a_c8r32
500	13556	869	6.9	347.2	9.3	0.064	0.524	0.694	19.110	53588	13.7	3.953	81	154.6	190.3	23.4	0.032	13582	13038	pg18beta1_o2nofp.cx10b_c8r32
500	13466	868	6.9	350.6	9.4	0.064	0.526	0.702	19.202	53269	13.7	3.956	81	154.6	190.0	23.4	0.025	13470	12958	pg18beta1_o2nofp.cx10c_c8r32
500	13708	869	6.9	349.7	9.4	0.063	0.518	0.699	19.171	54168	13.8	3.951	81	154.6	190.7	23.4	0.036	13710	13166	pg18beta1_o2nofp.cx10d_c8r32
qp500.L4
qp500.L4: point queries with 500 insert/s per client
Performance metrics for all DBMS, not just the ones listed above. Some are normalized by throughput, others are not. Legend for results is here.
ips	qps	rps	rmbps	wps	wmbps	rpq	rkbpq	wpi	wkbpi	csps	cpups	cspq	cpupq	dbgb1	dbgb2	rss	maxop	p50	p99	tag
500	518	7671	60.2	1547.0	18.2	14.806	118.980	3.096	37.329	17108	5.6	33.020	865	154.6	188.7	23.4	0.007	528	416	pg175_o2nofp.cx10a_c8r32
500	518	7669	60.2	1546.5	18.2	14.806	118.999	3.095	37.315	17105	5.7	33.022	880	154.6	188.7	23.4	0.007	528	416	pg18beta1_o2nofp.cx10b_c8r32
500	513	7640	59.9	1541.8	18.2	14.903	119.759	3.085	37.235	17023	5.7	33.209	890	154.6	188.3	23.4	0.008	528	416	pg18beta1_o2nofp.cx10c_c8r32
500	512	7599	59.6	1543.7	18.2	14.830	119.165	3.087	37.257	16941	6.0	33.063	937	154.6	188.8	23.4	0.008	528	416	pg18beta1_o2nofp.cx10d_c8r32
qr1000.L5
qr1000.L5: range queries with 1000 insert/s per client
Performance metrics for all DBMS, not just the ones listed above. Some are normalized by throughput, others are not. Legend for results is here.
ips	qps	rps	rmbps	wps	wmbps	rpq	rkbpq	wpi	wkbpi	csps	cpups	cspq	cpupq	dbgb1	dbgb2	rss	maxop	p50	p99	tag
999	12081	1489	11.9	953.1	19.2	0.123	1.013	0.954	19.709	49400	19.2	4.089	127	154.8	187.8	23.4	0.096	12094	11295	pg175_o2nofp.cx10a_c8r32
999	11871	1490	12.0	950.7	19.2	0.125	1.031	0.952	19.707	48631	19.4	4.097	131	154.8	187.8	23.4	0.091	11886	11118	pg18beta1_o2nofp.cx10b_c8r32
999	11699	1488	11.9	953.2	19.3	0.127	1.045	0.954	19.732	47945	19.1	4.098	131	154.8	187.4	23.4	0.091	11710	10958	pg18beta1_o2nofp.cx10c_c8r32
999	11982	1488	11.9	952.1	19.2	0.124	1.020	0.953	19.713	49028	19.4	4.092	130	154.8	187.9	23.4	0.089	11998	11198	pg18beta1_o2nofp.cx10d_c8r32
qp1000.L6
qp1000.L6: point queries with 1000 insert/s per client
Performance metrics for all DBMS, not just the ones listed above. Some are normalized by throughput, others are not. Legend for results is here.
ips	qps	rps	rmbps	wps	wmbps	rpq	rkbpq	wpi	wkbpi	csps	cpups	cspq	cpupq	dbgb1	dbgb2	rss	maxop	p50	p99	tag
999	481	8382	65.8	2711.0	33.7	17.418	139.922	2.713	34.493	18572	13.8	38.596	2294	155.0	190.9	23.4	0.044	496	368	pg175_o2nofp.cx10a_c8r32
999	478	8338	65.4	2710.8	33.6	17.448	140.180	2.712	34.465	18465	14.3	38.639	2394	155.0	190.9	23.4	0.042	496	352	pg18beta1_o2nofp.cx10b_c8r32
999	473	8313	65.2	2710.3	33.7	17.578	141.222	2.714	34.556	18402	14.1	38.914	2385	155.0	190.6	23.4	0.043	480	352	pg18beta1_o2nofp.cx10c_c8r32
999	473	8283	65.0	2708.4	33.5	17.508	140.637	2.712	34.334	18341	14.3	38.768	2418	155.0	190.7	23.4	0.043	480	352	pg18beta1_o2nofp.cx10d_c8r32
l.i0
- l.i0: load without secondary indexes
- Legend for results is here.
- Each entry lists the percentage of responses that fit in that bucket (slower than max time for previous bucket, faster than min time for next bucket).
Insert response time histogram
256us	1ms	4ms	16ms	64ms	256ms	1s	4s	16s	gt	max	tag
0.000	99.974	0.021	0.003	0.001	nonzero	0.000	0.000	0.000	0.000	0.072	pg175_o2nofp.cx10a_c8r32
0.000	99.972	0.023	0.004	0.001	0.000	0.000	0.000	0.000	0.000	0.040	pg18beta1_o2nofp.cx10b_c8r32
0.000	99.837	0.155	0.006	0.002	nonzero	0.000	0.000	0.000	0.000	0.069	pg18beta1_o2nofp.cx10c_c8r32
0.000	99.968	0.026	0.005	0.001	0.000	0.000	0.000	0.000	0.000	0.047	pg18beta1_o2nofp.cx10d_c8r32
l.x
- l.x: create secondary indexes
- Legend for results is here.
- Each entry lists the percentage of responses that fit in that bucket (slower than max time for previous bucket, faster than min time for next bucket).
TODO - determine whether there is data for create index response time
l.i1
- l.i1: continue load after secondary indexes created with 50 inserts per transaction
- Legend for results is here.
- Each entry lists the percentage of responses that fit in that bucket (slower than max time for previous bucket, faster than min time for next bucket).
Insert response time histogram
256us	1ms	4ms	16ms	64ms	256ms	1s	4s	16s	gt	max	tag
0.000	0.000	0.000	98.449	1.551	0.000	0.000	0.000	0.000	0.000	0.058	pg175_o2nofp.cx10a_c8r32
0.000	0.000	0.000	98.419	1.581	0.000	0.000	0.000	0.000	0.000	0.059	pg18beta1_o2nofp.cx10b_c8r32
0.000	0.000	0.000	98.323	1.678	0.000	0.000	0.000	0.000	0.000	0.054	pg18beta1_o2nofp.cx10c_c8r32
0.000	0.000	0.000	98.442	1.558	0.000	0.000	0.000	0.000	0.000	0.055	pg18beta1_o2nofp.cx10d_c8r32
Delete response time histogram
256us	1ms	4ms	16ms	64ms	256ms	1s	4s	16s	gt	max	tag
0.000	0.429	16.102	43.014	40.455	0.000	0.000	0.000	0.000	0.000	0.033	pg175_o2nofp.cx10a_c8r32
0.000	0.511	15.054	38.488	45.948	0.000	0.000	0.000	0.000	0.000	0.034	pg18beta1_o2nofp.cx10b_c8r32
0.000	1.014	14.866	41.444	42.676	0.000	0.000	0.000	0.000	0.000	0.033	pg18beta1_o2nofp.cx10c_c8r32
0.000	0.573	15.326	42.014	42.087	0.000	0.000	0.000	0.000	0.000	0.033	pg18beta1_o2nofp.cx10d_c8r32
l.i2
- l.i2: continue load after secondary indexes created with 5 inserts per transaction
- Legend for results is here.
- Each entry lists the percentage of responses that fit in that bucket (slower than max time for previous bucket, faster than min time for next bucket).
Insert response time histogram
256us	1ms	4ms	16ms	64ms	256ms	1s	4s	16s	gt	max	tag
0.000	10.545	89.403	0.048	0.004	0.000	0.000	0.000	0.000	0.000	0.025	pg175_o2nofp.cx10a_c8r32
0.000	9.489	90.456	0.052	0.003	0.000	0.000	0.000	0.000	0.000	0.027	pg18beta1_o2nofp.cx10b_c8r32
0.000	10.748	89.200	0.050	0.003	0.000	0.000	0.000	0.000	0.000	0.036	pg18beta1_o2nofp.cx10c_c8r32
0.000	10.649	89.303	0.047	0.002	0.000	0.000	0.000	0.000	0.000	0.022	pg18beta1_o2nofp.cx10d_c8r32
Delete response time histogram
256us	1ms	4ms	16ms	64ms	256ms	1s	4s	16s	gt	max	tag
0.000	0.000	0.000	0.000	99.999	0.001	0.000	0.000	0.000	0.000	0.097	pg175_o2nofp.cx10a_c8r32
0.000	0.000	0.000	0.000	99.999	0.001	0.000	0.000	0.000	0.000	0.101	pg18beta1_o2nofp.cx10b_c8r32
0.000	0.000	0.000	0.000	99.999	0.001	0.000	0.000	0.000	0.000	0.102	pg18beta1_o2nofp.cx10c_c8r32
0.000	0.000	0.000	0.000	99.999	0.001	0.000	0.000	0.000	0.000	0.104	pg18beta1_o2nofp.cx10d_c8r32
qr100.L1
- qr100.L1: range queries with 100 insert/s per client
- Legend for results is here.
- Each entry lists the percentage of responses that fit in that bucket (slower than max time for previous bucket, faster than min time for next bucket).
Query response time histogram
256us	1ms	4ms	16ms	64ms	256ms	1s	4s	16s	gt	max	tag
99.997	0.003	nonzero	nonzero	0.000	0.000	0.000	0.000	0.000	0.000	0.009	pg175_o2nofp.cx10a_c8r32
99.996	0.003	nonzero	nonzero	0.000	0.000	0.000	0.000	0.000	0.000	0.010	pg18beta1_o2nofp.cx10b_c8r32
99.996	0.003	nonzero	nonzero	0.000	0.000	0.000	0.000	0.000	0.000	0.010	pg18beta1_o2nofp.cx10c_c8r32
99.996	0.003	nonzero	nonzero	0.000	0.000	0.000	0.000	0.000	0.000	0.010	pg18beta1_o2nofp.cx10d_c8r32
Insert response time histogram
256us	1ms	4ms	16ms	64ms	256ms	1s	4s	16s	gt	max	tag
0.000	0.000	0.000	60.000	40.000	0.000	0.000	0.000	0.000	0.000	0.024	pg175_o2nofp.cx10a_c8r32
0.000	0.000	0.000	60.361	39.639	0.000	0.000	0.000	0.000	0.000	0.024	pg18beta1_o2nofp.cx10b_c8r32
0.000	0.000	0.000	60.889	39.111	0.000	0.000	0.000	0.000	0.000	0.026	pg18beta1_o2nofp.cx10c_c8r32
0.000	0.000	0.000	59.944	40.056	0.000	0.000	0.000	0.000	0.000	0.026	pg18beta1_o2nofp.cx10d_c8r32
Delete response time histogram
256us	1ms	4ms	16ms	64ms	256ms	1s	4s	16s	gt	max	tag
0.000	44.917	55.000	0.083	0.000	0.000	0.000	0.000	0.000	0.000	0.010	pg175_o2nofp.cx10a_c8r32
0.000	48.444	51.500	0.056	0.000	0.000	0.000	0.000	0.000	0.000	0.010	pg18beta1_o2nofp.cx10b_c8r32
0.000	51.306	48.611	0.083	0.000	0.000	0.000	0.000	0.000	0.000	0.010	pg18beta1_o2nofp.cx10c_c8r32
0.000	45.083	54.833	0.083	0.000	0.000	0.000	0.000	0.000	0.000	0.010	pg18beta1_o2nofp.cx10d_c8r32
qp100.L2
- qp100.L2: point queries with 100 insert/s per client
- Legend for results is here.
- Each entry lists the percentage of responses that fit in that bucket (slower than max time for previous bucket, faster than min time for next bucket).
Query response time histogram
256us	1ms	4ms	16ms	64ms	256ms	1s	4s	16s	gt	max	tag
0.000	0.724	99.266	0.010	0.000	0.000	0.000	0.000	0.000	0.000	0.007	pg175_o2nofp.cx10a_c8r32
0.000	0.777	99.211	0.012	0.000	0.000	0.000	0.000	0.000	0.000	0.008	pg18beta1_o2nofp.cx10b_c8r32
0.000	0.720	99.268	0.012	0.000	0.000	0.000	0.000	0.000	0.000	0.007	pg18beta1_o2nofp.cx10c_c8r32
0.000	0.783	99.206	0.011	0.000	0.000	0.000	0.000	0.000	0.000	0.007	pg18beta1_o2nofp.cx10d_c8r32
Insert response time histogram
256us	1ms	4ms	16ms	64ms	256ms	1s	4s	16s	gt	max	tag
0.000	0.000	0.000	99.472	0.528	0.000	0.000	0.000	0.000	0.000	0.019	pg175_o2nofp.cx10a_c8r32
0.000	0.000	0.000	99.444	0.556	0.000	0.000	0.000	0.000	0.000	0.019	pg18beta1_o2nofp.cx10b_c8r32
0.000	0.000	0.000	99.444	0.556	0.000	0.000	0.000	0.000	0.000	0.020	pg18beta1_o2nofp.cx10c_c8r32
0.000	0.000	0.000	99.556	0.444	0.000	0.000	0.000	0.000	0.000	0.019	pg18beta1_o2nofp.cx10d_c8r32
Delete response time histogram
256us	1ms	4ms	16ms	64ms	256ms	1s	4s	16s	gt	max	tag
0.000	0.000	99.222	0.778	0.000	0.000	0.000	0.000	0.000	0.000	0.008	pg175_o2nofp.cx10a_c8r32
0.000	0.000	99.972	0.028	0.000	0.000	0.000	0.000	0.000	0.000	0.008	pg18beta1_o2nofp.cx10b_c8r32
0.000	0.000	97.750	2.250	0.000	0.000	0.000	0.000	0.000	0.000	0.009	pg18beta1_o2nofp.cx10c_c8r32
0.000	0.000	99.972	0.028	0.000	0.000	0.000	0.000	0.000	0.000	0.009	pg18beta1_o2nofp.cx10d_c8r32
qr500.L3
- qr500.L3: range queries with 500 insert/s per client
- Legend for results is here.
- Each entry lists the percentage of responses that fit in that bucket (slower than max time for previous bucket, faster than min time for next bucket).
Query response time histogram
256us	1ms	4ms	16ms	64ms	256ms	1s	4s	16s	gt	max	tag
99.985	0.015	nonzero	nonzero	nonzero	0.000	0.000	0.000	0.000	0.000	0.025	pg175_o2nofp.cx10a_c8r32
99.983	0.016	nonzero	nonzero	nonzero	0.000	0.000	0.000	0.000	0.000	0.032	pg18beta1_o2nofp.cx10b_c8r32
99.983	0.016	nonzero	nonzero	nonzero	0.000	0.000	0.000	0.000	0.000	0.025	pg18beta1_o2nofp.cx10c_c8r32
99.983	0.017	nonzero	nonzero	nonzero	0.000	0.000	0.000	0.000	0.000	0.036	pg18beta1_o2nofp.cx10d_c8r32
Insert response time histogram
256us	1ms	4ms	16ms	64ms	256ms	1s	4s	16s	gt	max	tag
0.000	0.000	0.000	93.489	6.511	0.000	0.000	0.000	0.000	0.000	0.025	pg175_o2nofp.cx10a_c8r32
0.000	0.000	0.000	93.417	6.583	0.000	0.000	0.000	0.000	0.000	0.030	pg18beta1_o2nofp.cx10b_c8r32
0.000	0.000	0.000	93.828	6.172	0.000	0.000	0.000	0.000	0.000	0.031	pg18beta1_o2nofp.cx10c_c8r32
0.000	0.000	0.000	93.722	6.278	0.000	0.000	0.000	0.000	0.000	0.030	pg18beta1_o2nofp.cx10d_c8r32
Delete response time histogram
256us	1ms	4ms	16ms	64ms	256ms	1s	4s	16s	gt	max	tag
0.000	0.000	42.394	57.606	0.000	0.000	0.000	0.000	0.000	0.000	0.014	pg175_o2nofp.cx10a_c8r32
0.000	0.000	40.789	59.211	0.000	0.000	0.000	0.000	0.000	0.000	0.015	pg18beta1_o2nofp.cx10b_c8r32
0.000	0.000	41.406	58.594	0.000	0.000	0.000	0.000	0.000	0.000	0.015	pg18beta1_o2nofp.cx10c_c8r32
0.000	0.000	36.750	63.250	0.000	0.000	0.000	0.000	0.000	0.000	0.015	pg18beta1_o2nofp.cx10d_c8r32
qp500.L4
- qp500.L4: point queries with 500 insert/s per client
- Legend for results is here.
- Each entry lists the percentage of responses that fit in that bucket (slower than max time for previous bucket, faster than min time for next bucket).
Query response time histogram
256us	1ms	4ms	16ms	64ms	256ms	1s	4s	16s	gt	max	tag
0.000	0.415	99.576	0.009	0.000	0.000	0.000	0.000	0.000	0.000	0.007	pg175_o2nofp.cx10a_c8r32
0.000	0.422	99.569	0.009	0.000	0.000	0.000	0.000	0.000	0.000	0.007	pg18beta1_o2nofp.cx10b_c8r32
0.000	0.386	99.605	0.009	0.000	0.000	0.000	0.000	0.000	0.000	0.008	pg18beta1_o2nofp.cx10c_c8r32
0.000	0.390	99.600	0.009	0.000	0.000	0.000	0.000	0.000	0.000	0.008	pg18beta1_o2nofp.cx10d_c8r32
Insert response time histogram
256us	1ms	4ms	16ms	64ms	256ms	1s	4s	16s	gt	max	tag
0.000	0.000	0.000	99.761	0.239	0.000	0.000	0.000	0.000	0.000	0.020	pg175_o2nofp.cx10a_c8r32
0.000	0.000	0.000	99.739	0.261	0.000	0.000	0.000	0.000	0.000	0.018	pg18beta1_o2nofp.cx10b_c8r32
0.000	0.000	0.000	99.767	0.233	0.000	0.000	0.000	0.000	0.000	0.019	pg18beta1_o2nofp.cx10c_c8r32
0.000	0.000	0.000	99.656	0.344	0.000	0.000	0.000	0.000	0.000	0.020	pg18beta1_o2nofp.cx10d_c8r32
Delete response time histogram
256us	1ms	4ms	16ms	64ms	256ms	1s	4s	16s	gt	max	tag
0.000	0.000	0.000	94.533	5.467	0.000	0.000	0.000	0.000	0.000	0.042	pg175_o2nofp.cx10a_c8r32
0.000	0.000	0.000	89.694	10.306	0.000	0.000	0.000	0.000	0.000	0.043	pg18beta1_o2nofp.cx10b_c8r32
0.000	0.000	0.000	87.944	12.056	0.000	0.000	0.000	0.000	0.000	0.043	pg18beta1_o2nofp.cx10c_c8r32
0.000	0.000	0.000	88.894	11.106	0.000	0.000	0.000	0.000	0.000	0.044	pg18beta1_o2nofp.cx10d_c8r32
qr1000.L5
- qr1000.L5: range queries with 1000 insert/s per client
- Legend for results is here.
- Each entry lists the percentage of responses that fit in that bucket (slower than max time for previous bucket, faster than min time for next bucket).
Query response time histogram
256us	1ms	4ms	16ms	64ms	256ms	1s	4s	16s	gt	max	tag
99.955	0.041	0.002	0.001	nonzero	nonzero	0.000	0.000	0.000	0.000	0.096	pg175_o2nofp.cx10a_c8r32
99.950	0.046	0.003	0.001	nonzero	nonzero	0.000	0.000	0.000	0.000	0.091	pg18beta1_o2nofp.cx10b_c8r32
99.949	0.047	0.003	0.001	nonzero	nonzero	0.000	0.000	0.000	0.000	0.091	pg18beta1_o2nofp.cx10c_c8r32
99.951	0.045	0.003	0.001	nonzero	nonzero	0.000	0.000	0.000	0.000	0.089	pg18beta1_o2nofp.cx10d_c8r32
Insert response time histogram
256us	1ms	4ms	16ms	64ms	256ms	1s	4s	16s	gt	max	tag
0.000	0.000	0.000	96.619	3.381	0.000	0.000	0.000	0.000	0.000	0.022	pg175_o2nofp.cx10a_c8r32
0.000	0.000	0.000	97.022	2.978	0.000	0.000	0.000	0.000	0.000	0.022	pg18beta1_o2nofp.cx10b_c8r32
0.000	0.000	0.000	96.753	3.247	0.000	0.000	0.000	0.000	0.000	0.028	pg18beta1_o2nofp.cx10c_c8r32
0.000	0.000	0.000	97.064	2.936	0.000	0.000	0.000	0.000	0.000	0.022	pg18beta1_o2nofp.cx10d_c8r32
Delete response time histogram
256us	1ms	4ms	16ms	64ms	256ms	1s	4s	16s	gt	max	tag
0.000	0.000	0.000	8.806	91.194	0.000	0.000	0.000	0.000	0.000	0.062	pg175_o2nofp.cx10a_c8r32
0.000	0.000	0.000	4.936	95.061	0.003	0.000	0.000	0.000	0.000	0.065	pg18beta1_o2nofp.cx10b_c8r32
0.000	0.000	0.000	8.806	91.192	0.003	0.000	0.000	0.000	0.000	0.066	pg18beta1_o2nofp.cx10c_c8r32
0.000	0.000	0.000	4.400	95.597	0.003	0.000	0.000	0.000	0.000	0.066	pg18beta1_o2nofp.cx10d_c8r32
qp1000.L6
- qp1000.L6: point queries with 1000 insert/s per client
- Legend for results is here.
- Each entry lists the percentage of responses that fit in that bucket (slower than max time for previous bucket, faster than min time for next bucket).
Query response time histogram
256us	1ms	4ms	16ms	64ms	256ms	1s	4s	16s	gt	max	tag
0.000	0.172	99.156	0.669	0.002	0.000	0.000	0.000	0.000	0.000	0.044	pg175_o2nofp.cx10a_c8r32
0.000	0.164	99.071	0.763	0.002	0.000	0.000	0.000	0.000	0.000	0.042	pg18beta1_o2nofp.cx10b_c8r32
0.000	0.145	99.022	0.831	0.002	0.000	0.000	0.000	0.000	0.000	0.043	pg18beta1_o2nofp.cx10c_c8r32
0.000	0.154	99.005	0.838	0.002	0.000	0.000	0.000	0.000	0.000	0.043	pg18beta1_o2nofp.cx10d_c8r32
Insert response time histogram
256us	1ms	4ms	16ms	64ms	256ms	1s	4s	16s	gt	max	tag
0.000	0.000	0.000	98.964	1.036	0.000	0.000	0.000	0.000	0.000	0.053	pg175_o2nofp.cx10a_c8r32
0.000	0.000	0.000	98.744	1.256	0.000	0.000	0.000	0.000	0.000	0.063	pg18beta1_o2nofp.cx10b_c8r32
0.000	0.000	0.000	98.575	1.425	0.000	0.000	0.000	0.000	0.000	0.054	pg18beta1_o2nofp.cx10c_c8r32
0.000	0.000	0.000	98.608	1.392	0.000	0.000	0.000	0.000	0.000	0.047	pg18beta1_o2nofp.cx10d_c8r32
Delete response time histogram
256us	1ms	4ms	16ms	64ms	256ms	1s	4s	16s	gt	max	tag
0.000	0.000	0.000	0.000	99.997	0.003	0.000	0.000	0.000	0.000	0.098	pg175_o2nofp.cx10a_c8r32
0.000	0.000	0.000	0.000	99.997	0.003	0.000	0.000	0.000	0.000	0.106	pg18beta1_o2nofp.cx10b_c8r32
0.000	0.000	0.000	0.000	99.997	0.003	0.000	0.000	0.000	0.000	0.107	pg18beta1_o2nofp.cx10c_c8r32
0.000	0.000	0.000	0.000	99.997	0.003	0.000	0.000	0.000	0.000	0.105	pg18beta1_o2nofp.cx10d_c8r32