Introduction
This is a report for the insert benchmark with 20M docs and 1 client(s). It is generated by scripts (bash, awk, sed) and Tufte might not be impressed. An overview of the insert benchmark is here and a short update is here. Below, by DBMS, I mean DBMS+version.config. An example is my8020.c10b40 where my means MySQL, 8020 is version 8.0.20 and c10b40 is the name for the configuration file.
The test server has 8 AMD cores, 32G RAM and an NVMe SSD. It is described here as the PN53. The benchmark was run with 1 client and there were 1 or 3 connections per client (1 for queries or inserts without rate limits, 1+1 for rate limited inserts+deletes). It uses 1 table. It loads 20M rows per table without secondary indexes, creates 3 secondary indexes per table, then inserts 40m+10m rows per table with a delete per insert to avoid growing the table. It then does 6 read+write tests for 1800s each that do queries as fast as possible with 100,100,500,500,1000,1000 inserts/s and the same for deletes/s per client concurrent with the queries. The database is cached by Postgres. Clients and the DBMS share one server. The per-database configs are in the per-database subdirectories here.
The tested DBMS are:
- pg140_o2nofp.cx10a_c8r32 - Postgres 14.0 with the cx10a_c8r32 config
- pg1418_o2nofp.cx10a_c8r32 - Postgres 14.18 with the cx10a_c8r32 config
- pg150_o2nofp.cx10a_c8r32 - Postgres 15.0 with the cx10a_c8r32 config
- pg1513_o2nofp.cx10a_c8r32 - Postgres 15.13 with the cx10a_c8r32 config
- pg160_o2nofp.cx10a_c8r32 - Postgres 16.0 with the cx10a_c8r32 config
- pg169_o2nofp.cx10a_c8r32 - Postgres 16.9 with the cx10a_c8r32 config
- pg170_o2nofp.cx10a_c8r32 - Postgres 17.0 with the cx10a_c8r32 config
- pg175_o2nofp.cx10a_c8r32 - Postgres 17.5 with the cx10a_c8r32 config
- pg18beta1_o2nofp.cx10b_c8r32 - Postgres 18 beta1 with the cx10b_c8r32 config that uses io_method=sync
Contents
- Summary
- l.i0: load without secondary indexes
- l.x: create secondary indexes
- l.i1: continue load after secondary indexes created with 50 inserts per transaction
- l.i2: continue load after secondary indexes created with 5 inserts per transaction
- qr100.L1: range queries with 100 insert/s per client
- qp100.L2: point queries with 100 insert/s per client
- qr500.L3: range queries with 500 insert/s per client
- qp500.L4: point queries with 500 insert/s per client
- qr1000.L5: range queries with 1000 insert/s per client
- qp1000.L6: point queries with 1000 insert/s per client
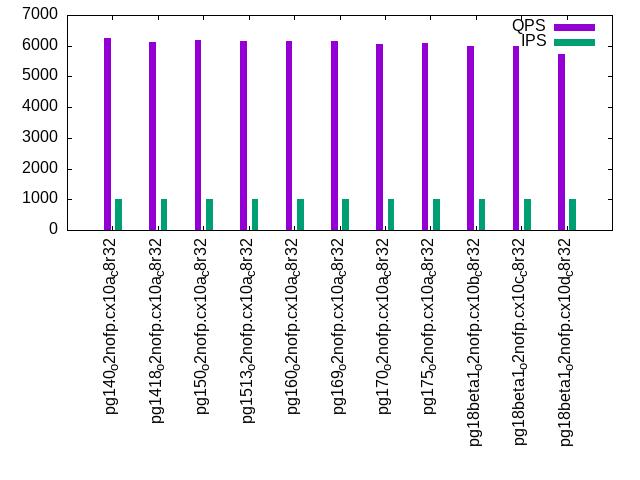
Summary
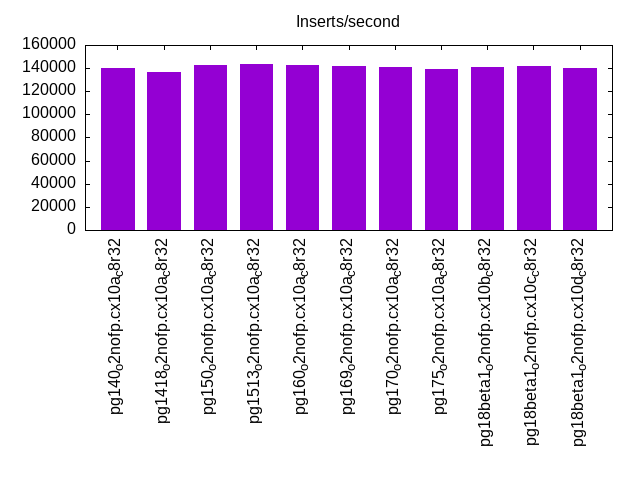
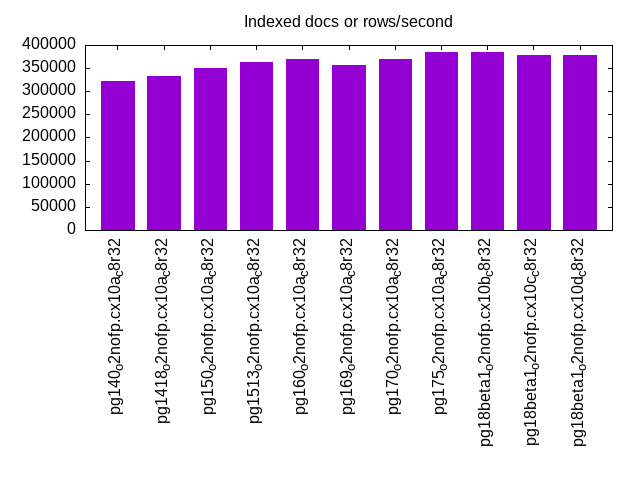
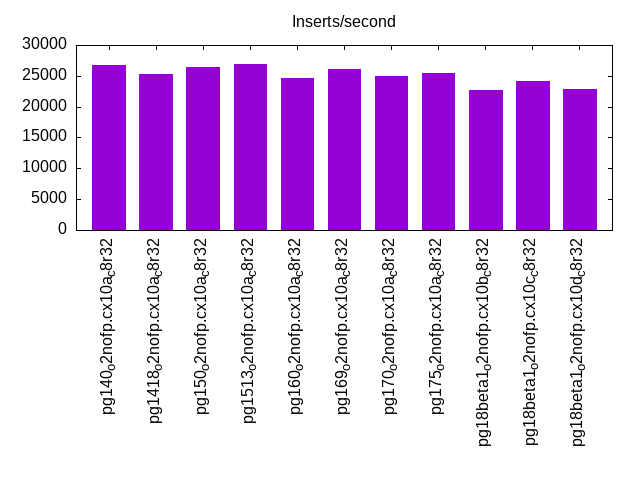
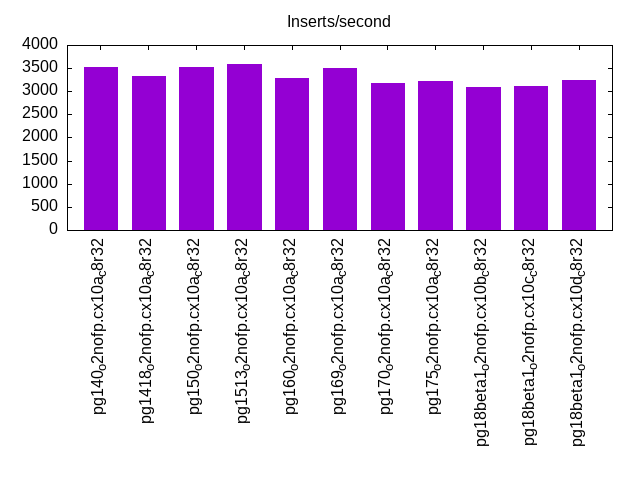
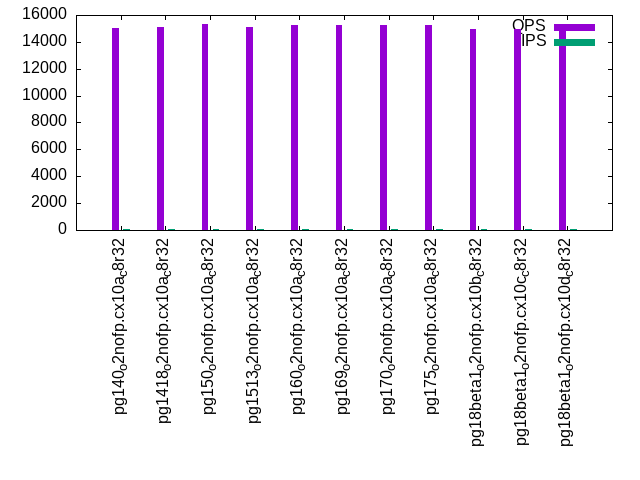
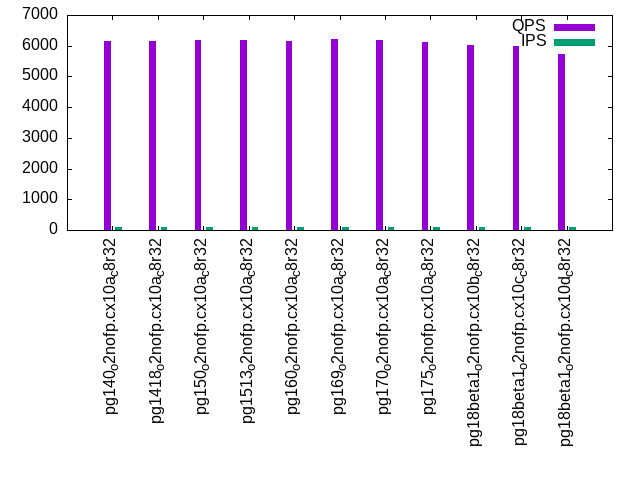
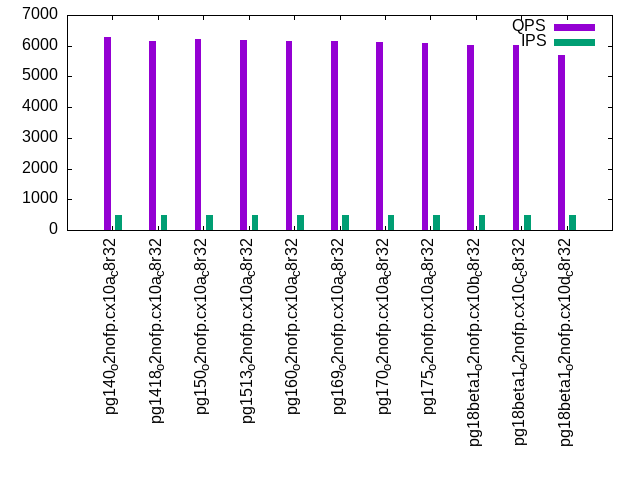
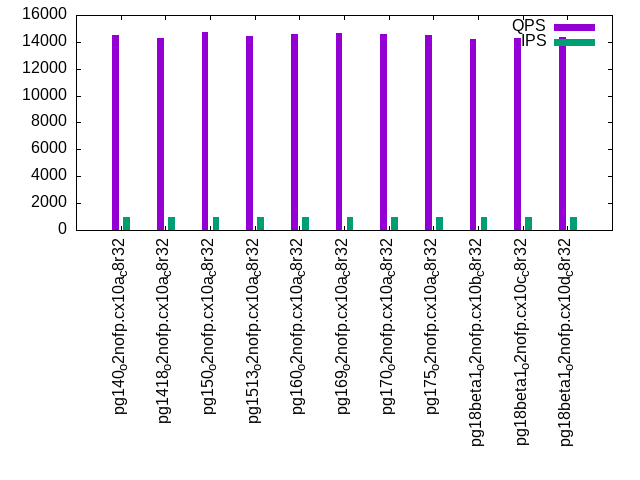
The numbers are inserts/s for l.i0, l.i1 and l.i2, indexed docs (or rows) /s for l.x and queries/s for qr100, qp100 thru qr1000, qp1000" The values are the average rate over the entire test for inserts (IPS) and queries (QPS). The range of values for IPS and QPS is split into 3 parts: bottom 25%, middle 50%, top 25%. Values in the bottom 25% have a red background, values in the top 25% have a green background and values in the middle have no color. A gray background is used for values that can be ignored because the DBMS did not sustain the target insert rate. Red backgrounds are not used when the minimum value is within 80% of the max value.
| dbms | l.i0 | l.x | l.i1 | l.i2 | qr100 | qp100 | qr500 | qp500 | qr1000 | qp1000 |
|---|---|---|---|---|---|---|---|---|---|---|
| pg140_o2nofp.cx10a_c8r32 | 139860 | 322582 | 26828 | 3516 | 15036 | 6166 | 14633 | 6278 | 14490 | 6266 |
| pg1418_o2nofp.cx10a_c8r32 | 136986 | 333335 | 25332 | 3322 | 15080 | 6168 | 14394 | 6150 | 14309 | 6130 |
| pg150_o2nofp.cx10a_c8r32 | 142857 | 350879 | 26472 | 3515 | 15335 | 6193 | 14677 | 6226 | 14746 | 6200 |
| pg1513_o2nofp.cx10a_c8r32 | 143885 | 363638 | 26900 | 3598 | 15133 | 6192 | 14453 | 6188 | 14408 | 6156 |
| pg160_o2nofp.cx10a_c8r32 | 142857 | 370372 | 24600 | 3287 | 15236 | 6148 | 14699 | 6152 | 14584 | 6150 |
| pg169_o2nofp.cx10a_c8r32 | 141844 | 357145 | 26127 | 3511 | 15289 | 6219 | 14718 | 6143 | 14642 | 6164 |
| pg170_o2nofp.cx10a_c8r32 | 140845 | 370372 | 24969 | 3168 | 15258 | 6170 | 14563 | 6106 | 14556 | 6072 |
| pg175_o2nofp.cx10a_c8r32 | 138889 | 384617 | 25413 | 3229 | 15276 | 6135 | 14429 | 6089 | 14499 | 6082 |
| pg18beta1_o2nofp.cx10b_c8r32 | 140845 | 384617 | 22688 | 3089 | 14983 | 6020 | 14276 | 6013 | 14191 | 6003 |
| pg18beta1_o2nofp.cx10c_c8r32 | 141844 | 377360 | 24184 | 3109 | 14966 | 5994 | 14236 | 6011 | 14277 | 5985 |
| pg18beta1_o2nofp.cx10d_c8r32 | 139860 | 377360 | 22792 | 3233 | 14865 | 5734 | 14316 | 5710 | 14369 | 5731 |
This table has relative throughput, throughput for the DBMS relative to the DBMS in the first line, using the absolute throughput from the previous table. Values less than 0.95 have a yellow background. Values greater than 1.05 have a blue background.
| dbms | l.i0 | l.x | l.i1 | l.i2 | qr100 | qp100 | qr500 | qp500 | qr1000 | qp1000 |
|---|---|---|---|---|---|---|---|---|---|---|
| pg140_o2nofp.cx10a_c8r32 | 1.00 | 1.00 | 1.00 | 1.00 | 1.00 | 1.00 | 1.00 | 1.00 | 1.00 | 1.00 |
| pg1418_o2nofp.cx10a_c8r32 | 0.98 | 1.03 | 0.94 | 0.94 | 1.00 | 1.00 | 0.98 | 0.98 | 0.99 | 0.98 |
| pg150_o2nofp.cx10a_c8r32 | 1.02 | 1.09 | 0.99 | 1.00 | 1.02 | 1.00 | 1.00 | 0.99 | 1.02 | 0.99 |
| pg1513_o2nofp.cx10a_c8r32 | 1.03 | 1.13 | 1.00 | 1.02 | 1.01 | 1.00 | 0.99 | 0.99 | 0.99 | 0.98 |
| pg160_o2nofp.cx10a_c8r32 | 1.02 | 1.15 | 0.92 | 0.93 | 1.01 | 1.00 | 1.00 | 0.98 | 1.01 | 0.98 |
| pg169_o2nofp.cx10a_c8r32 | 1.01 | 1.11 | 0.97 | 1.00 | 1.02 | 1.01 | 1.01 | 0.98 | 1.01 | 0.98 |
| pg170_o2nofp.cx10a_c8r32 | 1.01 | 1.15 | 0.93 | 0.90 | 1.01 | 1.00 | 1.00 | 0.97 | 1.00 | 0.97 |
| pg175_o2nofp.cx10a_c8r32 | 0.99 | 1.19 | 0.95 | 0.92 | 1.02 | 0.99 | 0.99 | 0.97 | 1.00 | 0.97 |
| pg18beta1_o2nofp.cx10b_c8r32 | 1.01 | 1.19 | 0.85 | 0.88 | 1.00 | 0.98 | 0.98 | 0.96 | 0.98 | 0.96 |
| pg18beta1_o2nofp.cx10c_c8r32 | 1.01 | 1.17 | 0.90 | 0.88 | 1.00 | 0.97 | 0.97 | 0.96 | 0.99 | 0.96 |
| pg18beta1_o2nofp.cx10d_c8r32 | 1.00 | 1.17 | 0.85 | 0.92 | 0.99 | 0.93 | 0.98 | 0.91 | 0.99 | 0.91 |
This lists the average rate of inserts/s for the tests that do inserts concurrent with queries. For such tests the query rate is listed in the table above. The read+write tests are setup so that the insert rate should match the target rate every second. Cells that are not at least 95% of the target have a red background to indicate a failure to satisfy the target.
| dbms | qr100.L1 | qp100.L2 | qr500.L3 | qp500.L4 | qr1000.L5 | qp1000.L6 |
|---|---|---|---|---|---|---|
| pg140_o2nofp.cx10a_c8r32 | 100 | 100 | 500 | 500 | 1000 | 1000 |
| pg1418_o2nofp.cx10a_c8r32 | 100 | 100 | 500 | 500 | 999 | 999 |
| pg150_o2nofp.cx10a_c8r32 | 100 | 100 | 500 | 500 | 999 | 999 |
| pg1513_o2nofp.cx10a_c8r32 | 100 | 100 | 500 | 500 | 1000 | 999 |
| pg160_o2nofp.cx10a_c8r32 | 100 | 100 | 500 | 500 | 999 | 999 |
| pg169_o2nofp.cx10a_c8r32 | 100 | 100 | 500 | 500 | 999 | 999 |
| pg170_o2nofp.cx10a_c8r32 | 100 | 100 | 500 | 500 | 999 | 999 |
| pg175_o2nofp.cx10a_c8r32 | 100 | 100 | 500 | 500 | 1000 | 999 |
| pg18beta1_o2nofp.cx10b_c8r32 | 100 | 100 | 500 | 500 | 1000 | 1000 |
| pg18beta1_o2nofp.cx10c_c8r32 | 100 | 100 | 500 | 500 | 999 | 999 |
| pg18beta1_o2nofp.cx10d_c8r32 | 100 | 100 | 500 | 500 | 999 | 999 |
| target | 100 | 100 | 500 | 500 | 1000 | 1000 |
l.i0
l.i0: load without secondary indexes. Graphs for performance per 1-second interval are here.
Average throughput:
Insert response time histogram: each cell has the percentage of responses that take <= the time in the header and max is the max response time in seconds. For the max column values in the top 25% of the range have a red background and in the bottom 25% of the range have a green background. The red background is not used when the min value is within 80% of the max value.
| dbms | 256us | 1ms | 4ms | 16ms | 64ms | 256ms | 1s | 4s | 16s | gt | max |
|---|---|---|---|---|---|---|---|---|---|---|---|
| pg140_o2nofp.cx10a_c8r32 | 99.980 | 0.020 | 0.003 | ||||||||
| pg1418_o2nofp.cx10a_c8r32 | 99.979 | 0.020 | 0.001 | 0.005 | |||||||
| pg150_o2nofp.cx10a_c8r32 | 99.984 | 0.015 | 0.003 | ||||||||
| pg1513_o2nofp.cx10a_c8r32 | 99.989 | 0.011 | 0.002 | ||||||||
| pg160_o2nofp.cx10a_c8r32 | 99.987 | 0.013 | 0.002 | ||||||||
| pg169_o2nofp.cx10a_c8r32 | 99.986 | 0.014 | 0.002 | ||||||||
| pg170_o2nofp.cx10a_c8r32 | 99.988 | 0.012 | 0.002 | ||||||||
| pg175_o2nofp.cx10a_c8r32 | 99.982 | 0.018 | 0.003 | ||||||||
| pg18beta1_o2nofp.cx10b_c8r32 | 99.989 | 0.011 | 0.002 | ||||||||
| pg18beta1_o2nofp.cx10c_c8r32 | 99.984 | 0.017 | 0.002 | ||||||||
| pg18beta1_o2nofp.cx10d_c8r32 | 99.980 | 0.020 | 0.002 |
Performance metrics for the DBMS listed above. Some are normalized by throughput, others are not. Legend for results is here.
ips	qps	rps	rmbps	wps	wmbps	rpq	rkbpq	wpi	wkbpi	csps	cpups	cspq	cpupq	dbgb1	dbgb2	rss	maxop	p50	p99	tag
139860	0	0	0.0	523.5	59.2	0.000	0.000	0.004	0.433	16764	19.7	0.120	11	1.9	5.2	0.8	0.003	140183	135583	pg140_o2nofp.cx10a_c8r32
136986	0	0	0.0	513.2	57.9	0.000	0.000	0.004	0.433	16480	19.5	0.120	11	1.9	5.2	2.0	0.005	137483	130883	pg1418_o2nofp.cx10a_c8r32
142857	0	0	0.0	533.4	60.5	0.000	0.000	0.004	0.434	17013	19.5	0.119	11	1.9	5.2	0.4	0.003	143384	137987	pg150_o2nofp.cx10a_c8r32
143885	0	0	0.0	541.1	61.4	0.000	0.000	0.004	0.437	17060	19.9	0.119	11	1.9	5.2	1.7	0.002	143683	136285	pg1513_o2nofp.cx10a_c8r32
142857	0	0	0.0	532.9	60.4	0.000	0.000	0.004	0.433	16959	19.8	0.119	11	1.9	5.2	1.7	0.002	142884	138284	pg160_o2nofp.cx10a_c8r32
141844	0	0	0.0	532.9	60.5	0.000	0.000	0.004	0.437	16918	19.7	0.119	11	1.9	5.2	0.4	0.002	143472	137884	pg169_o2nofp.cx10a_c8r32
140845	0	0	0.0	529.9	60.1	0.000	0.000	0.004	0.437	14473	19.6	0.103	11	1.9	5.2	1.6	0.002	142079	135682	pg170_o2nofp.cx10a_c8r32
138889	0	0	0.0	524.3	59.4	0.000	0.000	0.004	0.438	14300	19.8	0.103	11	1.9	5.2	1.6	0.003	140680	132885	pg175_o2nofp.cx10a_c8r32
140845	0	0	0.0	526.6	59.7	0.000	0.000	0.004	0.434	14333	19.8	0.102	11	1.9	5.2	1.2	0.002	141075	133683	pg18beta1_o2nofp.cx10b_c8r32
141844	0	0	0.0	529.4	60.0	0.000	0.000	0.004	0.433	14363	19.9	0.101	11	1.9	5.2	1.6	0.002	141782	134184	pg18beta1_o2nofp.cx10c_c8r32
139860	0	0	0.0	524.6	59.5	0.000	0.000	0.004	0.435	14210	19.8	0.102	11	1.9	5.2	1.6	0.002	140983	133285	pg18beta1_o2nofp.cx10d_c8r32
l.x
l.x: create secondary indexes.
Average throughput:
Performance metrics for the DBMS listed above. Some are normalized by throughput, others are not. Legend for results is here.
ips	qps	rps	rmbps	wps	wmbps	rpq	rkbpq	wpi	wkbpi	csps	cpups	cspq	cpupq	dbgb1	dbgb2	rss	maxop	p50	p99	tag
322582	0	0	0.0	644.2	78.8	0.000	0.000	0.002	0.250	1934	11.4	0.006	3	3.9	8.9	2.1	0.002	NA	NA	pg140_o2nofp.cx10a_c8r32
333335	0	0	0.0	756.9	92.7	0.000	0.000	0.002	0.285	2049	11.3	0.006	3	3.9	8.9	2.1	0.002	NA	NA	pg1418_o2nofp.cx10a_c8r32
350879	0	0	0.0	704.2	86.3	0.000	0.000	0.002	0.252	2046	11.3	0.006	3	3.9	8.9	2.1	0.002	NA	NA	pg150_o2nofp.cx10a_c8r32
363638	0	1	0.0	846.2	104.0	0.000	0.000	0.002	0.293	1584	11.5	0.004	3	3.9	8.9	2.1	0.002	NA	NA	pg1513_o2nofp.cx10a_c8r32
370372	0	1	0.0	848.2	104.3	0.000	0.000	0.002	0.288	1662	11.5	0.004	2	3.9	8.9	2.1	0.002	NA	NA	pg160_o2nofp.cx10a_c8r32
357145	0	0	0.0	720.9	88.4	0.000	0.000	0.002	0.253	2163	11.4	0.006	3	3.9	8.9	2.1	0.002	NA	NA	pg169_o2nofp.cx10a_c8r32
370372	0	0	0.0	543.8	66.6	0.000	0.000	0.001	0.184	1707	11.5	0.005	2	3.9	8.9	2.1	0.002	NA	NA	pg170_o2nofp.cx10a_c8r32
384617	0	0	0.0	616.1	75.4	0.000	0.000	0.002	0.201	1997	11.7	0.005	2	3.9	8.9	2.1	0.002	NA	NA	pg175_o2nofp.cx10a_c8r32
384617	0	0	0.0	619.5	75.9	0.000	0.000	0.002	0.202	1954	11.7	0.005	2	3.9	8.9	2.1	0.002	NA	NA	pg18beta1_o2nofp.cx10b_c8r32
377360	0	0	0.0	605.8	74.1	0.000	0.000	0.002	0.201	1933	11.5	0.005	2	3.9	8.9	2.1	0.002	NA	NA	pg18beta1_o2nofp.cx10c_c8r32
377360	0	0	0.0	602.5	73.7	0.000	0.000	0.002	0.200	1928	11.5	0.005	2	3.9	8.9	2.1	0.002	NA	NA	pg18beta1_o2nofp.cx10d_c8r32
l.i1
l.i1: continue load after secondary indexes created with 50 inserts per transaction. Graphs for performance per 1-second interval are here.
Average throughput:
Insert response time histogram: each cell has the percentage of responses that take <= the time in the header and max is the max response time in seconds. For the max column values in the top 25% of the range have a red background and in the bottom 25% of the range have a green background. The red background is not used when the min value is within 80% of the max value.
| dbms | 256us | 1ms | 4ms | 16ms | 64ms | 256ms | 1s | 4s | 16s | gt | max |
|---|---|---|---|---|---|---|---|---|---|---|---|
| pg140_o2nofp.cx10a_c8r32 | 52.106 | 47.893 | 0.001 | nonzero | 0.057 | ||||||
| pg1418_o2nofp.cx10a_c8r32 | 55.195 | 44.795 | 0.001 | 0.009 | 0.049 | ||||||
| pg150_o2nofp.cx10a_c8r32 | 48.105 | 51.894 | 0.001 | 0.001 | 0.043 | ||||||
| pg1513_o2nofp.cx10a_c8r32 | 52.287 | 47.712 | 0.001 | nonzero | 0.021 | ||||||
| pg160_o2nofp.cx10a_c8r32 | 49.730 | 50.269 | 0.001 | nonzero | 0.026 | ||||||
| pg169_o2nofp.cx10a_c8r32 | 47.592 | 52.407 | 0.001 | 0.001 | 0.035 | ||||||
| pg170_o2nofp.cx10a_c8r32 | 62.833 | 37.166 | 0.001 | 0.001 | 0.033 | ||||||
| pg175_o2nofp.cx10a_c8r32 | 61.423 | 38.576 | nonzero | 0.001 | 0.030 | ||||||
| pg18beta1_o2nofp.cx10b_c8r32 | 55.584 | 44.411 | 0.004 | 0.001 | 0.059 | ||||||
| pg18beta1_o2nofp.cx10c_c8r32 | 52.173 | 47.818 | 0.002 | 0.008 | 0.050 | ||||||
| pg18beta1_o2nofp.cx10d_c8r32 | 54.231 | 45.767 | 0.001 | 0.001 | 0.028 |
Delete response time histogram: each cell has the percentage of responses that take <= the time in the header and max is the max response time in seconds. For the max column values in the top 25% of the range have a red background and in the bottom 25% of the range have a green background. The red background is not used when the min value is within 80% of the max value.
| dbms | 256us | 1ms | 4ms | 16ms | 64ms | 256ms | 1s | 4s | 16s | gt | max |
|---|---|---|---|---|---|---|---|---|---|---|---|
| pg140_o2nofp.cx10a_c8r32 | 29.212 | 70.767 | 0.020 | 0.001 | 0.056 | ||||||
| pg1418_o2nofp.cx10a_c8r32 | 30.077 | 57.242 | 12.677 | 0.005 | 0.046 | ||||||
| pg150_o2nofp.cx10a_c8r32 | 29.665 | 70.315 | 0.019 | 0.001 | 0.044 | ||||||
| pg1513_o2nofp.cx10a_c8r32 | 30.359 | 69.618 | 0.023 | nonzero | 0.028 | ||||||
| pg160_o2nofp.cx10a_c8r32 | 29.303 | 58.354 | 12.343 | nonzero | 0.030 | ||||||
| pg169_o2nofp.cx10a_c8r32 | 28.678 | 71.299 | 0.022 | 0.001 | 0.035 | ||||||
| pg170_o2nofp.cx10a_c8r32 | 27.842 | 60.098 | 12.059 | 0.001 | 0.033 | ||||||
| pg175_o2nofp.cx10a_c8r32 | 27.450 | 61.732 | 10.817 | 0.001 | 0.030 | ||||||
| pg18beta1_o2nofp.cx10b_c8r32 | 26.747 | 56.502 | 16.750 | 0.001 | 0.027 | ||||||
| pg18beta1_o2nofp.cx10c_c8r32 | 27.270 | 69.559 | 3.165 | 0.006 | 0.049 | ||||||
| pg18beta1_o2nofp.cx10d_c8r32 | 27.140 | 56.922 | 15.937 | 0.001 | 0.030 |
Performance metrics for the DBMS listed above. Some are normalized by throughput, others are not. Legend for results is here.
ips	qps	rps	rmbps	wps	wmbps	rpq	rkbpq	wpi	wkbpi	csps	cpups	cspq	cpupq	dbgb1	dbgb2	rss	maxop	p50	p99	tag
26828	0	0	0.0	299.5	32.2	0.000	0.000	0.011	1.228	12891	22.9	0.481	68	5.3	32.1	5.2	0.057	21098	14447	pg140_o2nofp.cx10a_c8r32
25332	0	0	0.0	281.4	30.2	0.000	0.000	0.011	1.221	12266	22.4	0.484	71	5.4	32.0	2.5	0.049	19798	9998	pg1418_o2nofp.cx10a_c8r32
26472	0	0	0.0	292.8	31.6	0.000	0.000	0.011	1.224	13313	22.8	0.503	69	5.4	32.1	2.5	0.043	20946	14248	pg150_o2nofp.cx10a_c8r32
26900	0	0	0.0	297.6	32.2	0.000	0.000	0.011	1.225	13542	22.8	0.503	68	5.4	32.1	4.3	0.021	21196	14198	pg1513_o2nofp.cx10a_c8r32
24600	0	0	0.0	272.3	29.4	0.000	0.000	0.011	1.225	12397	22.2	0.504	72	5.4	32.1	3.6	0.026	18747	9948	pg160_o2nofp.cx10a_c8r32
26127	0	0	0.0	289.2	31.3	0.000	0.000	0.011	1.226	13086	22.8	0.501	70	5.4	32.1	5.4	0.035	20347	14198	pg169_o2nofp.cx10a_c8r32
24969	0	0	0.0	278.1	30.6	0.000	0.000	0.011	1.255	10337	21.9	0.414	70	5.3	32.1	4.0	0.033	21598	8699	pg170_o2nofp.cx10a_c8r32
25413	0	0	0.0	282.8	31.1	0.000	0.000	0.011	1.254	10500	22.1	0.413	70	5.3	32.0	5.3	0.030	22546	8448	pg175_o2nofp.cx10a_c8r32
22688	0	0	0.0	253.2	28.0	0.000	0.000	0.011	1.266	9423	21.4	0.415	75	5.4	32.0	4.2	0.059	15748	8849	pg18beta1_o2nofp.cx10b_c8r32
24184	0	0	0.0	272.0	30.1	0.000	0.000	0.011	1.273	10125	21.9	0.419	72	5.4	32.0	1.5	0.050	18447	9648	pg18beta1_o2nofp.cx10c_c8r32
22792	0	0	0.0	255.7	28.3	0.000	0.000	0.011	1.272	9502	21.5	0.417	75	5.4	32.1	4.8	0.028	15848	9098	pg18beta1_o2nofp.cx10d_c8r32
l.i2
l.i2: continue load after secondary indexes created with 5 inserts per transaction. Graphs for performance per 1-second interval are here.
Average throughput:
Insert response time histogram: each cell has the percentage of responses that take <= the time in the header and max is the max response time in seconds. For the max column values in the top 25% of the range have a red background and in the bottom 25% of the range have a green background. The red background is not used when the min value is within 80% of the max value.
| dbms | 256us | 1ms | 4ms | 16ms | 64ms | 256ms | 1s | 4s | 16s | gt | max |
|---|---|---|---|---|---|---|---|---|---|---|---|
| pg140_o2nofp.cx10a_c8r32 | 58.694 | 41.306 | nonzero | nonzero | 0.004 | ||||||
| pg1418_o2nofp.cx10a_c8r32 | 58.665 | 41.335 | nonzero | nonzero | nonzero | 0.031 | |||||
| pg150_o2nofp.cx10a_c8r32 | 58.031 | 41.969 | nonzero | nonzero | 0.007 | ||||||
| pg1513_o2nofp.cx10a_c8r32 | 59.772 | 40.228 | nonzero | nonzero | nonzero | 0.050 | |||||
| pg160_o2nofp.cx10a_c8r32 | 54.883 | 45.117 | nonzero | nonzero | nonzero | 0.025 | |||||
| pg169_o2nofp.cx10a_c8r32 | 56.139 | 43.861 | nonzero | nonzero | 0.005 | ||||||
| pg170_o2nofp.cx10a_c8r32 | 61.505 | 38.495 | nonzero | nonzero | 0.010 | ||||||
| pg175_o2nofp.cx10a_c8r32 | 58.218 | 41.781 | nonzero | nonzero | nonzero | 0.036 | |||||
| pg18beta1_o2nofp.cx10b_c8r32 | 56.587 | 43.412 | nonzero | nonzero | nonzero | 0.032 | |||||
| pg18beta1_o2nofp.cx10c_c8r32 | 54.090 | 45.909 | nonzero | nonzero | 0.008 | ||||||
| pg18beta1_o2nofp.cx10d_c8r32 | 56.056 | 43.944 | nonzero | nonzero | 0.032 |
Delete response time histogram: each cell has the percentage of responses that take <= the time in the header and max is the max response time in seconds. For the max column values in the top 25% of the range have a red background and in the bottom 25% of the range have a green background. The red background is not used when the min value is within 80% of the max value.
| dbms | 256us | 1ms | 4ms | 16ms | 64ms | 256ms | 1s | 4s | 16s | gt | max |
|---|---|---|---|---|---|---|---|---|---|---|---|
| pg140_o2nofp.cx10a_c8r32 | 1.966 | 31.536 | 66.496 | 0.002 | 0.014 | ||||||
| pg1418_o2nofp.cx10a_c8r32 | 1.790 | 40.698 | 56.966 | 0.546 | nonzero | 0.032 | |||||
| pg150_o2nofp.cx10a_c8r32 | 1.906 | 32.904 | 65.187 | 0.002 | 0.014 | ||||||
| pg1513_o2nofp.cx10a_c8r32 | 1.851 | 28.436 | 69.710 | 0.002 | nonzero | 0.051 | |||||
| pg160_o2nofp.cx10a_c8r32 | 2.020 | 39.698 | 58.101 | 0.181 | nonzero | 0.026 | |||||
| pg169_o2nofp.cx10a_c8r32 | 1.538 | 32.618 | 65.843 | 0.002 | 0.015 | ||||||
| pg170_o2nofp.cx10a_c8r32 | 1.638 | 40.312 | 54.217 | 3.833 | 0.010 | ||||||
| pg175_o2nofp.cx10a_c8r32 | 1.727 | 37.206 | 57.944 | 3.123 | nonzero | 0.026 | |||||
| pg18beta1_o2nofp.cx10b_c8r32 | 1.575 | 37.725 | 58.990 | 1.710 | nonzero | 0.033 | |||||
| pg18beta1_o2nofp.cx10c_c8r32 | 1.573 | 38.725 | 58.182 | 1.520 | 0.014 | ||||||
| pg18beta1_o2nofp.cx10d_c8r32 | 1.599 | 38.993 | 58.683 | 0.724 | nonzero | 0.032 |
Performance metrics for the DBMS listed above. Some are normalized by throughput, others are not. Legend for results is here.
ips	qps	rps	rmbps	wps	wmbps	rpq	rkbpq	wpi	wkbpi	csps	cpups	cspq	cpupq	dbgb1	dbgb2	rss	maxop	p50	p99	tag
3516	0	0	0.0	62.2	6.0	0.000	0.000	0.018	1.744	16260	16.3	4.624	371	5.4	35.0	1.0	0.004	2665	1825	pg140_o2nofp.cx10a_c8r32
3322	0	0	0.0	60.3	5.8	0.000	0.000	0.018	1.776	15365	16.3	4.625	393	5.4	34.9	0.2	0.031	2315	1140	pg1418_o2nofp.cx10a_c8r32
3515	0	0	0.0	60.1	6.0	0.000	0.000	0.017	1.742	16171	16.2	4.601	369	5.4	35.0	0.6	0.007	2670	1910	pg150_o2nofp.cx10a_c8r32
3598	0	0	0.0	61.4	6.1	0.000	0.000	0.017	1.737	16635	16.3	4.623	362	5.4	35.0	0.2	0.050	2810	1785	pg1513_o2nofp.cx10a_c8r32
3287	0	0	0.0	57.4	5.7	0.000	0.000	0.017	1.765	15175	16.2	4.616	394	5.4	34.9	1.5	0.025	2315	1245	pg160_o2nofp.cx10a_c8r32
3511	0	0	0.0	60.6	6.0	0.000	0.000	0.017	1.753	16164	16.2	4.604	369	5.4	35.1	0.2	0.005	2685	1755	pg169_o2nofp.cx10a_c8r32
3168	0	0	0.0	55.0	5.4	0.000	0.000	0.017	1.733	12248	15.8	3.867	399	5.4	34.5	0.3	0.010	2225	875	pg170_o2nofp.cx10a_c8r32
3229	0	0	0.0	55.3	5.5	0.000	0.000	0.017	1.745	12479	15.9	3.865	394	5.4	34.7	5.1	0.036	2375	1020	pg175_o2nofp.cx10a_c8r32
3089	0	0	0.0	53.5	5.2	0.000	0.000	0.017	1.724	11917	15.9	3.858	412	5.4	34.3	0.3	0.032	2110	1100	pg18beta1_o2nofp.cx10b_c8r32
3109	0	0	0.0	54.2	5.3	0.000	0.000	0.017	1.749	12031	15.9	3.869	409	5.4	34.5	1.5	0.008	2180	1080	pg18beta1_o2nofp.cx10c_c8r32
3233	0	0	0.0	55.2	5.4	0.000	0.000	0.017	1.725	12494	16.0	3.865	396	5.4	34.4	0.8	0.032	2275	1200	pg18beta1_o2nofp.cx10d_c8r32
qr100.L1
qr100.L1: range queries with 100 insert/s per client. Graphs for performance per 1-second interval are here.
Average throughput:
Query response time histogram: each cell has the percentage of responses that take <= the time in the header and max is the max response time in seconds. For max values in the top 25% of the range have a red background and in the bottom 25% of the range have a green background. The red background is not used when the min value is within 80% of the max value.
| dbms | 256us | 1ms | 4ms | 16ms | 64ms | 256ms | 1s | 4s | 16s | gt | max |
|---|---|---|---|---|---|---|---|---|---|---|---|
| pg140_o2nofp.cx10a_c8r32 | 99.996 | 0.004 | nonzero | nonzero | 0.009 | ||||||
| pg1418_o2nofp.cx10a_c8r32 | 99.996 | 0.004 | nonzero | nonzero | 0.009 | ||||||
| pg150_o2nofp.cx10a_c8r32 | 99.997 | 0.003 | nonzero | 0.001 | |||||||
| pg1513_o2nofp.cx10a_c8r32 | 99.998 | 0.002 | 0.001 | ||||||||
| pg160_o2nofp.cx10a_c8r32 | 99.998 | 0.002 | nonzero | 0.001 | |||||||
| pg169_o2nofp.cx10a_c8r32 | 99.998 | 0.002 | nonzero | 0.001 | |||||||
| pg170_o2nofp.cx10a_c8r32 | 99.998 | 0.002 | 0.001 | ||||||||
| pg175_o2nofp.cx10a_c8r32 | 99.998 | 0.002 | 0.001 | ||||||||
| pg18beta1_o2nofp.cx10b_c8r32 | 99.998 | 0.002 | nonzero | 0.001 | |||||||
| pg18beta1_o2nofp.cx10c_c8r32 | 99.998 | 0.002 | 0.001 | ||||||||
| pg18beta1_o2nofp.cx10d_c8r32 | 99.998 | 0.002 | 0.001 |
Insert response time histogram: each cell has the percentage of responses that take <= the time in the header and max is the max response time in seconds. For max values in the top 25% of the range have a red background and in the bottom 25% of the range have a green background. The red background is not used when the min value is within 80% of the max value.
| dbms | 256us | 1ms | 4ms | 16ms | 64ms | 256ms | 1s | 4s | 16s | gt | max |
|---|---|---|---|---|---|---|---|---|---|---|---|
| pg140_o2nofp.cx10a_c8r32 | 0.028 | 99.944 | 0.028 | 0.006 | |||||||
| pg1418_o2nofp.cx10a_c8r32 | 99.944 | 0.056 | 0.006 | ||||||||
| pg150_o2nofp.cx10a_c8r32 | 0.278 | 99.667 | 0.056 | 0.006 | |||||||
| pg1513_o2nofp.cx10a_c8r32 | 1.083 | 98.861 | 0.056 | 0.006 | |||||||
| pg160_o2nofp.cx10a_c8r32 | 0.389 | 99.556 | 0.056 | 0.006 | |||||||
| pg169_o2nofp.cx10a_c8r32 | 0.889 | 99.056 | 0.056 | 0.006 | |||||||
| pg170_o2nofp.cx10a_c8r32 | 2.722 | 97.250 | 0.028 | 0.006 | |||||||
| pg175_o2nofp.cx10a_c8r32 | 0.194 | 99.778 | 0.028 | 0.006 | |||||||
| pg18beta1_o2nofp.cx10b_c8r32 | 0.528 | 99.417 | 0.056 | 0.006 | |||||||
| pg18beta1_o2nofp.cx10c_c8r32 | 2.472 | 97.472 | 0.056 | 0.006 | |||||||
| pg18beta1_o2nofp.cx10d_c8r32 | 0.667 | 99.306 | 0.028 | 0.006 |
Delete response time histogram: each cell has the percentage of responses that take <= the time in the header and max is the max response time in seconds. For max values in the top 25% of the range have a red background and in the bottom 25% of the range have a green background. The red background is not used when the min value is within 80% of the max value.
| dbms | 256us | 1ms | 4ms | 16ms | 64ms | 256ms | 1s | 4s | 16s | gt | max |
|---|---|---|---|---|---|---|---|---|---|---|---|
| pg140_o2nofp.cx10a_c8r32 | 48.056 | 51.944 | 0.002 | ||||||||
| pg1418_o2nofp.cx10a_c8r32 | 50.667 | 49.333 | 0.002 | ||||||||
| pg150_o2nofp.cx10a_c8r32 | 44.889 | 55.111 | 0.002 | ||||||||
| pg1513_o2nofp.cx10a_c8r32 | 53.083 | 46.917 | 0.002 | ||||||||
| pg160_o2nofp.cx10a_c8r32 | 47.972 | 52.028 | 0.002 | ||||||||
| pg169_o2nofp.cx10a_c8r32 | 59.778 | 40.222 | 0.002 | ||||||||
| pg170_o2nofp.cx10a_c8r32 | 51.222 | 48.778 | 0.002 | ||||||||
| pg175_o2nofp.cx10a_c8r32 | 52.250 | 47.750 | 0.002 | ||||||||
| pg18beta1_o2nofp.cx10b_c8r32 | 50.917 | 49.083 | 0.002 | ||||||||
| pg18beta1_o2nofp.cx10c_c8r32 | 54.194 | 45.806 | 0.002 | ||||||||
| pg18beta1_o2nofp.cx10d_c8r32 | 49.583 | 50.417 | 0.002 |
Performance metrics for the DBMS listed above. Some are normalized by throughput, others are not. Legend for results is here.
ips	qps	rps	rmbps	wps	wmbps	rpq	rkbpq	wpi	wkbpi	csps	cpups	cspq	cpupq	dbgb1	dbgb2	rss	maxop	p50	p99	tag
100	15036	0	0.0	13.4	0.6	0.000	0.000	0.134	6.453	57441	12.4	3.820	66	5.4	35.0	0.1	0.009	15038	14733	pg140_o2nofp.cx10a_c8r32
100	15080	0	0.0	13.4	0.6	0.000	0.000	0.134	6.450	57637	12.4	3.822	66	5.4	34.9	0.1	0.009	15086	14750	pg1418_o2nofp.cx10a_c8r32
100	15335	0	0.0	11.3	0.6	0.000	0.000	0.113	6.237	58551	12.4	3.818	65	5.4	35.0	0.1	0.001	15325	15070	pg150_o2nofp.cx10a_c8r32
100	15133	0	0.0	11.3	0.6	0.000	0.000	0.113	6.254	57782	12.4	3.818	66	5.4	35.0	0.1	0.001	15134	14878	pg1513_o2nofp.cx10a_c8r32
100	15236	0	0.0	11.3	0.6	0.000	0.000	0.113	6.242	58171	12.4	3.818	65	5.4	34.9	0.1	0.001	15245	15022	pg160_o2nofp.cx10a_c8r32
100	15289	0	0.0	11.3	0.6	0.000	0.000	0.113	6.245	58376	12.4	3.818	65	5.4	35.1	0.1	0.001	15294	14990	pg169_o2nofp.cx10a_c8r32
100	15258	0	0.0	10.5	0.6	0.000	0.000	0.105	6.297	58280	12.4	3.820	65	5.4	34.5	0.1	0.001	15246	15022	pg170_o2nofp.cx10a_c8r32
100	15276	0	0.0	10.5	0.6	0.000	0.000	0.105	6.258	58351	12.4	3.820	65	5.4	34.7	0.1	0.001	15262	15038	pg175_o2nofp.cx10a_c8r32
100	14983	0	0.0	10.6	0.6	0.000	0.000	0.106	6.294	57198	12.4	3.818	66	5.4	34.4	0.1	0.001	15005	14526	pg18beta1_o2nofp.cx10b_c8r32
100	14966	0	0.0	10.5	0.6	0.000	0.000	0.105	6.290	57134	12.4	3.818	66	5.4	34.5	0.2	0.001	15005	14558	pg18beta1_o2nofp.cx10c_c8r32
100	14865	0	0.0	10.5	0.6	0.000	0.000	0.105	6.295	56782	12.4	3.820	67	5.4	34.4	0.1	0.001	14894	14429	pg18beta1_o2nofp.cx10d_c8r32
qp100.L2
qp100.L2: point queries with 100 insert/s per client. Graphs for performance per 1-second interval are here.
Average throughput:
Query response time histogram: each cell has the percentage of responses that take <= the time in the header and max is the max response time in seconds. For max values in the top 25% of the range have a red background and in the bottom 25% of the range have a green background. The red background is not used when the min value is within 80% of the max value.
| dbms | 256us | 1ms | 4ms | 16ms | 64ms | 256ms | 1s | 4s | 16s | gt | max |
|---|---|---|---|---|---|---|---|---|---|---|---|
| pg140_o2nofp.cx10a_c8r32 | 98.608 | 1.391 | nonzero | 0.002 | |||||||
| pg1418_o2nofp.cx10a_c8r32 | 98.404 | 1.596 | nonzero | 0.001 | |||||||
| pg150_o2nofp.cx10a_c8r32 | 98.411 | 1.589 | nonzero | 0.001 | |||||||
| pg1513_o2nofp.cx10a_c8r32 | 98.281 | 1.719 | 0.001 | ||||||||
| pg160_o2nofp.cx10a_c8r32 | 98.111 | 1.889 | nonzero | 0.001 | |||||||
| pg169_o2nofp.cx10a_c8r32 | 98.297 | 1.703 | nonzero | 0.001 | |||||||
| pg170_o2nofp.cx10a_c8r32 | 98.492 | 1.508 | nonzero | 0.001 | |||||||
| pg175_o2nofp.cx10a_c8r32 | 98.083 | 1.917 | nonzero | 0.001 | |||||||
| pg18beta1_o2nofp.cx10b_c8r32 | 98.522 | 1.478 | nonzero | 0.001 | |||||||
| pg18beta1_o2nofp.cx10c_c8r32 | 98.161 | 1.839 | nonzero | 0.002 | |||||||
| pg18beta1_o2nofp.cx10d_c8r32 | 97.997 | 2.003 | nonzero | 0.001 |
Insert response time histogram: each cell has the percentage of responses that take <= the time in the header and max is the max response time in seconds. For max values in the top 25% of the range have a red background and in the bottom 25% of the range have a green background. The red background is not used when the min value is within 80% of the max value.
| dbms | 256us | 1ms | 4ms | 16ms | 64ms | 256ms | 1s | 4s | 16s | gt | max |
|---|---|---|---|---|---|---|---|---|---|---|---|
| pg140_o2nofp.cx10a_c8r32 | 99.944 | 0.056 | 0.005 | ||||||||
| pg1418_o2nofp.cx10a_c8r32 | 99.944 | 0.056 | 0.005 | ||||||||
| pg150_o2nofp.cx10a_c8r32 | 99.972 | 0.028 | 0.006 | ||||||||
| pg1513_o2nofp.cx10a_c8r32 | 99.944 | 0.056 | 0.006 | ||||||||
| pg160_o2nofp.cx10a_c8r32 | 99.944 | 0.056 | 0.005 | ||||||||
| pg169_o2nofp.cx10a_c8r32 | 99.944 | 0.056 | 0.009 | ||||||||
| pg170_o2nofp.cx10a_c8r32 | 99.972 | 0.028 | 0.005 | ||||||||
| pg175_o2nofp.cx10a_c8r32 | 99.944 | 0.056 | 0.005 | ||||||||
| pg18beta1_o2nofp.cx10b_c8r32 | 99.944 | 0.056 | 0.006 | ||||||||
| pg18beta1_o2nofp.cx10c_c8r32 | 99.722 | 0.278 | 0.010 | ||||||||
| pg18beta1_o2nofp.cx10d_c8r32 | 99.944 | 0.056 | 0.006 |
Delete response time histogram: each cell has the percentage of responses that take <= the time in the header and max is the max response time in seconds. For max values in the top 25% of the range have a red background and in the bottom 25% of the range have a green background. The red background is not used when the min value is within 80% of the max value.
| dbms | 256us | 1ms | 4ms | 16ms | 64ms | 256ms | 1s | 4s | 16s | gt | max |
|---|---|---|---|---|---|---|---|---|---|---|---|
| pg140_o2nofp.cx10a_c8r32 | 14.278 | 85.722 | 0.004 | ||||||||
| pg1418_o2nofp.cx10a_c8r32 | 10.389 | 89.611 | 0.004 | ||||||||
| pg150_o2nofp.cx10a_c8r32 | 6.500 | 93.472 | 0.028 | 0.005 | |||||||
| pg1513_o2nofp.cx10a_c8r32 | 11.778 | 88.194 | 0.028 | 0.004 | |||||||
| pg160_o2nofp.cx10a_c8r32 | 10.306 | 89.667 | 0.028 | 0.004 | |||||||
| pg169_o2nofp.cx10a_c8r32 | 7.694 | 92.306 | 0.004 | ||||||||
| pg170_o2nofp.cx10a_c8r32 | 8.556 | 91.417 | 0.028 | 0.004 | |||||||
| pg175_o2nofp.cx10a_c8r32 | 7.028 | 92.944 | 0.028 | 0.004 | |||||||
| pg18beta1_o2nofp.cx10b_c8r32 | 0.722 | 99.250 | 0.028 | 0.005 | |||||||
| pg18beta1_o2nofp.cx10c_c8r32 | 4.194 | 95.778 | 0.028 | 0.004 | |||||||
| pg18beta1_o2nofp.cx10d_c8r32 | 0.167 | 99.806 | 0.028 | 0.004 |
Performance metrics for the DBMS listed above. Some are normalized by throughput, others are not. Legend for results is here.
ips	qps	rps	rmbps	wps	wmbps	rpq	rkbpq	wpi	wkbpi	csps	cpups	cspq	cpupq	dbgb1	dbgb2	rss	maxop	p50	p99	tag
100	6166	0	0.0	42.8	1.4	0.000	0.000	0.428	14.374	25526	13.3	4.139	173	5.4	35.0	0.1	0.002	6175	5983	pg140_o2nofp.cx10a_c8r32
100	6168	0	0.0	42.8	1.4	0.000	0.000	0.428	14.325	25517	13.2	4.137	171	5.4	34.9	0.2	0.001	6191	5967	pg1418_o2nofp.cx10a_c8r32
100	6193	0	0.0	40.7	1.4	0.000	0.000	0.407	14.107	25332	13.0	4.091	168	5.4	35.0	0.1	0.001	6223	5951	pg150_o2nofp.cx10a_c8r32
100	6192	0	0.0	40.5	1.4	0.000	0.000	0.405	14.109	25328	12.9	4.091	167	5.4	35.0	0.1	0.001	6222	5951	pg1513_o2nofp.cx10a_c8r32
100	6148	0	0.0	40.6	1.4	0.000	0.000	0.406	14.111	25153	12.9	4.091	168	5.4	34.9	0.2	0.001	6175	5935	pg160_o2nofp.cx10a_c8r32
100	6219	0	0.0	40.6	1.4	0.000	0.000	0.406	14.115	25437	13.0	4.090	167	5.4	35.1	0.2	0.001	6271	5935	pg169_o2nofp.cx10a_c8r32
100	6170	0	0.0	39.3	1.4	0.000	0.000	0.393	14.093	25232	13.1	4.090	170	5.4	34.5	0.1	0.001	6206	5935	pg170_o2nofp.cx10a_c8r32
100	6135	0	0.0	39.4	1.4	0.000	0.000	0.394	14.108	25094	12.9	4.090	168	5.4	34.7	0.5	0.001	6175	5919	pg175_o2nofp.cx10a_c8r32
100	6020	0	0.0	39.4	1.4	0.000	0.000	0.394	14.116	24653	12.8	4.095	170	5.4	34.4	0.1	0.001	6015	5903	pg18beta1_o2nofp.cx10b_c8r32
100	5994	0	0.0	39.3	1.4	0.000	0.000	0.393	14.146	24540	12.7	4.094	169	5.4	34.5	0.1	0.002	5967	5903	pg18beta1_o2nofp.cx10c_c8r32
100	5734	0	0.0	39.5	1.4	0.000	0.000	0.396	14.137	23547	13.4	4.107	187	5.4	34.4	0.1	0.001	5711	5519	pg18beta1_o2nofp.cx10d_c8r32
qr500.L3
qr500.L3: range queries with 500 insert/s per client. Graphs for performance per 1-second interval are here.
Average throughput:

Query response time histogram: each cell has the percentage of responses that take <= the time in the header and max is the max response time in seconds. For max values in the top 25% of the range have a red background and in the bottom 25% of the range have a green background. The red background is not used when the min value is within 80% of the max value.
| dbms | 256us | 1ms | 4ms | 16ms | 64ms | 256ms | 1s | 4s | 16s | gt | max |
|---|---|---|---|---|---|---|---|---|---|---|---|
| pg140_o2nofp.cx10a_c8r32 | 99.994 | 0.006 | nonzero | 0.002 | |||||||
| pg1418_o2nofp.cx10a_c8r32 | 99.994 | 0.006 | nonzero | 0.002 | |||||||
| pg150_o2nofp.cx10a_c8r32 | 99.997 | 0.003 | nonzero | 0.002 | |||||||
| pg1513_o2nofp.cx10a_c8r32 | 99.995 | 0.005 | nonzero | 0.002 | |||||||
| pg160_o2nofp.cx10a_c8r32 | 99.995 | 0.005 | nonzero | 0.003 | |||||||
| pg169_o2nofp.cx10a_c8r32 | 99.995 | 0.005 | nonzero | nonzero | 0.006 | ||||||
| pg170_o2nofp.cx10a_c8r32 | 99.996 | 0.004 | nonzero | 0.002 | |||||||
| pg175_o2nofp.cx10a_c8r32 | 99.997 | 0.003 | nonzero | 0.002 | |||||||
| pg18beta1_o2nofp.cx10b_c8r32 | 99.996 | 0.004 | nonzero | 0.002 | |||||||
| pg18beta1_o2nofp.cx10c_c8r32 | 99.996 | 0.004 | nonzero | nonzero | 0.031 | ||||||
| pg18beta1_o2nofp.cx10d_c8r32 | 99.996 | 0.004 | nonzero | 0.003 |
Insert response time histogram: each cell has the percentage of responses that take <= the time in the header and max is the max response time in seconds. For max values in the top 25% of the range have a red background and in the bottom 25% of the range have a green background. The red background is not used when the min value is within 80% of the max value.
| dbms | 256us | 1ms | 4ms | 16ms | 64ms | 256ms | 1s | 4s | 16s | gt | max |
|---|---|---|---|---|---|---|---|---|---|---|---|
| pg140_o2nofp.cx10a_c8r32 | 22.267 | 77.644 | 0.089 | 0.010 | |||||||
| pg1418_o2nofp.cx10a_c8r32 | 14.944 | 84.856 | 0.200 | 0.011 | |||||||
| pg150_o2nofp.cx10a_c8r32 | 24.978 | 74.989 | 0.033 | 0.009 | |||||||
| pg1513_o2nofp.cx10a_c8r32 | 30.444 | 69.489 | 0.067 | 0.010 | |||||||
| pg160_o2nofp.cx10a_c8r32 | 22.744 | 77.239 | 0.017 | 0.010 | |||||||
| pg169_o2nofp.cx10a_c8r32 | 24.383 | 75.494 | 0.122 | 0.010 | |||||||
| pg170_o2nofp.cx10a_c8r32 | 29.822 | 70.122 | 0.056 | 0.010 | |||||||
| pg175_o2nofp.cx10a_c8r32 | 26.056 | 73.922 | 0.022 | 0.010 | |||||||
| pg18beta1_o2nofp.cx10b_c8r32 | 29.656 | 70.322 | 0.022 | 0.007 | |||||||
| pg18beta1_o2nofp.cx10c_c8r32 | 29.072 | 70.706 | 0.222 | 0.011 | |||||||
| pg18beta1_o2nofp.cx10d_c8r32 | 28.811 | 71.144 | 0.044 | 0.010 |
Delete response time histogram: each cell has the percentage of responses that take <= the time in the header and max is the max response time in seconds. For max values in the top 25% of the range have a red background and in the bottom 25% of the range have a green background. The red background is not used when the min value is within 80% of the max value.
| dbms | 256us | 1ms | 4ms | 16ms | 64ms | 256ms | 1s | 4s | 16s | gt | max |
|---|---|---|---|---|---|---|---|---|---|---|---|
| pg140_o2nofp.cx10a_c8r32 | 24.700 | 74.956 | 0.344 | 0.010 | |||||||
| pg1418_o2nofp.cx10a_c8r32 | 23.900 | 75.917 | 0.183 | 0.010 | |||||||
| pg150_o2nofp.cx10a_c8r32 | 23.383 | 76.428 | 0.189 | 0.008 | |||||||
| pg1513_o2nofp.cx10a_c8r32 | 19.300 | 80.550 | 0.150 | 0.010 | |||||||
| pg160_o2nofp.cx10a_c8r32 | 23.156 | 76.628 | 0.217 | 0.006 | |||||||
| pg169_o2nofp.cx10a_c8r32 | 23.572 | 75.583 | 0.844 | 0.010 | |||||||
| pg170_o2nofp.cx10a_c8r32 | 18.556 | 80.311 | 1.133 | 0.012 | |||||||
| pg175_o2nofp.cx10a_c8r32 | 19.417 | 79.467 | 1.117 | 0.007 | |||||||
| pg18beta1_o2nofp.cx10b_c8r32 | 22.367 | 77.011 | 0.622 | 0.006 | |||||||
| pg18beta1_o2nofp.cx10c_c8r32 | 15.650 | 83.594 | 0.756 | 0.011 | |||||||
| pg18beta1_o2nofp.cx10d_c8r32 | 18.456 | 80.933 | 0.611 | 0.010 |
Performance metrics for the DBMS listed above. Some are normalized by throughput, others are not. Legend for results is here.
ips	qps	rps	rmbps	wps	wmbps	rpq	rkbpq	wpi	wkbpi	csps	cpups	cspq	cpupq	dbgb1	dbgb2	rss	maxop	p50	p99	tag
500	14633	0	0.0	52.1	1.8	0.000	0.000	0.104	3.728	56101	13.1	3.834	72	5.4	35.0	0.3	0.002	14558	14013	pg140_o2nofp.cx10a_c8r32
500	14394	0	0.0	52.4	1.8	0.000	0.000	0.105	3.768	55164	13.0	3.832	72	5.4	34.9	0.3	0.002	14350	13790	pg1418_o2nofp.cx10a_c8r32
500	14677	0	0.0	50.0	1.8	0.000	0.000	0.100	3.675	56221	13.0	3.831	71	5.4	35.0	5.3	0.002	14621	14030	pg150_o2nofp.cx10a_c8r32
500	14453	0	0.0	50.0	1.8	0.000	0.000	0.100	3.675	55335	13.0	3.829	72	5.4	35.0	0.3	0.002	14414	13854	pg1513_o2nofp.cx10a_c8r32
500	14699	0	0.0	50.2	1.8	0.000	0.000	0.100	3.675	56278	13.0	3.829	71	5.4	34.9	2.8	0.003	14621	14030	pg160_o2nofp.cx10a_c8r32
500	14718	0	0.0	50.2	1.8	0.000	0.000	0.101	3.719	56384	13.1	3.831	71	5.4	35.2	5.5	0.006	14637	14094	pg169_o2nofp.cx10a_c8r32
500	14563	0	0.0	49.5	1.8	0.000	0.000	0.099	3.706	55731	12.9	3.827	71	5.4	34.5	0.3	0.002	14509	13854	pg170_o2nofp.cx10a_c8r32
500	14429	0	0.0	49.5	1.8	0.000	0.000	0.099	3.678	55214	13.0	3.827	72	5.4	34.7	0.3	0.002	14382	13709	pg175_o2nofp.cx10a_c8r32
500	14276	0	0.0	49.5	1.8	0.000	0.000	0.099	3.689	54668	12.9	3.829	72	5.4	34.4	0.3	0.002	14254	13550	pg18beta1_o2nofp.cx10b_c8r32
500	14236	0	0.0	49.6	1.8	0.000	0.000	0.099	3.745	54486	13.0	3.827	73	5.4	34.5	0.3	0.031	14238	13550	pg18beta1_o2nofp.cx10c_c8r32
500	14316	0	0.0	49.6	1.8	0.000	0.000	0.099	3.695	54788	12.9	3.827	72	5.4	34.4	4.7	0.003	14318	13629	pg18beta1_o2nofp.cx10d_c8r32
qp500.L4
qp500.L4: point queries with 500 insert/s per client. Graphs for performance per 1-second interval are here.
Average throughput:
Query response time histogram: each cell has the percentage of responses that take <= the time in the header and max is the max response time in seconds. For max values in the top 25% of the range have a red background and in the bottom 25% of the range have a green background. The red background is not used when the min value is within 80% of the max value.
| dbms | 256us | 1ms | 4ms | 16ms | 64ms | 256ms | 1s | 4s | 16s | gt | max |
|---|---|---|---|---|---|---|---|---|---|---|---|
| pg140_o2nofp.cx10a_c8r32 | 98.847 | 1.153 | nonzero | 0.002 | |||||||
| pg1418_o2nofp.cx10a_c8r32 | 98.329 | 1.671 | nonzero | 0.003 | |||||||
| pg150_o2nofp.cx10a_c8r32 | 98.343 | 1.657 | nonzero | 0.002 | |||||||
| pg1513_o2nofp.cx10a_c8r32 | 98.339 | 1.661 | nonzero | 0.002 | |||||||
| pg160_o2nofp.cx10a_c8r32 | 98.190 | 1.810 | nonzero | 0.002 | |||||||
| pg169_o2nofp.cx10a_c8r32 | 98.065 | 1.935 | nonzero | 0.002 | |||||||
| pg170_o2nofp.cx10a_c8r32 | 98.143 | 1.857 | nonzero | 0.002 | |||||||
| pg175_o2nofp.cx10a_c8r32 | 98.123 | 1.877 | nonzero | 0.002 | |||||||
| pg18beta1_o2nofp.cx10b_c8r32 | 98.171 | 1.829 | nonzero | 0.002 | |||||||
| pg18beta1_o2nofp.cx10c_c8r32 | 98.004 | 1.996 | nonzero | 0.001 | |||||||
| pg18beta1_o2nofp.cx10d_c8r32 | 97.839 | 2.161 | nonzero | 0.002 |
Insert response time histogram: each cell has the percentage of responses that take <= the time in the header and max is the max response time in seconds. For max values in the top 25% of the range have a red background and in the bottom 25% of the range have a green background. The red background is not used when the min value is within 80% of the max value.
| dbms | 256us | 1ms | 4ms | 16ms | 64ms | 256ms | 1s | 4s | 16s | gt | max |
|---|---|---|---|---|---|---|---|---|---|---|---|
| pg140_o2nofp.cx10a_c8r32 | 13.467 | 86.522 | 0.011 | 0.009 | |||||||
| pg1418_o2nofp.cx10a_c8r32 | 9.939 | 90.011 | 0.050 | 0.009 | |||||||
| pg150_o2nofp.cx10a_c8r32 | 9.650 | 90.189 | 0.156 | 0.006 | 0.018 | ||||||
| pg1513_o2nofp.cx10a_c8r32 | 14.128 | 85.678 | 0.194 | 0.011 | |||||||
| pg160_o2nofp.cx10a_c8r32 | 8.700 | 91.200 | 0.100 | 0.010 | |||||||
| pg169_o2nofp.cx10a_c8r32 | 13.483 | 86.478 | 0.039 | 0.010 | |||||||
| pg170_o2nofp.cx10a_c8r32 | 16.150 | 83.717 | 0.133 | 0.010 | |||||||
| pg175_o2nofp.cx10a_c8r32 | 10.622 | 89.239 | 0.139 | 0.010 | |||||||
| pg18beta1_o2nofp.cx10b_c8r32 | 15.678 | 84.294 | 0.028 | 0.010 | |||||||
| pg18beta1_o2nofp.cx10c_c8r32 | 15.822 | 84.161 | 0.011 | 0.006 | 0.021 | ||||||
| pg18beta1_o2nofp.cx10d_c8r32 | 13.567 | 86.306 | 0.128 | 0.013 |
Delete response time histogram: each cell has the percentage of responses that take <= the time in the header and max is the max response time in seconds. For max values in the top 25% of the range have a red background and in the bottom 25% of the range have a green background. The red background is not used when the min value is within 80% of the max value.
| dbms | 256us | 1ms | 4ms | 16ms | 64ms | 256ms | 1s | 4s | 16s | gt | max |
|---|---|---|---|---|---|---|---|---|---|---|---|
| pg140_o2nofp.cx10a_c8r32 | 20.811 | 78.889 | 0.300 | 0.008 | |||||||
| pg1418_o2nofp.cx10a_c8r32 | 22.144 | 77.561 | 0.294 | 0.009 | |||||||
| pg150_o2nofp.cx10a_c8r32 | 18.961 | 80.811 | 0.222 | 0.006 | 0.017 | ||||||
| pg1513_o2nofp.cx10a_c8r32 | 20.567 | 79.178 | 0.256 | 0.010 | |||||||
| pg160_o2nofp.cx10a_c8r32 | 18.800 | 80.789 | 0.411 | 0.004 | |||||||
| pg169_o2nofp.cx10a_c8r32 | 22.989 | 73.589 | 3.422 | 0.009 | |||||||
| pg170_o2nofp.cx10a_c8r32 | 19.233 | 79.339 | 1.428 | 0.011 | |||||||
| pg175_o2nofp.cx10a_c8r32 | 17.572 | 81.078 | 1.350 | 0.010 | |||||||
| pg18beta1_o2nofp.cx10b_c8r32 | 16.906 | 82.217 | 0.878 | 0.005 | |||||||
| pg18beta1_o2nofp.cx10c_c8r32 | 17.500 | 81.672 | 0.822 | 0.006 | 0.019 | ||||||
| pg18beta1_o2nofp.cx10d_c8r32 | 17.178 | 82.028 | 0.794 | 0.011 |
Performance metrics for the DBMS listed above. Some are normalized by throughput, others are not. Legend for results is here.
ips	qps	rps	rmbps	wps	wmbps	rpq	rkbpq	wpi	wkbpi	csps	cpups	cspq	cpupq	dbgb1	dbgb2	rss	maxop	p50	p99	tag
500	6278	0	0.0	30.8	2.3	0.000	0.000	0.062	4.638	26101	13.4	4.158	171	5.4	34.0	0.3	0.002	6303	6031	pg140_o2nofp.cx10a_c8r32
500	6150	0	0.0	30.9	2.3	0.000	0.000	0.062	4.643	25593	13.4	4.162	174	5.5	34.0	0.3	0.003	6159	5951	pg1418_o2nofp.cx10a_c8r32
500	6226	0	0.0	29.1	2.3	0.000	0.000	0.058	4.668	25609	13.4	4.113	172	5.5	34.0	0.3	0.002	6271	5967	pg150_o2nofp.cx10a_c8r32
500	6188	0	0.0	29.0	2.3	0.000	0.000	0.058	4.658	25444	13.4	4.112	173	5.5	34.0	0.3	0.002	6207	5951	pg1513_o2nofp.cx10a_c8r32
500	6152	0	0.0	28.8	2.2	0.000	0.000	0.058	4.602	25313	13.4	4.115	174	5.5	34.0	2.9	0.002	6175	5935	pg160_o2nofp.cx10a_c8r32
500	6143	0	0.0	28.9	2.3	0.000	0.000	0.058	4.629	25276	13.5	4.115	176	5.5	34.1	2.9	0.002	6191	5919	pg169_o2nofp.cx10a_c8r32
500	6106	0	0.0	27.7	2.3	0.000	0.000	0.055	4.648	25096	13.4	4.110	176	5.5	34.1	0.3	0.002	6127	5919	pg170_o2nofp.cx10a_c8r32
500	6089	0	0.0	27.8	2.3	0.000	0.000	0.056	4.666	25024	13.5	4.110	177	5.5	34.1	0.3	0.002	6111	5919	pg175_o2nofp.cx10a_c8r32
500	6013	0	0.0	28.1	2.2	0.000	0.000	0.056	4.568	24729	13.5	4.113	180	5.4	34.0	0.2	0.002	5999	5903	pg18beta1_o2nofp.cx10b_c8r32
500	6011	0	0.0	28.2	2.2	0.000	0.000	0.056	4.570	24726	13.5	4.113	180	5.4	34.0	0.3	0.001	5999	5903	pg18beta1_o2nofp.cx10c_c8r32
500	5710	0	0.0	28.3	2.3	0.000	0.000	0.057	4.636	23555	13.5	4.126	189	5.5	34.1	0.3	0.002	5663	5519	pg18beta1_o2nofp.cx10d_c8r32
qr1000.L5
qr1000.L5: range queries with 1000 insert/s per client. Graphs for performance per 1-second interval are here.
Average throughput:
Query response time histogram: each cell has the percentage of responses that take <= the time in the header and max is the max response time in seconds. For max values in the top 25% of the range have a red background and in the bottom 25% of the range have a green background. The red background is not used when the min value is within 80% of the max value.
| dbms | 256us | 1ms | 4ms | 16ms | 64ms | 256ms | 1s | 4s | 16s | gt | max |
|---|---|---|---|---|---|---|---|---|---|---|---|
| pg140_o2nofp.cx10a_c8r32 | 99.994 | 0.006 | nonzero | 0.002 | |||||||
| pg1418_o2nofp.cx10a_c8r32 | 99.994 | 0.006 | nonzero | 0.002 | |||||||
| pg150_o2nofp.cx10a_c8r32 | 99.995 | 0.005 | nonzero | 0.002 | |||||||
| pg1513_o2nofp.cx10a_c8r32 | 99.996 | 0.004 | nonzero | 0.002 | |||||||
| pg160_o2nofp.cx10a_c8r32 | 99.996 | 0.004 | nonzero | 0.002 | |||||||
| pg169_o2nofp.cx10a_c8r32 | 99.996 | 0.004 | nonzero | 0.003 | |||||||
| pg170_o2nofp.cx10a_c8r32 | 99.996 | 0.004 | nonzero | nonzero | 0.004 | ||||||
| pg175_o2nofp.cx10a_c8r32 | 99.996 | 0.004 | nonzero | 0.002 | |||||||
| pg18beta1_o2nofp.cx10b_c8r32 | 99.994 | 0.006 | nonzero | nonzero | 0.006 | ||||||
| pg18beta1_o2nofp.cx10c_c8r32 | 99.994 | 0.006 | nonzero | 0.003 | |||||||
| pg18beta1_o2nofp.cx10d_c8r32 | 99.994 | 0.006 | nonzero | 0.004 |
Insert response time histogram: each cell has the percentage of responses that take <= the time in the header and max is the max response time in seconds. For max values in the top 25% of the range have a red background and in the bottom 25% of the range have a green background. The red background is not used when the min value is within 80% of the max value.
| dbms | 256us | 1ms | 4ms | 16ms | 64ms | 256ms | 1s | 4s | 16s | gt | max |
|---|---|---|---|---|---|---|---|---|---|---|---|
| pg140_o2nofp.cx10a_c8r32 | 41.142 | 58.836 | 0.022 | 0.010 | |||||||
| pg1418_o2nofp.cx10a_c8r32 | 37.864 | 62.128 | 0.008 | 0.010 | |||||||
| pg150_o2nofp.cx10a_c8r32 | 43.567 | 56.425 | 0.008 | 0.008 | |||||||
| pg1513_o2nofp.cx10a_c8r32 | 48.269 | 51.719 | 0.011 | 0.010 | |||||||
| pg160_o2nofp.cx10a_c8r32 | 41.583 | 58.386 | 0.031 | 0.010 | |||||||
| pg169_o2nofp.cx10a_c8r32 | 42.528 | 57.461 | 0.011 | 0.006 | |||||||
| pg170_o2nofp.cx10a_c8r32 | 47.233 | 52.764 | 0.003 | 0.005 | |||||||
| pg175_o2nofp.cx10a_c8r32 | 42.983 | 57.008 | 0.008 | 0.006 | |||||||
| pg18beta1_o2nofp.cx10b_c8r32 | 42.094 | 57.847 | 0.058 | 0.010 | |||||||
| pg18beta1_o2nofp.cx10c_c8r32 | 48.808 | 51.178 | 0.014 | 0.010 | |||||||
| pg18beta1_o2nofp.cx10d_c8r32 | 43.917 | 56.078 | 0.006 | 0.005 |
Delete response time histogram: each cell has the percentage of responses that take <= the time in the header and max is the max response time in seconds. For max values in the top 25% of the range have a red background and in the bottom 25% of the range have a green background. The red background is not used when the min value is within 80% of the max value.
| dbms | 256us | 1ms | 4ms | 16ms | 64ms | 256ms | 1s | 4s | 16s | gt | max |
|---|---|---|---|---|---|---|---|---|---|---|---|
| pg140_o2nofp.cx10a_c8r32 | 22.106 | 77.756 | 0.139 | 0.005 | |||||||
| pg1418_o2nofp.cx10a_c8r32 | 22.861 | 77.078 | 0.061 | 0.004 | |||||||
| pg150_o2nofp.cx10a_c8r32 | 21.364 | 78.561 | 0.075 | 0.005 | |||||||
| pg1513_o2nofp.cx10a_c8r32 | 24.486 | 75.408 | 0.106 | 0.004 | |||||||
| pg160_o2nofp.cx10a_c8r32 | 19.472 | 80.422 | 0.106 | 0.009 | |||||||
| pg169_o2nofp.cx10a_c8r32 | 24.028 | 67.647 | 8.325 | 0.007 | |||||||
| pg170_o2nofp.cx10a_c8r32 | 18.781 | 80.594 | 0.625 | 0.005 | |||||||
| pg175_o2nofp.cx10a_c8r32 | 19.372 | 80.078 | 0.550 | 0.005 | |||||||
| pg18beta1_o2nofp.cx10b_c8r32 | 16.508 | 83.033 | 0.458 | 0.011 | |||||||
| pg18beta1_o2nofp.cx10c_c8r32 | 18.342 | 81.094 | 0.564 | 0.005 | |||||||
| pg18beta1_o2nofp.cx10d_c8r32 | 17.772 | 81.839 | 0.389 | 0.005 |
Performance metrics for the DBMS listed above. Some are normalized by throughput, others are not. Legend for results is here.
ips	qps	rps	rmbps	wps	wmbps	rpq	rkbpq	wpi	wkbpi	csps	cpups	cspq	cpupq	dbgb1	dbgb2	rss	maxop	p50	p99	tag
1000	14490	0	0.0	32.8	2.7	0.000	0.000	0.033	2.772	55750	13.4	3.848	74	5.5	32.4	0.3	0.002	14462	13886	pg140_o2nofp.cx10a_c8r32
999	14309	0	0.0	32.8	2.7	0.000	0.000	0.033	2.767	55096	13.3	3.850	74	5.5	32.4	0.3	0.002	14334	13709	pg1418_o2nofp.cx10a_c8r32
999	14746	0	0.0	30.5	2.7	0.000	0.000	0.031	2.734	56717	13.3	3.846	72	5.5	32.4	0.3	0.002	14686	14094	pg150_o2nofp.cx10a_c8r32
1000	14408	0	0.0	30.6	2.7	0.000	0.000	0.031	2.739	55392	13.3	3.845	74	5.5	32.4	0.3	0.002	14414	13789	pg1513_o2nofp.cx10a_c8r32
999	14584	0	0.0	30.8	2.7	0.000	0.000	0.031	2.760	56100	13.4	3.847	74	5.5	32.4	2.8	0.002	14558	13934	pg160_o2nofp.cx10a_c8r32
999	14642	0	0.0	30.6	2.7	0.000	0.000	0.031	2.744	56323	13.4	3.847	73	5.5	32.4	3.1	0.003	14605	14013	pg169_o2nofp.cx10a_c8r32
999	14556	0	0.0	30.1	2.7	0.000	0.000	0.030	2.740	55912	13.3	3.841	73	5.5	32.4	0.3	0.004	14558	13870	pg170_o2nofp.cx10a_c8r32
1000	14499	0	0.0	30.0	2.7	0.000	0.000	0.030	2.735	55663	13.4	3.839	74	5.5	32.4	0.3	0.002	14526	13789	pg175_o2nofp.cx10a_c8r32
1000	14191	0	0.0	33.8	2.7	0.000	0.000	0.034	2.714	54511	13.3	3.841	75	5.5	32.4	0.3	0.006	14190	13470	pg18beta1_o2nofp.cx10b_c8r32
999	14277	0	0.0	33.3	2.6	0.000	0.000	0.033	2.701	54848	13.3	3.842	75	5.5	32.4	0.3	0.003	14301	13566	pg18beta1_o2nofp.cx10c_c8r32
999	14369	0	0.0	33.4	2.6	0.000	0.000	0.033	2.708	55201	13.4	3.842	75	5.5	32.4	0.3	0.004	14382	13614	pg18beta1_o2nofp.cx10d_c8r32
qp1000.L6
qp1000.L6: point queries with 1000 insert/s per client. Graphs for performance per 1-second interval are here.
Average throughput:
Query response time histogram: each cell has the percentage of responses that take <= the time in the header and max is the max response time in seconds. For max values in the top 25% of the range have a red background and in the bottom 25% of the range have a green background. The red background is not used when the min value is within 80% of the max value.
| dbms | 256us | 1ms | 4ms | 16ms | 64ms | 256ms | 1s | 4s | 16s | gt | max |
|---|---|---|---|---|---|---|---|---|---|---|---|
| pg140_o2nofp.cx10a_c8r32 | 98.799 | 1.201 | nonzero | 0.003 | |||||||
| pg1418_o2nofp.cx10a_c8r32 | 98.400 | 1.600 | nonzero | 0.002 | |||||||
| pg150_o2nofp.cx10a_c8r32 | 98.365 | 1.635 | nonzero | nonzero | 0.040 | ||||||
| pg1513_o2nofp.cx10a_c8r32 | 98.286 | 1.714 | nonzero | 0.002 | |||||||
| pg160_o2nofp.cx10a_c8r32 | 98.277 | 1.723 | nonzero | 0.002 | |||||||
| pg169_o2nofp.cx10a_c8r32 | 98.186 | 1.814 | nonzero | nonzero | 0.033 | ||||||
| pg170_o2nofp.cx10a_c8r32 | 98.034 | 1.966 | nonzero | 0.002 | |||||||
| pg175_o2nofp.cx10a_c8r32 | 97.914 | 2.086 | nonzero | 0.001 | |||||||
| pg18beta1_o2nofp.cx10b_c8r32 | 98.214 | 1.786 | nonzero | 0.002 | |||||||
| pg18beta1_o2nofp.cx10c_c8r32 | 98.057 | 1.943 | nonzero | 0.002 | |||||||
| pg18beta1_o2nofp.cx10d_c8r32 | 98.041 | 1.959 | nonzero | 0.002 |
Insert response time histogram: each cell has the percentage of responses that take <= the time in the header and max is the max response time in seconds. For max values in the top 25% of the range have a red background and in the bottom 25% of the range have a green background. The red background is not used when the min value is within 80% of the max value.
| dbms | 256us | 1ms | 4ms | 16ms | 64ms | 256ms | 1s | 4s | 16s | gt | max |
|---|---|---|---|---|---|---|---|---|---|---|---|
| pg140_o2nofp.cx10a_c8r32 | 39.736 | 60.250 | 0.011 | 0.003 | 0.025 | ||||||
| pg1418_o2nofp.cx10a_c8r32 | 31.050 | 68.939 | 0.006 | 0.006 | 0.020 | ||||||
| pg150_o2nofp.cx10a_c8r32 | 41.806 | 58.183 | 0.006 | 0.006 | 0.022 | ||||||
| pg1513_o2nofp.cx10a_c8r32 | 43.086 | 56.900 | 0.011 | 0.003 | 0.021 | ||||||
| pg160_o2nofp.cx10a_c8r32 | 38.419 | 61.569 | 0.003 | 0.008 | 0.027 | ||||||
| pg169_o2nofp.cx10a_c8r32 | 45.089 | 54.900 | 0.006 | 0.006 | 0.025 | ||||||
| pg170_o2nofp.cx10a_c8r32 | 43.850 | 56.139 | 0.011 | 0.015 | |||||||
| pg175_o2nofp.cx10a_c8r32 | 40.986 | 59.003 | 0.006 | 0.006 | 0.026 | ||||||
| pg18beta1_o2nofp.cx10b_c8r32 | 36.233 | 63.756 | 0.011 | 0.009 | |||||||
| pg18beta1_o2nofp.cx10c_c8r32 | 38.386 | 61.606 | 0.008 | 0.008 | |||||||
| pg18beta1_o2nofp.cx10d_c8r32 | 33.478 | 66.508 | 0.014 | 0.009 |
Delete response time histogram: each cell has the percentage of responses that take <= the time in the header and max is the max response time in seconds. For max values in the top 25% of the range have a red background and in the bottom 25% of the range have a green background. The red background is not used when the min value is within 80% of the max value.
| dbms | 256us | 1ms | 4ms | 16ms | 64ms | 256ms | 1s | 4s | 16s | gt | max |
|---|---|---|---|---|---|---|---|---|---|---|---|
| pg140_o2nofp.cx10a_c8r32 | 30.133 | 69.642 | 0.222 | 0.003 | 0.022 | ||||||
| pg1418_o2nofp.cx10a_c8r32 | 28.850 | 70.978 | 0.167 | 0.006 | 0.018 | ||||||
| pg150_o2nofp.cx10a_c8r32 | 28.406 | 71.400 | 0.189 | 0.006 | 0.020 | ||||||
| pg1513_o2nofp.cx10a_c8r32 | 31.047 | 68.767 | 0.183 | 0.003 | 0.020 | ||||||
| pg160_o2nofp.cx10a_c8r32 | 31.175 | 68.542 | 0.275 | 0.008 | 0.025 | ||||||
| pg169_o2nofp.cx10a_c8r32 | 34.597 | 54.603 | 10.794 | 0.006 | 0.023 | ||||||
| pg170_o2nofp.cx10a_c8r32 | 25.944 | 73.456 | 0.600 | 0.013 | |||||||
| pg175_o2nofp.cx10a_c8r32 | 28.578 | 70.817 | 0.600 | 0.006 | 0.023 | ||||||
| pg18beta1_o2nofp.cx10b_c8r32 | 18.167 | 81.297 | 0.536 | 0.005 | |||||||
| pg18beta1_o2nofp.cx10c_c8r32 | 16.631 | 82.753 | 0.617 | 0.005 | |||||||
| pg18beta1_o2nofp.cx10d_c8r32 | 19.450 | 80.044 | 0.506 | 0.005 |
Performance metrics for the DBMS listed above. Some are normalized by throughput, others are not. Legend for results is here.
ips	qps	rps	rmbps	wps	wmbps	rpq	rkbpq	wpi	wkbpi	csps	cpups	cspq	cpupq	dbgb1	dbgb2	rss	maxop	p50	p99	tag
1000	6266	0	0.0	33.4	2.7	0.000	0.000	0.033	2.780	26256	13.5	4.190	172	5.5	30.3	0.2	0.003	6287	6015	pg140_o2nofp.cx10a_c8r32
999	6130	0	0.0	33.1	2.7	0.000	0.000	0.033	2.776	25726	13.5	4.197	176	5.5	30.2	0.2	0.002	6143	5951	pg1418_o2nofp.cx10a_c8r32
999	6200	0	0.0	31.2	2.7	0.000	0.000	0.031	2.745	25719	13.5	4.148	174	5.5	30.2	3.5	0.040	6223	5951	pg150_o2nofp.cx10a_c8r32
999	6156	0	0.0	31.2	2.7	0.000	0.000	0.031	2.740	25550	13.5	4.150	175	5.5	30.3	0.2	0.002	6175	5934	pg1513_o2nofp.cx10a_c8r32
999	6150	0	0.0	31.3	2.7	0.000	0.000	0.031	2.766	25519	13.6	4.150	177	5.5	30.3	2.1	0.002	6175	5935	pg160_o2nofp.cx10a_c8r32
999	6164	0	0.0	31.2	2.7	0.000	0.000	0.031	2.764	25580	13.6	4.150	176	5.5	30.3	2.1	0.033	6191	5919	pg169_o2nofp.cx10a_c8r32
999	6072	0	0.0	29.8	2.7	0.000	0.000	0.030	2.756	25149	13.6	4.142	179	5.5	30.3	0.4	0.002	6095	5903	pg170_o2nofp.cx10a_c8r32
999	6082	0	0.0	29.8	2.7	0.000	0.000	0.030	2.744	25188	13.6	4.142	179	5.5	30.3	0.4	0.001	6111	5903	pg175_o2nofp.cx10a_c8r32
1000	6003	0	0.0	28.1	2.7	0.000	0.000	0.028	2.736	24862	13.6	4.141	181	5.5	30.2	0.3	0.002	5983	5887	pg18beta1_o2nofp.cx10b_c8r32
999	5985	0	0.0	28.1	2.7	0.000	0.000	0.028	2.731	24810	13.6	4.145	182	5.5	30.2	0.3	0.002	5967	5887	pg18beta1_o2nofp.cx10c_c8r32
999	5731	0	0.0	28.2	2.7	0.000	0.000	0.028	2.724	23830	14.1	4.158	197	5.5	30.2	0.3	0.002	5727	5503	pg18beta1_o2nofp.cx10d_c8r32
l.i0
l.i0: load without secondary indexes
Performance metrics for all DBMS, not just the ones listed above. Some are normalized by throughput, others are not. Legend for results is here.
ips	qps	rps	rmbps	wps	wmbps	rpq	rkbpq	wpi	wkbpi	csps	cpups	cspq	cpupq	dbgb1	dbgb2	rss	maxop	p50	p99	tag
139860	0	0	0.0	523.5	59.2	0.000	0.000	0.004	0.433	16764	19.7	0.120	11	1.9	5.2	0.8	0.003	140183	135583	pg140_o2nofp.cx10a_c8r32
136986	0	0	0.0	513.2	57.9	0.000	0.000	0.004	0.433	16480	19.5	0.120	11	1.9	5.2	2.0	0.005	137483	130883	pg1418_o2nofp.cx10a_c8r32
142857	0	0	0.0	533.4	60.5	0.000	0.000	0.004	0.434	17013	19.5	0.119	11	1.9	5.2	0.4	0.003	143384	137987	pg150_o2nofp.cx10a_c8r32
143885	0	0	0.0	541.1	61.4	0.000	0.000	0.004	0.437	17060	19.9	0.119	11	1.9	5.2	1.7	0.002	143683	136285	pg1513_o2nofp.cx10a_c8r32
142857	0	0	0.0	532.9	60.4	0.000	0.000	0.004	0.433	16959	19.8	0.119	11	1.9	5.2	1.7	0.002	142884	138284	pg160_o2nofp.cx10a_c8r32
141844	0	0	0.0	532.9	60.5	0.000	0.000	0.004	0.437	16918	19.7	0.119	11	1.9	5.2	0.4	0.002	143472	137884	pg169_o2nofp.cx10a_c8r32
140845	0	0	0.0	529.9	60.1	0.000	0.000	0.004	0.437	14473	19.6	0.103	11	1.9	5.2	1.6	0.002	142079	135682	pg170_o2nofp.cx10a_c8r32
138889	0	0	0.0	524.3	59.4	0.000	0.000	0.004	0.438	14300	19.8	0.103	11	1.9	5.2	1.6	0.003	140680	132885	pg175_o2nofp.cx10a_c8r32
140845	0	0	0.0	526.6	59.7	0.000	0.000	0.004	0.434	14333	19.8	0.102	11	1.9	5.2	1.2	0.002	141075	133683	pg18beta1_o2nofp.cx10b_c8r32
141844	0	0	0.0	529.4	60.0	0.000	0.000	0.004	0.433	14363	19.9	0.101	11	1.9	5.2	1.6	0.002	141782	134184	pg18beta1_o2nofp.cx10c_c8r32
139860	0	0	0.0	524.6	59.5	0.000	0.000	0.004	0.435	14210	19.8	0.102	11	1.9	5.2	1.6	0.002	140983	133285	pg18beta1_o2nofp.cx10d_c8r32
l.x
l.x: create secondary indexes
Performance metrics for all DBMS, not just the ones listed above. Some are normalized by throughput, others are not. Legend for results is here.
ips	qps	rps	rmbps	wps	wmbps	rpq	rkbpq	wpi	wkbpi	csps	cpups	cspq	cpupq	dbgb1	dbgb2	rss	maxop	p50	p99	tag
322582	0	0	0.0	644.2	78.8	0.000	0.000	0.002	0.250	1934	11.4	0.006	3	3.9	8.9	2.1	0.002	NA	NA	pg140_o2nofp.cx10a_c8r32
333335	0	0	0.0	756.9	92.7	0.000	0.000	0.002	0.285	2049	11.3	0.006	3	3.9	8.9	2.1	0.002	NA	NA	pg1418_o2nofp.cx10a_c8r32
350879	0	0	0.0	704.2	86.3	0.000	0.000	0.002	0.252	2046	11.3	0.006	3	3.9	8.9	2.1	0.002	NA	NA	pg150_o2nofp.cx10a_c8r32
363638	0	1	0.0	846.2	104.0	0.000	0.000	0.002	0.293	1584	11.5	0.004	3	3.9	8.9	2.1	0.002	NA	NA	pg1513_o2nofp.cx10a_c8r32
370372	0	1	0.0	848.2	104.3	0.000	0.000	0.002	0.288	1662	11.5	0.004	2	3.9	8.9	2.1	0.002	NA	NA	pg160_o2nofp.cx10a_c8r32
357145	0	0	0.0	720.9	88.4	0.000	0.000	0.002	0.253	2163	11.4	0.006	3	3.9	8.9	2.1	0.002	NA	NA	pg169_o2nofp.cx10a_c8r32
370372	0	0	0.0	543.8	66.6	0.000	0.000	0.001	0.184	1707	11.5	0.005	2	3.9	8.9	2.1	0.002	NA	NA	pg170_o2nofp.cx10a_c8r32
384617	0	0	0.0	616.1	75.4	0.000	0.000	0.002	0.201	1997	11.7	0.005	2	3.9	8.9	2.1	0.002	NA	NA	pg175_o2nofp.cx10a_c8r32
384617	0	0	0.0	619.5	75.9	0.000	0.000	0.002	0.202	1954	11.7	0.005	2	3.9	8.9	2.1	0.002	NA	NA	pg18beta1_o2nofp.cx10b_c8r32
377360	0	0	0.0	605.8	74.1	0.000	0.000	0.002	0.201	1933	11.5	0.005	2	3.9	8.9	2.1	0.002	NA	NA	pg18beta1_o2nofp.cx10c_c8r32
377360	0	0	0.0	602.5	73.7	0.000	0.000	0.002	0.200	1928	11.5	0.005	2	3.9	8.9	2.1	0.002	NA	NA	pg18beta1_o2nofp.cx10d_c8r32
l.i1
l.i1: continue load after secondary indexes created with 50 inserts per transaction
Performance metrics for all DBMS, not just the ones listed above. Some are normalized by throughput, others are not. Legend for results is here.
ips	qps	rps	rmbps	wps	wmbps	rpq	rkbpq	wpi	wkbpi	csps	cpups	cspq	cpupq	dbgb1	dbgb2	rss	maxop	p50	p99	tag
26828	0	0	0.0	299.5	32.2	0.000	0.000	0.011	1.228	12891	22.9	0.481	68	5.3	32.1	5.2	0.057	21098	14447	pg140_o2nofp.cx10a_c8r32
25332	0	0	0.0	281.4	30.2	0.000	0.000	0.011	1.221	12266	22.4	0.484	71	5.4	32.0	2.5	0.049	19798	9998	pg1418_o2nofp.cx10a_c8r32
26472	0	0	0.0	292.8	31.6	0.000	0.000	0.011	1.224	13313	22.8	0.503	69	5.4	32.1	2.5	0.043	20946	14248	pg150_o2nofp.cx10a_c8r32
26900	0	0	0.0	297.6	32.2	0.000	0.000	0.011	1.225	13542	22.8	0.503	68	5.4	32.1	4.3	0.021	21196	14198	pg1513_o2nofp.cx10a_c8r32
24600	0	0	0.0	272.3	29.4	0.000	0.000	0.011	1.225	12397	22.2	0.504	72	5.4	32.1	3.6	0.026	18747	9948	pg160_o2nofp.cx10a_c8r32
26127	0	0	0.0	289.2	31.3	0.000	0.000	0.011	1.226	13086	22.8	0.501	70	5.4	32.1	5.4	0.035	20347	14198	pg169_o2nofp.cx10a_c8r32
24969	0	0	0.0	278.1	30.6	0.000	0.000	0.011	1.255	10337	21.9	0.414	70	5.3	32.1	4.0	0.033	21598	8699	pg170_o2nofp.cx10a_c8r32
25413	0	0	0.0	282.8	31.1	0.000	0.000	0.011	1.254	10500	22.1	0.413	70	5.3	32.0	5.3	0.030	22546	8448	pg175_o2nofp.cx10a_c8r32
22688	0	0	0.0	253.2	28.0	0.000	0.000	0.011	1.266	9423	21.4	0.415	75	5.4	32.0	4.2	0.059	15748	8849	pg18beta1_o2nofp.cx10b_c8r32
24184	0	0	0.0	272.0	30.1	0.000	0.000	0.011	1.273	10125	21.9	0.419	72	5.4	32.0	1.5	0.050	18447	9648	pg18beta1_o2nofp.cx10c_c8r32
22792	0	0	0.0	255.7	28.3	0.000	0.000	0.011	1.272	9502	21.5	0.417	75	5.4	32.1	4.8	0.028	15848	9098	pg18beta1_o2nofp.cx10d_c8r32
l.i2
l.i2: continue load after secondary indexes created with 5 inserts per transaction
Performance metrics for all DBMS, not just the ones listed above. Some are normalized by throughput, others are not. Legend for results is here.
ips	qps	rps	rmbps	wps	wmbps	rpq	rkbpq	wpi	wkbpi	csps	cpups	cspq	cpupq	dbgb1	dbgb2	rss	maxop	p50	p99	tag
3516	0	0	0.0	62.2	6.0	0.000	0.000	0.018	1.744	16260	16.3	4.624	371	5.4	35.0	1.0	0.004	2665	1825	pg140_o2nofp.cx10a_c8r32
3322	0	0	0.0	60.3	5.8	0.000	0.000	0.018	1.776	15365	16.3	4.625	393	5.4	34.9	0.2	0.031	2315	1140	pg1418_o2nofp.cx10a_c8r32
3515	0	0	0.0	60.1	6.0	0.000	0.000	0.017	1.742	16171	16.2	4.601	369	5.4	35.0	0.6	0.007	2670	1910	pg150_o2nofp.cx10a_c8r32
3598	0	0	0.0	61.4	6.1	0.000	0.000	0.017	1.737	16635	16.3	4.623	362	5.4	35.0	0.2	0.050	2810	1785	pg1513_o2nofp.cx10a_c8r32
3287	0	0	0.0	57.4	5.7	0.000	0.000	0.017	1.765	15175	16.2	4.616	394	5.4	34.9	1.5	0.025	2315	1245	pg160_o2nofp.cx10a_c8r32
3511	0	0	0.0	60.6	6.0	0.000	0.000	0.017	1.753	16164	16.2	4.604	369	5.4	35.1	0.2	0.005	2685	1755	pg169_o2nofp.cx10a_c8r32
3168	0	0	0.0	55.0	5.4	0.000	0.000	0.017	1.733	12248	15.8	3.867	399	5.4	34.5	0.3	0.010	2225	875	pg170_o2nofp.cx10a_c8r32
3229	0	0	0.0	55.3	5.5	0.000	0.000	0.017	1.745	12479	15.9	3.865	394	5.4	34.7	5.1	0.036	2375	1020	pg175_o2nofp.cx10a_c8r32
3089	0	0	0.0	53.5	5.2	0.000	0.000	0.017	1.724	11917	15.9	3.858	412	5.4	34.3	0.3	0.032	2110	1100	pg18beta1_o2nofp.cx10b_c8r32
3109	0	0	0.0	54.2	5.3	0.000	0.000	0.017	1.749	12031	15.9	3.869	409	5.4	34.5	1.5	0.008	2180	1080	pg18beta1_o2nofp.cx10c_c8r32
3233	0	0	0.0	55.2	5.4	0.000	0.000	0.017	1.725	12494	16.0	3.865	396	5.4	34.4	0.8	0.032	2275	1200	pg18beta1_o2nofp.cx10d_c8r32
qr100.L1
qr100.L1: range queries with 100 insert/s per client
Performance metrics for all DBMS, not just the ones listed above. Some are normalized by throughput, others are not. Legend for results is here.
ips	qps	rps	rmbps	wps	wmbps	rpq	rkbpq	wpi	wkbpi	csps	cpups	cspq	cpupq	dbgb1	dbgb2	rss	maxop	p50	p99	tag
100	15036	0	0.0	13.4	0.6	0.000	0.000	0.134	6.453	57441	12.4	3.820	66	5.4	35.0	0.1	0.009	15038	14733	pg140_o2nofp.cx10a_c8r32
100	15080	0	0.0	13.4	0.6	0.000	0.000	0.134	6.450	57637	12.4	3.822	66	5.4	34.9	0.1	0.009	15086	14750	pg1418_o2nofp.cx10a_c8r32
100	15335	0	0.0	11.3	0.6	0.000	0.000	0.113	6.237	58551	12.4	3.818	65	5.4	35.0	0.1	0.001	15325	15070	pg150_o2nofp.cx10a_c8r32
100	15133	0	0.0	11.3	0.6	0.000	0.000	0.113	6.254	57782	12.4	3.818	66	5.4	35.0	0.1	0.001	15134	14878	pg1513_o2nofp.cx10a_c8r32
100	15236	0	0.0	11.3	0.6	0.000	0.000	0.113	6.242	58171	12.4	3.818	65	5.4	34.9	0.1	0.001	15245	15022	pg160_o2nofp.cx10a_c8r32
100	15289	0	0.0	11.3	0.6	0.000	0.000	0.113	6.245	58376	12.4	3.818	65	5.4	35.1	0.1	0.001	15294	14990	pg169_o2nofp.cx10a_c8r32
100	15258	0	0.0	10.5	0.6	0.000	0.000	0.105	6.297	58280	12.4	3.820	65	5.4	34.5	0.1	0.001	15246	15022	pg170_o2nofp.cx10a_c8r32
100	15276	0	0.0	10.5	0.6	0.000	0.000	0.105	6.258	58351	12.4	3.820	65	5.4	34.7	0.1	0.001	15262	15038	pg175_o2nofp.cx10a_c8r32
100	14983	0	0.0	10.6	0.6	0.000	0.000	0.106	6.294	57198	12.4	3.818	66	5.4	34.4	0.1	0.001	15005	14526	pg18beta1_o2nofp.cx10b_c8r32
100	14966	0	0.0	10.5	0.6	0.000	0.000	0.105	6.290	57134	12.4	3.818	66	5.4	34.5	0.2	0.001	15005	14558	pg18beta1_o2nofp.cx10c_c8r32
100	14865	0	0.0	10.5	0.6	0.000	0.000	0.105	6.295	56782	12.4	3.820	67	5.4	34.4	0.1	0.001	14894	14429	pg18beta1_o2nofp.cx10d_c8r32
qp100.L2
qp100.L2: point queries with 100 insert/s per client
Performance metrics for all DBMS, not just the ones listed above. Some are normalized by throughput, others are not. Legend for results is here.
ips	qps	rps	rmbps	wps	wmbps	rpq	rkbpq	wpi	wkbpi	csps	cpups	cspq	cpupq	dbgb1	dbgb2	rss	maxop	p50	p99	tag
100	6166	0	0.0	42.8	1.4	0.000	0.000	0.428	14.374	25526	13.3	4.139	173	5.4	35.0	0.1	0.002	6175	5983	pg140_o2nofp.cx10a_c8r32
100	6168	0	0.0	42.8	1.4	0.000	0.000	0.428	14.325	25517	13.2	4.137	171	5.4	34.9	0.2	0.001	6191	5967	pg1418_o2nofp.cx10a_c8r32
100	6193	0	0.0	40.7	1.4	0.000	0.000	0.407	14.107	25332	13.0	4.091	168	5.4	35.0	0.1	0.001	6223	5951	pg150_o2nofp.cx10a_c8r32
100	6192	0	0.0	40.5	1.4	0.000	0.000	0.405	14.109	25328	12.9	4.091	167	5.4	35.0	0.1	0.001	6222	5951	pg1513_o2nofp.cx10a_c8r32
100	6148	0	0.0	40.6	1.4	0.000	0.000	0.406	14.111	25153	12.9	4.091	168	5.4	34.9	0.2	0.001	6175	5935	pg160_o2nofp.cx10a_c8r32
100	6219	0	0.0	40.6	1.4	0.000	0.000	0.406	14.115	25437	13.0	4.090	167	5.4	35.1	0.2	0.001	6271	5935	pg169_o2nofp.cx10a_c8r32
100	6170	0	0.0	39.3	1.4	0.000	0.000	0.393	14.093	25232	13.1	4.090	170	5.4	34.5	0.1	0.001	6206	5935	pg170_o2nofp.cx10a_c8r32
100	6135	0	0.0	39.4	1.4	0.000	0.000	0.394	14.108	25094	12.9	4.090	168	5.4	34.7	0.5	0.001	6175	5919	pg175_o2nofp.cx10a_c8r32
100	6020	0	0.0	39.4	1.4	0.000	0.000	0.394	14.116	24653	12.8	4.095	170	5.4	34.4	0.1	0.001	6015	5903	pg18beta1_o2nofp.cx10b_c8r32
100	5994	0	0.0	39.3	1.4	0.000	0.000	0.393	14.146	24540	12.7	4.094	169	5.4	34.5	0.1	0.002	5967	5903	pg18beta1_o2nofp.cx10c_c8r32
100	5734	0	0.0	39.5	1.4	0.000	0.000	0.396	14.137	23547	13.4	4.107	187	5.4	34.4	0.1	0.001	5711	5519	pg18beta1_o2nofp.cx10d_c8r32
qr500.L3
qr500.L3: range queries with 500 insert/s per client
Performance metrics for all DBMS, not just the ones listed above. Some are normalized by throughput, others are not. Legend for results is here.
ips	qps	rps	rmbps	wps	wmbps	rpq	rkbpq	wpi	wkbpi	csps	cpups	cspq	cpupq	dbgb1	dbgb2	rss	maxop	p50	p99	tag
500	14633	0	0.0	52.1	1.8	0.000	0.000	0.104	3.728	56101	13.1	3.834	72	5.4	35.0	0.3	0.002	14558	14013	pg140_o2nofp.cx10a_c8r32
500	14394	0	0.0	52.4	1.8	0.000	0.000	0.105	3.768	55164	13.0	3.832	72	5.4	34.9	0.3	0.002	14350	13790	pg1418_o2nofp.cx10a_c8r32
500	14677	0	0.0	50.0	1.8	0.000	0.000	0.100	3.675	56221	13.0	3.831	71	5.4	35.0	5.3	0.002	14621	14030	pg150_o2nofp.cx10a_c8r32
500	14453	0	0.0	50.0	1.8	0.000	0.000	0.100	3.675	55335	13.0	3.829	72	5.4	35.0	0.3	0.002	14414	13854	pg1513_o2nofp.cx10a_c8r32
500	14699	0	0.0	50.2	1.8	0.000	0.000	0.100	3.675	56278	13.0	3.829	71	5.4	34.9	2.8	0.003	14621	14030	pg160_o2nofp.cx10a_c8r32
500	14718	0	0.0	50.2	1.8	0.000	0.000	0.101	3.719	56384	13.1	3.831	71	5.4	35.2	5.5	0.006	14637	14094	pg169_o2nofp.cx10a_c8r32
500	14563	0	0.0	49.5	1.8	0.000	0.000	0.099	3.706	55731	12.9	3.827	71	5.4	34.5	0.3	0.002	14509	13854	pg170_o2nofp.cx10a_c8r32
500	14429	0	0.0	49.5	1.8	0.000	0.000	0.099	3.678	55214	13.0	3.827	72	5.4	34.7	0.3	0.002	14382	13709	pg175_o2nofp.cx10a_c8r32
500	14276	0	0.0	49.5	1.8	0.000	0.000	0.099	3.689	54668	12.9	3.829	72	5.4	34.4	0.3	0.002	14254	13550	pg18beta1_o2nofp.cx10b_c8r32
500	14236	0	0.0	49.6	1.8	0.000	0.000	0.099	3.745	54486	13.0	3.827	73	5.4	34.5	0.3	0.031	14238	13550	pg18beta1_o2nofp.cx10c_c8r32
500	14316	0	0.0	49.6	1.8	0.000	0.000	0.099	3.695	54788	12.9	3.827	72	5.4	34.4	4.7	0.003	14318	13629	pg18beta1_o2nofp.cx10d_c8r32
qp500.L4
qp500.L4: point queries with 500 insert/s per client
Performance metrics for all DBMS, not just the ones listed above. Some are normalized by throughput, others are not. Legend for results is here.
ips	qps	rps	rmbps	wps	wmbps	rpq	rkbpq	wpi	wkbpi	csps	cpups	cspq	cpupq	dbgb1	dbgb2	rss	maxop	p50	p99	tag
500	6278	0	0.0	30.8	2.3	0.000	0.000	0.062	4.638	26101	13.4	4.158	171	5.4	34.0	0.3	0.002	6303	6031	pg140_o2nofp.cx10a_c8r32
500	6150	0	0.0	30.9	2.3	0.000	0.000	0.062	4.643	25593	13.4	4.162	174	5.5	34.0	0.3	0.003	6159	5951	pg1418_o2nofp.cx10a_c8r32
500	6226	0	0.0	29.1	2.3	0.000	0.000	0.058	4.668	25609	13.4	4.113	172	5.5	34.0	0.3	0.002	6271	5967	pg150_o2nofp.cx10a_c8r32
500	6188	0	0.0	29.0	2.3	0.000	0.000	0.058	4.658	25444	13.4	4.112	173	5.5	34.0	0.3	0.002	6207	5951	pg1513_o2nofp.cx10a_c8r32
500	6152	0	0.0	28.8	2.2	0.000	0.000	0.058	4.602	25313	13.4	4.115	174	5.5	34.0	2.9	0.002	6175	5935	pg160_o2nofp.cx10a_c8r32
500	6143	0	0.0	28.9	2.3	0.000	0.000	0.058	4.629	25276	13.5	4.115	176	5.5	34.1	2.9	0.002	6191	5919	pg169_o2nofp.cx10a_c8r32
500	6106	0	0.0	27.7	2.3	0.000	0.000	0.055	4.648	25096	13.4	4.110	176	5.5	34.1	0.3	0.002	6127	5919	pg170_o2nofp.cx10a_c8r32
500	6089	0	0.0	27.8	2.3	0.000	0.000	0.056	4.666	25024	13.5	4.110	177	5.5	34.1	0.3	0.002	6111	5919	pg175_o2nofp.cx10a_c8r32
500	6013	0	0.0	28.1	2.2	0.000	0.000	0.056	4.568	24729	13.5	4.113	180	5.4	34.0	0.2	0.002	5999	5903	pg18beta1_o2nofp.cx10b_c8r32
500	6011	0	0.0	28.2	2.2	0.000	0.000	0.056	4.570	24726	13.5	4.113	180	5.4	34.0	0.3	0.001	5999	5903	pg18beta1_o2nofp.cx10c_c8r32
500	5710	0	0.0	28.3	2.3	0.000	0.000	0.057	4.636	23555	13.5	4.126	189	5.5	34.1	0.3	0.002	5663	5519	pg18beta1_o2nofp.cx10d_c8r32
qr1000.L5
qr1000.L5: range queries with 1000 insert/s per client
Performance metrics for all DBMS, not just the ones listed above. Some are normalized by throughput, others are not. Legend for results is here.
ips	qps	rps	rmbps	wps	wmbps	rpq	rkbpq	wpi	wkbpi	csps	cpups	cspq	cpupq	dbgb1	dbgb2	rss	maxop	p50	p99	tag
1000	14490	0	0.0	32.8	2.7	0.000	0.000	0.033	2.772	55750	13.4	3.848	74	5.5	32.4	0.3	0.002	14462	13886	pg140_o2nofp.cx10a_c8r32
999	14309	0	0.0	32.8	2.7	0.000	0.000	0.033	2.767	55096	13.3	3.850	74	5.5	32.4	0.3	0.002	14334	13709	pg1418_o2nofp.cx10a_c8r32
999	14746	0	0.0	30.5	2.7	0.000	0.000	0.031	2.734	56717	13.3	3.846	72	5.5	32.4	0.3	0.002	14686	14094	pg150_o2nofp.cx10a_c8r32
1000	14408	0	0.0	30.6	2.7	0.000	0.000	0.031	2.739	55392	13.3	3.845	74	5.5	32.4	0.3	0.002	14414	13789	pg1513_o2nofp.cx10a_c8r32
999	14584	0	0.0	30.8	2.7	0.000	0.000	0.031	2.760	56100	13.4	3.847	74	5.5	32.4	2.8	0.002	14558	13934	pg160_o2nofp.cx10a_c8r32
999	14642	0	0.0	30.6	2.7	0.000	0.000	0.031	2.744	56323	13.4	3.847	73	5.5	32.4	3.1	0.003	14605	14013	pg169_o2nofp.cx10a_c8r32
999	14556	0	0.0	30.1	2.7	0.000	0.000	0.030	2.740	55912	13.3	3.841	73	5.5	32.4	0.3	0.004	14558	13870	pg170_o2nofp.cx10a_c8r32
1000	14499	0	0.0	30.0	2.7	0.000	0.000	0.030	2.735	55663	13.4	3.839	74	5.5	32.4	0.3	0.002	14526	13789	pg175_o2nofp.cx10a_c8r32
1000	14191	0	0.0	33.8	2.7	0.000	0.000	0.034	2.714	54511	13.3	3.841	75	5.5	32.4	0.3	0.006	14190	13470	pg18beta1_o2nofp.cx10b_c8r32
999	14277	0	0.0	33.3	2.6	0.000	0.000	0.033	2.701	54848	13.3	3.842	75	5.5	32.4	0.3	0.003	14301	13566	pg18beta1_o2nofp.cx10c_c8r32
999	14369	0	0.0	33.4	2.6	0.000	0.000	0.033	2.708	55201	13.4	3.842	75	5.5	32.4	0.3	0.004	14382	13614	pg18beta1_o2nofp.cx10d_c8r32
qp1000.L6
qp1000.L6: point queries with 1000 insert/s per client
Performance metrics for all DBMS, not just the ones listed above. Some are normalized by throughput, others are not. Legend for results is here.
ips	qps	rps	rmbps	wps	wmbps	rpq	rkbpq	wpi	wkbpi	csps	cpups	cspq	cpupq	dbgb1	dbgb2	rss	maxop	p50	p99	tag
1000	6266	0	0.0	33.4	2.7	0.000	0.000	0.033	2.780	26256	13.5	4.190	172	5.5	30.3	0.2	0.003	6287	6015	pg140_o2nofp.cx10a_c8r32
999	6130	0	0.0	33.1	2.7	0.000	0.000	0.033	2.776	25726	13.5	4.197	176	5.5	30.2	0.2	0.002	6143	5951	pg1418_o2nofp.cx10a_c8r32
999	6200	0	0.0	31.2	2.7	0.000	0.000	0.031	2.745	25719	13.5	4.148	174	5.5	30.2	3.5	0.040	6223	5951	pg150_o2nofp.cx10a_c8r32
999	6156	0	0.0	31.2	2.7	0.000	0.000	0.031	2.740	25550	13.5	4.150	175	5.5	30.3	0.2	0.002	6175	5934	pg1513_o2nofp.cx10a_c8r32
999	6150	0	0.0	31.3	2.7	0.000	0.000	0.031	2.766	25519	13.6	4.150	177	5.5	30.3	2.1	0.002	6175	5935	pg160_o2nofp.cx10a_c8r32
999	6164	0	0.0	31.2	2.7	0.000	0.000	0.031	2.764	25580	13.6	4.150	176	5.5	30.3	2.1	0.033	6191	5919	pg169_o2nofp.cx10a_c8r32
999	6072	0	0.0	29.8	2.7	0.000	0.000	0.030	2.756	25149	13.6	4.142	179	5.5	30.3	0.4	0.002	6095	5903	pg170_o2nofp.cx10a_c8r32
999	6082	0	0.0	29.8	2.7	0.000	0.000	0.030	2.744	25188	13.6	4.142	179	5.5	30.3	0.4	0.001	6111	5903	pg175_o2nofp.cx10a_c8r32
1000	6003	0	0.0	28.1	2.7	0.000	0.000	0.028	2.736	24862	13.6	4.141	181	5.5	30.2	0.3	0.002	5983	5887	pg18beta1_o2nofp.cx10b_c8r32
999	5985	0	0.0	28.1	2.7	0.000	0.000	0.028	2.731	24810	13.6	4.145	182	5.5	30.2	0.3	0.002	5967	5887	pg18beta1_o2nofp.cx10c_c8r32
999	5731	0	0.0	28.2	2.7	0.000	0.000	0.028	2.724	23830	14.1	4.158	197	5.5	30.2	0.3	0.002	5727	5503	pg18beta1_o2nofp.cx10d_c8r32
l.i0
- l.i0: load without secondary indexes
- Legend for results is here.
- Each entry lists the percentage of responses that fit in that bucket (slower than max time for previous bucket, faster than min time for next bucket).
Insert response time histogram
256us	1ms	4ms	16ms	64ms	256ms	1s	4s	16s	gt	max	tag
0.000	99.980	0.020	0.000	0.000	0.000	0.000	0.000	0.000	0.000	0.003	pg140_o2nofp.cx10a_c8r32
0.000	99.979	0.020	0.001	0.000	0.000	0.000	0.000	0.000	0.000	0.005	pg1418_o2nofp.cx10a_c8r32
0.000	99.984	0.015	0.000	0.000	0.000	0.000	0.000	0.000	0.000	0.003	pg150_o2nofp.cx10a_c8r32
0.000	99.989	0.011	0.000	0.000	0.000	0.000	0.000	0.000	0.000	0.002	pg1513_o2nofp.cx10a_c8r32
0.000	99.987	0.013	0.000	0.000	0.000	0.000	0.000	0.000	0.000	0.002	pg160_o2nofp.cx10a_c8r32
0.000	99.986	0.014	0.000	0.000	0.000	0.000	0.000	0.000	0.000	0.002	pg169_o2nofp.cx10a_c8r32
0.000	99.988	0.012	0.000	0.000	0.000	0.000	0.000	0.000	0.000	0.002	pg170_o2nofp.cx10a_c8r32
0.000	99.982	0.018	0.000	0.000	0.000	0.000	0.000	0.000	0.000	0.003	pg175_o2nofp.cx10a_c8r32
0.000	99.989	0.011	0.000	0.000	0.000	0.000	0.000	0.000	0.000	0.002	pg18beta1_o2nofp.cx10b_c8r32
0.000	99.984	0.017	0.000	0.000	0.000	0.000	0.000	0.000	0.000	0.002	pg18beta1_o2nofp.cx10c_c8r32
0.000	99.980	0.020	0.000	0.000	0.000	0.000	0.000	0.000	0.000	0.002	pg18beta1_o2nofp.cx10d_c8r32
l.x
- l.x: create secondary indexes
- Legend for results is here.
- Each entry lists the percentage of responses that fit in that bucket (slower than max time for previous bucket, faster than min time for next bucket).
TODO - determine whether there is data for create index response time
l.i1
- l.i1: continue load after secondary indexes created with 50 inserts per transaction
- Legend for results is here.
- Each entry lists the percentage of responses that fit in that bucket (slower than max time for previous bucket, faster than min time for next bucket).
Insert response time histogram
256us	1ms	4ms	16ms	64ms	256ms	1s	4s	16s	gt	max	tag
0.000	52.106	47.893	0.001	nonzero	0.000	0.000	0.000	0.000	0.000	0.057	pg140_o2nofp.cx10a_c8r32
0.000	55.195	44.795	0.001	0.009	0.000	0.000	0.000	0.000	0.000	0.049	pg1418_o2nofp.cx10a_c8r32
0.000	48.105	51.894	0.001	0.001	0.000	0.000	0.000	0.000	0.000	0.043	pg150_o2nofp.cx10a_c8r32
0.000	52.287	47.712	0.001	nonzero	0.000	0.000	0.000	0.000	0.000	0.021	pg1513_o2nofp.cx10a_c8r32
0.000	49.730	50.269	0.001	nonzero	0.000	0.000	0.000	0.000	0.000	0.026	pg160_o2nofp.cx10a_c8r32
0.000	47.592	52.407	0.001	0.001	0.000	0.000	0.000	0.000	0.000	0.035	pg169_o2nofp.cx10a_c8r32
0.000	62.833	37.166	0.001	0.001	0.000	0.000	0.000	0.000	0.000	0.033	pg170_o2nofp.cx10a_c8r32
0.000	61.423	38.576	nonzero	0.001	0.000	0.000	0.000	0.000	0.000	0.030	pg175_o2nofp.cx10a_c8r32
0.000	55.584	44.411	0.004	0.001	0.000	0.000	0.000	0.000	0.000	0.059	pg18beta1_o2nofp.cx10b_c8r32
0.000	52.173	47.818	0.002	0.008	0.000	0.000	0.000	0.000	0.000	0.050	pg18beta1_o2nofp.cx10c_c8r32
0.000	54.231	45.767	0.001	0.001	0.000	0.000	0.000	0.000	0.000	0.028	pg18beta1_o2nofp.cx10d_c8r32
Delete response time histogram
256us	1ms	4ms	16ms	64ms	256ms	1s	4s	16s	gt	max	tag
0.000	29.212	70.767	0.020	0.001	0.000	0.000	0.000	0.000	0.000	0.056	pg140_o2nofp.cx10a_c8r32
0.000	30.077	57.242	12.677	0.005	0.000	0.000	0.000	0.000	0.000	0.046	pg1418_o2nofp.cx10a_c8r32
0.000	29.665	70.315	0.019	0.001	0.000	0.000	0.000	0.000	0.000	0.044	pg150_o2nofp.cx10a_c8r32
0.000	30.359	69.618	0.023	nonzero	0.000	0.000	0.000	0.000	0.000	0.028	pg1513_o2nofp.cx10a_c8r32
0.000	29.303	58.354	12.343	nonzero	0.000	0.000	0.000	0.000	0.000	0.030	pg160_o2nofp.cx10a_c8r32
0.000	28.678	71.299	0.022	0.001	0.000	0.000	0.000	0.000	0.000	0.035	pg169_o2nofp.cx10a_c8r32
0.000	27.842	60.098	12.059	0.001	0.000	0.000	0.000	0.000	0.000	0.033	pg170_o2nofp.cx10a_c8r32
0.000	27.450	61.732	10.817	0.001	0.000	0.000	0.000	0.000	0.000	0.030	pg175_o2nofp.cx10a_c8r32
0.000	26.747	56.502	16.750	0.001	0.000	0.000	0.000	0.000	0.000	0.027	pg18beta1_o2nofp.cx10b_c8r32
0.000	27.270	69.559	3.165	0.006	0.000	0.000	0.000	0.000	0.000	0.049	pg18beta1_o2nofp.cx10c_c8r32
0.000	27.140	56.922	15.937	0.001	0.000	0.000	0.000	0.000	0.000	0.030	pg18beta1_o2nofp.cx10d_c8r32
l.i2
- l.i2: continue load after secondary indexes created with 5 inserts per transaction
- Legend for results is here.
- Each entry lists the percentage of responses that fit in that bucket (slower than max time for previous bucket, faster than min time for next bucket).
Insert response time histogram
256us	1ms	4ms	16ms	64ms	256ms	1s	4s	16s	gt	max	tag
58.694	41.306	nonzero	nonzero	0.000	0.000	0.000	0.000	0.000	0.000	0.004	pg140_o2nofp.cx10a_c8r32
58.665	41.335	nonzero	nonzero	nonzero	0.000	0.000	0.000	0.000	0.000	0.031	pg1418_o2nofp.cx10a_c8r32
58.031	41.969	nonzero	nonzero	0.000	0.000	0.000	0.000	0.000	0.000	0.007	pg150_o2nofp.cx10a_c8r32
59.772	40.228	nonzero	nonzero	nonzero	0.000	0.000	0.000	0.000	0.000	0.050	pg1513_o2nofp.cx10a_c8r32
54.883	45.117	nonzero	nonzero	nonzero	0.000	0.000	0.000	0.000	0.000	0.025	pg160_o2nofp.cx10a_c8r32
56.139	43.861	nonzero	nonzero	0.000	0.000	0.000	0.000	0.000	0.000	0.005	pg169_o2nofp.cx10a_c8r32
61.505	38.495	nonzero	nonzero	0.000	0.000	0.000	0.000	0.000	0.000	0.010	pg170_o2nofp.cx10a_c8r32
58.218	41.781	nonzero	nonzero	nonzero	0.000	0.000	0.000	0.000	0.000	0.036	pg175_o2nofp.cx10a_c8r32
56.587	43.412	nonzero	nonzero	nonzero	0.000	0.000	0.000	0.000	0.000	0.032	pg18beta1_o2nofp.cx10b_c8r32
54.090	45.909	nonzero	nonzero	0.000	0.000	0.000	0.000	0.000	0.000	0.008	pg18beta1_o2nofp.cx10c_c8r32
56.056	43.944	nonzero	0.000	nonzero	0.000	0.000	0.000	0.000	0.000	0.032	pg18beta1_o2nofp.cx10d_c8r32
Delete response time histogram
256us	1ms	4ms	16ms	64ms	256ms	1s	4s	16s	gt	max	tag
1.966	31.536	66.496	0.002	0.000	0.000	0.000	0.000	0.000	0.000	0.014	pg140_o2nofp.cx10a_c8r32
1.790	40.698	56.966	0.546	nonzero	0.000	0.000	0.000	0.000	0.000	0.032	pg1418_o2nofp.cx10a_c8r32
1.906	32.904	65.187	0.002	0.000	0.000	0.000	0.000	0.000	0.000	0.014	pg150_o2nofp.cx10a_c8r32
1.851	28.436	69.710	0.002	nonzero	0.000	0.000	0.000	0.000	0.000	0.051	pg1513_o2nofp.cx10a_c8r32
2.020	39.698	58.101	0.181	nonzero	0.000	0.000	0.000	0.000	0.000	0.026	pg160_o2nofp.cx10a_c8r32
1.538	32.618	65.843	0.002	0.000	0.000	0.000	0.000	0.000	0.000	0.015	pg169_o2nofp.cx10a_c8r32
1.638	40.312	54.217	3.833	0.000	0.000	0.000	0.000	0.000	0.000	0.010	pg170_o2nofp.cx10a_c8r32
1.727	37.206	57.944	3.123	nonzero	0.000	0.000	0.000	0.000	0.000	0.026	pg175_o2nofp.cx10a_c8r32
1.575	37.725	58.990	1.710	nonzero	0.000	0.000	0.000	0.000	0.000	0.033	pg18beta1_o2nofp.cx10b_c8r32
1.573	38.725	58.182	1.520	0.000	0.000	0.000	0.000	0.000	0.000	0.014	pg18beta1_o2nofp.cx10c_c8r32
1.599	38.993	58.683	0.724	nonzero	0.000	0.000	0.000	0.000	0.000	0.032	pg18beta1_o2nofp.cx10d_c8r32
qr100.L1
- qr100.L1: range queries with 100 insert/s per client
- Legend for results is here.
- Each entry lists the percentage of responses that fit in that bucket (slower than max time for previous bucket, faster than min time for next bucket).
Query response time histogram
256us	1ms	4ms	16ms	64ms	256ms	1s	4s	16s	gt	max	tag
99.996	0.004	nonzero	nonzero	0.000	0.000	0.000	0.000	0.000	0.000	0.009	pg140_o2nofp.cx10a_c8r32
99.996	0.004	nonzero	nonzero	0.000	0.000	0.000	0.000	0.000	0.000	0.009	pg1418_o2nofp.cx10a_c8r32
99.997	0.003	nonzero	0.000	0.000	0.000	0.000	0.000	0.000	0.000	0.001	pg150_o2nofp.cx10a_c8r32
99.998	0.002	0.000	0.000	0.000	0.000	0.000	0.000	0.000	0.000	0.001	pg1513_o2nofp.cx10a_c8r32
99.998	0.002	nonzero	0.000	0.000	0.000	0.000	0.000	0.000	0.000	0.001	pg160_o2nofp.cx10a_c8r32
99.998	0.002	nonzero	0.000	0.000	0.000	0.000	0.000	0.000	0.000	0.001	pg169_o2nofp.cx10a_c8r32
99.998	0.002	0.000	0.000	0.000	0.000	0.000	0.000	0.000	0.000	0.001	pg170_o2nofp.cx10a_c8r32
99.998	0.002	0.000	0.000	0.000	0.000	0.000	0.000	0.000	0.000	0.001	pg175_o2nofp.cx10a_c8r32
99.998	0.002	nonzero	0.000	0.000	0.000	0.000	0.000	0.000	0.000	0.001	pg18beta1_o2nofp.cx10b_c8r32
99.998	0.002	0.000	0.000	0.000	0.000	0.000	0.000	0.000	0.000	0.001	pg18beta1_o2nofp.cx10c_c8r32
99.998	0.002	0.000	0.000	0.000	0.000	0.000	0.000	0.000	0.000	0.001	pg18beta1_o2nofp.cx10d_c8r32
Insert response time histogram
256us	1ms	4ms	16ms	64ms	256ms	1s	4s	16s	gt	max	tag
0.000	0.028	99.944	0.028	0.000	0.000	0.000	0.000	0.000	0.000	0.006	pg140_o2nofp.cx10a_c8r32
0.000	0.000	99.944	0.056	0.000	0.000	0.000	0.000	0.000	0.000	0.006	pg1418_o2nofp.cx10a_c8r32
0.000	0.278	99.667	0.056	0.000	0.000	0.000	0.000	0.000	0.000	0.006	pg150_o2nofp.cx10a_c8r32
0.000	1.083	98.861	0.056	0.000	0.000	0.000	0.000	0.000	0.000	0.006	pg1513_o2nofp.cx10a_c8r32
0.000	0.389	99.556	0.056	0.000	0.000	0.000	0.000	0.000	0.000	0.006	pg160_o2nofp.cx10a_c8r32
0.000	0.889	99.056	0.056	0.000	0.000	0.000	0.000	0.000	0.000	0.006	pg169_o2nofp.cx10a_c8r32
0.000	2.722	97.250	0.028	0.000	0.000	0.000	0.000	0.000	0.000	0.006	pg170_o2nofp.cx10a_c8r32
0.000	0.194	99.778	0.028	0.000	0.000	0.000	0.000	0.000	0.000	0.006	pg175_o2nofp.cx10a_c8r32
0.000	0.528	99.417	0.056	0.000	0.000	0.000	0.000	0.000	0.000	0.006	pg18beta1_o2nofp.cx10b_c8r32
0.000	2.472	97.472	0.056	0.000	0.000	0.000	0.000	0.000	0.000	0.006	pg18beta1_o2nofp.cx10c_c8r32
0.000	0.667	99.306	0.028	0.000	0.000	0.000	0.000	0.000	0.000	0.006	pg18beta1_o2nofp.cx10d_c8r32
Delete response time histogram
256us	1ms	4ms	16ms	64ms	256ms	1s	4s	16s	gt	max	tag
0.000	48.056	51.944	0.000	0.000	0.000	0.000	0.000	0.000	0.000	0.002	pg140_o2nofp.cx10a_c8r32
0.000	50.667	49.333	0.000	0.000	0.000	0.000	0.000	0.000	0.000	0.002	pg1418_o2nofp.cx10a_c8r32
0.000	44.889	55.111	0.000	0.000	0.000	0.000	0.000	0.000	0.000	0.002	pg150_o2nofp.cx10a_c8r32
0.000	53.083	46.917	0.000	0.000	0.000	0.000	0.000	0.000	0.000	0.002	pg1513_o2nofp.cx10a_c8r32
0.000	47.972	52.028	0.000	0.000	0.000	0.000	0.000	0.000	0.000	0.002	pg160_o2nofp.cx10a_c8r32
0.000	59.778	40.222	0.000	0.000	0.000	0.000	0.000	0.000	0.000	0.002	pg169_o2nofp.cx10a_c8r32
0.000	51.222	48.778	0.000	0.000	0.000	0.000	0.000	0.000	0.000	0.002	pg170_o2nofp.cx10a_c8r32
0.000	52.250	47.750	0.000	0.000	0.000	0.000	0.000	0.000	0.000	0.002	pg175_o2nofp.cx10a_c8r32
0.000	50.917	49.083	0.000	0.000	0.000	0.000	0.000	0.000	0.000	0.002	pg18beta1_o2nofp.cx10b_c8r32
0.000	54.194	45.806	0.000	0.000	0.000	0.000	0.000	0.000	0.000	0.002	pg18beta1_o2nofp.cx10c_c8r32
0.000	49.583	50.417	0.000	0.000	0.000	0.000	0.000	0.000	0.000	0.002	pg18beta1_o2nofp.cx10d_c8r32
qp100.L2
- qp100.L2: point queries with 100 insert/s per client
- Legend for results is here.
- Each entry lists the percentage of responses that fit in that bucket (slower than max time for previous bucket, faster than min time for next bucket).
Query response time histogram
256us	1ms	4ms	16ms	64ms	256ms	1s	4s	16s	gt	max	tag
98.608	1.391	nonzero	0.000	0.000	0.000	0.000	0.000	0.000	0.000	0.002	pg140_o2nofp.cx10a_c8r32
98.404	1.596	nonzero	0.000	0.000	0.000	0.000	0.000	0.000	0.000	0.001	pg1418_o2nofp.cx10a_c8r32
98.411	1.589	nonzero	0.000	0.000	0.000	0.000	0.000	0.000	0.000	0.001	pg150_o2nofp.cx10a_c8r32
98.281	1.719	0.000	0.000	0.000	0.000	0.000	0.000	0.000	0.000	0.001	pg1513_o2nofp.cx10a_c8r32
98.111	1.889	nonzero	0.000	0.000	0.000	0.000	0.000	0.000	0.000	0.001	pg160_o2nofp.cx10a_c8r32
98.297	1.703	nonzero	0.000	0.000	0.000	0.000	0.000	0.000	0.000	0.001	pg169_o2nofp.cx10a_c8r32
98.492	1.508	nonzero	0.000	0.000	0.000	0.000	0.000	0.000	0.000	0.001	pg170_o2nofp.cx10a_c8r32
98.083	1.917	nonzero	0.000	0.000	0.000	0.000	0.000	0.000	0.000	0.001	pg175_o2nofp.cx10a_c8r32
98.522	1.478	nonzero	0.000	0.000	0.000	0.000	0.000	0.000	0.000	0.001	pg18beta1_o2nofp.cx10b_c8r32
98.161	1.839	nonzero	0.000	0.000	0.000	0.000	0.000	0.000	0.000	0.002	pg18beta1_o2nofp.cx10c_c8r32
97.997	2.003	nonzero	0.000	0.000	0.000	0.000	0.000	0.000	0.000	0.001	pg18beta1_o2nofp.cx10d_c8r32
Insert response time histogram
256us	1ms	4ms	16ms	64ms	256ms	1s	4s	16s	gt	max	tag
0.000	0.000	99.944	0.056	0.000	0.000	0.000	0.000	0.000	0.000	0.005	pg140_o2nofp.cx10a_c8r32
0.000	0.000	99.944	0.056	0.000	0.000	0.000	0.000	0.000	0.000	0.005	pg1418_o2nofp.cx10a_c8r32
0.000	0.000	99.972	0.028	0.000	0.000	0.000	0.000	0.000	0.000	0.006	pg150_o2nofp.cx10a_c8r32
0.000	0.000	99.944	0.056	0.000	0.000	0.000	0.000	0.000	0.000	0.006	pg1513_o2nofp.cx10a_c8r32
0.000	0.000	99.944	0.056	0.000	0.000	0.000	0.000	0.000	0.000	0.005	pg160_o2nofp.cx10a_c8r32
0.000	0.000	99.944	0.056	0.000	0.000	0.000	0.000	0.000	0.000	0.009	pg169_o2nofp.cx10a_c8r32
0.000	0.000	99.972	0.028	0.000	0.000	0.000	0.000	0.000	0.000	0.005	pg170_o2nofp.cx10a_c8r32
0.000	0.000	99.944	0.056	0.000	0.000	0.000	0.000	0.000	0.000	0.005	pg175_o2nofp.cx10a_c8r32
0.000	0.000	99.944	0.056	0.000	0.000	0.000	0.000	0.000	0.000	0.006	pg18beta1_o2nofp.cx10b_c8r32
0.000	0.000	99.722	0.278	0.000	0.000	0.000	0.000	0.000	0.000	0.010	pg18beta1_o2nofp.cx10c_c8r32
0.000	0.000	99.944	0.056	0.000	0.000	0.000	0.000	0.000	0.000	0.006	pg18beta1_o2nofp.cx10d_c8r32
Delete response time histogram
256us	1ms	4ms	16ms	64ms	256ms	1s	4s	16s	gt	max	tag
0.000	14.278	85.722	0.000	0.000	0.000	0.000	0.000	0.000	0.000	0.004	pg140_o2nofp.cx10a_c8r32
0.000	10.389	89.611	0.000	0.000	0.000	0.000	0.000	0.000	0.000	0.004	pg1418_o2nofp.cx10a_c8r32
0.000	6.500	93.472	0.028	0.000	0.000	0.000	0.000	0.000	0.000	0.005	pg150_o2nofp.cx10a_c8r32
0.000	11.778	88.194	0.028	0.000	0.000	0.000	0.000	0.000	0.000	0.004	pg1513_o2nofp.cx10a_c8r32
0.000	10.306	89.667	0.028	0.000	0.000	0.000	0.000	0.000	0.000	0.004	pg160_o2nofp.cx10a_c8r32
0.000	7.694	92.306	0.000	0.000	0.000	0.000	0.000	0.000	0.000	0.004	pg169_o2nofp.cx10a_c8r32
0.000	8.556	91.417	0.028	0.000	0.000	0.000	0.000	0.000	0.000	0.004	pg170_o2nofp.cx10a_c8r32
0.000	7.028	92.944	0.028	0.000	0.000	0.000	0.000	0.000	0.000	0.004	pg175_o2nofp.cx10a_c8r32
0.000	0.722	99.250	0.028	0.000	0.000	0.000	0.000	0.000	0.000	0.005	pg18beta1_o2nofp.cx10b_c8r32
0.000	4.194	95.778	0.028	0.000	0.000	0.000	0.000	0.000	0.000	0.004	pg18beta1_o2nofp.cx10c_c8r32
0.000	0.167	99.806	0.028	0.000	0.000	0.000	0.000	0.000	0.000	0.004	pg18beta1_o2nofp.cx10d_c8r32
qr500.L3
- qr500.L3: range queries with 500 insert/s per client
- Legend for results is here.
- Each entry lists the percentage of responses that fit in that bucket (slower than max time for previous bucket, faster than min time for next bucket).
Query response time histogram
256us	1ms	4ms	16ms	64ms	256ms	1s	4s	16s	gt	max	tag
99.994	0.006	nonzero	0.000	0.000	0.000	0.000	0.000	0.000	0.000	0.002	pg140_o2nofp.cx10a_c8r32
99.994	0.006	nonzero	0.000	0.000	0.000	0.000	0.000	0.000	0.000	0.002	pg1418_o2nofp.cx10a_c8r32
99.997	0.003	nonzero	0.000	0.000	0.000	0.000	0.000	0.000	0.000	0.002	pg150_o2nofp.cx10a_c8r32
99.995	0.005	nonzero	0.000	0.000	0.000	0.000	0.000	0.000	0.000	0.002	pg1513_o2nofp.cx10a_c8r32
99.995	0.005	nonzero	0.000	0.000	0.000	0.000	0.000	0.000	0.000	0.003	pg160_o2nofp.cx10a_c8r32
99.995	0.005	nonzero	nonzero	0.000	0.000	0.000	0.000	0.000	0.000	0.006	pg169_o2nofp.cx10a_c8r32
99.996	0.004	nonzero	0.000	0.000	0.000	0.000	0.000	0.000	0.000	0.002	pg170_o2nofp.cx10a_c8r32
99.997	0.003	nonzero	0.000	0.000	0.000	0.000	0.000	0.000	0.000	0.002	pg175_o2nofp.cx10a_c8r32
99.996	0.004	nonzero	0.000	0.000	0.000	0.000	0.000	0.000	0.000	0.002	pg18beta1_o2nofp.cx10b_c8r32
99.996	0.004	nonzero	0.000	nonzero	0.000	0.000	0.000	0.000	0.000	0.031	pg18beta1_o2nofp.cx10c_c8r32
99.996	0.004	nonzero	0.000	0.000	0.000	0.000	0.000	0.000	0.000	0.003	pg18beta1_o2nofp.cx10d_c8r32
Insert response time histogram
256us	1ms	4ms	16ms	64ms	256ms	1s	4s	16s	gt	max	tag
0.000	22.267	77.644	0.089	0.000	0.000	0.000	0.000	0.000	0.000	0.010	pg140_o2nofp.cx10a_c8r32
0.000	14.944	84.856	0.200	0.000	0.000	0.000	0.000	0.000	0.000	0.011	pg1418_o2nofp.cx10a_c8r32
0.000	24.978	74.989	0.033	0.000	0.000	0.000	0.000	0.000	0.000	0.009	pg150_o2nofp.cx10a_c8r32
0.000	30.444	69.489	0.067	0.000	0.000	0.000	0.000	0.000	0.000	0.010	pg1513_o2nofp.cx10a_c8r32
0.000	22.744	77.239	0.017	0.000	0.000	0.000	0.000	0.000	0.000	0.010	pg160_o2nofp.cx10a_c8r32
0.000	24.383	75.494	0.122	0.000	0.000	0.000	0.000	0.000	0.000	0.010	pg169_o2nofp.cx10a_c8r32
0.000	29.822	70.122	0.056	0.000	0.000	0.000	0.000	0.000	0.000	0.010	pg170_o2nofp.cx10a_c8r32
0.000	26.056	73.922	0.022	0.000	0.000	0.000	0.000	0.000	0.000	0.010	pg175_o2nofp.cx10a_c8r32
0.000	29.656	70.322	0.022	0.000	0.000	0.000	0.000	0.000	0.000	0.007	pg18beta1_o2nofp.cx10b_c8r32
0.000	29.072	70.706	0.222	0.000	0.000	0.000	0.000	0.000	0.000	0.011	pg18beta1_o2nofp.cx10c_c8r32
0.000	28.811	71.144	0.044	0.000	0.000	0.000	0.000	0.000	0.000	0.010	pg18beta1_o2nofp.cx10d_c8r32
Delete response time histogram
256us	1ms	4ms	16ms	64ms	256ms	1s	4s	16s	gt	max	tag
0.000	24.700	74.956	0.344	0.000	0.000	0.000	0.000	0.000	0.000	0.010	pg140_o2nofp.cx10a_c8r32
0.000	23.900	75.917	0.183	0.000	0.000	0.000	0.000	0.000	0.000	0.010	pg1418_o2nofp.cx10a_c8r32
0.000	23.383	76.428	0.189	0.000	0.000	0.000	0.000	0.000	0.000	0.008	pg150_o2nofp.cx10a_c8r32
0.000	19.300	80.550	0.150	0.000	0.000	0.000	0.000	0.000	0.000	0.010	pg1513_o2nofp.cx10a_c8r32
0.000	23.156	76.628	0.217	0.000	0.000	0.000	0.000	0.000	0.000	0.006	pg160_o2nofp.cx10a_c8r32
0.000	23.572	75.583	0.844	0.000	0.000	0.000	0.000	0.000	0.000	0.010	pg169_o2nofp.cx10a_c8r32
0.000	18.556	80.311	1.133	0.000	0.000	0.000	0.000	0.000	0.000	0.012	pg170_o2nofp.cx10a_c8r32
0.000	19.417	79.467	1.117	0.000	0.000	0.000	0.000	0.000	0.000	0.007	pg175_o2nofp.cx10a_c8r32
0.000	22.367	77.011	0.622	0.000	0.000	0.000	0.000	0.000	0.000	0.006	pg18beta1_o2nofp.cx10b_c8r32
0.000	15.650	83.594	0.756	0.000	0.000	0.000	0.000	0.000	0.000	0.011	pg18beta1_o2nofp.cx10c_c8r32
0.000	18.456	80.933	0.611	0.000	0.000	0.000	0.000	0.000	0.000	0.010	pg18beta1_o2nofp.cx10d_c8r32
qp500.L4
- qp500.L4: point queries with 500 insert/s per client
- Legend for results is here.
- Each entry lists the percentage of responses that fit in that bucket (slower than max time for previous bucket, faster than min time for next bucket).
Query response time histogram
256us	1ms	4ms	16ms	64ms	256ms	1s	4s	16s	gt	max	tag
98.847	1.153	nonzero	0.000	0.000	0.000	0.000	0.000	0.000	0.000	0.002	pg140_o2nofp.cx10a_c8r32
98.329	1.671	nonzero	0.000	0.000	0.000	0.000	0.000	0.000	0.000	0.003	pg1418_o2nofp.cx10a_c8r32
98.343	1.657	nonzero	0.000	0.000	0.000	0.000	0.000	0.000	0.000	0.002	pg150_o2nofp.cx10a_c8r32
98.339	1.661	nonzero	0.000	0.000	0.000	0.000	0.000	0.000	0.000	0.002	pg1513_o2nofp.cx10a_c8r32
98.190	1.810	nonzero	0.000	0.000	0.000	0.000	0.000	0.000	0.000	0.002	pg160_o2nofp.cx10a_c8r32
98.065	1.935	nonzero	0.000	0.000	0.000	0.000	0.000	0.000	0.000	0.002	pg169_o2nofp.cx10a_c8r32
98.143	1.857	nonzero	0.000	0.000	0.000	0.000	0.000	0.000	0.000	0.002	pg170_o2nofp.cx10a_c8r32
98.123	1.877	nonzero	0.000	0.000	0.000	0.000	0.000	0.000	0.000	0.002	pg175_o2nofp.cx10a_c8r32
98.171	1.829	nonzero	0.000	0.000	0.000	0.000	0.000	0.000	0.000	0.002	pg18beta1_o2nofp.cx10b_c8r32
98.004	1.996	nonzero	0.000	0.000	0.000	0.000	0.000	0.000	0.000	0.001	pg18beta1_o2nofp.cx10c_c8r32
97.839	2.161	nonzero	0.000	0.000	0.000	0.000	0.000	0.000	0.000	0.002	pg18beta1_o2nofp.cx10d_c8r32
Insert response time histogram
256us	1ms	4ms	16ms	64ms	256ms	1s	4s	16s	gt	max	tag
0.000	13.467	86.522	0.011	0.000	0.000	0.000	0.000	0.000	0.000	0.009	pg140_o2nofp.cx10a_c8r32
0.000	9.939	90.011	0.050	0.000	0.000	0.000	0.000	0.000	0.000	0.009	pg1418_o2nofp.cx10a_c8r32
0.000	9.650	90.189	0.156	0.006	0.000	0.000	0.000	0.000	0.000	0.018	pg150_o2nofp.cx10a_c8r32
0.000	14.128	85.678	0.194	0.000	0.000	0.000	0.000	0.000	0.000	0.011	pg1513_o2nofp.cx10a_c8r32
0.000	8.700	91.200	0.100	0.000	0.000	0.000	0.000	0.000	0.000	0.010	pg160_o2nofp.cx10a_c8r32
0.000	13.483	86.478	0.039	0.000	0.000	0.000	0.000	0.000	0.000	0.010	pg169_o2nofp.cx10a_c8r32
0.000	16.150	83.717	0.133	0.000	0.000	0.000	0.000	0.000	0.000	0.010	pg170_o2nofp.cx10a_c8r32
0.000	10.622	89.239	0.139	0.000	0.000	0.000	0.000	0.000	0.000	0.010	pg175_o2nofp.cx10a_c8r32
0.000	15.678	84.294	0.028	0.000	0.000	0.000	0.000	0.000	0.000	0.010	pg18beta1_o2nofp.cx10b_c8r32
0.000	15.822	84.161	0.011	0.006	0.000	0.000	0.000	0.000	0.000	0.021	pg18beta1_o2nofp.cx10c_c8r32
0.000	13.567	86.306	0.128	0.000	0.000	0.000	0.000	0.000	0.000	0.013	pg18beta1_o2nofp.cx10d_c8r32
Delete response time histogram
256us	1ms	4ms	16ms	64ms	256ms	1s	4s	16s	gt	max	tag
0.000	20.811	78.889	0.300	0.000	0.000	0.000	0.000	0.000	0.000	0.008	pg140_o2nofp.cx10a_c8r32
0.000	22.144	77.561	0.294	0.000	0.000	0.000	0.000	0.000	0.000	0.009	pg1418_o2nofp.cx10a_c8r32
0.000	18.961	80.811	0.222	0.006	0.000	0.000	0.000	0.000	0.000	0.017	pg150_o2nofp.cx10a_c8r32
0.000	20.567	79.178	0.256	0.000	0.000	0.000	0.000	0.000	0.000	0.010	pg1513_o2nofp.cx10a_c8r32
0.000	18.800	80.789	0.411	0.000	0.000	0.000	0.000	0.000	0.000	0.004	pg160_o2nofp.cx10a_c8r32
0.000	22.989	73.589	3.422	0.000	0.000	0.000	0.000	0.000	0.000	0.009	pg169_o2nofp.cx10a_c8r32
0.000	19.233	79.339	1.428	0.000	0.000	0.000	0.000	0.000	0.000	0.011	pg170_o2nofp.cx10a_c8r32
0.000	17.572	81.078	1.350	0.000	0.000	0.000	0.000	0.000	0.000	0.010	pg175_o2nofp.cx10a_c8r32
0.000	16.906	82.217	0.878	0.000	0.000	0.000	0.000	0.000	0.000	0.005	pg18beta1_o2nofp.cx10b_c8r32
0.000	17.500	81.672	0.822	0.006	0.000	0.000	0.000	0.000	0.000	0.019	pg18beta1_o2nofp.cx10c_c8r32
0.000	17.178	82.028	0.794	0.000	0.000	0.000	0.000	0.000	0.000	0.011	pg18beta1_o2nofp.cx10d_c8r32
qr1000.L5
- qr1000.L5: range queries with 1000 insert/s per client
- Legend for results is here.
- Each entry lists the percentage of responses that fit in that bucket (slower than max time for previous bucket, faster than min time for next bucket).
Query response time histogram
256us	1ms	4ms	16ms	64ms	256ms	1s	4s	16s	gt	max	tag
99.994	0.006	nonzero	0.000	0.000	0.000	0.000	0.000	0.000	0.000	0.002	pg140_o2nofp.cx10a_c8r32
99.994	0.006	nonzero	0.000	0.000	0.000	0.000	0.000	0.000	0.000	0.002	pg1418_o2nofp.cx10a_c8r32
99.995	0.005	nonzero	0.000	0.000	0.000	0.000	0.000	0.000	0.000	0.002	pg150_o2nofp.cx10a_c8r32
99.996	0.004	nonzero	0.000	0.000	0.000	0.000	0.000	0.000	0.000	0.002	pg1513_o2nofp.cx10a_c8r32
99.996	0.004	nonzero	0.000	0.000	0.000	0.000	0.000	0.000	0.000	0.002	pg160_o2nofp.cx10a_c8r32
99.996	0.004	nonzero	0.000	0.000	0.000	0.000	0.000	0.000	0.000	0.003	pg169_o2nofp.cx10a_c8r32
99.996	0.004	nonzero	nonzero	0.000	0.000	0.000	0.000	0.000	0.000	0.004	pg170_o2nofp.cx10a_c8r32
99.996	0.004	nonzero	0.000	0.000	0.000	0.000	0.000	0.000	0.000	0.002	pg175_o2nofp.cx10a_c8r32
99.994	0.006	nonzero	nonzero	0.000	0.000	0.000	0.000	0.000	0.000	0.006	pg18beta1_o2nofp.cx10b_c8r32
99.994	0.006	nonzero	0.000	0.000	0.000	0.000	0.000	0.000	0.000	0.003	pg18beta1_o2nofp.cx10c_c8r32
99.994	0.006	nonzero	0.000	0.000	0.000	0.000	0.000	0.000	0.000	0.004	pg18beta1_o2nofp.cx10d_c8r32
Insert response time histogram
256us	1ms	4ms	16ms	64ms	256ms	1s	4s	16s	gt	max	tag
0.000	41.142	58.836	0.022	0.000	0.000	0.000	0.000	0.000	0.000	0.010	pg140_o2nofp.cx10a_c8r32
0.000	37.864	62.128	0.008	0.000	0.000	0.000	0.000	0.000	0.000	0.010	pg1418_o2nofp.cx10a_c8r32
0.000	43.567	56.425	0.008	0.000	0.000	0.000	0.000	0.000	0.000	0.008	pg150_o2nofp.cx10a_c8r32
0.000	48.269	51.719	0.011	0.000	0.000	0.000	0.000	0.000	0.000	0.010	pg1513_o2nofp.cx10a_c8r32
0.000	41.583	58.386	0.031	0.000	0.000	0.000	0.000	0.000	0.000	0.010	pg160_o2nofp.cx10a_c8r32
0.000	42.528	57.461	0.011	0.000	0.000	0.000	0.000	0.000	0.000	0.006	pg169_o2nofp.cx10a_c8r32
0.000	47.233	52.764	0.003	0.000	0.000	0.000	0.000	0.000	0.000	0.005	pg170_o2nofp.cx10a_c8r32
0.000	42.983	57.008	0.008	0.000	0.000	0.000	0.000	0.000	0.000	0.006	pg175_o2nofp.cx10a_c8r32
0.000	42.094	57.847	0.058	0.000	0.000	0.000	0.000	0.000	0.000	0.010	pg18beta1_o2nofp.cx10b_c8r32
0.000	48.808	51.178	0.014	0.000	0.000	0.000	0.000	0.000	0.000	0.010	pg18beta1_o2nofp.cx10c_c8r32
0.000	43.917	56.078	0.006	0.000	0.000	0.000	0.000	0.000	0.000	0.005	pg18beta1_o2nofp.cx10d_c8r32
Delete response time histogram
256us	1ms	4ms	16ms	64ms	256ms	1s	4s	16s	gt	max	tag
0.000	22.106	77.756	0.139	0.000	0.000	0.000	0.000	0.000	0.000	0.005	pg140_o2nofp.cx10a_c8r32
0.000	22.861	77.078	0.061	0.000	0.000	0.000	0.000	0.000	0.000	0.004	pg1418_o2nofp.cx10a_c8r32
0.000	21.364	78.561	0.075	0.000	0.000	0.000	0.000	0.000	0.000	0.005	pg150_o2nofp.cx10a_c8r32
0.000	24.486	75.408	0.106	0.000	0.000	0.000	0.000	0.000	0.000	0.004	pg1513_o2nofp.cx10a_c8r32
0.000	19.472	80.422	0.106	0.000	0.000	0.000	0.000	0.000	0.000	0.009	pg160_o2nofp.cx10a_c8r32
0.000	24.028	67.647	8.325	0.000	0.000	0.000	0.000	0.000	0.000	0.007	pg169_o2nofp.cx10a_c8r32
0.000	18.781	80.594	0.625	0.000	0.000	0.000	0.000	0.000	0.000	0.005	pg170_o2nofp.cx10a_c8r32
0.000	19.372	80.078	0.550	0.000	0.000	0.000	0.000	0.000	0.000	0.005	pg175_o2nofp.cx10a_c8r32
0.000	16.508	83.033	0.458	0.000	0.000	0.000	0.000	0.000	0.000	0.011	pg18beta1_o2nofp.cx10b_c8r32
0.000	18.342	81.094	0.564	0.000	0.000	0.000	0.000	0.000	0.000	0.005	pg18beta1_o2nofp.cx10c_c8r32
0.000	17.772	81.839	0.389	0.000	0.000	0.000	0.000	0.000	0.000	0.005	pg18beta1_o2nofp.cx10d_c8r32
qp1000.L6
- qp1000.L6: point queries with 1000 insert/s per client
- Legend for results is here.
- Each entry lists the percentage of responses that fit in that bucket (slower than max time for previous bucket, faster than min time for next bucket).
Query response time histogram
256us	1ms	4ms	16ms	64ms	256ms	1s	4s	16s	gt	max	tag
98.799	1.201	nonzero	0.000	0.000	0.000	0.000	0.000	0.000	0.000	0.003	pg140_o2nofp.cx10a_c8r32
98.400	1.600	nonzero	0.000	0.000	0.000	0.000	0.000	0.000	0.000	0.002	pg1418_o2nofp.cx10a_c8r32
98.365	1.635	nonzero	0.000	nonzero	0.000	0.000	0.000	0.000	0.000	0.040	pg150_o2nofp.cx10a_c8r32
98.286	1.714	nonzero	0.000	0.000	0.000	0.000	0.000	0.000	0.000	0.002	pg1513_o2nofp.cx10a_c8r32
98.277	1.723	nonzero	0.000	0.000	0.000	0.000	0.000	0.000	0.000	0.002	pg160_o2nofp.cx10a_c8r32
98.186	1.814	nonzero	0.000	nonzero	0.000	0.000	0.000	0.000	0.000	0.033	pg169_o2nofp.cx10a_c8r32
98.034	1.966	nonzero	0.000	0.000	0.000	0.000	0.000	0.000	0.000	0.002	pg170_o2nofp.cx10a_c8r32
97.914	2.086	nonzero	0.000	0.000	0.000	0.000	0.000	0.000	0.000	0.001	pg175_o2nofp.cx10a_c8r32
98.214	1.786	nonzero	0.000	0.000	0.000	0.000	0.000	0.000	0.000	0.002	pg18beta1_o2nofp.cx10b_c8r32
98.057	1.943	nonzero	0.000	0.000	0.000	0.000	0.000	0.000	0.000	0.002	pg18beta1_o2nofp.cx10c_c8r32
98.041	1.959	nonzero	0.000	0.000	0.000	0.000	0.000	0.000	0.000	0.002	pg18beta1_o2nofp.cx10d_c8r32
Insert response time histogram
256us	1ms	4ms	16ms	64ms	256ms	1s	4s	16s	gt	max	tag
0.000	39.736	60.250	0.011	0.003	0.000	0.000	0.000	0.000	0.000	0.025	pg140_o2nofp.cx10a_c8r32
0.000	31.050	68.939	0.006	0.006	0.000	0.000	0.000	0.000	0.000	0.020	pg1418_o2nofp.cx10a_c8r32
0.000	41.806	58.183	0.006	0.006	0.000	0.000	0.000	0.000	0.000	0.022	pg150_o2nofp.cx10a_c8r32
0.000	43.086	56.900	0.011	0.003	0.000	0.000	0.000	0.000	0.000	0.021	pg1513_o2nofp.cx10a_c8r32
0.000	38.419	61.569	0.003	0.008	0.000	0.000	0.000	0.000	0.000	0.027	pg160_o2nofp.cx10a_c8r32
0.000	45.089	54.900	0.006	0.006	0.000	0.000	0.000	0.000	0.000	0.025	pg169_o2nofp.cx10a_c8r32
0.000	43.850	56.139	0.011	0.000	0.000	0.000	0.000	0.000	0.000	0.015	pg170_o2nofp.cx10a_c8r32
0.000	40.986	59.003	0.006	0.006	0.000	0.000	0.000	0.000	0.000	0.026	pg175_o2nofp.cx10a_c8r32
0.000	36.233	63.756	0.011	0.000	0.000	0.000	0.000	0.000	0.000	0.009	pg18beta1_o2nofp.cx10b_c8r32
0.000	38.386	61.606	0.008	0.000	0.000	0.000	0.000	0.000	0.000	0.008	pg18beta1_o2nofp.cx10c_c8r32
0.000	33.478	66.508	0.014	0.000	0.000	0.000	0.000	0.000	0.000	0.009	pg18beta1_o2nofp.cx10d_c8r32
Delete response time histogram
256us	1ms	4ms	16ms	64ms	256ms	1s	4s	16s	gt	max	tag
0.000	30.133	69.642	0.222	0.003	0.000	0.000	0.000	0.000	0.000	0.022	pg140_o2nofp.cx10a_c8r32
0.000	28.850	70.978	0.167	0.006	0.000	0.000	0.000	0.000	0.000	0.018	pg1418_o2nofp.cx10a_c8r32
0.000	28.406	71.400	0.189	0.006	0.000	0.000	0.000	0.000	0.000	0.020	pg150_o2nofp.cx10a_c8r32
0.000	31.047	68.767	0.183	0.003	0.000	0.000	0.000	0.000	0.000	0.020	pg1513_o2nofp.cx10a_c8r32
0.000	31.175	68.542	0.275	0.008	0.000	0.000	0.000	0.000	0.000	0.025	pg160_o2nofp.cx10a_c8r32
0.000	34.597	54.603	10.794	0.006	0.000	0.000	0.000	0.000	0.000	0.023	pg169_o2nofp.cx10a_c8r32
0.000	25.944	73.456	0.600	0.000	0.000	0.000	0.000	0.000	0.000	0.013	pg170_o2nofp.cx10a_c8r32
0.000	28.578	70.817	0.600	0.006	0.000	0.000	0.000	0.000	0.000	0.023	pg175_o2nofp.cx10a_c8r32
0.000	18.167	81.297	0.536	0.000	0.000	0.000	0.000	0.000	0.000	0.005	pg18beta1_o2nofp.cx10b_c8r32
0.000	16.631	82.753	0.617	0.000	0.000	0.000	0.000	0.000	0.000	0.005	pg18beta1_o2nofp.cx10c_c8r32
0.000	19.450	80.044	0.506	0.000	0.000	0.000	0.000	0.000	0.000	0.005	pg18beta1_o2nofp.cx10d_c8r32