Introduction
This is a report for the insert benchmark with 20M docs and 1 client(s). It is generated by scripts (bash, awk, sed) and Tufte might not be impressed. An overview of the insert benchmark is here and a short update is here. Below, by DBMS, I mean DBMS+version.config. An example is my8020.c10b40 where my means MySQL, 8020 is version 8.0.20 and c10b40 is the name for the configuration file.
The test server has 8 AMD cores, 32G RAM and an NVMe SSD. It is described here as the PN53. The benchmark was run with 1 client and there were 1 or 3 connections per client (1 for queries or inserts without rate limits, 1+1 for rate limited inserts+deletes). It uses 1 table. It loads 20M rows per table without secondary indexes, creates 3 secondary indexes per table, then inserts 40m+10m rows per table with a delete per insert to avoid growing the table. It then does 6 read+write tests for 1800s each that do queries as fast as possible with 100,100,500,500,1000,1000 inserts/s and the same for deletes/s per client concurrent with the queries. The database is cached by Postgres. Clients and the DBMS share one server. The per-database configs are in the per-database subdirectories here.
The tested DBMS are:
- pg175_o2nofp.cx10a_c8r32 - Postgres 17.5 with the cx10a_c8r32 config
- pg18beta1_o2nofp.cx10b_c8r32 - Postgres 18 beta1 with the cx10b_c8r32 config that uses io_method=sync
- pg18beta1_o2nofp.cx10c_c8r32 - Postgres 18 beta1 with the cx10b_c8r32 config that uses io_method=worker and io_workers=16
- pg18beta1_o2nofp.cx10d_c8r32 - Postgres 18 beta1 with the cx10b_c8r32 config that uses io_method=io_uring
Contents
- Summary
- l.i0: load without secondary indexes
- l.x: create secondary indexes
- l.i1: continue load after secondary indexes created with 50 inserts per transaction
- l.i2: continue load after secondary indexes created with 5 inserts per transaction
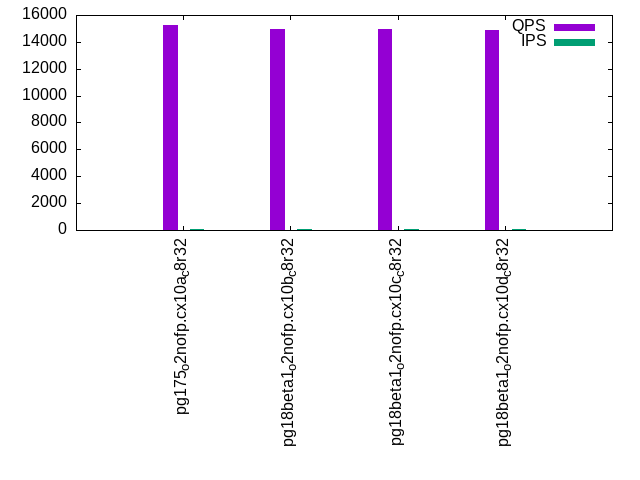
- qr100.L1: range queries with 100 insert/s per client
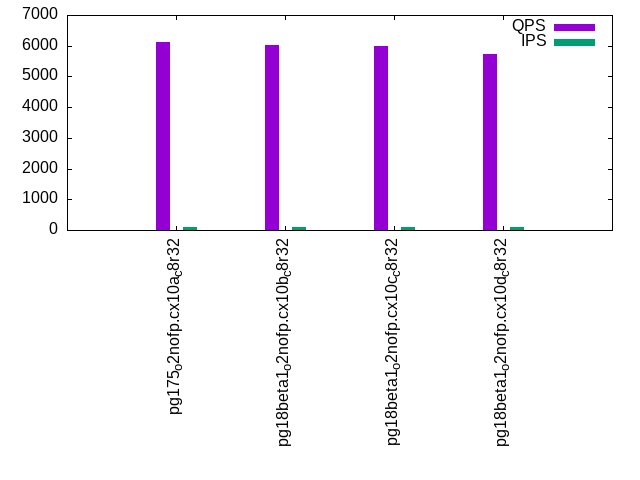
- qp100.L2: point queries with 100 insert/s per client
- qr500.L3: range queries with 500 insert/s per client
- qp500.L4: point queries with 500 insert/s per client
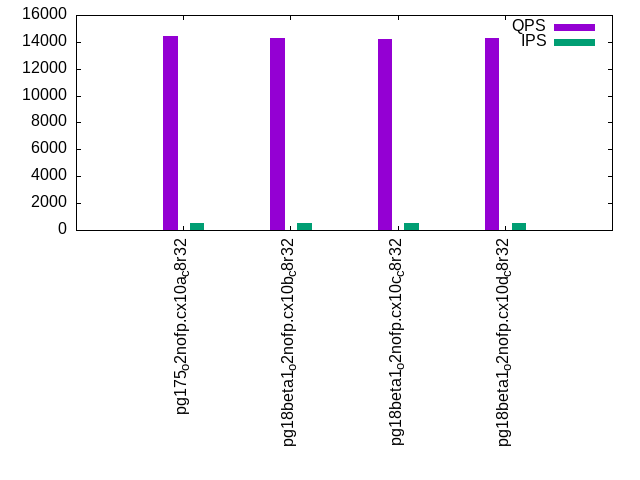
- qr1000.L5: range queries with 1000 insert/s per client
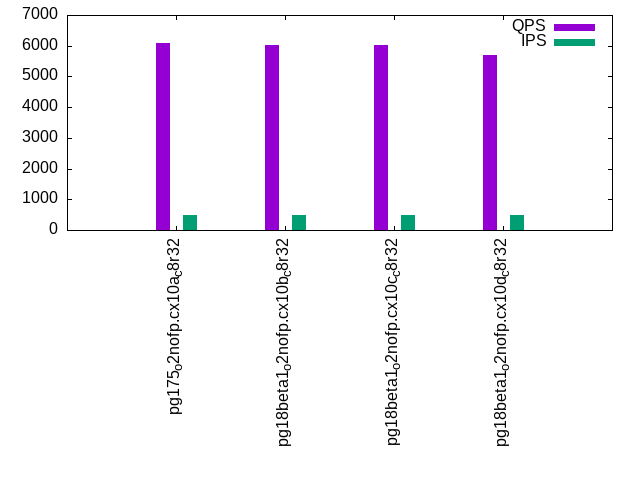
- qp1000.L6: point queries with 1000 insert/s per client
Summary
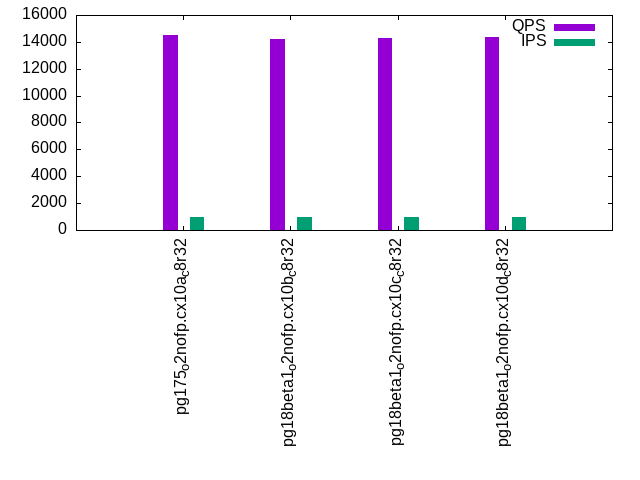
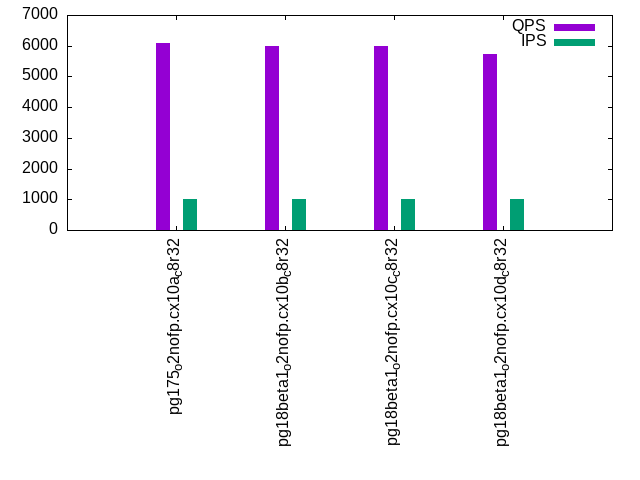
The numbers are inserts/s for l.i0, l.i1 and l.i2, indexed docs (or rows) /s for l.x and queries/s for qr100, qp100 thru qr1000, qp1000" The values are the average rate over the entire test for inserts (IPS) and queries (QPS). The range of values for IPS and QPS is split into 3 parts: bottom 25%, middle 50%, top 25%. Values in the bottom 25% have a red background, values in the top 25% have a green background and values in the middle have no color. A gray background is used for values that can be ignored because the DBMS did not sustain the target insert rate. Red backgrounds are not used when the minimum value is within 80% of the max value.
| dbms | l.i0 | l.x | l.i1 | l.i2 | qr100 | qp100 | qr500 | qp500 | qr1000 | qp1000 |
|---|---|---|---|---|---|---|---|---|---|---|
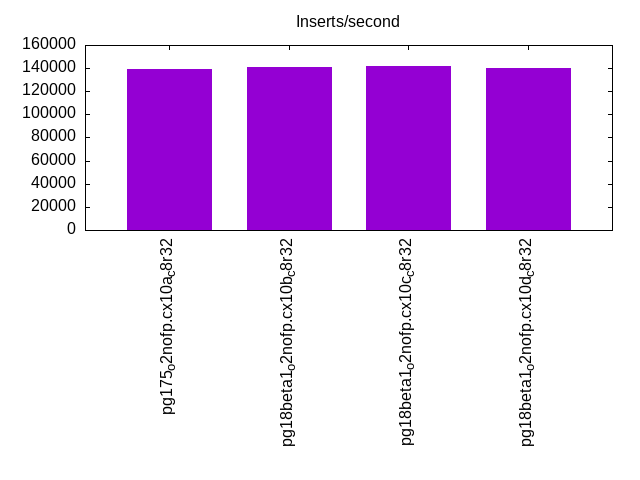
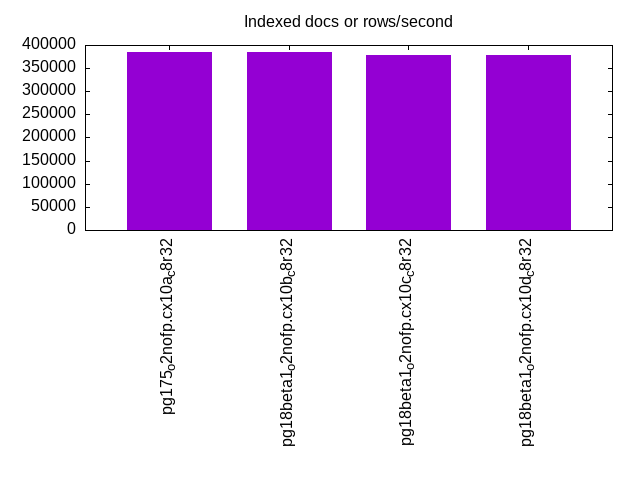
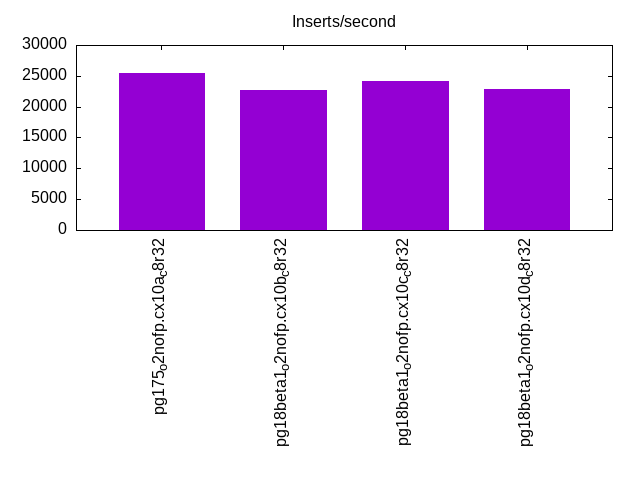
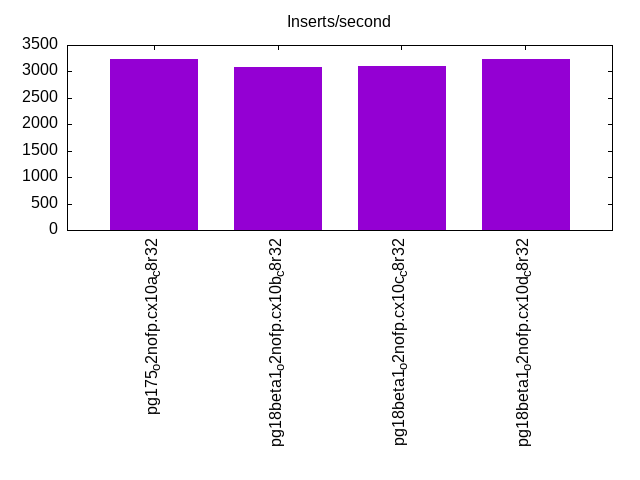
| pg175_o2nofp.cx10a_c8r32 | 138889 | 384617 | 25413 | 3229 | 15276 | 6135 | 14429 | 6089 | 14499 | 6082 |
| pg18beta1_o2nofp.cx10b_c8r32 | 140845 | 384617 | 22688 | 3089 | 14983 | 6020 | 14276 | 6013 | 14191 | 6003 |
| pg18beta1_o2nofp.cx10c_c8r32 | 141844 | 377360 | 24184 | 3109 | 14966 | 5994 | 14236 | 6011 | 14277 | 5985 |
| pg18beta1_o2nofp.cx10d_c8r32 | 139860 | 377360 | 22792 | 3233 | 14865 | 5734 | 14316 | 5710 | 14369 | 5731 |
This table has relative throughput, throughput for the DBMS relative to the DBMS in the first line, using the absolute throughput from the previous table. Values less than 0.95 have a yellow background. Values greater than 1.05 have a blue background.
| dbms | l.i0 | l.x | l.i1 | l.i2 | qr100 | qp100 | qr500 | qp500 | qr1000 | qp1000 |
|---|---|---|---|---|---|---|---|---|---|---|
| pg175_o2nofp.cx10a_c8r32 | 1.00 | 1.00 | 1.00 | 1.00 | 1.00 | 1.00 | 1.00 | 1.00 | 1.00 | 1.00 |
| pg18beta1_o2nofp.cx10b_c8r32 | 1.01 | 1.00 | 0.89 | 0.96 | 0.98 | 0.98 | 0.99 | 0.99 | 0.98 | 0.99 |
| pg18beta1_o2nofp.cx10c_c8r32 | 1.02 | 0.98 | 0.95 | 0.96 | 0.98 | 0.98 | 0.99 | 0.99 | 0.98 | 0.98 |
| pg18beta1_o2nofp.cx10d_c8r32 | 1.01 | 0.98 | 0.90 | 1.00 | 0.97 | 0.93 | 0.99 | 0.94 | 0.99 | 0.94 |
This lists the average rate of inserts/s for the tests that do inserts concurrent with queries. For such tests the query rate is listed in the table above. The read+write tests are setup so that the insert rate should match the target rate every second. Cells that are not at least 95% of the target have a red background to indicate a failure to satisfy the target.
| dbms | qr100.L1 | qp100.L2 | qr500.L3 | qp500.L4 | qr1000.L5 | qp1000.L6 |
|---|---|---|---|---|---|---|
| pg175_o2nofp.cx10a_c8r32 | 100 | 100 | 500 | 500 | 1000 | 999 |
| pg18beta1_o2nofp.cx10b_c8r32 | 100 | 100 | 500 | 500 | 1000 | 1000 |
| pg18beta1_o2nofp.cx10c_c8r32 | 100 | 100 | 500 | 500 | 999 | 999 |
| pg18beta1_o2nofp.cx10d_c8r32 | 100 | 100 | 500 | 500 | 999 | 999 |
| target | 100 | 100 | 500 | 500 | 1000 | 1000 |
l.i0
l.i0: load without secondary indexes. Graphs for performance per 1-second interval are here.
Average throughput:
Insert response time histogram: each cell has the percentage of responses that take <= the time in the header and max is the max response time in seconds. For the max column values in the top 25% of the range have a red background and in the bottom 25% of the range have a green background. The red background is not used when the min value is within 80% of the max value.
| dbms | 256us | 1ms | 4ms | 16ms | 64ms | 256ms | 1s | 4s | 16s | gt | max |
|---|---|---|---|---|---|---|---|---|---|---|---|
| pg175_o2nofp.cx10a_c8r32 | 99.982 | 0.018 | 0.003 | ||||||||
| pg18beta1_o2nofp.cx10b_c8r32 | 99.989 | 0.011 | 0.002 | ||||||||
| pg18beta1_o2nofp.cx10c_c8r32 | 99.984 | 0.017 | 0.002 | ||||||||
| pg18beta1_o2nofp.cx10d_c8r32 | 99.980 | 0.020 | 0.002 |
Performance metrics for the DBMS listed above. Some are normalized by throughput, others are not. Legend for results is here.
ips	qps	rps	rmbps	wps	wmbps	rpq	rkbpq	wpi	wkbpi	csps	cpups	cspq	cpupq	dbgb1	dbgb2	rss	maxop	p50	p99	tag
138889	0	0	0.0	524.3	59.4	0.000	0.000	0.004	0.438	14300	19.8	0.103	11	1.9	5.2	1.6	0.003	140680	132885	pg175_o2nofp.cx10a_c8r32
140845	0	0	0.0	526.6	59.7	0.000	0.000	0.004	0.434	14333	19.8	0.102	11	1.9	5.2	1.2	0.002	141075	133683	pg18beta1_o2nofp.cx10b_c8r32
141844	0	0	0.0	529.4	60.0	0.000	0.000	0.004	0.433	14363	19.9	0.101	11	1.9	5.2	1.6	0.002	141782	134184	pg18beta1_o2nofp.cx10c_c8r32
139860	0	0	0.0	524.6	59.5	0.000	0.000	0.004	0.435	14210	19.8	0.102	11	1.9	5.2	1.6	0.002	140983	133285	pg18beta1_o2nofp.cx10d_c8r32
l.x
l.x: create secondary indexes.
Average throughput:
Performance metrics for the DBMS listed above. Some are normalized by throughput, others are not. Legend for results is here.
ips	qps	rps	rmbps	wps	wmbps	rpq	rkbpq	wpi	wkbpi	csps	cpups	cspq	cpupq	dbgb1	dbgb2	rss	maxop	p50	p99	tag
384617	0	0	0.0	616.1	75.4	0.000	0.000	0.002	0.201	1997	11.7	0.005	2	3.9	8.9	2.1	0.002	NA	NA	pg175_o2nofp.cx10a_c8r32
384617	0	0	0.0	619.5	75.9	0.000	0.000	0.002	0.202	1954	11.7	0.005	2	3.9	8.9	2.1	0.002	NA	NA	pg18beta1_o2nofp.cx10b_c8r32
377360	0	0	0.0	605.8	74.1	0.000	0.000	0.002	0.201	1933	11.5	0.005	2	3.9	8.9	2.1	0.002	NA	NA	pg18beta1_o2nofp.cx10c_c8r32
377360	0	0	0.0	602.5	73.7	0.000	0.000	0.002	0.200	1928	11.5	0.005	2	3.9	8.9	2.1	0.002	NA	NA	pg18beta1_o2nofp.cx10d_c8r32
l.i1
l.i1: continue load after secondary indexes created with 50 inserts per transaction. Graphs for performance per 1-second interval are here.
Average throughput:
Insert response time histogram: each cell has the percentage of responses that take <= the time in the header and max is the max response time in seconds. For the max column values in the top 25% of the range have a red background and in the bottom 25% of the range have a green background. The red background is not used when the min value is within 80% of the max value.
| dbms | 256us | 1ms | 4ms | 16ms | 64ms | 256ms | 1s | 4s | 16s | gt | max |
|---|---|---|---|---|---|---|---|---|---|---|---|
| pg175_o2nofp.cx10a_c8r32 | 61.423 | 38.576 | nonzero | 0.001 | 0.030 | ||||||
| pg18beta1_o2nofp.cx10b_c8r32 | 55.584 | 44.411 | 0.004 | 0.001 | 0.059 | ||||||
| pg18beta1_o2nofp.cx10c_c8r32 | 52.173 | 47.818 | 0.002 | 0.008 | 0.050 | ||||||
| pg18beta1_o2nofp.cx10d_c8r32 | 54.231 | 45.767 | 0.001 | 0.001 | 0.028 |
Delete response time histogram: each cell has the percentage of responses that take <= the time in the header and max is the max response time in seconds. For the max column values in the top 25% of the range have a red background and in the bottom 25% of the range have a green background. The red background is not used when the min value is within 80% of the max value.
| dbms | 256us | 1ms | 4ms | 16ms | 64ms | 256ms | 1s | 4s | 16s | gt | max |
|---|---|---|---|---|---|---|---|---|---|---|---|
| pg175_o2nofp.cx10a_c8r32 | 27.450 | 61.732 | 10.817 | 0.001 | 0.030 | ||||||
| pg18beta1_o2nofp.cx10b_c8r32 | 26.747 | 56.502 | 16.750 | 0.001 | 0.027 | ||||||
| pg18beta1_o2nofp.cx10c_c8r32 | 27.270 | 69.559 | 3.165 | 0.006 | 0.049 | ||||||
| pg18beta1_o2nofp.cx10d_c8r32 | 27.140 | 56.922 | 15.937 | 0.001 | 0.030 |
Performance metrics for the DBMS listed above. Some are normalized by throughput, others are not. Legend for results is here.
ips	qps	rps	rmbps	wps	wmbps	rpq	rkbpq	wpi	wkbpi	csps	cpups	cspq	cpupq	dbgb1	dbgb2	rss	maxop	p50	p99	tag
25413	0	0	0.0	282.8	31.1	0.000	0.000	0.011	1.254	10500	22.1	0.413	70	5.3	32.0	5.3	0.030	22546	8448	pg175_o2nofp.cx10a_c8r32
22688	0	0	0.0	253.2	28.0	0.000	0.000	0.011	1.266	9423	21.4	0.415	75	5.4	32.0	4.2	0.059	15748	8849	pg18beta1_o2nofp.cx10b_c8r32
24184	0	0	0.0	272.0	30.1	0.000	0.000	0.011	1.273	10125	21.9	0.419	72	5.4	32.0	1.5	0.050	18447	9648	pg18beta1_o2nofp.cx10c_c8r32
22792	0	0	0.0	255.7	28.3	0.000	0.000	0.011	1.272	9502	21.5	0.417	75	5.4	32.1	4.8	0.028	15848	9098	pg18beta1_o2nofp.cx10d_c8r32
l.i2
l.i2: continue load after secondary indexes created with 5 inserts per transaction. Graphs for performance per 1-second interval are here.
Average throughput:
Insert response time histogram: each cell has the percentage of responses that take <= the time in the header and max is the max response time in seconds. For the max column values in the top 25% of the range have a red background and in the bottom 25% of the range have a green background. The red background is not used when the min value is within 80% of the max value.
| dbms | 256us | 1ms | 4ms | 16ms | 64ms | 256ms | 1s | 4s | 16s | gt | max |
|---|---|---|---|---|---|---|---|---|---|---|---|
| pg175_o2nofp.cx10a_c8r32 | 58.218 | 41.781 | nonzero | nonzero | nonzero | 0.036 | |||||
| pg18beta1_o2nofp.cx10b_c8r32 | 56.587 | 43.412 | nonzero | nonzero | nonzero | 0.032 | |||||
| pg18beta1_o2nofp.cx10c_c8r32 | 54.090 | 45.909 | nonzero | nonzero | 0.008 | ||||||
| pg18beta1_o2nofp.cx10d_c8r32 | 56.056 | 43.944 | nonzero | nonzero | 0.032 |
Delete response time histogram: each cell has the percentage of responses that take <= the time in the header and max is the max response time in seconds. For the max column values in the top 25% of the range have a red background and in the bottom 25% of the range have a green background. The red background is not used when the min value is within 80% of the max value.
| dbms | 256us | 1ms | 4ms | 16ms | 64ms | 256ms | 1s | 4s | 16s | gt | max |
|---|---|---|---|---|---|---|---|---|---|---|---|
| pg175_o2nofp.cx10a_c8r32 | 1.727 | 37.206 | 57.944 | 3.123 | nonzero | 0.026 | |||||
| pg18beta1_o2nofp.cx10b_c8r32 | 1.575 | 37.725 | 58.990 | 1.710 | nonzero | 0.033 | |||||
| pg18beta1_o2nofp.cx10c_c8r32 | 1.573 | 38.725 | 58.182 | 1.520 | 0.014 | ||||||
| pg18beta1_o2nofp.cx10d_c8r32 | 1.599 | 38.993 | 58.683 | 0.724 | nonzero | 0.032 |
Performance metrics for the DBMS listed above. Some are normalized by throughput, others are not. Legend for results is here.
ips	qps	rps	rmbps	wps	wmbps	rpq	rkbpq	wpi	wkbpi	csps	cpups	cspq	cpupq	dbgb1	dbgb2	rss	maxop	p50	p99	tag
3229	0	0	0.0	55.3	5.5	0.000	0.000	0.017	1.745	12479	15.9	3.865	394	5.4	34.7	5.1	0.036	2375	1020	pg175_o2nofp.cx10a_c8r32
3089	0	0	0.0	53.5	5.2	0.000	0.000	0.017	1.724	11917	15.9	3.858	412	5.4	34.3	0.3	0.032	2110	1100	pg18beta1_o2nofp.cx10b_c8r32
3109	0	0	0.0	54.2	5.3	0.000	0.000	0.017	1.749	12031	15.9	3.869	409	5.4	34.5	1.5	0.008	2180	1080	pg18beta1_o2nofp.cx10c_c8r32
3233	0	0	0.0	55.2	5.4	0.000	0.000	0.017	1.725	12494	16.0	3.865	396	5.4	34.4	0.8	0.032	2275	1200	pg18beta1_o2nofp.cx10d_c8r32
qr100.L1
qr100.L1: range queries with 100 insert/s per client. Graphs for performance per 1-second interval are here.
Average throughput:
Query response time histogram: each cell has the percentage of responses that take <= the time in the header and max is the max response time in seconds. For max values in the top 25% of the range have a red background and in the bottom 25% of the range have a green background. The red background is not used when the min value is within 80% of the max value.
| dbms | 256us | 1ms | 4ms | 16ms | 64ms | 256ms | 1s | 4s | 16s | gt | max |
|---|---|---|---|---|---|---|---|---|---|---|---|
| pg175_o2nofp.cx10a_c8r32 | 99.998 | 0.002 | 0.001 | ||||||||
| pg18beta1_o2nofp.cx10b_c8r32 | 99.998 | 0.002 | nonzero | 0.001 | |||||||
| pg18beta1_o2nofp.cx10c_c8r32 | 99.998 | 0.002 | 0.001 | ||||||||
| pg18beta1_o2nofp.cx10d_c8r32 | 99.998 | 0.002 | 0.001 |
Insert response time histogram: each cell has the percentage of responses that take <= the time in the header and max is the max response time in seconds. For max values in the top 25% of the range have a red background and in the bottom 25% of the range have a green background. The red background is not used when the min value is within 80% of the max value.
| dbms | 256us | 1ms | 4ms | 16ms | 64ms | 256ms | 1s | 4s | 16s | gt | max |
|---|---|---|---|---|---|---|---|---|---|---|---|
| pg175_o2nofp.cx10a_c8r32 | 0.194 | 99.778 | 0.028 | 0.006 | |||||||
| pg18beta1_o2nofp.cx10b_c8r32 | 0.528 | 99.417 | 0.056 | 0.006 | |||||||
| pg18beta1_o2nofp.cx10c_c8r32 | 2.472 | 97.472 | 0.056 | 0.006 | |||||||
| pg18beta1_o2nofp.cx10d_c8r32 | 0.667 | 99.306 | 0.028 | 0.006 |
Delete response time histogram: each cell has the percentage of responses that take <= the time in the header and max is the max response time in seconds. For max values in the top 25% of the range have a red background and in the bottom 25% of the range have a green background. The red background is not used when the min value is within 80% of the max value.
| dbms | 256us | 1ms | 4ms | 16ms | 64ms | 256ms | 1s | 4s | 16s | gt | max |
|---|---|---|---|---|---|---|---|---|---|---|---|
| pg175_o2nofp.cx10a_c8r32 | 52.250 | 47.750 | 0.002 | ||||||||
| pg18beta1_o2nofp.cx10b_c8r32 | 50.917 | 49.083 | 0.002 | ||||||||
| pg18beta1_o2nofp.cx10c_c8r32 | 54.194 | 45.806 | 0.002 | ||||||||
| pg18beta1_o2nofp.cx10d_c8r32 | 49.583 | 50.417 | 0.002 |
Performance metrics for the DBMS listed above. Some are normalized by throughput, others are not. Legend for results is here.
ips	qps	rps	rmbps	wps	wmbps	rpq	rkbpq	wpi	wkbpi	csps	cpups	cspq	cpupq	dbgb1	dbgb2	rss	maxop	p50	p99	tag
100	15276	0	0.0	10.5	0.6	0.000	0.000	0.105	6.258	58351	12.4	3.820	65	5.4	34.7	0.1	0.001	15262	15038	pg175_o2nofp.cx10a_c8r32
100	14983	0	0.0	10.6	0.6	0.000	0.000	0.106	6.294	57198	12.4	3.818	66	5.4	34.4	0.1	0.001	15005	14526	pg18beta1_o2nofp.cx10b_c8r32
100	14966	0	0.0	10.5	0.6	0.000	0.000	0.105	6.290	57134	12.4	3.818	66	5.4	34.5	0.2	0.001	15005	14558	pg18beta1_o2nofp.cx10c_c8r32
100	14865	0	0.0	10.5	0.6	0.000	0.000	0.105	6.295	56782	12.4	3.820	67	5.4	34.4	0.1	0.001	14894	14429	pg18beta1_o2nofp.cx10d_c8r32
qp100.L2
qp100.L2: point queries with 100 insert/s per client. Graphs for performance per 1-second interval are here.
Average throughput:
Query response time histogram: each cell has the percentage of responses that take <= the time in the header and max is the max response time in seconds. For max values in the top 25% of the range have a red background and in the bottom 25% of the range have a green background. The red background is not used when the min value is within 80% of the max value.
| dbms | 256us | 1ms | 4ms | 16ms | 64ms | 256ms | 1s | 4s | 16s | gt | max |
|---|---|---|---|---|---|---|---|---|---|---|---|
| pg175_o2nofp.cx10a_c8r32 | 98.083 | 1.917 | nonzero | 0.001 | |||||||
| pg18beta1_o2nofp.cx10b_c8r32 | 98.522 | 1.478 | nonzero | 0.001 | |||||||
| pg18beta1_o2nofp.cx10c_c8r32 | 98.161 | 1.839 | nonzero | 0.002 | |||||||
| pg18beta1_o2nofp.cx10d_c8r32 | 97.997 | 2.003 | nonzero | 0.001 |
Insert response time histogram: each cell has the percentage of responses that take <= the time in the header and max is the max response time in seconds. For max values in the top 25% of the range have a red background and in the bottom 25% of the range have a green background. The red background is not used when the min value is within 80% of the max value.
| dbms | 256us | 1ms | 4ms | 16ms | 64ms | 256ms | 1s | 4s | 16s | gt | max |
|---|---|---|---|---|---|---|---|---|---|---|---|
| pg175_o2nofp.cx10a_c8r32 | 99.944 | 0.056 | 0.005 | ||||||||
| pg18beta1_o2nofp.cx10b_c8r32 | 99.944 | 0.056 | 0.006 | ||||||||
| pg18beta1_o2nofp.cx10c_c8r32 | 99.722 | 0.278 | 0.010 | ||||||||
| pg18beta1_o2nofp.cx10d_c8r32 | 99.944 | 0.056 | 0.006 |
Delete response time histogram: each cell has the percentage of responses that take <= the time in the header and max is the max response time in seconds. For max values in the top 25% of the range have a red background and in the bottom 25% of the range have a green background. The red background is not used when the min value is within 80% of the max value.
| dbms | 256us | 1ms | 4ms | 16ms | 64ms | 256ms | 1s | 4s | 16s | gt | max |
|---|---|---|---|---|---|---|---|---|---|---|---|
| pg175_o2nofp.cx10a_c8r32 | 7.028 | 92.944 | 0.028 | 0.004 | |||||||
| pg18beta1_o2nofp.cx10b_c8r32 | 0.722 | 99.250 | 0.028 | 0.005 | |||||||
| pg18beta1_o2nofp.cx10c_c8r32 | 4.194 | 95.778 | 0.028 | 0.004 | |||||||
| pg18beta1_o2nofp.cx10d_c8r32 | 0.167 | 99.806 | 0.028 | 0.004 |
Performance metrics for the DBMS listed above. Some are normalized by throughput, others are not. Legend for results is here.
ips	qps	rps	rmbps	wps	wmbps	rpq	rkbpq	wpi	wkbpi	csps	cpups	cspq	cpupq	dbgb1	dbgb2	rss	maxop	p50	p99	tag
100	6135	0	0.0	39.4	1.4	0.000	0.000	0.394	14.108	25094	12.9	4.090	168	5.4	34.7	0.5	0.001	6175	5919	pg175_o2nofp.cx10a_c8r32
100	6020	0	0.0	39.4	1.4	0.000	0.000	0.394	14.116	24653	12.8	4.095	170	5.4	34.4	0.1	0.001	6015	5903	pg18beta1_o2nofp.cx10b_c8r32
100	5994	0	0.0	39.3	1.4	0.000	0.000	0.393	14.146	24540	12.7	4.094	169	5.4	34.5	0.1	0.002	5967	5903	pg18beta1_o2nofp.cx10c_c8r32
100	5734	0	0.0	39.5	1.4	0.000	0.000	0.396	14.137	23547	13.4	4.107	187	5.4	34.4	0.1	0.001	5711	5519	pg18beta1_o2nofp.cx10d_c8r32
qr500.L3
qr500.L3: range queries with 500 insert/s per client. Graphs for performance per 1-second interval are here.
Average throughput:
Query response time histogram: each cell has the percentage of responses that take <= the time in the header and max is the max response time in seconds. For max values in the top 25% of the range have a red background and in the bottom 25% of the range have a green background. The red background is not used when the min value is within 80% of the max value.
| dbms | 256us | 1ms | 4ms | 16ms | 64ms | 256ms | 1s | 4s | 16s | gt | max |
|---|---|---|---|---|---|---|---|---|---|---|---|
| pg175_o2nofp.cx10a_c8r32 | 99.997 | 0.003 | nonzero | 0.002 | |||||||
| pg18beta1_o2nofp.cx10b_c8r32 | 99.996 | 0.004 | nonzero | 0.002 | |||||||
| pg18beta1_o2nofp.cx10c_c8r32 | 99.996 | 0.004 | nonzero | nonzero | 0.031 | ||||||
| pg18beta1_o2nofp.cx10d_c8r32 | 99.996 | 0.004 | nonzero | 0.003 |
Insert response time histogram: each cell has the percentage of responses that take <= the time in the header and max is the max response time in seconds. For max values in the top 25% of the range have a red background and in the bottom 25% of the range have a green background. The red background is not used when the min value is within 80% of the max value.
| dbms | 256us | 1ms | 4ms | 16ms | 64ms | 256ms | 1s | 4s | 16s | gt | max |
|---|---|---|---|---|---|---|---|---|---|---|---|
| pg175_o2nofp.cx10a_c8r32 | 26.056 | 73.922 | 0.022 | 0.010 | |||||||
| pg18beta1_o2nofp.cx10b_c8r32 | 29.656 | 70.322 | 0.022 | 0.007 | |||||||
| pg18beta1_o2nofp.cx10c_c8r32 | 29.072 | 70.706 | 0.222 | 0.011 | |||||||
| pg18beta1_o2nofp.cx10d_c8r32 | 28.811 | 71.144 | 0.044 | 0.010 |
Delete response time histogram: each cell has the percentage of responses that take <= the time in the header and max is the max response time in seconds. For max values in the top 25% of the range have a red background and in the bottom 25% of the range have a green background. The red background is not used when the min value is within 80% of the max value.
| dbms | 256us | 1ms | 4ms | 16ms | 64ms | 256ms | 1s | 4s | 16s | gt | max |
|---|---|---|---|---|---|---|---|---|---|---|---|
| pg175_o2nofp.cx10a_c8r32 | 19.417 | 79.467 | 1.117 | 0.007 | |||||||
| pg18beta1_o2nofp.cx10b_c8r32 | 22.367 | 77.011 | 0.622 | 0.006 | |||||||
| pg18beta1_o2nofp.cx10c_c8r32 | 15.650 | 83.594 | 0.756 | 0.011 | |||||||
| pg18beta1_o2nofp.cx10d_c8r32 | 18.456 | 80.933 | 0.611 | 0.010 |
Performance metrics for the DBMS listed above. Some are normalized by throughput, others are not. Legend for results is here.
ips	qps	rps	rmbps	wps	wmbps	rpq	rkbpq	wpi	wkbpi	csps	cpups	cspq	cpupq	dbgb1	dbgb2	rss	maxop	p50	p99	tag
500	14429	0	0.0	49.5	1.8	0.000	0.000	0.099	3.678	55214	13.0	3.827	72	5.4	34.7	0.3	0.002	14382	13709	pg175_o2nofp.cx10a_c8r32
500	14276	0	0.0	49.5	1.8	0.000	0.000	0.099	3.689	54668	12.9	3.829	72	5.4	34.4	0.3	0.002	14254	13550	pg18beta1_o2nofp.cx10b_c8r32
500	14236	0	0.0	49.6	1.8	0.000	0.000	0.099	3.745	54486	13.0	3.827	73	5.4	34.5	0.3	0.031	14238	13550	pg18beta1_o2nofp.cx10c_c8r32
500	14316	0	0.0	49.6	1.8	0.000	0.000	0.099	3.695	54788	12.9	3.827	72	5.4	34.4	4.7	0.003	14318	13629	pg18beta1_o2nofp.cx10d_c8r32
qp500.L4
qp500.L4: point queries with 500 insert/s per client. Graphs for performance per 1-second interval are here.
Average throughput:
Query response time histogram: each cell has the percentage of responses that take <= the time in the header and max is the max response time in seconds. For max values in the top 25% of the range have a red background and in the bottom 25% of the range have a green background. The red background is not used when the min value is within 80% of the max value.
| dbms | 256us | 1ms | 4ms | 16ms | 64ms | 256ms | 1s | 4s | 16s | gt | max |
|---|---|---|---|---|---|---|---|---|---|---|---|
| pg175_o2nofp.cx10a_c8r32 | 98.123 | 1.877 | nonzero | 0.002 | |||||||
| pg18beta1_o2nofp.cx10b_c8r32 | 98.171 | 1.829 | nonzero | 0.002 | |||||||
| pg18beta1_o2nofp.cx10c_c8r32 | 98.004 | 1.996 | nonzero | 0.001 | |||||||
| pg18beta1_o2nofp.cx10d_c8r32 | 97.839 | 2.161 | nonzero | 0.002 |
Insert response time histogram: each cell has the percentage of responses that take <= the time in the header and max is the max response time in seconds. For max values in the top 25% of the range have a red background and in the bottom 25% of the range have a green background. The red background is not used when the min value is within 80% of the max value.
| dbms | 256us | 1ms | 4ms | 16ms | 64ms | 256ms | 1s | 4s | 16s | gt | max |
|---|---|---|---|---|---|---|---|---|---|---|---|
| pg175_o2nofp.cx10a_c8r32 | 10.622 | 89.239 | 0.139 | 0.010 | |||||||
| pg18beta1_o2nofp.cx10b_c8r32 | 15.678 | 84.294 | 0.028 | 0.010 | |||||||
| pg18beta1_o2nofp.cx10c_c8r32 | 15.822 | 84.161 | 0.011 | 0.006 | 0.021 | ||||||
| pg18beta1_o2nofp.cx10d_c8r32 | 13.567 | 86.306 | 0.128 | 0.013 |
Delete response time histogram: each cell has the percentage of responses that take <= the time in the header and max is the max response time in seconds. For max values in the top 25% of the range have a red background and in the bottom 25% of the range have a green background. The red background is not used when the min value is within 80% of the max value.
| dbms | 256us | 1ms | 4ms | 16ms | 64ms | 256ms | 1s | 4s | 16s | gt | max |
|---|---|---|---|---|---|---|---|---|---|---|---|
| pg175_o2nofp.cx10a_c8r32 | 17.572 | 81.078 | 1.350 | 0.010 | |||||||
| pg18beta1_o2nofp.cx10b_c8r32 | 16.906 | 82.217 | 0.878 | 0.005 | |||||||
| pg18beta1_o2nofp.cx10c_c8r32 | 17.500 | 81.672 | 0.822 | 0.006 | 0.019 | ||||||
| pg18beta1_o2nofp.cx10d_c8r32 | 17.178 | 82.028 | 0.794 | 0.011 |
Performance metrics for the DBMS listed above. Some are normalized by throughput, others are not. Legend for results is here.
ips	qps	rps	rmbps	wps	wmbps	rpq	rkbpq	wpi	wkbpi	csps	cpups	cspq	cpupq	dbgb1	dbgb2	rss	maxop	p50	p99	tag
500	6089	0	0.0	27.8	2.3	0.000	0.000	0.056	4.666	25024	13.5	4.110	177	5.5	34.1	0.3	0.002	6111	5919	pg175_o2nofp.cx10a_c8r32
500	6013	0	0.0	28.1	2.2	0.000	0.000	0.056	4.568	24729	13.5	4.113	180	5.4	34.0	0.2	0.002	5999	5903	pg18beta1_o2nofp.cx10b_c8r32
500	6011	0	0.0	28.2	2.2	0.000	0.000	0.056	4.570	24726	13.5	4.113	180	5.4	34.0	0.3	0.001	5999	5903	pg18beta1_o2nofp.cx10c_c8r32
500	5710	0	0.0	28.3	2.3	0.000	0.000	0.057	4.636	23555	13.5	4.126	189	5.5	34.1	0.3	0.002	5663	5519	pg18beta1_o2nofp.cx10d_c8r32
qr1000.L5
qr1000.L5: range queries with 1000 insert/s per client. Graphs for performance per 1-second interval are here.
Average throughput:
Query response time histogram: each cell has the percentage of responses that take <= the time in the header and max is the max response time in seconds. For max values in the top 25% of the range have a red background and in the bottom 25% of the range have a green background. The red background is not used when the min value is within 80% of the max value.
| dbms | 256us | 1ms | 4ms | 16ms | 64ms | 256ms | 1s | 4s | 16s | gt | max |
|---|---|---|---|---|---|---|---|---|---|---|---|
| pg175_o2nofp.cx10a_c8r32 | 99.996 | 0.004 | nonzero | 0.002 | |||||||
| pg18beta1_o2nofp.cx10b_c8r32 | 99.994 | 0.006 | nonzero | nonzero | 0.006 | ||||||
| pg18beta1_o2nofp.cx10c_c8r32 | 99.994 | 0.006 | nonzero | 0.003 | |||||||
| pg18beta1_o2nofp.cx10d_c8r32 | 99.994 | 0.006 | nonzero | 0.004 |
Insert response time histogram: each cell has the percentage of responses that take <= the time in the header and max is the max response time in seconds. For max values in the top 25% of the range have a red background and in the bottom 25% of the range have a green background. The red background is not used when the min value is within 80% of the max value.
| dbms | 256us | 1ms | 4ms | 16ms | 64ms | 256ms | 1s | 4s | 16s | gt | max |
|---|---|---|---|---|---|---|---|---|---|---|---|
| pg175_o2nofp.cx10a_c8r32 | 42.983 | 57.008 | 0.008 | 0.006 | |||||||
| pg18beta1_o2nofp.cx10b_c8r32 | 42.094 | 57.847 | 0.058 | 0.010 | |||||||
| pg18beta1_o2nofp.cx10c_c8r32 | 48.808 | 51.178 | 0.014 | 0.010 | |||||||
| pg18beta1_o2nofp.cx10d_c8r32 | 43.917 | 56.078 | 0.006 | 0.005 |
Delete response time histogram: each cell has the percentage of responses that take <= the time in the header and max is the max response time in seconds. For max values in the top 25% of the range have a red background and in the bottom 25% of the range have a green background. The red background is not used when the min value is within 80% of the max value.
| dbms | 256us | 1ms | 4ms | 16ms | 64ms | 256ms | 1s | 4s | 16s | gt | max |
|---|---|---|---|---|---|---|---|---|---|---|---|
| pg175_o2nofp.cx10a_c8r32 | 19.372 | 80.078 | 0.550 | 0.005 | |||||||
| pg18beta1_o2nofp.cx10b_c8r32 | 16.508 | 83.033 | 0.458 | 0.011 | |||||||
| pg18beta1_o2nofp.cx10c_c8r32 | 18.342 | 81.094 | 0.564 | 0.005 | |||||||
| pg18beta1_o2nofp.cx10d_c8r32 | 17.772 | 81.839 | 0.389 | 0.005 |
Performance metrics for the DBMS listed above. Some are normalized by throughput, others are not. Legend for results is here.
ips	qps	rps	rmbps	wps	wmbps	rpq	rkbpq	wpi	wkbpi	csps	cpups	cspq	cpupq	dbgb1	dbgb2	rss	maxop	p50	p99	tag
1000	14499	0	0.0	30.0	2.7	0.000	0.000	0.030	2.735	55663	13.4	3.839	74	5.5	32.4	0.3	0.002	14526	13789	pg175_o2nofp.cx10a_c8r32
1000	14191	0	0.0	33.8	2.7	0.000	0.000	0.034	2.714	54511	13.3	3.841	75	5.5	32.4	0.3	0.006	14190	13470	pg18beta1_o2nofp.cx10b_c8r32
999	14277	0	0.0	33.3	2.6	0.000	0.000	0.033	2.701	54848	13.3	3.842	75	5.5	32.4	0.3	0.003	14301	13566	pg18beta1_o2nofp.cx10c_c8r32
999	14369	0	0.0	33.4	2.6	0.000	0.000	0.033	2.708	55201	13.4	3.842	75	5.5	32.4	0.3	0.004	14382	13614	pg18beta1_o2nofp.cx10d_c8r32
qp1000.L6
qp1000.L6: point queries with 1000 insert/s per client. Graphs for performance per 1-second interval are here.
Average throughput:
Query response time histogram: each cell has the percentage of responses that take <= the time in the header and max is the max response time in seconds. For max values in the top 25% of the range have a red background and in the bottom 25% of the range have a green background. The red background is not used when the min value is within 80% of the max value.
| dbms | 256us | 1ms | 4ms | 16ms | 64ms | 256ms | 1s | 4s | 16s | gt | max |
|---|---|---|---|---|---|---|---|---|---|---|---|
| pg175_o2nofp.cx10a_c8r32 | 97.914 | 2.086 | nonzero | 0.001 | |||||||
| pg18beta1_o2nofp.cx10b_c8r32 | 98.214 | 1.786 | nonzero | 0.002 | |||||||
| pg18beta1_o2nofp.cx10c_c8r32 | 98.057 | 1.943 | nonzero | 0.002 | |||||||
| pg18beta1_o2nofp.cx10d_c8r32 | 98.041 | 1.959 | nonzero | 0.002 |
Insert response time histogram: each cell has the percentage of responses that take <= the time in the header and max is the max response time in seconds. For max values in the top 25% of the range have a red background and in the bottom 25% of the range have a green background. The red background is not used when the min value is within 80% of the max value.
| dbms | 256us | 1ms | 4ms | 16ms | 64ms | 256ms | 1s | 4s | 16s | gt | max |
|---|---|---|---|---|---|---|---|---|---|---|---|
| pg175_o2nofp.cx10a_c8r32 | 40.986 | 59.003 | 0.006 | 0.006 | 0.026 | ||||||
| pg18beta1_o2nofp.cx10b_c8r32 | 36.233 | 63.756 | 0.011 | 0.009 | |||||||
| pg18beta1_o2nofp.cx10c_c8r32 | 38.386 | 61.606 | 0.008 | 0.008 | |||||||
| pg18beta1_o2nofp.cx10d_c8r32 | 33.478 | 66.508 | 0.014 | 0.009 |
Delete response time histogram: each cell has the percentage of responses that take <= the time in the header and max is the max response time in seconds. For max values in the top 25% of the range have a red background and in the bottom 25% of the range have a green background. The red background is not used when the min value is within 80% of the max value.
| dbms | 256us | 1ms | 4ms | 16ms | 64ms | 256ms | 1s | 4s | 16s | gt | max |
|---|---|---|---|---|---|---|---|---|---|---|---|
| pg175_o2nofp.cx10a_c8r32 | 28.578 | 70.817 | 0.600 | 0.006 | 0.023 | ||||||
| pg18beta1_o2nofp.cx10b_c8r32 | 18.167 | 81.297 | 0.536 | 0.005 | |||||||
| pg18beta1_o2nofp.cx10c_c8r32 | 16.631 | 82.753 | 0.617 | 0.005 | |||||||
| pg18beta1_o2nofp.cx10d_c8r32 | 19.450 | 80.044 | 0.506 | 0.005 |
Performance metrics for the DBMS listed above. Some are normalized by throughput, others are not. Legend for results is here.
ips	qps	rps	rmbps	wps	wmbps	rpq	rkbpq	wpi	wkbpi	csps	cpups	cspq	cpupq	dbgb1	dbgb2	rss	maxop	p50	p99	tag
999	6082	0	0.0	29.8	2.7	0.000	0.000	0.030	2.744	25188	13.6	4.142	179	5.5	30.3	0.4	0.001	6111	5903	pg175_o2nofp.cx10a_c8r32
1000	6003	0	0.0	28.1	2.7	0.000	0.000	0.028	2.736	24862	13.6	4.141	181	5.5	30.2	0.3	0.002	5983	5887	pg18beta1_o2nofp.cx10b_c8r32
999	5985	0	0.0	28.1	2.7	0.000	0.000	0.028	2.731	24810	13.6	4.145	182	5.5	30.2	0.3	0.002	5967	5887	pg18beta1_o2nofp.cx10c_c8r32
999	5731	0	0.0	28.2	2.7	0.000	0.000	0.028	2.724	23830	14.1	4.158	197	5.5	30.2	0.3	0.002	5727	5503	pg18beta1_o2nofp.cx10d_c8r32
l.i0
l.i0: load without secondary indexes
Performance metrics for all DBMS, not just the ones listed above. Some are normalized by throughput, others are not. Legend for results is here.
ips	qps	rps	rmbps	wps	wmbps	rpq	rkbpq	wpi	wkbpi	csps	cpups	cspq	cpupq	dbgb1	dbgb2	rss	maxop	p50	p99	tag
138889	0	0	0.0	524.3	59.4	0.000	0.000	0.004	0.438	14300	19.8	0.103	11	1.9	5.2	1.6	0.003	140680	132885	pg175_o2nofp.cx10a_c8r32
140845	0	0	0.0	526.6	59.7	0.000	0.000	0.004	0.434	14333	19.8	0.102	11	1.9	5.2	1.2	0.002	141075	133683	pg18beta1_o2nofp.cx10b_c8r32
141844	0	0	0.0	529.4	60.0	0.000	0.000	0.004	0.433	14363	19.9	0.101	11	1.9	5.2	1.6	0.002	141782	134184	pg18beta1_o2nofp.cx10c_c8r32
139860	0	0	0.0	524.6	59.5	0.000	0.000	0.004	0.435	14210	19.8	0.102	11	1.9	5.2	1.6	0.002	140983	133285	pg18beta1_o2nofp.cx10d_c8r32
l.x
l.x: create secondary indexes
Performance metrics for all DBMS, not just the ones listed above. Some are normalized by throughput, others are not. Legend for results is here.
ips	qps	rps	rmbps	wps	wmbps	rpq	rkbpq	wpi	wkbpi	csps	cpups	cspq	cpupq	dbgb1	dbgb2	rss	maxop	p50	p99	tag
384617	0	0	0.0	616.1	75.4	0.000	0.000	0.002	0.201	1997	11.7	0.005	2	3.9	8.9	2.1	0.002	NA	NA	pg175_o2nofp.cx10a_c8r32
384617	0	0	0.0	619.5	75.9	0.000	0.000	0.002	0.202	1954	11.7	0.005	2	3.9	8.9	2.1	0.002	NA	NA	pg18beta1_o2nofp.cx10b_c8r32
377360	0	0	0.0	605.8	74.1	0.000	0.000	0.002	0.201	1933	11.5	0.005	2	3.9	8.9	2.1	0.002	NA	NA	pg18beta1_o2nofp.cx10c_c8r32
377360	0	0	0.0	602.5	73.7	0.000	0.000	0.002	0.200	1928	11.5	0.005	2	3.9	8.9	2.1	0.002	NA	NA	pg18beta1_o2nofp.cx10d_c8r32
l.i1
l.i1: continue load after secondary indexes created with 50 inserts per transaction
Performance metrics for all DBMS, not just the ones listed above. Some are normalized by throughput, others are not. Legend for results is here.
ips	qps	rps	rmbps	wps	wmbps	rpq	rkbpq	wpi	wkbpi	csps	cpups	cspq	cpupq	dbgb1	dbgb2	rss	maxop	p50	p99	tag
25413	0	0	0.0	282.8	31.1	0.000	0.000	0.011	1.254	10500	22.1	0.413	70	5.3	32.0	5.3	0.030	22546	8448	pg175_o2nofp.cx10a_c8r32
22688	0	0	0.0	253.2	28.0	0.000	0.000	0.011	1.266	9423	21.4	0.415	75	5.4	32.0	4.2	0.059	15748	8849	pg18beta1_o2nofp.cx10b_c8r32
24184	0	0	0.0	272.0	30.1	0.000	0.000	0.011	1.273	10125	21.9	0.419	72	5.4	32.0	1.5	0.050	18447	9648	pg18beta1_o2nofp.cx10c_c8r32
22792	0	0	0.0	255.7	28.3	0.000	0.000	0.011	1.272	9502	21.5	0.417	75	5.4	32.1	4.8	0.028	15848	9098	pg18beta1_o2nofp.cx10d_c8r32
l.i2
l.i2: continue load after secondary indexes created with 5 inserts per transaction
Performance metrics for all DBMS, not just the ones listed above. Some are normalized by throughput, others are not. Legend for results is here.
ips	qps	rps	rmbps	wps	wmbps	rpq	rkbpq	wpi	wkbpi	csps	cpups	cspq	cpupq	dbgb1	dbgb2	rss	maxop	p50	p99	tag
3229	0	0	0.0	55.3	5.5	0.000	0.000	0.017	1.745	12479	15.9	3.865	394	5.4	34.7	5.1	0.036	2375	1020	pg175_o2nofp.cx10a_c8r32
3089	0	0	0.0	53.5	5.2	0.000	0.000	0.017	1.724	11917	15.9	3.858	412	5.4	34.3	0.3	0.032	2110	1100	pg18beta1_o2nofp.cx10b_c8r32
3109	0	0	0.0	54.2	5.3	0.000	0.000	0.017	1.749	12031	15.9	3.869	409	5.4	34.5	1.5	0.008	2180	1080	pg18beta1_o2nofp.cx10c_c8r32
3233	0	0	0.0	55.2	5.4	0.000	0.000	0.017	1.725	12494	16.0	3.865	396	5.4	34.4	0.8	0.032	2275	1200	pg18beta1_o2nofp.cx10d_c8r32
qr100.L1
qr100.L1: range queries with 100 insert/s per client
Performance metrics for all DBMS, not just the ones listed above. Some are normalized by throughput, others are not. Legend for results is here.
ips	qps	rps	rmbps	wps	wmbps	rpq	rkbpq	wpi	wkbpi	csps	cpups	cspq	cpupq	dbgb1	dbgb2	rss	maxop	p50	p99	tag
100	15276	0	0.0	10.5	0.6	0.000	0.000	0.105	6.258	58351	12.4	3.820	65	5.4	34.7	0.1	0.001	15262	15038	pg175_o2nofp.cx10a_c8r32
100	14983	0	0.0	10.6	0.6	0.000	0.000	0.106	6.294	57198	12.4	3.818	66	5.4	34.4	0.1	0.001	15005	14526	pg18beta1_o2nofp.cx10b_c8r32
100	14966	0	0.0	10.5	0.6	0.000	0.000	0.105	6.290	57134	12.4	3.818	66	5.4	34.5	0.2	0.001	15005	14558	pg18beta1_o2nofp.cx10c_c8r32
100	14865	0	0.0	10.5	0.6	0.000	0.000	0.105	6.295	56782	12.4	3.820	67	5.4	34.4	0.1	0.001	14894	14429	pg18beta1_o2nofp.cx10d_c8r32
qp100.L2
qp100.L2: point queries with 100 insert/s per client
Performance metrics for all DBMS, not just the ones listed above. Some are normalized by throughput, others are not. Legend for results is here.
ips	qps	rps	rmbps	wps	wmbps	rpq	rkbpq	wpi	wkbpi	csps	cpups	cspq	cpupq	dbgb1	dbgb2	rss	maxop	p50	p99	tag
100	6135	0	0.0	39.4	1.4	0.000	0.000	0.394	14.108	25094	12.9	4.090	168	5.4	34.7	0.5	0.001	6175	5919	pg175_o2nofp.cx10a_c8r32
100	6020	0	0.0	39.4	1.4	0.000	0.000	0.394	14.116	24653	12.8	4.095	170	5.4	34.4	0.1	0.001	6015	5903	pg18beta1_o2nofp.cx10b_c8r32
100	5994	0	0.0	39.3	1.4	0.000	0.000	0.393	14.146	24540	12.7	4.094	169	5.4	34.5	0.1	0.002	5967	5903	pg18beta1_o2nofp.cx10c_c8r32
100	5734	0	0.0	39.5	1.4	0.000	0.000	0.396	14.137	23547	13.4	4.107	187	5.4	34.4	0.1	0.001	5711	5519	pg18beta1_o2nofp.cx10d_c8r32
qr500.L3
qr500.L3: range queries with 500 insert/s per client
Performance metrics for all DBMS, not just the ones listed above. Some are normalized by throughput, others are not. Legend for results is here.
ips	qps	rps	rmbps	wps	wmbps	rpq	rkbpq	wpi	wkbpi	csps	cpups	cspq	cpupq	dbgb1	dbgb2	rss	maxop	p50	p99	tag
500	14429	0	0.0	49.5	1.8	0.000	0.000	0.099	3.678	55214	13.0	3.827	72	5.4	34.7	0.3	0.002	14382	13709	pg175_o2nofp.cx10a_c8r32
500	14276	0	0.0	49.5	1.8	0.000	0.000	0.099	3.689	54668	12.9	3.829	72	5.4	34.4	0.3	0.002	14254	13550	pg18beta1_o2nofp.cx10b_c8r32
500	14236	0	0.0	49.6	1.8	0.000	0.000	0.099	3.745	54486	13.0	3.827	73	5.4	34.5	0.3	0.031	14238	13550	pg18beta1_o2nofp.cx10c_c8r32
500	14316	0	0.0	49.6	1.8	0.000	0.000	0.099	3.695	54788	12.9	3.827	72	5.4	34.4	4.7	0.003	14318	13629	pg18beta1_o2nofp.cx10d_c8r32
qp500.L4
qp500.L4: point queries with 500 insert/s per client
Performance metrics for all DBMS, not just the ones listed above. Some are normalized by throughput, others are not. Legend for results is here.
ips	qps	rps	rmbps	wps	wmbps	rpq	rkbpq	wpi	wkbpi	csps	cpups	cspq	cpupq	dbgb1	dbgb2	rss	maxop	p50	p99	tag
500	6089	0	0.0	27.8	2.3	0.000	0.000	0.056	4.666	25024	13.5	4.110	177	5.5	34.1	0.3	0.002	6111	5919	pg175_o2nofp.cx10a_c8r32
500	6013	0	0.0	28.1	2.2	0.000	0.000	0.056	4.568	24729	13.5	4.113	180	5.4	34.0	0.2	0.002	5999	5903	pg18beta1_o2nofp.cx10b_c8r32
500	6011	0	0.0	28.2	2.2	0.000	0.000	0.056	4.570	24726	13.5	4.113	180	5.4	34.0	0.3	0.001	5999	5903	pg18beta1_o2nofp.cx10c_c8r32
500	5710	0	0.0	28.3	2.3	0.000	0.000	0.057	4.636	23555	13.5	4.126	189	5.5	34.1	0.3	0.002	5663	5519	pg18beta1_o2nofp.cx10d_c8r32
qr1000.L5
qr1000.L5: range queries with 1000 insert/s per client
Performance metrics for all DBMS, not just the ones listed above. Some are normalized by throughput, others are not. Legend for results is here.
ips	qps	rps	rmbps	wps	wmbps	rpq	rkbpq	wpi	wkbpi	csps	cpups	cspq	cpupq	dbgb1	dbgb2	rss	maxop	p50	p99	tag
1000	14499	0	0.0	30.0	2.7	0.000	0.000	0.030	2.735	55663	13.4	3.839	74	5.5	32.4	0.3	0.002	14526	13789	pg175_o2nofp.cx10a_c8r32
1000	14191	0	0.0	33.8	2.7	0.000	0.000	0.034	2.714	54511	13.3	3.841	75	5.5	32.4	0.3	0.006	14190	13470	pg18beta1_o2nofp.cx10b_c8r32
999	14277	0	0.0	33.3	2.6	0.000	0.000	0.033	2.701	54848	13.3	3.842	75	5.5	32.4	0.3	0.003	14301	13566	pg18beta1_o2nofp.cx10c_c8r32
999	14369	0	0.0	33.4	2.6	0.000	0.000	0.033	2.708	55201	13.4	3.842	75	5.5	32.4	0.3	0.004	14382	13614	pg18beta1_o2nofp.cx10d_c8r32
qp1000.L6
qp1000.L6: point queries with 1000 insert/s per client
Performance metrics for all DBMS, not just the ones listed above. Some are normalized by throughput, others are not. Legend for results is here.
ips	qps	rps	rmbps	wps	wmbps	rpq	rkbpq	wpi	wkbpi	csps	cpups	cspq	cpupq	dbgb1	dbgb2	rss	maxop	p50	p99	tag
999	6082	0	0.0	29.8	2.7	0.000	0.000	0.030	2.744	25188	13.6	4.142	179	5.5	30.3	0.4	0.001	6111	5903	pg175_o2nofp.cx10a_c8r32
1000	6003	0	0.0	28.1	2.7	0.000	0.000	0.028	2.736	24862	13.6	4.141	181	5.5	30.2	0.3	0.002	5983	5887	pg18beta1_o2nofp.cx10b_c8r32
999	5985	0	0.0	28.1	2.7	0.000	0.000	0.028	2.731	24810	13.6	4.145	182	5.5	30.2	0.3	0.002	5967	5887	pg18beta1_o2nofp.cx10c_c8r32
999	5731	0	0.0	28.2	2.7	0.000	0.000	0.028	2.724	23830	14.1	4.158	197	5.5	30.2	0.3	0.002	5727	5503	pg18beta1_o2nofp.cx10d_c8r32
l.i0
- l.i0: load without secondary indexes
- Legend for results is here.
- Each entry lists the percentage of responses that fit in that bucket (slower than max time for previous bucket, faster than min time for next bucket).
Insert response time histogram
256us	1ms	4ms	16ms	64ms	256ms	1s	4s	16s	gt	max	tag
0.000	99.982	0.018	0.000	0.000	0.000	0.000	0.000	0.000	0.000	0.003	pg175_o2nofp.cx10a_c8r32
0.000	99.989	0.011	0.000	0.000	0.000	0.000	0.000	0.000	0.000	0.002	pg18beta1_o2nofp.cx10b_c8r32
0.000	99.984	0.017	0.000	0.000	0.000	0.000	0.000	0.000	0.000	0.002	pg18beta1_o2nofp.cx10c_c8r32
0.000	99.980	0.020	0.000	0.000	0.000	0.000	0.000	0.000	0.000	0.002	pg18beta1_o2nofp.cx10d_c8r32
l.x
- l.x: create secondary indexes
- Legend for results is here.
- Each entry lists the percentage of responses that fit in that bucket (slower than max time for previous bucket, faster than min time for next bucket).
TODO - determine whether there is data for create index response time
l.i1
- l.i1: continue load after secondary indexes created with 50 inserts per transaction
- Legend for results is here.
- Each entry lists the percentage of responses that fit in that bucket (slower than max time for previous bucket, faster than min time for next bucket).
Insert response time histogram
256us	1ms	4ms	16ms	64ms	256ms	1s	4s	16s	gt	max	tag
0.000	61.423	38.576	nonzero	0.001	0.000	0.000	0.000	0.000	0.000	0.030	pg175_o2nofp.cx10a_c8r32
0.000	55.584	44.411	0.004	0.001	0.000	0.000	0.000	0.000	0.000	0.059	pg18beta1_o2nofp.cx10b_c8r32
0.000	52.173	47.818	0.002	0.008	0.000	0.000	0.000	0.000	0.000	0.050	pg18beta1_o2nofp.cx10c_c8r32
0.000	54.231	45.767	0.001	0.001	0.000	0.000	0.000	0.000	0.000	0.028	pg18beta1_o2nofp.cx10d_c8r32
Delete response time histogram
256us	1ms	4ms	16ms	64ms	256ms	1s	4s	16s	gt	max	tag
0.000	27.450	61.732	10.817	0.001	0.000	0.000	0.000	0.000	0.000	0.030	pg175_o2nofp.cx10a_c8r32
0.000	26.747	56.502	16.750	0.001	0.000	0.000	0.000	0.000	0.000	0.027	pg18beta1_o2nofp.cx10b_c8r32
0.000	27.270	69.559	3.165	0.006	0.000	0.000	0.000	0.000	0.000	0.049	pg18beta1_o2nofp.cx10c_c8r32
0.000	27.140	56.922	15.937	0.001	0.000	0.000	0.000	0.000	0.000	0.030	pg18beta1_o2nofp.cx10d_c8r32
l.i2
- l.i2: continue load after secondary indexes created with 5 inserts per transaction
- Legend for results is here.
- Each entry lists the percentage of responses that fit in that bucket (slower than max time for previous bucket, faster than min time for next bucket).
Insert response time histogram
256us	1ms	4ms	16ms	64ms	256ms	1s	4s	16s	gt	max	tag
58.218	41.781	nonzero	nonzero	nonzero	0.000	0.000	0.000	0.000	0.000	0.036	pg175_o2nofp.cx10a_c8r32
56.587	43.412	nonzero	nonzero	nonzero	0.000	0.000	0.000	0.000	0.000	0.032	pg18beta1_o2nofp.cx10b_c8r32
54.090	45.909	nonzero	nonzero	0.000	0.000	0.000	0.000	0.000	0.000	0.008	pg18beta1_o2nofp.cx10c_c8r32
56.056	43.944	nonzero	0.000	nonzero	0.000	0.000	0.000	0.000	0.000	0.032	pg18beta1_o2nofp.cx10d_c8r32
Delete response time histogram
256us	1ms	4ms	16ms	64ms	256ms	1s	4s	16s	gt	max	tag
1.727	37.206	57.944	3.123	nonzero	0.000	0.000	0.000	0.000	0.000	0.026	pg175_o2nofp.cx10a_c8r32
1.575	37.725	58.990	1.710	nonzero	0.000	0.000	0.000	0.000	0.000	0.033	pg18beta1_o2nofp.cx10b_c8r32
1.573	38.725	58.182	1.520	0.000	0.000	0.000	0.000	0.000	0.000	0.014	pg18beta1_o2nofp.cx10c_c8r32
1.599	38.993	58.683	0.724	nonzero	0.000	0.000	0.000	0.000	0.000	0.032	pg18beta1_o2nofp.cx10d_c8r32
qr100.L1
- qr100.L1: range queries with 100 insert/s per client
- Legend for results is here.
- Each entry lists the percentage of responses that fit in that bucket (slower than max time for previous bucket, faster than min time for next bucket).
Query response time histogram
256us	1ms	4ms	16ms	64ms	256ms	1s	4s	16s	gt	max	tag
99.998	0.002	0.000	0.000	0.000	0.000	0.000	0.000	0.000	0.000	0.001	pg175_o2nofp.cx10a_c8r32
99.998	0.002	nonzero	0.000	0.000	0.000	0.000	0.000	0.000	0.000	0.001	pg18beta1_o2nofp.cx10b_c8r32
99.998	0.002	0.000	0.000	0.000	0.000	0.000	0.000	0.000	0.000	0.001	pg18beta1_o2nofp.cx10c_c8r32
99.998	0.002	0.000	0.000	0.000	0.000	0.000	0.000	0.000	0.000	0.001	pg18beta1_o2nofp.cx10d_c8r32
Insert response time histogram
256us	1ms	4ms	16ms	64ms	256ms	1s	4s	16s	gt	max	tag
0.000	0.194	99.778	0.028	0.000	0.000	0.000	0.000	0.000	0.000	0.006	pg175_o2nofp.cx10a_c8r32
0.000	0.528	99.417	0.056	0.000	0.000	0.000	0.000	0.000	0.000	0.006	pg18beta1_o2nofp.cx10b_c8r32
0.000	2.472	97.472	0.056	0.000	0.000	0.000	0.000	0.000	0.000	0.006	pg18beta1_o2nofp.cx10c_c8r32
0.000	0.667	99.306	0.028	0.000	0.000	0.000	0.000	0.000	0.000	0.006	pg18beta1_o2nofp.cx10d_c8r32
Delete response time histogram
256us	1ms	4ms	16ms	64ms	256ms	1s	4s	16s	gt	max	tag
0.000	52.250	47.750	0.000	0.000	0.000	0.000	0.000	0.000	0.000	0.002	pg175_o2nofp.cx10a_c8r32
0.000	50.917	49.083	0.000	0.000	0.000	0.000	0.000	0.000	0.000	0.002	pg18beta1_o2nofp.cx10b_c8r32
0.000	54.194	45.806	0.000	0.000	0.000	0.000	0.000	0.000	0.000	0.002	pg18beta1_o2nofp.cx10c_c8r32
0.000	49.583	50.417	0.000	0.000	0.000	0.000	0.000	0.000	0.000	0.002	pg18beta1_o2nofp.cx10d_c8r32
qp100.L2
- qp100.L2: point queries with 100 insert/s per client
- Legend for results is here.
- Each entry lists the percentage of responses that fit in that bucket (slower than max time for previous bucket, faster than min time for next bucket).
Query response time histogram
256us	1ms	4ms	16ms	64ms	256ms	1s	4s	16s	gt	max	tag
98.083	1.917	nonzero	0.000	0.000	0.000	0.000	0.000	0.000	0.000	0.001	pg175_o2nofp.cx10a_c8r32
98.522	1.478	nonzero	0.000	0.000	0.000	0.000	0.000	0.000	0.000	0.001	pg18beta1_o2nofp.cx10b_c8r32
98.161	1.839	nonzero	0.000	0.000	0.000	0.000	0.000	0.000	0.000	0.002	pg18beta1_o2nofp.cx10c_c8r32
97.997	2.003	nonzero	0.000	0.000	0.000	0.000	0.000	0.000	0.000	0.001	pg18beta1_o2nofp.cx10d_c8r32
Insert response time histogram
256us	1ms	4ms	16ms	64ms	256ms	1s	4s	16s	gt	max	tag
0.000	0.000	99.944	0.056	0.000	0.000	0.000	0.000	0.000	0.000	0.005	pg175_o2nofp.cx10a_c8r32
0.000	0.000	99.944	0.056	0.000	0.000	0.000	0.000	0.000	0.000	0.006	pg18beta1_o2nofp.cx10b_c8r32
0.000	0.000	99.722	0.278	0.000	0.000	0.000	0.000	0.000	0.000	0.010	pg18beta1_o2nofp.cx10c_c8r32
0.000	0.000	99.944	0.056	0.000	0.000	0.000	0.000	0.000	0.000	0.006	pg18beta1_o2nofp.cx10d_c8r32
Delete response time histogram
256us	1ms	4ms	16ms	64ms	256ms	1s	4s	16s	gt	max	tag
0.000	7.028	92.944	0.028	0.000	0.000	0.000	0.000	0.000	0.000	0.004	pg175_o2nofp.cx10a_c8r32
0.000	0.722	99.250	0.028	0.000	0.000	0.000	0.000	0.000	0.000	0.005	pg18beta1_o2nofp.cx10b_c8r32
0.000	4.194	95.778	0.028	0.000	0.000	0.000	0.000	0.000	0.000	0.004	pg18beta1_o2nofp.cx10c_c8r32
0.000	0.167	99.806	0.028	0.000	0.000	0.000	0.000	0.000	0.000	0.004	pg18beta1_o2nofp.cx10d_c8r32
qr500.L3
- qr500.L3: range queries with 500 insert/s per client
- Legend for results is here.
- Each entry lists the percentage of responses that fit in that bucket (slower than max time for previous bucket, faster than min time for next bucket).
Query response time histogram
256us	1ms	4ms	16ms	64ms	256ms	1s	4s	16s	gt	max	tag
99.997	0.003	nonzero	0.000	0.000	0.000	0.000	0.000	0.000	0.000	0.002	pg175_o2nofp.cx10a_c8r32
99.996	0.004	nonzero	0.000	0.000	0.000	0.000	0.000	0.000	0.000	0.002	pg18beta1_o2nofp.cx10b_c8r32
99.996	0.004	nonzero	0.000	nonzero	0.000	0.000	0.000	0.000	0.000	0.031	pg18beta1_o2nofp.cx10c_c8r32
99.996	0.004	nonzero	0.000	0.000	0.000	0.000	0.000	0.000	0.000	0.003	pg18beta1_o2nofp.cx10d_c8r32
Insert response time histogram
256us	1ms	4ms	16ms	64ms	256ms	1s	4s	16s	gt	max	tag
0.000	26.056	73.922	0.022	0.000	0.000	0.000	0.000	0.000	0.000	0.010	pg175_o2nofp.cx10a_c8r32
0.000	29.656	70.322	0.022	0.000	0.000	0.000	0.000	0.000	0.000	0.007	pg18beta1_o2nofp.cx10b_c8r32
0.000	29.072	70.706	0.222	0.000	0.000	0.000	0.000	0.000	0.000	0.011	pg18beta1_o2nofp.cx10c_c8r32
0.000	28.811	71.144	0.044	0.000	0.000	0.000	0.000	0.000	0.000	0.010	pg18beta1_o2nofp.cx10d_c8r32
Delete response time histogram
256us	1ms	4ms	16ms	64ms	256ms	1s	4s	16s	gt	max	tag
0.000	19.417	79.467	1.117	0.000	0.000	0.000	0.000	0.000	0.000	0.007	pg175_o2nofp.cx10a_c8r32
0.000	22.367	77.011	0.622	0.000	0.000	0.000	0.000	0.000	0.000	0.006	pg18beta1_o2nofp.cx10b_c8r32
0.000	15.650	83.594	0.756	0.000	0.000	0.000	0.000	0.000	0.000	0.011	pg18beta1_o2nofp.cx10c_c8r32
0.000	18.456	80.933	0.611	0.000	0.000	0.000	0.000	0.000	0.000	0.010	pg18beta1_o2nofp.cx10d_c8r32
qp500.L4
- qp500.L4: point queries with 500 insert/s per client
- Legend for results is here.
- Each entry lists the percentage of responses that fit in that bucket (slower than max time for previous bucket, faster than min time for next bucket).
Query response time histogram
256us	1ms	4ms	16ms	64ms	256ms	1s	4s	16s	gt	max	tag
98.123	1.877	nonzero	0.000	0.000	0.000	0.000	0.000	0.000	0.000	0.002	pg175_o2nofp.cx10a_c8r32
98.171	1.829	nonzero	0.000	0.000	0.000	0.000	0.000	0.000	0.000	0.002	pg18beta1_o2nofp.cx10b_c8r32
98.004	1.996	nonzero	0.000	0.000	0.000	0.000	0.000	0.000	0.000	0.001	pg18beta1_o2nofp.cx10c_c8r32
97.839	2.161	nonzero	0.000	0.000	0.000	0.000	0.000	0.000	0.000	0.002	pg18beta1_o2nofp.cx10d_c8r32
Insert response time histogram
256us	1ms	4ms	16ms	64ms	256ms	1s	4s	16s	gt	max	tag
0.000	10.622	89.239	0.139	0.000	0.000	0.000	0.000	0.000	0.000	0.010	pg175_o2nofp.cx10a_c8r32
0.000	15.678	84.294	0.028	0.000	0.000	0.000	0.000	0.000	0.000	0.010	pg18beta1_o2nofp.cx10b_c8r32
0.000	15.822	84.161	0.011	0.006	0.000	0.000	0.000	0.000	0.000	0.021	pg18beta1_o2nofp.cx10c_c8r32
0.000	13.567	86.306	0.128	0.000	0.000	0.000	0.000	0.000	0.000	0.013	pg18beta1_o2nofp.cx10d_c8r32
Delete response time histogram
256us	1ms	4ms	16ms	64ms	256ms	1s	4s	16s	gt	max	tag
0.000	17.572	81.078	1.350	0.000	0.000	0.000	0.000	0.000	0.000	0.010	pg175_o2nofp.cx10a_c8r32
0.000	16.906	82.217	0.878	0.000	0.000	0.000	0.000	0.000	0.000	0.005	pg18beta1_o2nofp.cx10b_c8r32
0.000	17.500	81.672	0.822	0.006	0.000	0.000	0.000	0.000	0.000	0.019	pg18beta1_o2nofp.cx10c_c8r32
0.000	17.178	82.028	0.794	0.000	0.000	0.000	0.000	0.000	0.000	0.011	pg18beta1_o2nofp.cx10d_c8r32
qr1000.L5
- qr1000.L5: range queries with 1000 insert/s per client
- Legend for results is here.
- Each entry lists the percentage of responses that fit in that bucket (slower than max time for previous bucket, faster than min time for next bucket).
Query response time histogram
256us	1ms	4ms	16ms	64ms	256ms	1s	4s	16s	gt	max	tag
99.996	0.004	nonzero	0.000	0.000	0.000	0.000	0.000	0.000	0.000	0.002	pg175_o2nofp.cx10a_c8r32
99.994	0.006	nonzero	nonzero	0.000	0.000	0.000	0.000	0.000	0.000	0.006	pg18beta1_o2nofp.cx10b_c8r32
99.994	0.006	nonzero	0.000	0.000	0.000	0.000	0.000	0.000	0.000	0.003	pg18beta1_o2nofp.cx10c_c8r32
99.994	0.006	nonzero	0.000	0.000	0.000	0.000	0.000	0.000	0.000	0.004	pg18beta1_o2nofp.cx10d_c8r32
Insert response time histogram
256us	1ms	4ms	16ms	64ms	256ms	1s	4s	16s	gt	max	tag
0.000	42.983	57.008	0.008	0.000	0.000	0.000	0.000	0.000	0.000	0.006	pg175_o2nofp.cx10a_c8r32
0.000	42.094	57.847	0.058	0.000	0.000	0.000	0.000	0.000	0.000	0.010	pg18beta1_o2nofp.cx10b_c8r32
0.000	48.808	51.178	0.014	0.000	0.000	0.000	0.000	0.000	0.000	0.010	pg18beta1_o2nofp.cx10c_c8r32
0.000	43.917	56.078	0.006	0.000	0.000	0.000	0.000	0.000	0.000	0.005	pg18beta1_o2nofp.cx10d_c8r32
Delete response time histogram
256us	1ms	4ms	16ms	64ms	256ms	1s	4s	16s	gt	max	tag
0.000	19.372	80.078	0.550	0.000	0.000	0.000	0.000	0.000	0.000	0.005	pg175_o2nofp.cx10a_c8r32
0.000	16.508	83.033	0.458	0.000	0.000	0.000	0.000	0.000	0.000	0.011	pg18beta1_o2nofp.cx10b_c8r32
0.000	18.342	81.094	0.564	0.000	0.000	0.000	0.000	0.000	0.000	0.005	pg18beta1_o2nofp.cx10c_c8r32
0.000	17.772	81.839	0.389	0.000	0.000	0.000	0.000	0.000	0.000	0.005	pg18beta1_o2nofp.cx10d_c8r32
qp1000.L6
- qp1000.L6: point queries with 1000 insert/s per client
- Legend for results is here.
- Each entry lists the percentage of responses that fit in that bucket (slower than max time for previous bucket, faster than min time for next bucket).
Query response time histogram
256us	1ms	4ms	16ms	64ms	256ms	1s	4s	16s	gt	max	tag
97.914	2.086	nonzero	0.000	0.000	0.000	0.000	0.000	0.000	0.000	0.001	pg175_o2nofp.cx10a_c8r32
98.214	1.786	nonzero	0.000	0.000	0.000	0.000	0.000	0.000	0.000	0.002	pg18beta1_o2nofp.cx10b_c8r32
98.057	1.943	nonzero	0.000	0.000	0.000	0.000	0.000	0.000	0.000	0.002	pg18beta1_o2nofp.cx10c_c8r32
98.041	1.959	nonzero	0.000	0.000	0.000	0.000	0.000	0.000	0.000	0.002	pg18beta1_o2nofp.cx10d_c8r32
Insert response time histogram
256us	1ms	4ms	16ms	64ms	256ms	1s	4s	16s	gt	max	tag
0.000	40.986	59.003	0.006	0.006	0.000	0.000	0.000	0.000	0.000	0.026	pg175_o2nofp.cx10a_c8r32
0.000	36.233	63.756	0.011	0.000	0.000	0.000	0.000	0.000	0.000	0.009	pg18beta1_o2nofp.cx10b_c8r32
0.000	38.386	61.606	0.008	0.000	0.000	0.000	0.000	0.000	0.000	0.008	pg18beta1_o2nofp.cx10c_c8r32
0.000	33.478	66.508	0.014	0.000	0.000	0.000	0.000	0.000	0.000	0.009	pg18beta1_o2nofp.cx10d_c8r32
Delete response time histogram
256us	1ms	4ms	16ms	64ms	256ms	1s	4s	16s	gt	max	tag
0.000	28.578	70.817	0.600	0.006	0.000	0.000	0.000	0.000	0.000	0.023	pg175_o2nofp.cx10a_c8r32
0.000	18.167	81.297	0.536	0.000	0.000	0.000	0.000	0.000	0.000	0.005	pg18beta1_o2nofp.cx10b_c8r32
0.000	16.631	82.753	0.617	0.000	0.000	0.000	0.000	0.000	0.000	0.005	pg18beta1_o2nofp.cx10c_c8r32
0.000	19.450	80.044	0.506	0.000	0.000	0.000	0.000	0.000	0.000	0.005	pg18beta1_o2nofp.cx10d_c8r32