Introduction
This is a report for the insert benchmark with 4000M docs and 20 client(s). It is generated by scripts (bash, awk, sed) and Tufte might not be impressed. An overview of the insert benchmark is here and a short update is here. Below, by DBMS, I mean DBMS+version.config. An example is my8020.c10b40 where my means MySQL, 8020 is version 8.0.20 and c10b40 is the name for the configuration file.
The test server is an ax162-s from Hetzner (see here) with 48 cores, AMD SMT disabled, 128G RAM and ext4 using 2 NVMe devices with SW RAID 1. The benchmark was run with 20 clients and there were 1 or 3 connections per client (1 for queries or inserts without rate limits, 1+1 for rate limited inserts+deletes). It uses 8 tables with a table per client. It loads 200M rows per table without secondary indexes, creates 3 secondary indexes per table, then inserts 4m+1m rows per table with a delete per insert to avoid growing the table. It then does 6 read+write tests for 1800s each that do queries as fast as possible with 100,100,500,500,1000,1000 inserts/s and the same for deletes/s per client concurrent with the queries. The database is larger than memory. Clients and the DBMS share one server.
The tested DBMS are:
- my8041_rel_o2nofp.cz11a_c32r128 - MySQL 8.0.41, InnoDB, cz11a_c32r128 config, the base config
- my8041_rel_o2nofp.cz11e_c32r128 - MySQL 8.0.41, InnoDB, cz11e_c32r128 config, adds innodb_doublewrite_pages=128
- my8041_rel_o2nofp.cz11f_c32r128 - MySQL 8.0.41, InnoDB, cz11f_c32r128 config, adds innodb_doublewrite=0
Contents
- Summary
- l.i0: load without secondary indexes
- l.x: create secondary indexes
- l.i1: continue load after secondary indexes created with 50 inserts per transaction
- l.i2: continue load after secondary indexes created with 5 inserts per transaction
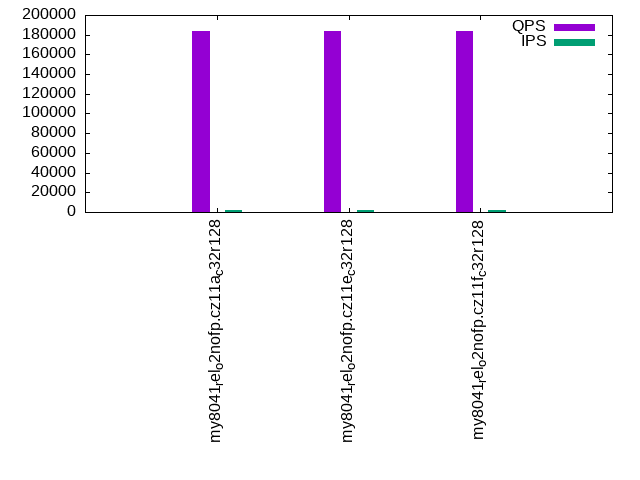
- qr100.L1: range queries with 100 insert/s per client
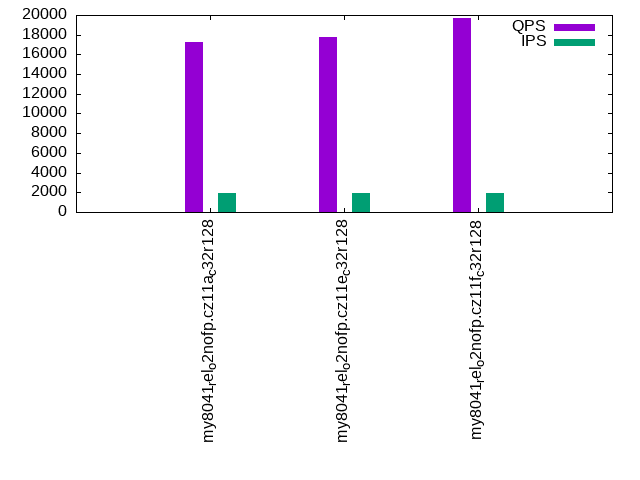
- qp100.L2: point queries with 100 insert/s per client
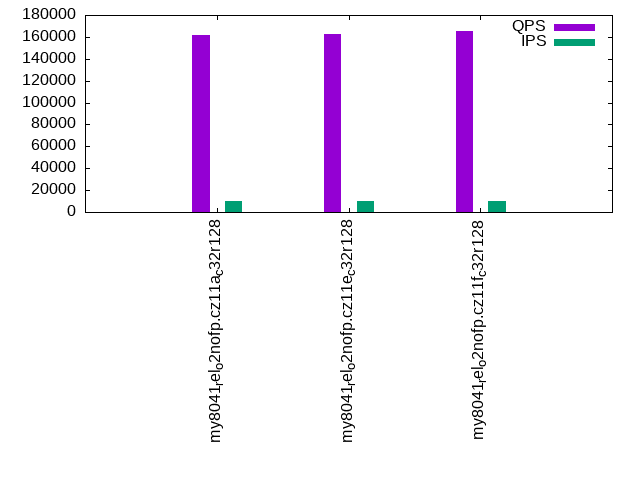
- qr500.L3: range queries with 500 insert/s per client
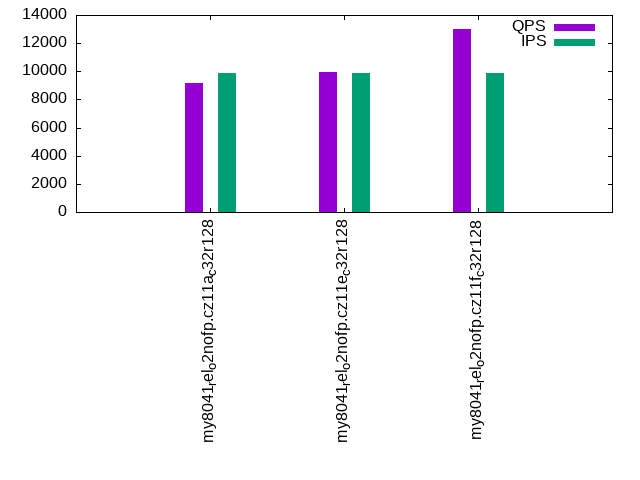
- qp500.L4: point queries with 500 insert/s per client
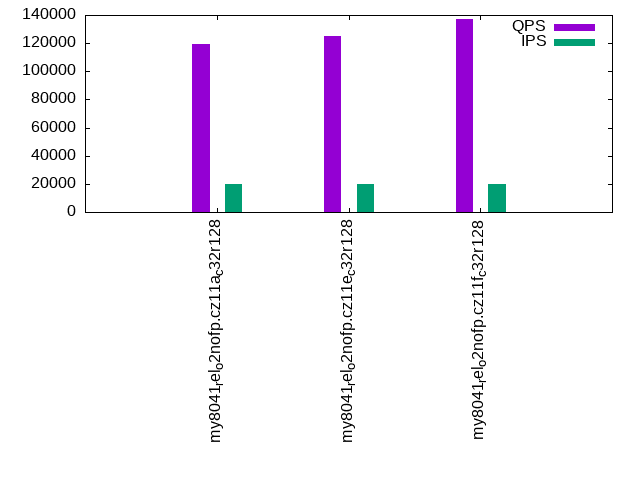
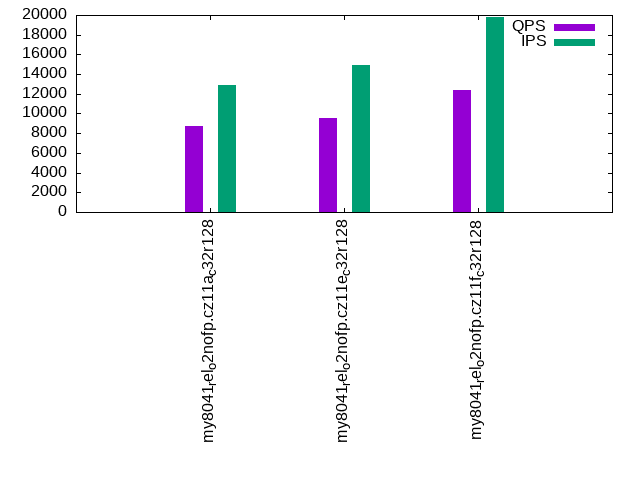
- qr1000.L5: range queries with 1000 insert/s per client
- qp1000.L6: point queries with 1000 insert/s per client
Summary
The numbers are inserts/s for l.i0, l.i1 and l.i2, indexed docs (or rows) /s for l.x and queries/s for qr100, qp100 thru qr1000, qp1000" The values are the average rate over the entire test for inserts (IPS) and queries (QPS). The range of values for IPS and QPS is split into 3 parts: bottom 25%, middle 50%, top 25%. Values in the bottom 25% have a red background, values in the top 25% have a green background and values in the middle have no color. A gray background is used for values that can be ignored because the DBMS did not sustain the target insert rate. Red backgrounds are not used when the minimum value is within 80% of the max value.
| dbms | l.i0 | l.x | l.i1 | l.i2 | qr100 | qp100 | qr500 | qp500 | qr1000 | qp1000 |
|---|---|---|---|---|---|---|---|---|---|---|
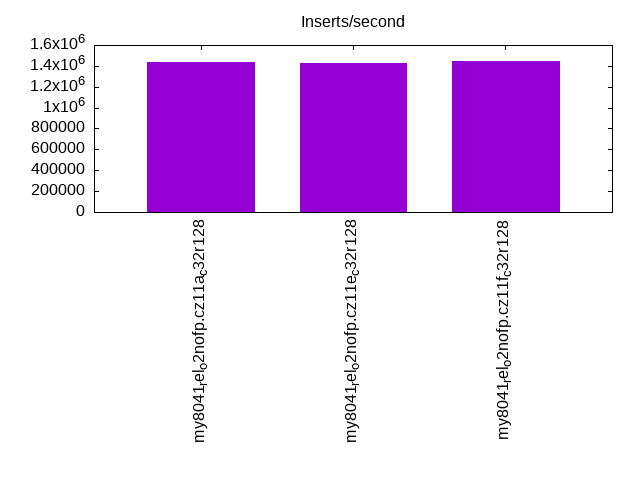
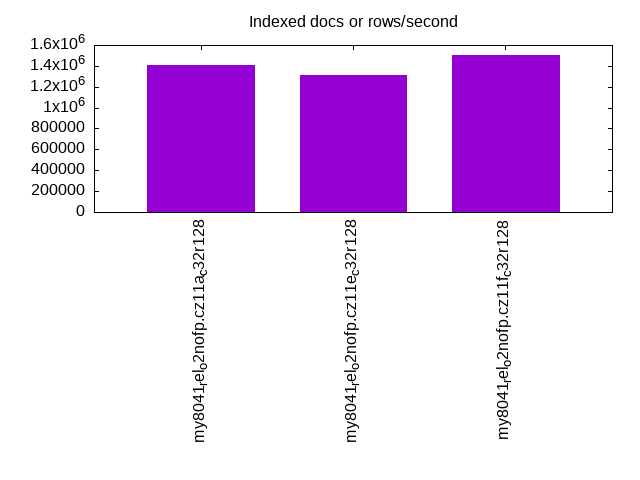
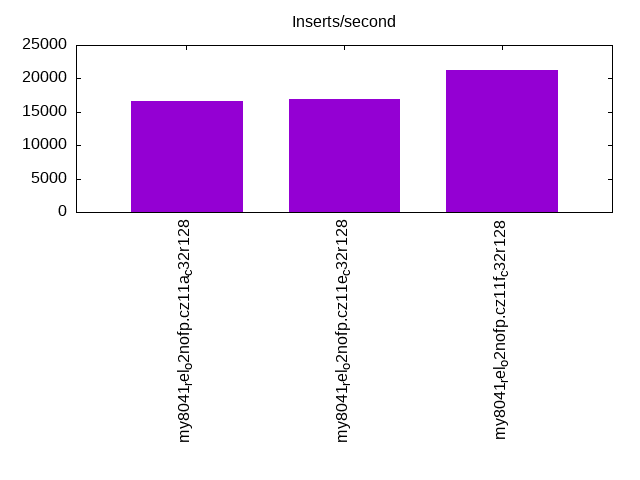
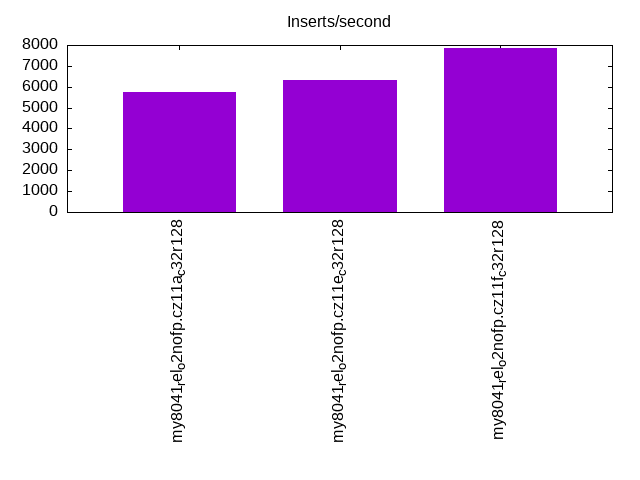
| my8041_rel_o2nofp.cz11a_c32r128 | 1437814 | 1410935 | 16649 | 5769 | 183469 | 17302 | 161764 | 9203 | 119600 | 8753 |
| my8041_rel_o2nofp.cz11e_c32r128 | 1423488 | 1314060 | 16946 | 6323 | 183424 | 17736 | 162341 | 9953 | 124766 | 9550 |
| my8041_rel_o2nofp.cz11f_c32r128 | 1445609 | 1503194 | 21316 | 7849 | 183727 | 19677 | 165098 | 13004 | 137162 | 12402 |
This table has relative throughput, throughput for the DBMS relative to the DBMS in the first line, using the absolute throughput from the previous table. Values less than 0.95 have a yellow background. Values greater than 1.05 have a blue background.
| dbms | l.i0 | l.x | l.i1 | l.i2 | qr100 | qp100 | qr500 | qp500 | qr1000 | qp1000 |
|---|---|---|---|---|---|---|---|---|---|---|
| my8041_rel_o2nofp.cz11a_c32r128 | 1.00 | 1.00 | 1.00 | 1.00 | 1.00 | 1.00 | 1.00 | 1.00 | 1.00 | 1.00 |
| my8041_rel_o2nofp.cz11e_c32r128 | 0.99 | 0.93 | 1.02 | 1.10 | 1.00 | 1.03 | 1.00 | 1.08 | 1.04 | 1.09 |
| my8041_rel_o2nofp.cz11f_c32r128 | 1.01 | 1.07 | 1.28 | 1.36 | 1.00 | 1.14 | 1.02 | 1.41 | 1.15 | 1.42 |
This lists the average rate of inserts/s for the tests that do inserts concurrent with queries. For such tests the query rate is listed in the table above. The read+write tests are setup so that the insert rate should match the target rate every second. Cells that are not at least 95% of the target have a red background to indicate a failure to satisfy the target.
| dbms | qr100.L1 | qp100.L2 | qr500.L3 | qp500.L4 | qr1000.L5 | qp1000.L6 |
|---|---|---|---|---|---|---|
| my8041_rel_o2nofp.cz11a_c32r128 | 1977 | 1976 | 9885 | 9885 | 19769 | 12843 |
| my8041_rel_o2nofp.cz11e_c32r128 | 1977 | 1977 | 9885 | 9885 | 19769 | 14913 |
| my8041_rel_o2nofp.cz11f_c32r128 | 1977 | 1978 | 9879 | 9885 | 19769 | 19758 |
| target | 2000 | 2000 | 10000 | 10000 | 20000 | 20000 |
l.i0
l.i0: load without secondary indexes. Graphs for performance per 1-second interval are here.
Average throughput:
Insert response time histogram: each cell has the percentage of responses that take <= the time in the header and max is the max response time in seconds. For the max column values in the top 25% of the range have a red background and in the bottom 25% of the range have a green background. The red background is not used when the min value is within 80% of the max value.
| dbms | 256us | 1ms | 4ms | 16ms | 64ms | 256ms | 1s | 4s | 16s | gt | max |
|---|---|---|---|---|---|---|---|---|---|---|---|
| my8041_rel_o2nofp.cz11a_c32r128 | 0.107 | 99.789 | 0.055 | 0.010 | 0.038 | 0.215 | |||||
| my8041_rel_o2nofp.cz11e_c32r128 | 0.078 | 99.754 | 0.106 | 0.023 | 0.038 | 0.239 | |||||
| my8041_rel_o2nofp.cz11f_c32r128 | 0.081 | 99.817 | 0.051 | 0.012 | 0.039 | 0.242 |
Performance metrics for the DBMS listed above. Some are normalized by throughput, others are not. Legend for results is here.
ips	qps	rps	rmbps	wps	wmbps	rpq	rkbpq	wpi	wkbpi	csps	cpups	cspq	cpupq	dbgb1	dbgb2	rss	maxop	p50	p99	tag
1437814	0	4	0.1	9766.6	532.9	0.000	0.000	0.007	0.379	296397	55.0	0.206	18	262.3	362.8	105.0	0.215	75119	62753	my8041_rel_o2nofp.cz11a_c32r128
1423488	0	7	0.1	9662.1	526.9	0.000	0.000	0.007	0.379	288871	54.7	0.203	18	262.3	362.9	108.2	0.239	74120	61134	my8041_rel_o2nofp.cz11e_c32r128
1445609	0	4	0.0	9059.3	444.0	0.000	0.000	0.006	0.315	296398	55.1	0.205	18	262.3	362.8	108.5	0.242	75119	62931	my8041_rel_o2nofp.cz11f_c32r128
l.x
l.x: create secondary indexes.
Average throughput:
Performance metrics for the DBMS listed above. Some are normalized by throughput, others are not. Legend for results is here.
ips	qps	rps	rmbps	wps	wmbps	rpq	rkbpq	wpi	wkbpi	csps	cpups	cspq	cpupq	dbgb1	dbgb2	rss	maxop	p50	p99	tag
1410935	0	25804	1626.9	42163.7	1852.1	0.018	1.181	0.030	1.344	253299	46.0	0.180	16	603.6	704.2	105.2	0.003	NA	NA	my8041_rel_o2nofp.cz11a_c32r128
1314060	0	24150	1517.2	38582.9	1724.9	0.018	1.182	0.029	1.344	241541	42.1	0.184	15	603.6	704.2	105.0	0.015	NA	NA	my8041_rel_o2nofp.cz11e_c32r128
1503194	0	27544	1736.7	40456.6	1855.2	0.018	1.183	0.027	1.264	215788	40.2	0.144	13	603.6	704.2	108.2	0.006	NA	NA	my8041_rel_o2nofp.cz11f_c32r128
l.i1
l.i1: continue load after secondary indexes created with 50 inserts per transaction. Graphs for performance per 1-second interval are here.
Average throughput:
Insert response time histogram: each cell has the percentage of responses that take <= the time in the header and max is the max response time in seconds. For the max column values in the top 25% of the range have a red background and in the bottom 25% of the range have a green background. The red background is not used when the min value is within 80% of the max value.
| dbms | 256us | 1ms | 4ms | 16ms | 64ms | 256ms | 1s | 4s | 16s | gt | max |
|---|---|---|---|---|---|---|---|---|---|---|---|
| my8041_rel_o2nofp.cz11a_c32r128 | 0.134 | 14.759 | 39.022 | 46.046 | 0.040 | 0.362 | |||||
| my8041_rel_o2nofp.cz11e_c32r128 | 0.120 | 15.968 | 42.760 | 40.721 | 0.430 | 0.523 | |||||
| my8041_rel_o2nofp.cz11f_c32r128 | 0.101 | 18.684 | 59.535 | 21.678 | 0.001 | 0.339 |
Delete response time histogram: each cell has the percentage of responses that take <= the time in the header and max is the max response time in seconds. For the max column values in the top 25% of the range have a red background and in the bottom 25% of the range have a green background. The red background is not used when the min value is within 80% of the max value.
| dbms | 256us | 1ms | 4ms | 16ms | 64ms | 256ms | 1s | 4s | 16s | gt | max |
|---|---|---|---|---|---|---|---|---|---|---|---|
| my8041_rel_o2nofp.cz11a_c32r128 | 19.435 | 19.493 | 28.680 | 32.392 | 0.195 | ||||||
| my8041_rel_o2nofp.cz11e_c32r128 | 18.506 | 19.617 | 35.525 | 26.350 | 0.002 | 0.284 | |||||
| my8041_rel_o2nofp.cz11f_c32r128 | 18.744 | 20.634 | 47.569 | 13.053 | 0.001 | 0.312 |
Performance metrics for the DBMS listed above. Some are normalized by throughput, others are not. Legend for results is here.
ips	qps	rps	rmbps	wps	wmbps	rpq	rkbpq	wpi	wkbpi	csps	cpups	cspq	cpupq	dbgb1	dbgb2	rss	maxop	p50	p99	tag
16649	0	37593	587.4	53671.8	1515.0	2.258	36.127	3.224	93.178	334031	21.4	20.063	617	819.3	935.7	107.7	0.362	699	450	my8041_rel_o2nofp.cz11a_c32r128
16946	0	38318	598.7	53427.5	1548.2	2.261	36.179	3.153	93.557	329412	22.1	19.439	626	819.2	935.8	107.5	0.523	699	300	my8041_rel_o2nofp.cz11e_c32r128
21316	0	48363	755.7	58654.1	1052.1	2.269	36.301	2.752	50.539	460110	27.7	21.585	624	819.3	935.6	107.2	0.339	849	599	my8041_rel_o2nofp.cz11f_c32r128
l.i2
l.i2: continue load after secondary indexes created with 5 inserts per transaction. Graphs for performance per 1-second interval are here.
Average throughput:
Insert response time histogram: each cell has the percentage of responses that take <= the time in the header and max is the max response time in seconds. For the max column values in the top 25% of the range have a red background and in the bottom 25% of the range have a green background. The red background is not used when the min value is within 80% of the max value.
| dbms | 256us | 1ms | 4ms | 16ms | 64ms | 256ms | 1s | 4s | 16s | gt | max |
|---|---|---|---|---|---|---|---|---|---|---|---|
| my8041_rel_o2nofp.cz11a_c32r128 | 0.306 | 72.691 | 26.930 | 0.073 | 0.143 | ||||||
| my8041_rel_o2nofp.cz11e_c32r128 | 0.147 | 74.365 | 25.401 | 0.087 | 0.111 | ||||||
| my8041_rel_o2nofp.cz11f_c32r128 | nonzero | 7.065 | 70.981 | 21.912 | 0.041 | 0.136 |
Delete response time histogram: each cell has the percentage of responses that take <= the time in the header and max is the max response time in seconds. For the max column values in the top 25% of the range have a red background and in the bottom 25% of the range have a green background. The red background is not used when the min value is within 80% of the max value.
| dbms | 256us | 1ms | 4ms | 16ms | 64ms | 256ms | 1s | 4s | 16s | gt | max |
|---|---|---|---|---|---|---|---|---|---|---|---|
| my8041_rel_o2nofp.cz11a_c32r128 | 0.513 | 73.343 | 26.121 | 0.023 | 0.142 | ||||||
| my8041_rel_o2nofp.cz11e_c32r128 | 1.447 | 74.005 | 24.514 | 0.034 | 0.111 | ||||||
| my8041_rel_o2nofp.cz11f_c32r128 | 0.003 | 17.777 | 60.720 | 21.482 | 0.018 | 0.134 |
Performance metrics for the DBMS listed above. Some are normalized by throughput, others are not. Legend for results is here.
ips	qps	rps	rmbps	wps	wmbps	rpq	rkbpq	wpi	wkbpi	csps	cpups	cspq	cpupq	dbgb1	dbgb2	rss	maxop	p50	p99	tag
5769	0	39117	611.2	50202.5	1427.0	6.781	108.497	8.703	253.313	334349	17.6	57.960	1464	819.3	932.9	106.0	0.143	145	80	my8041_rel_o2nofp.cz11a_c32r128
6323	0	42832	669.3	54862.1	1553.6	6.774	108.383	8.676	251.592	352057	19.4	55.678	1473	819.2	932.8	106.0	0.111	155	90	my8041_rel_o2nofp.cz11e_c32r128
7849	0	52246	816.3	58728.5	973.3	6.656	106.500	7.482	126.970	489386	23.4	62.349	1431	819.3	932.8	106.7	0.136	175	100	my8041_rel_o2nofp.cz11f_c32r128
qr100.L1
qr100.L1: range queries with 100 insert/s per client. Graphs for performance per 1-second interval are here.
Average throughput:
Query response time histogram: each cell has the percentage of responses that take <= the time in the header and max is the max response time in seconds. For max values in the top 25% of the range have a red background and in the bottom 25% of the range have a green background. The red background is not used when the min value is within 80% of the max value.
| dbms | 256us | 1ms | 4ms | 16ms | 64ms | 256ms | 1s | 4s | 16s | gt | max |
|---|---|---|---|---|---|---|---|---|---|---|---|
| my8041_rel_o2nofp.cz11a_c32r128 | 99.886 | 0.111 | 0.003 | nonzero | nonzero | 0.018 | |||||
| my8041_rel_o2nofp.cz11e_c32r128 | 99.886 | 0.109 | 0.005 | nonzero | nonzero | 0.027 | |||||
| my8041_rel_o2nofp.cz11f_c32r128 | 99.896 | 0.100 | 0.004 | nonzero | 0.012 |
Insert response time histogram: each cell has the percentage of responses that take <= the time in the header and max is the max response time in seconds. For max values in the top 25% of the range have a red background and in the bottom 25% of the range have a green background. The red background is not used when the min value is within 80% of the max value.
| dbms | 256us | 1ms | 4ms | 16ms | 64ms | 256ms | 1s | 4s | 16s | gt | max |
|---|---|---|---|---|---|---|---|---|---|---|---|
| my8041_rel_o2nofp.cz11a_c32r128 | 90.039 | 9.961 | 0.041 | ||||||||
| my8041_rel_o2nofp.cz11e_c32r128 | 86.078 | 13.360 | 0.562 | 0.130 | |||||||
| my8041_rel_o2nofp.cz11f_c32r128 | 94.685 | 5.315 | 0.050 |
Delete response time histogram: each cell has the percentage of responses that take <= the time in the header and max is the max response time in seconds. For max values in the top 25% of the range have a red background and in the bottom 25% of the range have a green background. The red background is not used when the min value is within 80% of the max value.
| dbms | 256us | 1ms | 4ms | 16ms | 64ms | 256ms | 1s | 4s | 16s | gt | max |
|---|---|---|---|---|---|---|---|---|---|---|---|
| my8041_rel_o2nofp.cz11a_c32r128 | 90.315 | 9.683 | 0.001 | 0.017 | |||||||
| my8041_rel_o2nofp.cz11e_c32r128 | 87.515 | 11.440 | 1.035 | 0.010 | 0.071 | ||||||
| my8041_rel_o2nofp.cz11f_c32r128 | 91.806 | 8.193 | 0.001 | 0.038 |
Performance metrics for the DBMS listed above. Some are normalized by throughput, others are not. Legend for results is here.
ips	qps	rps	rmbps	wps	wmbps	rpq	rkbpq	wpi	wkbpi	csps	cpups	cspq	cpupq	dbgb1	dbgb2	rss	maxop	p50	p99	tag
1977	183469	8292	129.8	9272.5	263.8	0.045	0.725	4.690	136.656	745277	45.0	4.062	118	819.3	932.9	106.0	0.018	9302	8719	my8041_rel_o2nofp.cz11a_c32r128
1977	183424	8288	129.5	9267.2	262.8	0.045	0.723	4.688	136.141	743375	45.0	4.053	118	819.2	932.8	106.0	0.027	9254	8678	my8041_rel_o2nofp.cz11e_c32r128
1977	183727	8270	129.2	8061.1	133.7	0.045	0.720	4.078	69.270	750241	45.2	4.083	118	819.3	932.8	106.4	0.012	9302	8758	my8041_rel_o2nofp.cz11f_c32r128
qp100.L2
qp100.L2: point queries with 100 insert/s per client. Graphs for performance per 1-second interval are here.
Average throughput:
Query response time histogram: each cell has the percentage of responses that take <= the time in the header and max is the max response time in seconds. For max values in the top 25% of the range have a red background and in the bottom 25% of the range have a green background. The red background is not used when the min value is within 80% of the max value.
| dbms | 256us | 1ms | 4ms | 16ms | 64ms | 256ms | 1s | 4s | 16s | gt | max |
|---|---|---|---|---|---|---|---|---|---|---|---|
| my8041_rel_o2nofp.cz11a_c32r128 | 0.002 | 51.499 | 47.670 | 0.829 | 0.014 | ||||||
| my8041_rel_o2nofp.cz11e_c32r128 | 0.002 | 52.299 | 47.375 | 0.321 | 0.002 | 0.035 | |||||
| my8041_rel_o2nofp.cz11f_c32r128 | 0.003 | 59.829 | 40.114 | 0.054 | 0.015 |
Insert response time histogram: each cell has the percentage of responses that take <= the time in the header and max is the max response time in seconds. For max values in the top 25% of the range have a red background and in the bottom 25% of the range have a green background. The red background is not used when the min value is within 80% of the max value.
| dbms | 256us | 1ms | 4ms | 16ms | 64ms | 256ms | 1s | 4s | 16s | gt | max |
|---|---|---|---|---|---|---|---|---|---|---|---|
| my8041_rel_o2nofp.cz11a_c32r128 | 42.315 | 57.685 | 0.063 | ||||||||
| my8041_rel_o2nofp.cz11e_c32r128 | 62.310 | 37.617 | 0.074 | 0.109 | |||||||
| my8041_rel_o2nofp.cz11f_c32r128 | 80.239 | 19.761 | 0.036 |
Delete response time histogram: each cell has the percentage of responses that take <= the time in the header and max is the max response time in seconds. For max values in the top 25% of the range have a red background and in the bottom 25% of the range have a green background. The red background is not used when the min value is within 80% of the max value.
| dbms | 256us | 1ms | 4ms | 16ms | 64ms | 256ms | 1s | 4s | 16s | gt | max |
|---|---|---|---|---|---|---|---|---|---|---|---|
| my8041_rel_o2nofp.cz11a_c32r128 | 88.867 | 11.132 | 0.001 | 0.022 | |||||||
| my8041_rel_o2nofp.cz11e_c32r128 | 87.675 | 12.314 | 0.011 | 0.023 | |||||||
| my8041_rel_o2nofp.cz11f_c32r128 | 88.947 | 11.025 | 0.028 | 0.030 |
Performance metrics for the DBMS listed above. Some are normalized by throughput, others are not. Legend for results is here.
ips	qps	rps	rmbps	wps	wmbps	rpq	rkbpq	wpi	wkbpi	csps	cpups	cspq	cpupq	dbgb1	dbgb2	rss	maxop	p50	p99	tag
1976	17302	127100	1985.9	17395.6	485.1	7.346	117.536	8.804	251.420	374577	16.8	21.649	466	819.3	932.9	106.0	0.014	911	352	my8041_rel_o2nofp.cz11a_c32r128
1977	17736	129674	2026.2	17472.8	485.7	7.311	116.979	8.838	251.571	375190	17.0	21.154	460	819.2	932.8	106.0	0.035	927	400	my8041_rel_o2nofp.cz11e_c32r128
1978	19677	141482	2210.7	15458.5	249.2	7.190	115.043	7.815	128.998	423223	18.1	21.508	442	819.3	932.8	106.3	0.015	1007	687	my8041_rel_o2nofp.cz11f_c32r128
qr500.L3
qr500.L3: range queries with 500 insert/s per client. Graphs for performance per 1-second interval are here.
Average throughput:
Query response time histogram: each cell has the percentage of responses that take <= the time in the header and max is the max response time in seconds. For max values in the top 25% of the range have a red background and in the bottom 25% of the range have a green background. The red background is not used when the min value is within 80% of the max value.
| dbms | 256us | 1ms | 4ms | 16ms | 64ms | 256ms | 1s | 4s | 16s | gt | max |
|---|---|---|---|---|---|---|---|---|---|---|---|
| my8041_rel_o2nofp.cz11a_c32r128 | 99.322 | 0.652 | 0.024 | 0.002 | nonzero | 0.027 | |||||
| my8041_rel_o2nofp.cz11e_c32r128 | 99.272 | 0.690 | 0.036 | 0.002 | nonzero | 0.037 | |||||
| my8041_rel_o2nofp.cz11f_c32r128 | 99.365 | 0.607 | 0.026 | 0.001 | nonzero | 0.021 |
Insert response time histogram: each cell has the percentage of responses that take <= the time in the header and max is the max response time in seconds. For max values in the top 25% of the range have a red background and in the bottom 25% of the range have a green background. The red background is not used when the min value is within 80% of the max value.
| dbms | 256us | 1ms | 4ms | 16ms | 64ms | 256ms | 1s | 4s | 16s | gt | max |
|---|---|---|---|---|---|---|---|---|---|---|---|
| my8041_rel_o2nofp.cz11a_c32r128 | 21.452 | 78.186 | 0.363 | 0.098 | |||||||
| my8041_rel_o2nofp.cz11e_c32r128 | 29.525 | 70.267 | 0.207 | 0.113 | |||||||
| my8041_rel_o2nofp.cz11f_c32r128 | 56.632 | 43.368 | 0.053 |
Delete response time histogram: each cell has the percentage of responses that take <= the time in the header and max is the max response time in seconds. For max values in the top 25% of the range have a red background and in the bottom 25% of the range have a green background. The red background is not used when the min value is within 80% of the max value.
| dbms | 256us | 1ms | 4ms | 16ms | 64ms | 256ms | 1s | 4s | 16s | gt | max |
|---|---|---|---|---|---|---|---|---|---|---|---|
| my8041_rel_o2nofp.cz11a_c32r128 | 62.105 | 37.619 | 0.275 | 0.030 | |||||||
| my8041_rel_o2nofp.cz11e_c32r128 | 45.276 | 52.741 | 1.982 | nonzero | 0.067 | ||||||
| my8041_rel_o2nofp.cz11f_c32r128 | 41.168 | 58.460 | 0.372 | 0.041 |
Performance metrics for the DBMS listed above. Some are normalized by throughput, others are not. Legend for results is here.
ips	qps	rps	rmbps	wps	wmbps	rpq	rkbpq	wpi	wkbpi	csps	cpups	cspq	cpupq	dbgb1	dbgb2	rss	maxop	p50	p99	tag
9885	161764	37370	583.9	45160.6	1253.0	0.231	3.696	4.569	129.804	813816	54.7	5.031	162	819.3	932.9	106.0	0.027	8135	7167	my8041_rel_o2nofp.cz11a_c32r128
9885	162341	37544	586.6	44651.1	1261.0	0.231	3.700	4.517	130.633	800243	54.8	4.929	162	819.2	932.8	106.0	0.037	8206	7288	my8041_rel_o2nofp.cz11e_c32r128
9879	165098	37554	586.8	39413.4	650.4	0.227	3.639	3.990	67.412	839021	54.4	5.082	158	819.3	932.8	106.2	0.021	8363	7576	my8041_rel_o2nofp.cz11f_c32r128
qp500.L4
qp500.L4: point queries with 500 insert/s per client. Graphs for performance per 1-second interval are here.
Average throughput:
Query response time histogram: each cell has the percentage of responses that take <= the time in the header and max is the max response time in seconds. For max values in the top 25% of the range have a red background and in the bottom 25% of the range have a green background. The red background is not used when the min value is within 80% of the max value.
| dbms | 256us | 1ms | 4ms | 16ms | 64ms | 256ms | 1s | 4s | 16s | gt | max |
|---|---|---|---|---|---|---|---|---|---|---|---|
| my8041_rel_o2nofp.cz11a_c32r128 | nonzero | 8.393 | 82.560 | 9.044 | 0.002 | 0.034 | |||||
| my8041_rel_o2nofp.cz11e_c32r128 | nonzero | 8.729 | 87.304 | 3.950 | 0.016 | 0.048 | |||||
| my8041_rel_o2nofp.cz11f_c32r128 | nonzero | 18.531 | 79.985 | 1.484 | nonzero | 0.025 |
Insert response time histogram: each cell has the percentage of responses that take <= the time in the header and max is the max response time in seconds. For max values in the top 25% of the range have a red background and in the bottom 25% of the range have a green background. The red background is not used when the min value is within 80% of the max value.
| dbms | 256us | 1ms | 4ms | 16ms | 64ms | 256ms | 1s | 4s | 16s | gt | max |
|---|---|---|---|---|---|---|---|---|---|---|---|
| my8041_rel_o2nofp.cz11a_c32r128 | 9.371 | 90.530 | 0.098 | 0.115 | |||||||
| my8041_rel_o2nofp.cz11e_c32r128 | 17.215 | 82.637 | 0.148 | 0.126 | |||||||
| my8041_rel_o2nofp.cz11f_c32r128 | 43.044 | 56.956 | nonzero | 0.079 |
Delete response time histogram: each cell has the percentage of responses that take <= the time in the header and max is the max response time in seconds. For max values in the top 25% of the range have a red background and in the bottom 25% of the range have a green background. The red background is not used when the min value is within 80% of the max value.
| dbms | 256us | 1ms | 4ms | 16ms | 64ms | 256ms | 1s | 4s | 16s | gt | max |
|---|---|---|---|---|---|---|---|---|---|---|---|
| my8041_rel_o2nofp.cz11a_c32r128 | 31.679 | 67.198 | 1.122 | 0.040 | |||||||
| my8041_rel_o2nofp.cz11e_c32r128 | 39.476 | 59.615 | 0.909 | 0.058 | |||||||
| my8041_rel_o2nofp.cz11f_c32r128 | 81.551 | 18.430 | 0.019 | 0.041 |
Performance metrics for the DBMS listed above. Some are normalized by throughput, others are not. Legend for results is here.
ips	qps	rps	rmbps	wps	wmbps	rpq	rkbpq	wpi	wkbpi	csps	cpups	cspq	cpupq	dbgb1	dbgb2	rss	maxop	p50	p99	tag
9885	9203	110071	1719.9	48342.5	1323.7	11.960	191.366	4.891	137.126	428741	22.7	46.587	1184	819.3	932.9	106.0	0.034	479	240	my8041_rel_o2nofp.cz11a_c32r128
9885	9953	120015	1875.3	52167.4	1457.3	12.058	192.928	5.278	150.967	449070	24.3	45.118	1172	819.2	932.8	106.0	0.048	511	304	my8041_rel_o2nofp.cz11e_c32r128
9885	13004	150543	2352.2	55506.7	899.4	11.576	185.219	5.615	93.174	599071	27.4	46.066	1011	819.3	932.8	106.0	0.025	656	527	my8041_rel_o2nofp.cz11f_c32r128
qr1000.L5
qr1000.L5: range queries with 1000 insert/s per client. Graphs for performance per 1-second interval are here.
Average throughput:
Query response time histogram: each cell has the percentage of responses that take <= the time in the header and max is the max response time in seconds. For max values in the top 25% of the range have a red background and in the bottom 25% of the range have a green background. The red background is not used when the min value is within 80% of the max value.
| dbms | 256us | 1ms | 4ms | 16ms | 64ms | 256ms | 1s | 4s | 16s | gt | max |
|---|---|---|---|---|---|---|---|---|---|---|---|
| my8041_rel_o2nofp.cz11a_c32r128 | 95.975 | 3.133 | 0.880 | 0.013 | nonzero | 0.033 | |||||
| my8041_rel_o2nofp.cz11e_c32r128 | 96.502 | 2.745 | 0.737 | 0.017 | nonzero | 0.060 | |||||
| my8041_rel_o2nofp.cz11f_c32r128 | 97.614 | 1.951 | 0.427 | 0.008 | nonzero | 0.032 |
Insert response time histogram: each cell has the percentage of responses that take <= the time in the header and max is the max response time in seconds. For max values in the top 25% of the range have a red background and in the bottom 25% of the range have a green background. The red background is not used when the min value is within 80% of the max value.
| dbms | 256us | 1ms | 4ms | 16ms | 64ms | 256ms | 1s | 4s | 16s | gt | max |
|---|---|---|---|---|---|---|---|---|---|---|---|
| my8041_rel_o2nofp.cz11a_c32r128 | nonzero | 36.078 | 63.905 | 0.016 | 0.086 | ||||||
| my8041_rel_o2nofp.cz11e_c32r128 | nonzero | 37.622 | 62.206 | 0.172 | 0.129 | ||||||
| my8041_rel_o2nofp.cz11f_c32r128 | nonzero | 51.395 | 48.599 | 0.006 | 0.094 |
Delete response time histogram: each cell has the percentage of responses that take <= the time in the header and max is the max response time in seconds. For max values in the top 25% of the range have a red background and in the bottom 25% of the range have a green background. The red background is not used when the min value is within 80% of the max value.
| dbms | 256us | 1ms | 4ms | 16ms | 64ms | 256ms | 1s | 4s | 16s | gt | max |
|---|---|---|---|---|---|---|---|---|---|---|---|
| my8041_rel_o2nofp.cz11a_c32r128 | 32.568 | 64.988 | 2.444 | 0.051 | |||||||
| my8041_rel_o2nofp.cz11e_c32r128 | 32.964 | 63.546 | 3.487 | 0.003 | 0.084 | ||||||
| my8041_rel_o2nofp.cz11f_c32r128 | 37.810 | 60.630 | 1.560 | nonzero | 0.089 |
Performance metrics for the DBMS listed above. Some are normalized by throughput, others are not. Legend for results is here.
ips	qps	rps	rmbps	wps	wmbps	rpq	rkbpq	wpi	wkbpi	csps	cpups	cspq	cpupq	dbgb1	dbgb2	rss	maxop	p50	p99	tag
19769	119600	37236	581.8	47725.6	1357.7	0.311	4.981	2.414	70.326	672611	59.4	5.624	238	819.3	933.7	106.0	0.033	6025	5210	my8041_rel_o2nofp.cz11a_c32r128
19769	124766	38739	605.3	49605.9	1409.3	0.310	4.968	2.509	72.998	680157	59.9	5.451	230	819.2	933.4	106.0	0.060	6201	5295	my8041_rel_o2nofp.cz11e_c32r128
19769	137162	47495	742.1	52800.9	876.8	0.346	5.540	2.671	45.416	797071	61.8	5.811	216	819.3	933.0	106.0	0.032	6936	5786	my8041_rel_o2nofp.cz11f_c32r128
qp1000.L6
qp1000.L6: point queries with 1000 insert/s per client. Graphs for performance per 1-second interval are here.
Average throughput:
Query response time histogram: each cell has the percentage of responses that take <= the time in the header and max is the max response time in seconds. For max values in the top 25% of the range have a red background and in the bottom 25% of the range have a green background. The red background is not used when the min value is within 80% of the max value.
| dbms | 256us | 1ms | 4ms | 16ms | 64ms | 256ms | 1s | 4s | 16s | gt | max |
|---|---|---|---|---|---|---|---|---|---|---|---|
| my8041_rel_o2nofp.cz11a_c32r128 | nonzero | 5.186 | 85.145 | 9.665 | 0.003 | 0.046 | |||||
| my8041_rel_o2nofp.cz11e_c32r128 | nonzero | 5.255 | 90.814 | 3.915 | 0.016 | 0.059 | |||||
| my8041_rel_o2nofp.cz11f_c32r128 | nonzero | 12.873 | 85.318 | 1.806 | 0.003 | 0.027 |
Insert response time histogram: each cell has the percentage of responses that take <= the time in the header and max is the max response time in seconds. For max values in the top 25% of the range have a red background and in the bottom 25% of the range have a green background. The red background is not used when the min value is within 80% of the max value.
| dbms | 256us | 1ms | 4ms | 16ms | 64ms | 256ms | 1s | 4s | 16s | gt | max |
|---|---|---|---|---|---|---|---|---|---|---|---|
| my8041_rel_o2nofp.cz11a_c32r128 | 7.529 | 31.413 | 61.058 | 0.224 | |||||||
| my8041_rel_o2nofp.cz11e_c32r128 | 12.350 | 43.793 | 43.857 | 0.230 | |||||||
| my8041_rel_o2nofp.cz11f_c32r128 | 33.295 | 66.256 | 0.449 | 0.135 |
Delete response time histogram: each cell has the percentage of responses that take <= the time in the header and max is the max response time in seconds. For max values in the top 25% of the range have a red background and in the bottom 25% of the range have a green background. The red background is not used when the min value is within 80% of the max value.
| dbms | 256us | 1ms | 4ms | 16ms | 64ms | 256ms | 1s | 4s | 16s | gt | max |
|---|---|---|---|---|---|---|---|---|---|---|---|
| my8041_rel_o2nofp.cz11a_c32r128 | 2.773 | 20.761 | 22.081 | 54.385 | 0.209 | ||||||
| my8041_rel_o2nofp.cz11e_c32r128 | 3.213 | 33.193 | 29.580 | 34.015 | 0.217 | ||||||
| my8041_rel_o2nofp.cz11f_c32r128 | 3.612 | 81.998 | 14.341 | 0.049 | 0.108 |
Performance metrics for the DBMS listed above. Some are normalized by throughput, others are not. Legend for results is here.
ips	qps	rps	rmbps	wps	wmbps	rpq	rkbpq	wpi	wkbpi	csps	cpups	cspq	cpupq	dbgb1	dbgb2	rss	maxop	p50	p99	tag
12843	8753	107794	1684.3	47054.0	1323.7	12.315	197.034	3.664	105.536	464729	27.4	53.091	1503	819.3	935.3	106.0	0.046	448	256	my8041_rel_o2nofp.cz11a_c32r128
14913	9550	117079	1829.4	51091.4	1436.7	12.260	196.158	3.426	98.652	489429	30.6	51.251	1538	819.2	935.0	106.0	0.059	480	304	my8041_rel_o2nofp.cz11e_c32r128
19758	12402	146131	2283.3	53508.8	880.7	11.783	188.525	2.708	45.643	604838	37.7	48.769	1459	819.3	934.3	106.0	0.027	639	463	my8041_rel_o2nofp.cz11f_c32r128
l.i0
l.i0: load without secondary indexes
Performance metrics for all DBMS, not just the ones listed above. Some are normalized by throughput, others are not. Legend for results is here.
ips	qps	rps	rmbps	wps	wmbps	rpq	rkbpq	wpi	wkbpi	csps	cpups	cspq	cpupq	dbgb1	dbgb2	rss	maxop	p50	p99	tag
1437814	0	4	0.1	9766.6	532.9	0.000	0.000	0.007	0.379	296397	55.0	0.206	18	262.3	362.8	105.0	0.215	75119	62753	my8041_rel_o2nofp.cz11a_c32r128
1423488	0	7	0.1	9662.1	526.9	0.000	0.000	0.007	0.379	288871	54.7	0.203	18	262.3	362.9	108.2	0.239	74120	61134	my8041_rel_o2nofp.cz11e_c32r128
1445609	0	4	0.0	9059.3	444.0	0.000	0.000	0.006	0.315	296398	55.1	0.205	18	262.3	362.8	108.5	0.242	75119	62931	my8041_rel_o2nofp.cz11f_c32r128
l.x
l.x: create secondary indexes
Performance metrics for all DBMS, not just the ones listed above. Some are normalized by throughput, others are not. Legend for results is here.
ips	qps	rps	rmbps	wps	wmbps	rpq	rkbpq	wpi	wkbpi	csps	cpups	cspq	cpupq	dbgb1	dbgb2	rss	maxop	p50	p99	tag
1410935	0	25804	1626.9	42163.7	1852.1	0.018	1.181	0.030	1.344	253299	46.0	0.180	16	603.6	704.2	105.2	0.003	NA	NA	my8041_rel_o2nofp.cz11a_c32r128
1314060	0	24150	1517.2	38582.9	1724.9	0.018	1.182	0.029	1.344	241541	42.1	0.184	15	603.6	704.2	105.0	0.015	NA	NA	my8041_rel_o2nofp.cz11e_c32r128
1503194	0	27544	1736.7	40456.6	1855.2	0.018	1.183	0.027	1.264	215788	40.2	0.144	13	603.6	704.2	108.2	0.006	NA	NA	my8041_rel_o2nofp.cz11f_c32r128
l.i1
l.i1: continue load after secondary indexes created with 50 inserts per transaction
Performance metrics for all DBMS, not just the ones listed above. Some are normalized by throughput, others are not. Legend for results is here.
ips	qps	rps	rmbps	wps	wmbps	rpq	rkbpq	wpi	wkbpi	csps	cpups	cspq	cpupq	dbgb1	dbgb2	rss	maxop	p50	p99	tag
16649	0	37593	587.4	53671.8	1515.0	2.258	36.127	3.224	93.178	334031	21.4	20.063	617	819.3	935.7	107.7	0.362	699	450	my8041_rel_o2nofp.cz11a_c32r128
16946	0	38318	598.7	53427.5	1548.2	2.261	36.179	3.153	93.557	329412	22.1	19.439	626	819.2	935.8	107.5	0.523	699	300	my8041_rel_o2nofp.cz11e_c32r128
21316	0	48363	755.7	58654.1	1052.1	2.269	36.301	2.752	50.539	460110	27.7	21.585	624	819.3	935.6	107.2	0.339	849	599	my8041_rel_o2nofp.cz11f_c32r128
l.i2
l.i2: continue load after secondary indexes created with 5 inserts per transaction
Performance metrics for all DBMS, not just the ones listed above. Some are normalized by throughput, others are not. Legend for results is here.
ips	qps	rps	rmbps	wps	wmbps	rpq	rkbpq	wpi	wkbpi	csps	cpups	cspq	cpupq	dbgb1	dbgb2	rss	maxop	p50	p99	tag
5769	0	39117	611.2	50202.5	1427.0	6.781	108.497	8.703	253.313	334349	17.6	57.960	1464	819.3	932.9	106.0	0.143	145	80	my8041_rel_o2nofp.cz11a_c32r128
6323	0	42832	669.3	54862.1	1553.6	6.774	108.383	8.676	251.592	352057	19.4	55.678	1473	819.2	932.8	106.0	0.111	155	90	my8041_rel_o2nofp.cz11e_c32r128
7849	0	52246	816.3	58728.5	973.3	6.656	106.500	7.482	126.970	489386	23.4	62.349	1431	819.3	932.8	106.7	0.136	175	100	my8041_rel_o2nofp.cz11f_c32r128
qr100.L1
qr100.L1: range queries with 100 insert/s per client
Performance metrics for all DBMS, not just the ones listed above. Some are normalized by throughput, others are not. Legend for results is here.
ips	qps	rps	rmbps	wps	wmbps	rpq	rkbpq	wpi	wkbpi	csps	cpups	cspq	cpupq	dbgb1	dbgb2	rss	maxop	p50	p99	tag
1977	183469	8292	129.8	9272.5	263.8	0.045	0.725	4.690	136.656	745277	45.0	4.062	118	819.3	932.9	106.0	0.018	9302	8719	my8041_rel_o2nofp.cz11a_c32r128
1977	183424	8288	129.5	9267.2	262.8	0.045	0.723	4.688	136.141	743375	45.0	4.053	118	819.2	932.8	106.0	0.027	9254	8678	my8041_rel_o2nofp.cz11e_c32r128
1977	183727	8270	129.2	8061.1	133.7	0.045	0.720	4.078	69.270	750241	45.2	4.083	118	819.3	932.8	106.4	0.012	9302	8758	my8041_rel_o2nofp.cz11f_c32r128
qp100.L2
qp100.L2: point queries with 100 insert/s per client
Performance metrics for all DBMS, not just the ones listed above. Some are normalized by throughput, others are not. Legend for results is here.
ips	qps	rps	rmbps	wps	wmbps	rpq	rkbpq	wpi	wkbpi	csps	cpups	cspq	cpupq	dbgb1	dbgb2	rss	maxop	p50	p99	tag
1976	17302	127100	1985.9	17395.6	485.1	7.346	117.536	8.804	251.420	374577	16.8	21.649	466	819.3	932.9	106.0	0.014	911	352	my8041_rel_o2nofp.cz11a_c32r128
1977	17736	129674	2026.2	17472.8	485.7	7.311	116.979	8.838	251.571	375190	17.0	21.154	460	819.2	932.8	106.0	0.035	927	400	my8041_rel_o2nofp.cz11e_c32r128
1978	19677	141482	2210.7	15458.5	249.2	7.190	115.043	7.815	128.998	423223	18.1	21.508	442	819.3	932.8	106.3	0.015	1007	687	my8041_rel_o2nofp.cz11f_c32r128
qr500.L3
qr500.L3: range queries with 500 insert/s per client
Performance metrics for all DBMS, not just the ones listed above. Some are normalized by throughput, others are not. Legend for results is here.
ips	qps	rps	rmbps	wps	wmbps	rpq	rkbpq	wpi	wkbpi	csps	cpups	cspq	cpupq	dbgb1	dbgb2	rss	maxop	p50	p99	tag
9885	161764	37370	583.9	45160.6	1253.0	0.231	3.696	4.569	129.804	813816	54.7	5.031	162	819.3	932.9	106.0	0.027	8135	7167	my8041_rel_o2nofp.cz11a_c32r128
9885	162341	37544	586.6	44651.1	1261.0	0.231	3.700	4.517	130.633	800243	54.8	4.929	162	819.2	932.8	106.0	0.037	8206	7288	my8041_rel_o2nofp.cz11e_c32r128
9879	165098	37554	586.8	39413.4	650.4	0.227	3.639	3.990	67.412	839021	54.4	5.082	158	819.3	932.8	106.2	0.021	8363	7576	my8041_rel_o2nofp.cz11f_c32r128
qp500.L4
qp500.L4: point queries with 500 insert/s per client
Performance metrics for all DBMS, not just the ones listed above. Some are normalized by throughput, others are not. Legend for results is here.
ips	qps	rps	rmbps	wps	wmbps	rpq	rkbpq	wpi	wkbpi	csps	cpups	cspq	cpupq	dbgb1	dbgb2	rss	maxop	p50	p99	tag
9885	9203	110071	1719.9	48342.5	1323.7	11.960	191.366	4.891	137.126	428741	22.7	46.587	1184	819.3	932.9	106.0	0.034	479	240	my8041_rel_o2nofp.cz11a_c32r128
9885	9953	120015	1875.3	52167.4	1457.3	12.058	192.928	5.278	150.967	449070	24.3	45.118	1172	819.2	932.8	106.0	0.048	511	304	my8041_rel_o2nofp.cz11e_c32r128
9885	13004	150543	2352.2	55506.7	899.4	11.576	185.219	5.615	93.174	599071	27.4	46.066	1011	819.3	932.8	106.0	0.025	656	527	my8041_rel_o2nofp.cz11f_c32r128
qr1000.L5
qr1000.L5: range queries with 1000 insert/s per client
Performance metrics for all DBMS, not just the ones listed above. Some are normalized by throughput, others are not. Legend for results is here.
ips	qps	rps	rmbps	wps	wmbps	rpq	rkbpq	wpi	wkbpi	csps	cpups	cspq	cpupq	dbgb1	dbgb2	rss	maxop	p50	p99	tag
19769	119600	37236	581.8	47725.6	1357.7	0.311	4.981	2.414	70.326	672611	59.4	5.624	238	819.3	933.7	106.0	0.033	6025	5210	my8041_rel_o2nofp.cz11a_c32r128
19769	124766	38739	605.3	49605.9	1409.3	0.310	4.968	2.509	72.998	680157	59.9	5.451	230	819.2	933.4	106.0	0.060	6201	5295	my8041_rel_o2nofp.cz11e_c32r128
19769	137162	47495	742.1	52800.9	876.8	0.346	5.540	2.671	45.416	797071	61.8	5.811	216	819.3	933.0	106.0	0.032	6936	5786	my8041_rel_o2nofp.cz11f_c32r128
qp1000.L6
qp1000.L6: point queries with 1000 insert/s per client
Performance metrics for all DBMS, not just the ones listed above. Some are normalized by throughput, others are not. Legend for results is here.
ips	qps	rps	rmbps	wps	wmbps	rpq	rkbpq	wpi	wkbpi	csps	cpups	cspq	cpupq	dbgb1	dbgb2	rss	maxop	p50	p99	tag
12843	8753	107794	1684.3	47054.0	1323.7	12.315	197.034	3.664	105.536	464729	27.4	53.091	1503	819.3	935.3	106.0	0.046	448	256	my8041_rel_o2nofp.cz11a_c32r128
14913	9550	117079	1829.4	51091.4	1436.7	12.260	196.158	3.426	98.652	489429	30.6	51.251	1538	819.2	935.0	106.0	0.059	480	304	my8041_rel_o2nofp.cz11e_c32r128
19758	12402	146131	2283.3	53508.8	880.7	11.783	188.525	2.708	45.643	604838	37.7	48.769	1459	819.3	934.3	106.0	0.027	639	463	my8041_rel_o2nofp.cz11f_c32r128
l.i0
- l.i0: load without secondary indexes
- Legend for results is here.
- Each entry lists the percentage of responses that fit in that bucket (slower than max time for previous bucket, faster than min time for next bucket).
Insert response time histogram
256us	1ms	4ms	16ms	64ms	256ms	1s	4s	16s	gt	max	tag
0.000	0.107	99.789	0.055	0.010	0.038	0.000	0.000	0.000	0.000	0.215	my8041_rel_o2nofp.cz11a_c32r128
0.000	0.078	99.754	0.106	0.023	0.038	0.000	0.000	0.000	0.000	0.239	my8041_rel_o2nofp.cz11e_c32r128
0.000	0.081	99.817	0.051	0.012	0.039	0.000	0.000	0.000	0.000	0.242	my8041_rel_o2nofp.cz11f_c32r128
l.x
- l.x: create secondary indexes
- Legend for results is here.
- Each entry lists the percentage of responses that fit in that bucket (slower than max time for previous bucket, faster than min time for next bucket).
TODO - determine whether there is data for create index response time
l.i1
- l.i1: continue load after secondary indexes created with 50 inserts per transaction
- Legend for results is here.
- Each entry lists the percentage of responses that fit in that bucket (slower than max time for previous bucket, faster than min time for next bucket).
Insert response time histogram
256us	1ms	4ms	16ms	64ms	256ms	1s	4s	16s	gt	max	tag
0.000	0.000	0.134	14.759	39.022	46.046	0.040	0.000	0.000	0.000	0.362	my8041_rel_o2nofp.cz11a_c32r128
0.000	0.000	0.120	15.968	42.760	40.721	0.430	0.000	0.000	0.000	0.523	my8041_rel_o2nofp.cz11e_c32r128
0.000	0.000	0.101	18.684	59.535	21.678	0.001	0.000	0.000	0.000	0.339	my8041_rel_o2nofp.cz11f_c32r128
Delete response time histogram
256us	1ms	4ms	16ms	64ms	256ms	1s	4s	16s	gt	max	tag
0.000	0.000	19.435	19.493	28.680	32.392	0.000	0.000	0.000	0.000	0.195	my8041_rel_o2nofp.cz11a_c32r128
0.000	0.000	18.506	19.617	35.525	26.350	0.002	0.000	0.000	0.000	0.284	my8041_rel_o2nofp.cz11e_c32r128
0.000	0.000	18.744	20.634	47.569	13.053	0.001	0.000	0.000	0.000	0.312	my8041_rel_o2nofp.cz11f_c32r128
l.i2
- l.i2: continue load after secondary indexes created with 5 inserts per transaction
- Legend for results is here.
- Each entry lists the percentage of responses that fit in that bucket (slower than max time for previous bucket, faster than min time for next bucket).
Insert response time histogram
256us	1ms	4ms	16ms	64ms	256ms	1s	4s	16s	gt	max	tag
0.000	0.000	0.306	72.691	26.930	0.073	0.000	0.000	0.000	0.000	0.143	my8041_rel_o2nofp.cz11a_c32r128
0.000	0.000	0.147	74.365	25.401	0.087	0.000	0.000	0.000	0.000	0.111	my8041_rel_o2nofp.cz11e_c32r128
0.000	nonzero	7.065	70.981	21.912	0.041	0.000	0.000	0.000	0.000	0.136	my8041_rel_o2nofp.cz11f_c32r128
Delete response time histogram
256us	1ms	4ms	16ms	64ms	256ms	1s	4s	16s	gt	max	tag
0.000	0.000	0.513	73.343	26.121	0.023	0.000	0.000	0.000	0.000	0.142	my8041_rel_o2nofp.cz11a_c32r128
0.000	0.000	1.447	74.005	24.514	0.034	0.000	0.000	0.000	0.000	0.111	my8041_rel_o2nofp.cz11e_c32r128
0.000	0.003	17.777	60.720	21.482	0.018	0.000	0.000	0.000	0.000	0.134	my8041_rel_o2nofp.cz11f_c32r128
qr100.L1
- qr100.L1: range queries with 100 insert/s per client
- Legend for results is here.
- Each entry lists the percentage of responses that fit in that bucket (slower than max time for previous bucket, faster than min time for next bucket).
Query response time histogram
256us	1ms	4ms	16ms	64ms	256ms	1s	4s	16s	gt	max	tag
99.886	0.111	0.003	nonzero	nonzero	0.000	0.000	0.000	0.000	0.000	0.018	my8041_rel_o2nofp.cz11a_c32r128
99.886	0.109	0.005	nonzero	nonzero	0.000	0.000	0.000	0.000	0.000	0.027	my8041_rel_o2nofp.cz11e_c32r128
99.896	0.100	0.004	nonzero	0.000	0.000	0.000	0.000	0.000	0.000	0.012	my8041_rel_o2nofp.cz11f_c32r128
Insert response time histogram
256us	1ms	4ms	16ms	64ms	256ms	1s	4s	16s	gt	max	tag
0.000	0.000	0.000	90.039	9.961	0.000	0.000	0.000	0.000	0.000	0.041	my8041_rel_o2nofp.cz11a_c32r128
0.000	0.000	0.000	86.078	13.360	0.562	0.000	0.000	0.000	0.000	0.130	my8041_rel_o2nofp.cz11e_c32r128
0.000	0.000	0.000	94.685	5.315	0.000	0.000	0.000	0.000	0.000	0.050	my8041_rel_o2nofp.cz11f_c32r128
Delete response time histogram
256us	1ms	4ms	16ms	64ms	256ms	1s	4s	16s	gt	max	tag
0.000	0.000	90.315	9.683	0.001	0.000	0.000	0.000	0.000	0.000	0.017	my8041_rel_o2nofp.cz11a_c32r128
0.000	0.000	87.515	11.440	1.035	0.010	0.000	0.000	0.000	0.000	0.071	my8041_rel_o2nofp.cz11e_c32r128
0.000	0.000	91.806	8.193	0.001	0.000	0.000	0.000	0.000	0.000	0.038	my8041_rel_o2nofp.cz11f_c32r128
qp100.L2
- qp100.L2: point queries with 100 insert/s per client
- Legend for results is here.
- Each entry lists the percentage of responses that fit in that bucket (slower than max time for previous bucket, faster than min time for next bucket).
Query response time histogram
256us	1ms	4ms	16ms	64ms	256ms	1s	4s	16s	gt	max	tag
0.002	51.499	47.670	0.829	0.000	0.000	0.000	0.000	0.000	0.000	0.014	my8041_rel_o2nofp.cz11a_c32r128
0.002	52.299	47.375	0.321	0.002	0.000	0.000	0.000	0.000	0.000	0.035	my8041_rel_o2nofp.cz11e_c32r128
0.003	59.829	40.114	0.054	0.000	0.000	0.000	0.000	0.000	0.000	0.015	my8041_rel_o2nofp.cz11f_c32r128
Insert response time histogram
256us	1ms	4ms	16ms	64ms	256ms	1s	4s	16s	gt	max	tag
0.000	0.000	0.000	42.315	57.685	0.000	0.000	0.000	0.000	0.000	0.063	my8041_rel_o2nofp.cz11a_c32r128
0.000	0.000	0.000	62.310	37.617	0.074	0.000	0.000	0.000	0.000	0.109	my8041_rel_o2nofp.cz11e_c32r128
0.000	0.000	0.000	80.239	19.761	0.000	0.000	0.000	0.000	0.000	0.036	my8041_rel_o2nofp.cz11f_c32r128
Delete response time histogram
256us	1ms	4ms	16ms	64ms	256ms	1s	4s	16s	gt	max	tag
0.000	0.000	88.867	11.132	0.001	0.000	0.000	0.000	0.000	0.000	0.022	my8041_rel_o2nofp.cz11a_c32r128
0.000	0.000	87.675	12.314	0.011	0.000	0.000	0.000	0.000	0.000	0.023	my8041_rel_o2nofp.cz11e_c32r128
0.000	0.000	88.947	11.025	0.028	0.000	0.000	0.000	0.000	0.000	0.030	my8041_rel_o2nofp.cz11f_c32r128
qr500.L3
- qr500.L3: range queries with 500 insert/s per client
- Legend for results is here.
- Each entry lists the percentage of responses that fit in that bucket (slower than max time for previous bucket, faster than min time for next bucket).
Query response time histogram
256us	1ms	4ms	16ms	64ms	256ms	1s	4s	16s	gt	max	tag
99.322	0.652	0.024	0.002	nonzero	0.000	0.000	0.000	0.000	0.000	0.027	my8041_rel_o2nofp.cz11a_c32r128
99.272	0.690	0.036	0.002	nonzero	0.000	0.000	0.000	0.000	0.000	0.037	my8041_rel_o2nofp.cz11e_c32r128
99.365	0.607	0.026	0.001	nonzero	0.000	0.000	0.000	0.000	0.000	0.021	my8041_rel_o2nofp.cz11f_c32r128
Insert response time histogram
256us	1ms	4ms	16ms	64ms	256ms	1s	4s	16s	gt	max	tag
0.000	0.000	0.000	21.452	78.186	0.363	0.000	0.000	0.000	0.000	0.098	my8041_rel_o2nofp.cz11a_c32r128
0.000	0.000	0.000	29.525	70.267	0.207	0.000	0.000	0.000	0.000	0.113	my8041_rel_o2nofp.cz11e_c32r128
0.000	0.000	0.000	56.632	43.368	0.000	0.000	0.000	0.000	0.000	0.053	my8041_rel_o2nofp.cz11f_c32r128
Delete response time histogram
256us	1ms	4ms	16ms	64ms	256ms	1s	4s	16s	gt	max	tag
0.000	0.000	62.105	37.619	0.275	0.000	0.000	0.000	0.000	0.000	0.030	my8041_rel_o2nofp.cz11a_c32r128
0.000	0.000	45.276	52.741	1.982	nonzero	0.000	0.000	0.000	0.000	0.067	my8041_rel_o2nofp.cz11e_c32r128
0.000	0.000	41.168	58.460	0.372	0.000	0.000	0.000	0.000	0.000	0.041	my8041_rel_o2nofp.cz11f_c32r128
qp500.L4
- qp500.L4: point queries with 500 insert/s per client
- Legend for results is here.
- Each entry lists the percentage of responses that fit in that bucket (slower than max time for previous bucket, faster than min time for next bucket).
Query response time histogram
256us	1ms	4ms	16ms	64ms	256ms	1s	4s	16s	gt	max	tag
nonzero	8.393	82.560	9.044	0.002	0.000	0.000	0.000	0.000	0.000	0.034	my8041_rel_o2nofp.cz11a_c32r128
nonzero	8.729	87.304	3.950	0.016	0.000	0.000	0.000	0.000	0.000	0.048	my8041_rel_o2nofp.cz11e_c32r128
nonzero	18.531	79.985	1.484	nonzero	0.000	0.000	0.000	0.000	0.000	0.025	my8041_rel_o2nofp.cz11f_c32r128
Insert response time histogram
256us	1ms	4ms	16ms	64ms	256ms	1s	4s	16s	gt	max	tag
0.000	0.000	0.000	9.371	90.530	0.098	0.000	0.000	0.000	0.000	0.115	my8041_rel_o2nofp.cz11a_c32r128
0.000	0.000	0.000	17.215	82.637	0.148	0.000	0.000	0.000	0.000	0.126	my8041_rel_o2nofp.cz11e_c32r128
0.000	0.000	0.000	43.044	56.956	nonzero	0.000	0.000	0.000	0.000	0.079	my8041_rel_o2nofp.cz11f_c32r128
Delete response time histogram
256us	1ms	4ms	16ms	64ms	256ms	1s	4s	16s	gt	max	tag
0.000	0.000	31.679	67.198	1.122	0.000	0.000	0.000	0.000	0.000	0.040	my8041_rel_o2nofp.cz11a_c32r128
0.000	0.000	39.476	59.615	0.909	0.000	0.000	0.000	0.000	0.000	0.058	my8041_rel_o2nofp.cz11e_c32r128
0.000	0.000	81.551	18.430	0.019	0.000	0.000	0.000	0.000	0.000	0.041	my8041_rel_o2nofp.cz11f_c32r128
qr1000.L5
- qr1000.L5: range queries with 1000 insert/s per client
- Legend for results is here.
- Each entry lists the percentage of responses that fit in that bucket (slower than max time for previous bucket, faster than min time for next bucket).
Query response time histogram
256us	1ms	4ms	16ms	64ms	256ms	1s	4s	16s	gt	max	tag
95.975	3.133	0.880	0.013	nonzero	0.000	0.000	0.000	0.000	0.000	0.033	my8041_rel_o2nofp.cz11a_c32r128
96.502	2.745	0.737	0.017	nonzero	0.000	0.000	0.000	0.000	0.000	0.060	my8041_rel_o2nofp.cz11e_c32r128
97.614	1.951	0.427	0.008	nonzero	0.000	0.000	0.000	0.000	0.000	0.032	my8041_rel_o2nofp.cz11f_c32r128
Insert response time histogram
256us	1ms	4ms	16ms	64ms	256ms	1s	4s	16s	gt	max	tag
0.000	0.000	nonzero	36.078	63.905	0.016	0.000	0.000	0.000	0.000	0.086	my8041_rel_o2nofp.cz11a_c32r128
0.000	0.000	nonzero	37.622	62.206	0.172	0.000	0.000	0.000	0.000	0.129	my8041_rel_o2nofp.cz11e_c32r128
0.000	0.000	nonzero	51.395	48.599	0.006	0.000	0.000	0.000	0.000	0.094	my8041_rel_o2nofp.cz11f_c32r128
Delete response time histogram
256us	1ms	4ms	16ms	64ms	256ms	1s	4s	16s	gt	max	tag
0.000	0.000	32.568	64.988	2.444	0.000	0.000	0.000	0.000	0.000	0.051	my8041_rel_o2nofp.cz11a_c32r128
0.000	0.000	32.964	63.546	3.487	0.003	0.000	0.000	0.000	0.000	0.084	my8041_rel_o2nofp.cz11e_c32r128
0.000	0.000	37.810	60.630	1.560	nonzero	0.000	0.000	0.000	0.000	0.089	my8041_rel_o2nofp.cz11f_c32r128
qp1000.L6
- qp1000.L6: point queries with 1000 insert/s per client
- Legend for results is here.
- Each entry lists the percentage of responses that fit in that bucket (slower than max time for previous bucket, faster than min time for next bucket).
Query response time histogram
256us	1ms	4ms	16ms	64ms	256ms	1s	4s	16s	gt	max	tag
nonzero	5.186	85.145	9.665	0.003	0.000	0.000	0.000	0.000	0.000	0.046	my8041_rel_o2nofp.cz11a_c32r128
nonzero	5.255	90.814	3.915	0.016	0.000	0.000	0.000	0.000	0.000	0.059	my8041_rel_o2nofp.cz11e_c32r128
nonzero	12.873	85.318	1.806	0.003	0.000	0.000	0.000	0.000	0.000	0.027	my8041_rel_o2nofp.cz11f_c32r128
Insert response time histogram
256us	1ms	4ms	16ms	64ms	256ms	1s	4s	16s	gt	max	tag
0.000	0.000	0.000	7.529	31.413	61.058	0.000	0.000	0.000	0.000	0.224	my8041_rel_o2nofp.cz11a_c32r128
0.000	0.000	0.000	12.350	43.793	43.857	0.000	0.000	0.000	0.000	0.230	my8041_rel_o2nofp.cz11e_c32r128
0.000	0.000	0.000	33.295	66.256	0.449	0.000	0.000	0.000	0.000	0.135	my8041_rel_o2nofp.cz11f_c32r128
Delete response time histogram
256us	1ms	4ms	16ms	64ms	256ms	1s	4s	16s	gt	max	tag
0.000	0.000	2.773	20.761	22.081	54.385	0.000	0.000	0.000	0.000	0.209	my8041_rel_o2nofp.cz11a_c32r128
0.000	0.000	3.213	33.193	29.580	34.015	0.000	0.000	0.000	0.000	0.217	my8041_rel_o2nofp.cz11e_c32r128
0.000	0.000	3.612	81.998	14.341	0.049	0.000	0.000	0.000	0.000	0.108	my8041_rel_o2nofp.cz11f_c32r128