Introduction
This is a report for the insert benchmark with 800M docs and 1 client(s). It is generated by scripts (bash, awk, sed) and Tufte might not be impressed. An overview of the insert benchmark is here and a short update is here. Below, by DBMS, I mean DBMS+version.config. An example is my8020.c10b40 where my means MySQL, 8020 is version 8.0.20 and c10b40 is the name for the configuration file.
The test server has 8 AMD cores, 16G RAM and an NVMe SSD. It is described here as the Beelink. The benchmark was run with 1 client and there were 1 or 3 connections per client (1 for queries or inserts without rate limits, 1+1 for rate limited inserts+deletes). It uses 1 table. It loads 800M rows per table without secondary indexes, creates 3 secondary indexes per table, then inserts 5m rows per table with a delete per insert to avoid growing the table. It then does 6 read+write tests for 1800s each that do queries as fast as possible with 100,100,500,500,1000,1000 inserts/s and the same for deletes/s per client concurrent with the queries. The database is larger than memory. Clients and the DBMS share one server. The per-database configs are in the per-database subdirectories here.
The tested DBMS are:
- my5710_rel.cz10a_bee - MySQL 5.7.10 with InnoDB, rel build, cz10a_bee config
- my5720_rel.cz10a_bee - MySQL 5.7.20 with InnoDB, rel build, cz10a_bee config
- my5730_rel.cz10a_bee - MySQL 5.7.30 with InnoDB, rel build, cz10a_bee config
- my5744_rel.cz10a_bee - MySQL 5.7.44 with InnoDB, rel build, cz10a_bee config
Contents
- Summary
- l.i0: load without secondary indexes
- l.x: create secondary indexes
- l.i1: continue load after secondary indexes created with 50 inserts per transaction
- l.i2: continue load after secondary indexes created with 5 inserts per transaction
- qr100.L1: range queries with 100 insert/s per client
- qp100.L2: point queries with 100 insert/s per client
- qr500.L3: range queries with 500 insert/s per client
- qp500.L4: point queries with 500 insert/s per client
- qr1000.L5: range queries with 1000 insert/s per client
- qp1000.L6: point queries with 1000 insert/s per client
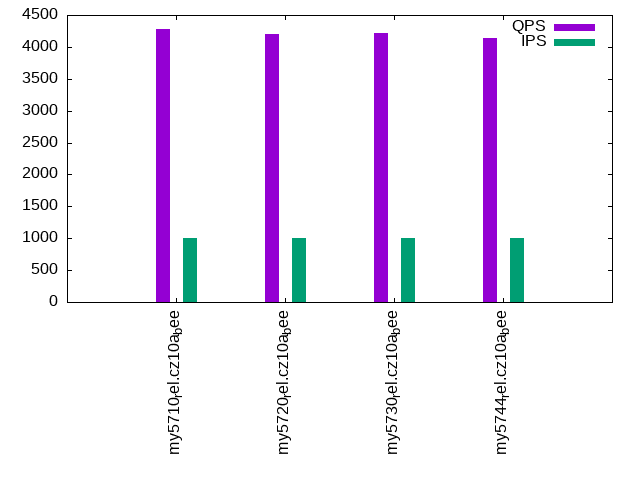
Summary
The numbers are inserts/s for l.i0, l.i1 and l.i2, indexed docs (or rows) /s for l.x and queries/s for qr100, qp100 thru qr1000, qp1000" The values are the average rate over the entire test for inserts (IPS) and queries (QPS). The range of values for IPS and QPS is split into 3 parts: bottom 25%, middle 50%, top 25%. Values in the bottom 25% have a red background, values in the top 25% have a green background and values in the middle have no color. A gray background is used for values that can be ignored because the DBMS did not sustain the target insert rate. Red backgrounds are not used when the minimum value is within 80% of the max value.
| dbms | l.i0 | l.x | l.i1 | l.i2 | qr100 | qp100 | qr500 | qp500 | qr1000 | qp1000 |
|---|---|---|---|---|---|---|---|---|---|---|
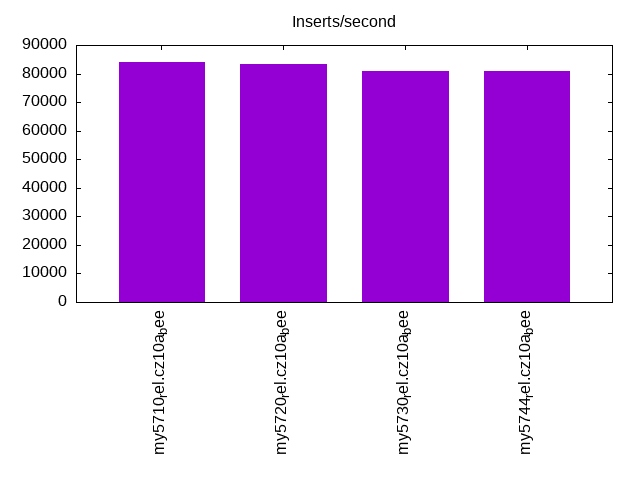
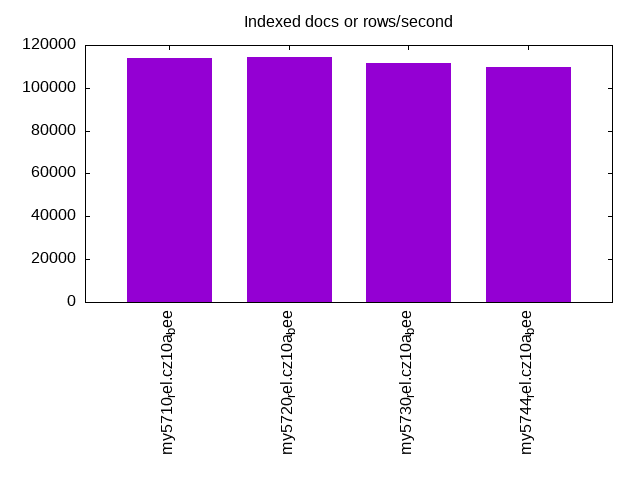
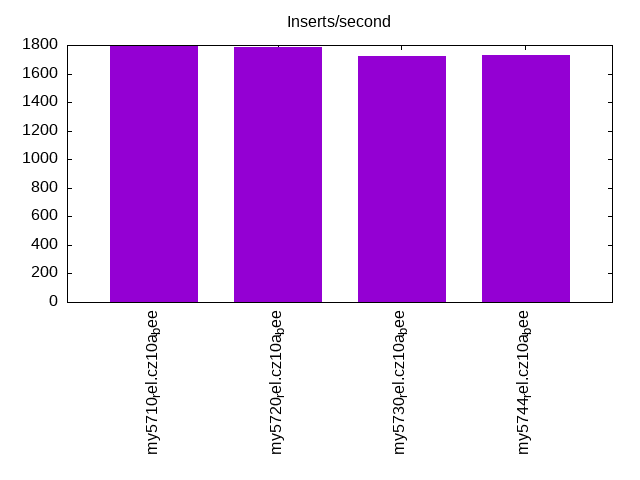
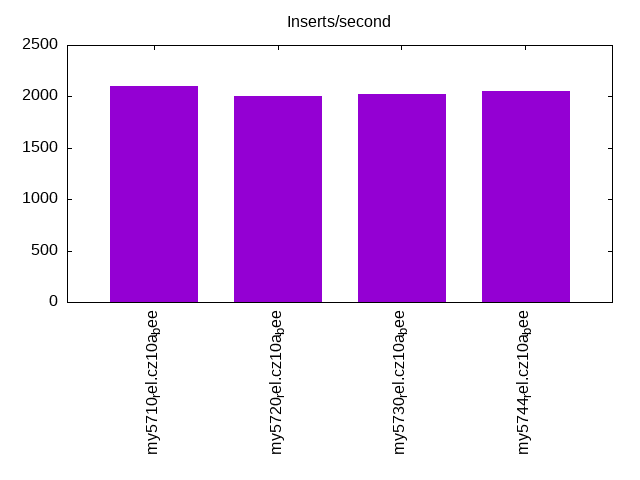
| my5710_rel.cz10a_bee | 83981 | 113928 | 1798 | 2101 | 4090 | 646 | 4192 | 574 | 4280 | 521 |
| my5720_rel.cz10a_bee | 83255 | 114564 | 1787 | 2008 | 3977 | 647 | 4126 | 573 | 4201 | 520 |
| my5730_rel.cz10a_bee | 80759 | 111467 | 1723 | 2024 | 3903 | 646 | 4017 | 573 | 4212 | 520 |
| my5744_rel.cz10a_bee | 80980 | 109845 | 1729 | 2049 | 3870 | 644 | 4046 | 570 | 4132 | 518 |
This table has relative throughput, throughput for the DBMS relative to the DBMS in the first line, using the absolute throughput from the previous table. Values less than 0.95 have a yellow background. Values greater than 1.05 have a blue background.
| dbms | l.i0 | l.x | l.i1 | l.i2 | qr100 | qp100 | qr500 | qp500 | qr1000 | qp1000 |
|---|---|---|---|---|---|---|---|---|---|---|
| my5710_rel.cz10a_bee | 1.00 | 1.00 | 1.00 | 1.00 | 1.00 | 1.00 | 1.00 | 1.00 | 1.00 | 1.00 |
| my5720_rel.cz10a_bee | 0.99 | 1.01 | 0.99 | 0.96 | 0.97 | 1.00 | 0.98 | 1.00 | 0.98 | 1.00 |
| my5730_rel.cz10a_bee | 0.96 | 0.98 | 0.96 | 0.96 | 0.95 | 1.00 | 0.96 | 1.00 | 0.98 | 1.00 |
| my5744_rel.cz10a_bee | 0.96 | 0.96 | 0.96 | 0.98 | 0.95 | 1.00 | 0.97 | 0.99 | 0.97 | 0.99 |
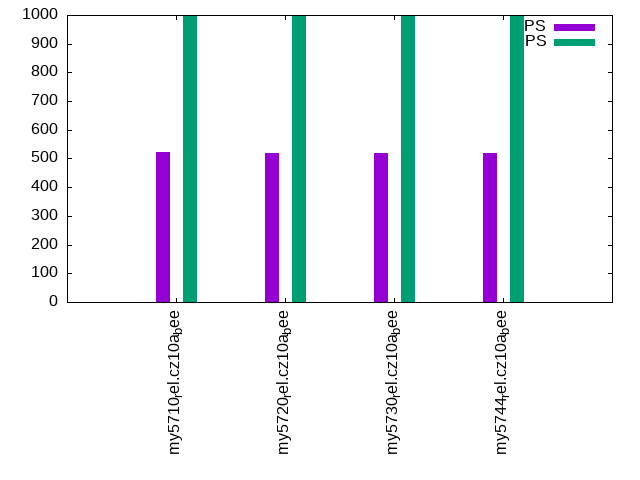
This lists the average rate of inserts/s for the tests that do inserts concurrent with queries. For such tests the query rate is listed in the table above. The read+write tests are setup so that the insert rate should match the target rate every second. Cells that are not at least 95% of the target have a red background to indicate a failure to satisfy the target.
| dbms | qr100.L1 | qp100.L2 | qr500.L3 | qp500.L4 | qr1000.L5 | qp1000.L6 |
|---|---|---|---|---|---|---|
| my5710_rel.cz10a_bee | 100 | 100 | 499 | 499 | 998 | 998 |
| my5720_rel.cz10a_bee | 100 | 100 | 499 | 499 | 998 | 998 |
| my5730_rel.cz10a_bee | 100 | 100 | 498 | 499 | 998 | 998 |
| my5744_rel.cz10a_bee | 100 | 100 | 498 | 498 | 997 | 997 |
| target | 100 | 100 | 500 | 500 | 1000 | 1000 |
l.i0
l.i0: load without secondary indexes. Graphs for performance per 1-second interval are here.
Average throughput:
Insert response time histogram: each cell has the percentage of responses that take <= the time in the header and max is the max response time in seconds. For the max column values in the top 25% of the range have a red background and in the bottom 25% of the range have a green background. The red background is not used when the min value is within 80% of the max value.
| dbms | 256us | 1ms | 4ms | 16ms | 64ms | 256ms | 1s | 4s | 16s | gt | max |
|---|---|---|---|---|---|---|---|---|---|---|---|
| my5710_rel.cz10a_bee | 2.011 | 97.652 | 0.318 | 0.016 | 0.002 | 0.120 | |||||
| my5720_rel.cz10a_bee | 0.866 | 98.795 | 0.321 | 0.016 | 0.002 | 0.122 | |||||
| my5730_rel.cz10a_bee | 0.445 | 99.185 | 0.220 | 0.148 | 0.002 | 0.118 | |||||
| my5744_rel.cz10a_bee | 0.415 | 99.215 | 0.218 | 0.149 | 0.003 | 0.121 |
Performance metrics for the DBMS listed above. Some are normalized by throughput, others are not. Legend for results is here.
ips	qps	rps	rmbps	wps	wmbps	rpq	rkbpq	wpi	wkbpi	csps	cpups	cspq	cpupq	dbgb1	dbgb2	rss	maxop	p50	p99	tag
83981	0	0	0.0	433.8	30.4	0.000	0.000	0.005	0.371	9194	21.5	0.109	20	52.6	69.1	10.9	0.120	84306	75616	my5710_rel.cz10a_bee
83255	0	0	0.0	430.2	30.2	0.000	0.000	0.005	0.371	9109	21.6	0.109	21	52.6	69.1	10.9	0.122	83593	74914	my5720_rel.cz10a_bee
80759	0	0	0.0	419.0	29.3	0.000	0.000	0.005	0.371	8855	21.3	0.110	21	52.6	69.1	10.9	0.118	81008	72448	my5730_rel.cz10a_bee
80980	0	0	0.0	420.7	29.4	0.000	0.000	0.005	0.372	9017	21.4	0.111	21	52.6	69.1	10.9	0.121	81352	71824	my5744_rel.cz10a_bee
l.x
l.x: create secondary indexes.
Average throughput:
Performance metrics for the DBMS listed above. Some are normalized by throughput, others are not. Legend for results is here.
ips	qps	rps	rmbps	wps	wmbps	rpq	rkbpq	wpi	wkbpi	csps	cpups	cspq	cpupq	dbgb1	dbgb2	rss	maxop	p50	p99	tag
113928	0	716	114.5	978.1	135.5	0.006	1.029	0.009	1.218	6586	12.4	0.058	9	121.1	137.7	11.1	0.002	NA	NA	my5710_rel.cz10a_bee
114564	0	716	115.2	974.8	136.2	0.006	1.030	0.009	1.217	6586	12.4	0.057	9	121.1	137.7	11.1	0.002	NA	NA	my5720_rel.cz10a_bee
111467	0	692	112.1	963.6	132.6	0.006	1.029	0.009	1.218	6528	12.0	0.059	9	121.1	137.7	11.0	0.002	NA	NA	my5730_rel.cz10a_bee
109845	0	692	110.8	952.2	131.0	0.006	1.033	0.009	1.222	6708	12.2	0.061	9	121.1	137.7	10.4	0.002	NA	NA	my5744_rel.cz10a_bee
l.i1
l.i1: continue load after secondary indexes created with 50 inserts per transaction. Graphs for performance per 1-second interval are here.
Average throughput:
Insert response time histogram: each cell has the percentage of responses that take <= the time in the header and max is the max response time in seconds. For the max column values in the top 25% of the range have a red background and in the bottom 25% of the range have a green background. The red background is not used when the min value is within 80% of the max value.
| dbms | 256us | 1ms | 4ms | 16ms | 64ms | 256ms | 1s | 4s | 16s | gt | max |
|---|---|---|---|---|---|---|---|---|---|---|---|
| my5710_rel.cz10a_bee | 24.575 | 70.234 | 5.191 | 0.251 | |||||||
| my5720_rel.cz10a_bee | 23.384 | 71.421 | 5.194 | 0.001 | 0.266 | ||||||
| my5730_rel.cz10a_bee | 22.980 | 71.529 | 5.489 | 0.003 | 0.348 | ||||||
| my5744_rel.cz10a_bee | 23.245 | 71.362 | 5.389 | 0.004 | 0.337 |
Delete response time histogram: each cell has the percentage of responses that take <= the time in the header and max is the max response time in seconds. For the max column values in the top 25% of the range have a red background and in the bottom 25% of the range have a green background. The red background is not used when the min value is within 80% of the max value.
| dbms | 256us | 1ms | 4ms | 16ms | 64ms | 256ms | 1s | 4s | 16s | gt | max |
|---|---|---|---|---|---|---|---|---|---|---|---|
| my5710_rel.cz10a_bee | 84.642 | 15.163 | 0.188 | 0.007 | 0.128 | ||||||
| my5720_rel.cz10a_bee | 83.526 | 16.286 | 0.186 | 0.001 | 0.140 | ||||||
| my5730_rel.cz10a_bee | 86.684 | 13.071 | 0.239 | 0.006 | 0.077 | ||||||
| my5744_rel.cz10a_bee | 84.528 | 15.205 | 0.261 | 0.006 | 0.103 |
Performance metrics for the DBMS listed above. Some are normalized by throughput, others are not. Legend for results is here.
ips	qps	rps	rmbps	wps	wmbps	rpq	rkbpq	wpi	wkbpi	csps	cpups	cspq	cpupq	dbgb1	dbgb2	rss	maxop	p50	p99	tag
1798	0	9166	143.2	11343.3	369.1	5.096	81.542	6.307	210.151	56714	21.8	31.534	970	150.6	167.2	10.7	0.251	1698	999	my5710_rel.cz10a_bee
1787	0	9112	142.4	11273.1	366.8	5.098	81.569	6.307	210.134	56879	22.0	31.824	985	150.6	167.2	10.7	0.266	1698	999	my5720_rel.cz10a_bee
1723	0	8875	138.7	10972.8	356.6	5.150	82.398	6.367	211.907	56072	21.2	32.538	984	150.3	166.9	10.7	0.348	1648	899	my5730_rel.cz10a_bee
1729	0	8912	139.3	11023.3	358.3	5.154	82.458	6.374	212.163	56825	21.4	32.860	990	150.3	166.8	10.7	0.337	1648	899	my5744_rel.cz10a_bee
l.i2
l.i2: continue load after secondary indexes created with 5 inserts per transaction. Graphs for performance per 1-second interval are here.
Average throughput:
Insert response time histogram: each cell has the percentage of responses that take <= the time in the header and max is the max response time in seconds. For the max column values in the top 25% of the range have a red background and in the bottom 25% of the range have a green background. The red background is not used when the min value is within 80% of the max value.
| dbms | 256us | 1ms | 4ms | 16ms | 64ms | 256ms | 1s | 4s | 16s | gt | max |
|---|---|---|---|---|---|---|---|---|---|---|---|
| my5710_rel.cz10a_bee | 8.330 | 83.292 | 8.013 | 0.364 | 0.001 | 0.092 | |||||
| my5720_rel.cz10a_bee | 6.410 | 84.348 | 8.928 | 0.314 | 0.058 | ||||||
| my5730_rel.cz10a_bee | 6.602 | 84.097 | 8.971 | 0.331 | 0.061 | ||||||
| my5744_rel.cz10a_bee | 6.983 | 83.892 | 8.825 | 0.298 | 0.001 | 0.065 |
Delete response time histogram: each cell has the percentage of responses that take <= the time in the header and max is the max response time in seconds. For the max column values in the top 25% of the range have a red background and in the bottom 25% of the range have a green background. The red background is not used when the min value is within 80% of the max value.
| dbms | 256us | 1ms | 4ms | 16ms | 64ms | 256ms | 1s | 4s | 16s | gt | max |
|---|---|---|---|---|---|---|---|---|---|---|---|
| my5710_rel.cz10a_bee | 58.217 | 41.197 | 0.565 | 0.021 | 0.001 | 0.091 | |||||
| my5720_rel.cz10a_bee | 50.113 | 49.166 | 0.704 | 0.017 | 0.039 | ||||||
| my5730_rel.cz10a_bee | 55.534 | 43.807 | 0.638 | 0.020 | 0.001 | 0.075 | |||||
| my5744_rel.cz10a_bee | 57.111 | 42.193 | 0.678 | 0.018 | 0.064 |
Performance metrics for the DBMS listed above. Some are normalized by throughput, others are not. Legend for results is here.
ips	qps	rps	rmbps	wps	wmbps	rpq	rkbpq	wpi	wkbpi	csps	cpups	cspq	cpupq	dbgb1	dbgb2	rss	maxop	p50	p99	tag
2101	0	7993	124.9	9827.7	309.2	3.805	60.875	4.678	150.701	58110	29.6	27.661	1127	150.8	167.5	10.7	0.092	2073	1764	my5710_rel.cz10a_bee
2008	0	7977	124.6	9769.3	307.4	3.973	63.562	4.865	156.782	58271	29.7	29.019	1183	150.6	167.3	10.7	0.058	1973	1713	my5720_rel.cz10a_bee
2024	0	8087	126.4	9899.2	311.6	3.995	63.920	4.890	157.628	59540	29.5	29.414	1166	150.4	167.1	10.7	0.061	1983	1723	my5730_rel.cz10a_bee
2049	0	8175	127.7	10024.5	315.7	3.990	63.834	4.892	157.758	60660	29.6	29.603	1156	150.3	167.1	10.7	0.065	2028	1709	my5744_rel.cz10a_bee
qr100.L1
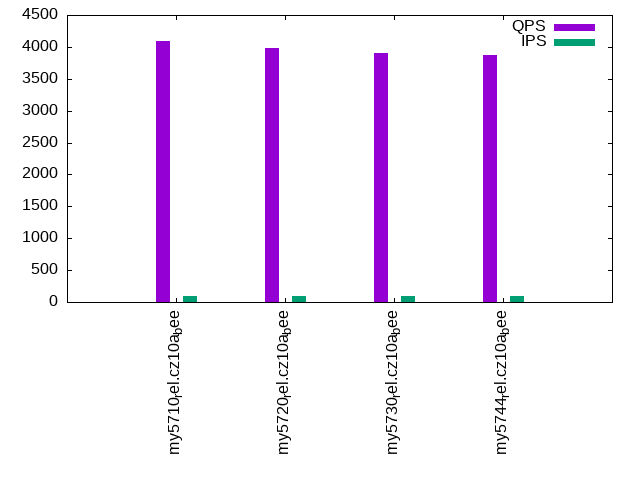
qr100.L1: range queries with 100 insert/s per client. Graphs for performance per 1-second interval are here.
Average throughput:
Query response time histogram: each cell has the percentage of responses that take <= the time in the header and max is the max response time in seconds. For max values in the top 25% of the range have a red background and in the bottom 25% of the range have a green background. The red background is not used when the min value is within 80% of the max value.
| dbms | 256us | 1ms | 4ms | 16ms | 64ms | 256ms | 1s | 4s | 16s | gt | max |
|---|---|---|---|---|---|---|---|---|---|---|---|
| my5710_rel.cz10a_bee | 71.193 | 28.639 | 0.154 | 0.015 | nonzero | 0.037 | |||||
| my5720_rel.cz10a_bee | 67.843 | 31.986 | 0.155 | 0.015 | nonzero | 0.035 | |||||
| my5730_rel.cz10a_bee | 65.037 | 34.793 | 0.155 | 0.016 | nonzero | 0.036 | |||||
| my5744_rel.cz10a_bee | 65.433 | 34.397 | 0.155 | 0.015 | nonzero | 0.034 |
Insert response time histogram: each cell has the percentage of responses that take <= the time in the header and max is the max response time in seconds. For max values in the top 25% of the range have a red background and in the bottom 25% of the range have a green background. The red background is not used when the min value is within 80% of the max value.
| dbms | 256us | 1ms | 4ms | 16ms | 64ms | 256ms | 1s | 4s | 16s | gt | max |
|---|---|---|---|---|---|---|---|---|---|---|---|
| my5710_rel.cz10a_bee | 18.833 | 81.083 | 0.083 | 0.086 | |||||||
| my5720_rel.cz10a_bee | 17.361 | 82.639 | 0.037 | ||||||||
| my5730_rel.cz10a_bee | 19.417 | 80.556 | 0.028 | 0.076 | |||||||
| my5744_rel.cz10a_bee | 25.444 | 74.556 | 0.064 |
Delete response time histogram: each cell has the percentage of responses that take <= the time in the header and max is the max response time in seconds. For max values in the top 25% of the range have a red background and in the bottom 25% of the range have a green background. The red background is not used when the min value is within 80% of the max value.
| dbms | 256us | 1ms | 4ms | 16ms | 64ms | 256ms | 1s | 4s | 16s | gt | max |
|---|---|---|---|---|---|---|---|---|---|---|---|
| my5710_rel.cz10a_bee | 98.417 | 1.361 | 0.222 | 0.028 | |||||||
| my5720_rel.cz10a_bee | 97.611 | 2.389 | 0.013 | ||||||||
| my5730_rel.cz10a_bee | 99.111 | 0.889 | 0.013 | ||||||||
| my5744_rel.cz10a_bee | 98.417 | 1.583 | 0.016 |
Performance metrics for the DBMS listed above. Some are normalized by throughput, others are not. Legend for results is here.
ips	qps	rps	rmbps	wps	wmbps	rpq	rkbpq	wpi	wkbpi	csps	cpups	cspq	cpupq	dbgb1	dbgb2	rss	maxop	p50	p99	tag
100	4090	987	15.4	899.9	27.7	0.241	3.862	9.026	284.571	20679	14.3	5.056	280	150.8	167.5	10.7	0.037	4043	2335	my5710_rel.cz10a_bee
100	3977	877	13.7	760.5	23.5	0.221	3.530	7.628	240.962	19559	14.1	4.918	284	150.6	167.3	10.7	0.035	3948	2493	my5720_rel.cz10a_bee
100	3903	750	11.7	618.3	19.0	0.192	3.074	6.195	194.869	18561	13.9	4.756	285	150.4	167.1	10.7	0.036	3867	2461	my5730_rel.cz10a_bee
100	3870	736	11.5	601.7	18.5	0.190	3.044	6.041	189.905	18404	14.1	4.755	291	150.3	167.1	10.7	0.034	3836	2397	my5744_rel.cz10a_bee
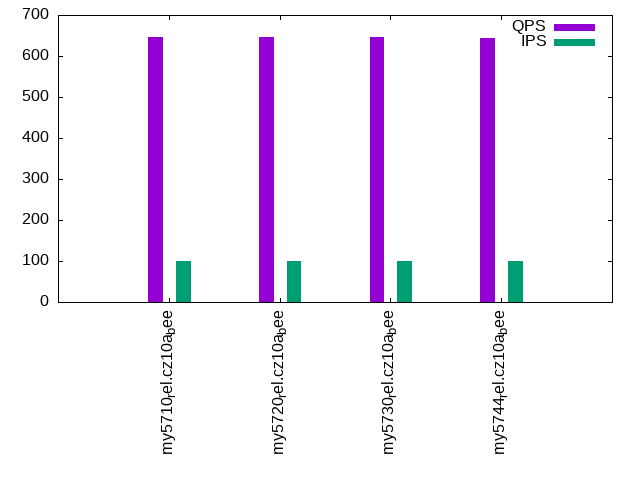
qp100.L2
qp100.L2: point queries with 100 insert/s per client. Graphs for performance per 1-second interval are here.
Average throughput:
Query response time histogram: each cell has the percentage of responses that take <= the time in the header and max is the max response time in seconds. For max values in the top 25% of the range have a red background and in the bottom 25% of the range have a green background. The red background is not used when the min value is within 80% of the max value.
| dbms | 256us | 1ms | 4ms | 16ms | 64ms | 256ms | 1s | 4s | 16s | gt | max |
|---|---|---|---|---|---|---|---|---|---|---|---|
| my5710_rel.cz10a_bee | 0.387 | 99.280 | 0.332 | 0.001 | 0.039 | ||||||
| my5720_rel.cz10a_bee | 0.397 | 99.264 | 0.338 | 0.001 | 0.040 | ||||||
| my5730_rel.cz10a_bee | 0.384 | 99.281 | 0.334 | 0.001 | 0.038 | ||||||
| my5744_rel.cz10a_bee | 0.381 | 99.282 | 0.336 | 0.001 | 0.037 |
Insert response time histogram: each cell has the percentage of responses that take <= the time in the header and max is the max response time in seconds. For max values in the top 25% of the range have a red background and in the bottom 25% of the range have a green background. The red background is not used when the min value is within 80% of the max value.
| dbms | 256us | 1ms | 4ms | 16ms | 64ms | 256ms | 1s | 4s | 16s | gt | max |
|---|---|---|---|---|---|---|---|---|---|---|---|
| my5710_rel.cz10a_bee | 19.278 | 80.722 | 0.060 | ||||||||
| my5720_rel.cz10a_bee | 16.222 | 83.778 | 0.038 | ||||||||
| my5730_rel.cz10a_bee | 18.000 | 82.000 | 0.039 | ||||||||
| my5744_rel.cz10a_bee | 30.056 | 69.944 | 0.052 |
Delete response time histogram: each cell has the percentage of responses that take <= the time in the header and max is the max response time in seconds. For max values in the top 25% of the range have a red background and in the bottom 25% of the range have a green background. The red background is not used when the min value is within 80% of the max value.
| dbms | 256us | 1ms | 4ms | 16ms | 64ms | 256ms | 1s | 4s | 16s | gt | max |
|---|---|---|---|---|---|---|---|---|---|---|---|
| my5710_rel.cz10a_bee | 99.333 | 0.667 | 0.010 | ||||||||
| my5720_rel.cz10a_bee | 99.389 | 0.611 | 0.010 | ||||||||
| my5730_rel.cz10a_bee | 99.556 | 0.444 | 0.010 | ||||||||
| my5744_rel.cz10a_bee | 99.250 | 0.750 | 0.011 |
Performance metrics for the DBMS listed above. Some are normalized by throughput, others are not. Legend for results is here.
ips	qps	rps	rmbps	wps	wmbps	rpq	rkbpq	wpi	wkbpi	csps	cpups	cspq	cpupq	dbgb1	dbgb2	rss	maxop	p50	p99	tag
100	646	6359	99.4	990.6	30.3	9.841	157.463	9.926	310.889	18121	5.4	28.046	669	150.8	167.5	10.7	0.039	655	592	my5710_rel.cz10a_bee
100	647	6369	99.5	986.4	30.2	9.838	157.406	9.884	309.778	18169	5.4	28.064	667	150.6	167.3	10.7	0.040	655	591	my5720_rel.cz10a_bee
100	646	6353	99.3	986.5	30.2	9.841	157.462	9.885	309.392	18202	5.3	28.198	657	150.4	167.1	10.7	0.038	655	591	my5730_rel.cz10a_bee
100	644	6369	99.5	982.2	30.0	9.882	158.107	9.871	309.018	18277	5.5	28.359	683	150.3	167.1	10.7	0.037	655	576	my5744_rel.cz10a_bee
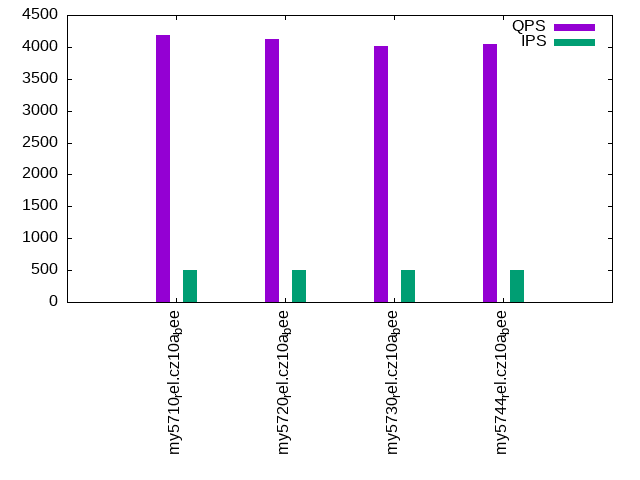
qr500.L3
qr500.L3: range queries with 500 insert/s per client. Graphs for performance per 1-second interval are here.
Average throughput:
Query response time histogram: each cell has the percentage of responses that take <= the time in the header and max is the max response time in seconds. For max values in the top 25% of the range have a red background and in the bottom 25% of the range have a green background. The red background is not used when the min value is within 80% of the max value.
| dbms | 256us | 1ms | 4ms | 16ms | 64ms | 256ms | 1s | 4s | 16s | gt | max |
|---|---|---|---|---|---|---|---|---|---|---|---|
| my5710_rel.cz10a_bee | 74.936 | 24.881 | 0.159 | 0.024 | nonzero | 0.030 | |||||
| my5720_rel.cz10a_bee | 73.117 | 26.694 | 0.163 | 0.026 | nonzero | 0.037 | |||||
| my5730_rel.cz10a_bee | 70.072 | 29.737 | 0.167 | 0.024 | 0.016 | ||||||
| my5744_rel.cz10a_bee | 70.837 | 28.976 | 0.166 | 0.022 | nonzero | 0.024 |
Insert response time histogram: each cell has the percentage of responses that take <= the time in the header and max is the max response time in seconds. For max values in the top 25% of the range have a red background and in the bottom 25% of the range have a green background. The red background is not used when the min value is within 80% of the max value.
| dbms | 256us | 1ms | 4ms | 16ms | 64ms | 256ms | 1s | 4s | 16s | gt | max |
|---|---|---|---|---|---|---|---|---|---|---|---|
| my5710_rel.cz10a_bee | 77.056 | 22.944 | 0.053 | ||||||||
| my5720_rel.cz10a_bee | 71.978 | 28.022 | 0.055 | ||||||||
| my5730_rel.cz10a_bee | 76.700 | 23.300 | 0.040 | ||||||||
| my5744_rel.cz10a_bee | 80.244 | 19.756 | 0.059 |
Delete response time histogram: each cell has the percentage of responses that take <= the time in the header and max is the max response time in seconds. For max values in the top 25% of the range have a red background and in the bottom 25% of the range have a green background. The red background is not used when the min value is within 80% of the max value.
| dbms | 256us | 1ms | 4ms | 16ms | 64ms | 256ms | 1s | 4s | 16s | gt | max |
|---|---|---|---|---|---|---|---|---|---|---|---|
| my5710_rel.cz10a_bee | 99.017 | 0.972 | 0.011 | 0.024 | |||||||
| my5720_rel.cz10a_bee | 98.517 | 1.483 | 0.016 | ||||||||
| my5730_rel.cz10a_bee | 99.106 | 0.894 | 0.012 | ||||||||
| my5744_rel.cz10a_bee | 94.733 | 5.261 | 0.006 | 0.019 |
Performance metrics for the DBMS listed above. Some are normalized by throughput, others are not. Legend for results is here.
ips	qps	rps	rmbps	wps	wmbps	rpq	rkbpq	wpi	wkbpi	csps	cpups	cspq	cpupq	dbgb1	dbgb2	rss	maxop	p50	p99	tag
499	4192	2999	46.9	3214.8	100.2	0.715	11.446	6.445	205.664	32435	18.0	7.738	344	150.8	167.5	10.7	0.030	4142	2590	my5710_rel.cz10a_bee
499	4126	2996	46.8	3211.0	100.1	0.726	11.616	6.440	205.532	32373	18.1	7.846	351	150.6	167.3	10.7	0.037	4077	2509	my5720_rel.cz10a_bee
498	4017	2992	46.8	3207.5	100.0	0.745	11.918	6.445	205.667	32116	18.0	7.995	358	150.4	167.1	10.7	0.016	3980	2413	my5730_rel.cz10a_bee
498	4046	2994	46.8	3213.7	100.1	0.740	11.838	6.457	206.037	32542	18.1	8.042	358	150.3	167.1	10.7	0.024	4012	2412	my5744_rel.cz10a_bee
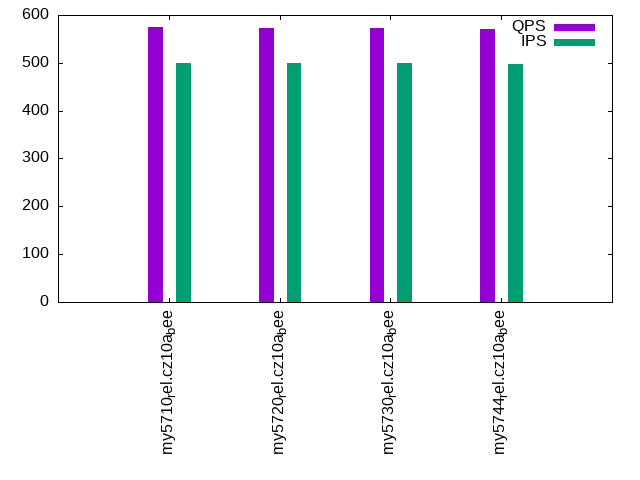
qp500.L4
qp500.L4: point queries with 500 insert/s per client. Graphs for performance per 1-second interval are here.
Average throughput:
Query response time histogram: each cell has the percentage of responses that take <= the time in the header and max is the max response time in seconds. For max values in the top 25% of the range have a red background and in the bottom 25% of the range have a green background. The red background is not used when the min value is within 80% of the max value.
| dbms | 256us | 1ms | 4ms | 16ms | 64ms | 256ms | 1s | 4s | 16s | gt | max |
|---|---|---|---|---|---|---|---|---|---|---|---|
| my5710_rel.cz10a_bee | 0.019 | 97.621 | 2.354 | 0.007 | 0.049 | ||||||
| my5720_rel.cz10a_bee | 0.018 | 97.633 | 2.343 | 0.006 | 0.042 | ||||||
| my5730_rel.cz10a_bee | 0.019 | 97.617 | 2.357 | 0.007 | 0.044 | ||||||
| my5744_rel.cz10a_bee | 0.017 | 97.610 | 2.366 | 0.007 | 0.043 |
Insert response time histogram: each cell has the percentage of responses that take <= the time in the header and max is the max response time in seconds. For max values in the top 25% of the range have a red background and in the bottom 25% of the range have a green background. The red background is not used when the min value is within 80% of the max value.
| dbms | 256us | 1ms | 4ms | 16ms | 64ms | 256ms | 1s | 4s | 16s | gt | max |
|---|---|---|---|---|---|---|---|---|---|---|---|
| my5710_rel.cz10a_bee | 87.667 | 12.289 | 0.044 | 0.089 | |||||||
| my5720_rel.cz10a_bee | 86.222 | 13.739 | 0.039 | 0.077 | |||||||
| my5730_rel.cz10a_bee | 87.006 | 12.961 | 0.033 | 0.091 | |||||||
| my5744_rel.cz10a_bee | 91.033 | 8.939 | 0.028 | 0.077 |
Delete response time histogram: each cell has the percentage of responses that take <= the time in the header and max is the max response time in seconds. For max values in the top 25% of the range have a red background and in the bottom 25% of the range have a green background. The red background is not used when the min value is within 80% of the max value.
| dbms | 256us | 1ms | 4ms | 16ms | 64ms | 256ms | 1s | 4s | 16s | gt | max |
|---|---|---|---|---|---|---|---|---|---|---|---|
| my5710_rel.cz10a_bee | 98.894 | 1.100 | 0.006 | 0.018 | |||||||
| my5720_rel.cz10a_bee | 98.789 | 1.200 | 0.011 | 0.019 | |||||||
| my5730_rel.cz10a_bee | 98.889 | 1.106 | 0.006 | 0.020 | |||||||
| my5744_rel.cz10a_bee | 95.406 | 4.572 | 0.022 | 0.020 |
Performance metrics for the DBMS listed above. Some are normalized by throughput, others are not. Legend for results is here.
ips	qps	rps	rmbps	wps	wmbps	rpq	rkbpq	wpi	wkbpi	csps	cpups	cspq	cpupq	dbgb1	dbgb2	rss	maxop	p50	p99	tag
499	574	8452	132.1	3519.7	108.7	14.717	235.472	7.056	223.241	30224	9.6	52.628	1337	150.8	167.5	10.7	0.049	575	543	my5710_rel.cz10a_bee
499	573	8439	131.9	3518.5	108.7	14.735	235.757	7.054	223.139	30326	9.7	52.952	1355	150.6	167.3	10.7	0.042	575	543	my5720_rel.cz10a_bee
499	573	8439	131.9	3517.1	108.7	14.727	235.635	7.051	223.077	30558	9.7	53.329	1354	150.4	167.1	10.7	0.044	575	543	my5730_rel.cz10a_bee
498	570	8412	131.4	3507.7	108.6	14.770	236.326	7.039	223.225	30753	9.7	54.001	1363	150.3	167.1	10.7	0.043	575	543	my5744_rel.cz10a_bee
qr1000.L5
qr1000.L5: range queries with 1000 insert/s per client. Graphs for performance per 1-second interval are here.
Average throughput:
Query response time histogram: each cell has the percentage of responses that take <= the time in the header and max is the max response time in seconds. For max values in the top 25% of the range have a red background and in the bottom 25% of the range have a green background. The red background is not used when the min value is within 80% of the max value.
| dbms | 256us | 1ms | 4ms | 16ms | 64ms | 256ms | 1s | 4s | 16s | gt | max |
|---|---|---|---|---|---|---|---|---|---|---|---|
| my5710_rel.cz10a_bee | 76.898 | 22.919 | 0.168 | 0.015 | nonzero | 0.033 | |||||
| my5720_rel.cz10a_bee | 74.801 | 25.006 | 0.176 | 0.017 | nonzero | 0.038 | |||||
| my5730_rel.cz10a_bee | 74.973 | 24.842 | 0.171 | 0.014 | nonzero | 0.036 | |||||
| my5744_rel.cz10a_bee | 74.149 | 25.661 | 0.176 | 0.014 | nonzero | 0.034 |
Insert response time histogram: each cell has the percentage of responses that take <= the time in the header and max is the max response time in seconds. For max values in the top 25% of the range have a red background and in the bottom 25% of the range have a green background. The red background is not used when the min value is within 80% of the max value.
| dbms | 256us | 1ms | 4ms | 16ms | 64ms | 256ms | 1s | 4s | 16s | gt | max |
|---|---|---|---|---|---|---|---|---|---|---|---|
| my5710_rel.cz10a_bee | 93.978 | 6.014 | 0.008 | 0.070 | |||||||
| my5720_rel.cz10a_bee | 92.750 | 7.250 | 0.058 | ||||||||
| my5730_rel.cz10a_bee | 92.517 | 7.469 | 0.014 | 0.085 | |||||||
| my5744_rel.cz10a_bee | 91.981 | 8.000 | 0.019 | 0.081 |
Delete response time histogram: each cell has the percentage of responses that take <= the time in the header and max is the max response time in seconds. For max values in the top 25% of the range have a red background and in the bottom 25% of the range have a green background. The red background is not used when the min value is within 80% of the max value.
| dbms | 256us | 1ms | 4ms | 16ms | 64ms | 256ms | 1s | 4s | 16s | gt | max |
|---|---|---|---|---|---|---|---|---|---|---|---|
| my5710_rel.cz10a_bee | 98.217 | 1.742 | 0.042 | 0.036 | |||||||
| my5720_rel.cz10a_bee | 97.861 | 2.136 | 0.003 | 0.021 | |||||||
| my5730_rel.cz10a_bee | 97.431 | 2.539 | 0.031 | 0.049 | |||||||
| my5744_rel.cz10a_bee | 95.925 | 4.056 | 0.019 | 0.046 |
Performance metrics for the DBMS listed above. Some are normalized by throughput, others are not. Legend for results is here.
ips	qps	rps	rmbps	wps	wmbps	rpq	rkbpq	wpi	wkbpi	csps	cpups	cspq	cpupq	dbgb1	dbgb2	rss	maxop	p50	p99	tag
998	4280	5632	88.0	6332.9	196.9	1.316	21.057	6.344	201.960	48392	22.7	11.308	424	150.8	167.5	10.7	0.033	4251	2366	my5710_rel.cz10a_bee
998	4201	5624	87.9	6323.8	196.6	1.339	21.423	6.335	201.662	48541	22.9	11.555	436	150.6	167.3	10.7	0.038	4171	2541	my5720_rel.cz10a_bee
998	4212	5625	87.9	6322.7	196.6	1.335	21.365	6.337	201.740	48747	22.8	11.573	433	150.4	167.1	10.7	0.036	4171	2648	my5730_rel.cz10a_bee
997	4132	5624	87.9	6327.6	196.6	1.361	21.780	6.349	202.023	48905	22.9	11.837	443	150.3	167.1	10.7	0.034	4123	2445	my5744_rel.cz10a_bee
qp1000.L6
qp1000.L6: point queries with 1000 insert/s per client. Graphs for performance per 1-second interval are here.
Average throughput:
Query response time histogram: each cell has the percentage of responses that take <= the time in the header and max is the max response time in seconds. For max values in the top 25% of the range have a red background and in the bottom 25% of the range have a green background. The red background is not used when the min value is within 80% of the max value.
| dbms | 256us | 1ms | 4ms | 16ms | 64ms | 256ms | 1s | 4s | 16s | gt | max |
|---|---|---|---|---|---|---|---|---|---|---|---|
| my5710_rel.cz10a_bee | 0.003 | 95.058 | 4.924 | 0.014 | 0.047 | ||||||
| my5720_rel.cz10a_bee | 0.004 | 95.020 | 4.962 | 0.013 | 0.043 | ||||||
| my5730_rel.cz10a_bee | 0.004 | 94.990 | 4.992 | 0.014 | 0.045 | ||||||
| my5744_rel.cz10a_bee | 0.005 | 94.973 | 5.009 | 0.013 | 0.046 |
Insert response time histogram: each cell has the percentage of responses that take <= the time in the header and max is the max response time in seconds. For max values in the top 25% of the range have a red background and in the bottom 25% of the range have a green background. The red background is not used when the min value is within 80% of the max value.
| dbms | 256us | 1ms | 4ms | 16ms | 64ms | 256ms | 1s | 4s | 16s | gt | max |
|---|---|---|---|---|---|---|---|---|---|---|---|
| my5710_rel.cz10a_bee | 75.117 | 24.714 | 0.169 | 0.100 | |||||||
| my5720_rel.cz10a_bee | 76.436 | 23.394 | 0.169 | 0.094 | |||||||
| my5730_rel.cz10a_bee | 77.008 | 22.819 | 0.172 | 0.085 | |||||||
| my5744_rel.cz10a_bee | 71.981 | 27.814 | 0.206 | 0.089 |
Delete response time histogram: each cell has the percentage of responses that take <= the time in the header and max is the max response time in seconds. For max values in the top 25% of the range have a red background and in the bottom 25% of the range have a green background. The red background is not used when the min value is within 80% of the max value.
| dbms | 256us | 1ms | 4ms | 16ms | 64ms | 256ms | 1s | 4s | 16s | gt | max |
|---|---|---|---|---|---|---|---|---|---|---|---|
| my5710_rel.cz10a_bee | 97.519 | 2.447 | 0.031 | 0.003 | 0.087 | ||||||
| my5720_rel.cz10a_bee | 97.572 | 2.406 | 0.022 | 0.025 | |||||||
| my5730_rel.cz10a_bee | 97.728 | 2.242 | 0.031 | 0.057 | |||||||
| my5744_rel.cz10a_bee | 96.692 | 3.286 | 0.022 | 0.060 |
Performance metrics for the DBMS listed above. Some are normalized by throughput, others are not. Legend for results is here.
ips	qps	rps	rmbps	wps	wmbps	rpq	rkbpq	wpi	wkbpi	csps	cpups	cspq	cpupq	dbgb1	dbgb2	rss	maxop	p50	p99	tag
998	521	10708	167.3	6389.5	196.6	20.549	328.784	6.400	201.645	44653	14.5	85.691	2226	150.8	167.5	10.7	0.047	512	463	my5710_rel.cz10a_bee
998	520	10697	167.1	6381.0	196.5	20.587	329.387	6.392	201.545	44830	14.6	86.278	2248	150.6	167.3	10.7	0.043	512	463	my5720_rel.cz10a_bee
998	520	10702	167.2	6382.6	196.4	20.566	329.051	6.393	201.499	45228	14.6	86.911	2244	150.4	167.1	10.7	0.045	512	463	my5730_rel.cz10a_bee
997	518	10698	167.2	6394.1	196.7	20.638	330.202	6.412	201.993	45667	14.6	88.092	2253	150.3	167.1	10.7	0.046	512	448	my5744_rel.cz10a_bee
l.i0
l.i0: load without secondary indexes
Performance metrics for all DBMS, not just the ones listed above. Some are normalized by throughput, others are not. Legend for results is here.
ips	qps	rps	rmbps	wps	wmbps	rpq	rkbpq	wpi	wkbpi	csps	cpups	cspq	cpupq	dbgb1	dbgb2	rss	maxop	p50	p99	tag
83981	0	0	0.0	433.8	30.4	0.000	0.000	0.005	0.371	9194	21.5	0.109	20	52.6	69.1	10.9	0.120	84306	75616	my5710_rel.cz10a_bee
83255	0	0	0.0	430.2	30.2	0.000	0.000	0.005	0.371	9109	21.6	0.109	21	52.6	69.1	10.9	0.122	83593	74914	my5720_rel.cz10a_bee
80759	0	0	0.0	419.0	29.3	0.000	0.000	0.005	0.371	8855	21.3	0.110	21	52.6	69.1	10.9	0.118	81008	72448	my5730_rel.cz10a_bee
80980	0	0	0.0	420.7	29.4	0.000	0.000	0.005	0.372	9017	21.4	0.111	21	52.6	69.1	10.9	0.121	81352	71824	my5744_rel.cz10a_bee
l.x
l.x: create secondary indexes
Performance metrics for all DBMS, not just the ones listed above. Some are normalized by throughput, others are not. Legend for results is here.
ips	qps	rps	rmbps	wps	wmbps	rpq	rkbpq	wpi	wkbpi	csps	cpups	cspq	cpupq	dbgb1	dbgb2	rss	maxop	p50	p99	tag
113928	0	716	114.5	978.1	135.5	0.006	1.029	0.009	1.218	6586	12.4	0.058	9	121.1	137.7	11.1	0.002	NA	NA	my5710_rel.cz10a_bee
114564	0	716	115.2	974.8	136.2	0.006	1.030	0.009	1.217	6586	12.4	0.057	9	121.1	137.7	11.1	0.002	NA	NA	my5720_rel.cz10a_bee
111467	0	692	112.1	963.6	132.6	0.006	1.029	0.009	1.218	6528	12.0	0.059	9	121.1	137.7	11.0	0.002	NA	NA	my5730_rel.cz10a_bee
109845	0	692	110.8	952.2	131.0	0.006	1.033	0.009	1.222	6708	12.2	0.061	9	121.1	137.7	10.4	0.002	NA	NA	my5744_rel.cz10a_bee
l.i1
l.i1: continue load after secondary indexes created with 50 inserts per transaction
Performance metrics for all DBMS, not just the ones listed above. Some are normalized by throughput, others are not. Legend for results is here.
ips	qps	rps	rmbps	wps	wmbps	rpq	rkbpq	wpi	wkbpi	csps	cpups	cspq	cpupq	dbgb1	dbgb2	rss	maxop	p50	p99	tag
1798	0	9166	143.2	11343.3	369.1	5.096	81.542	6.307	210.151	56714	21.8	31.534	970	150.6	167.2	10.7	0.251	1698	999	my5710_rel.cz10a_bee
1787	0	9112	142.4	11273.1	366.8	5.098	81.569	6.307	210.134	56879	22.0	31.824	985	150.6	167.2	10.7	0.266	1698	999	my5720_rel.cz10a_bee
1723	0	8875	138.7	10972.8	356.6	5.150	82.398	6.367	211.907	56072	21.2	32.538	984	150.3	166.9	10.7	0.348	1648	899	my5730_rel.cz10a_bee
1729	0	8912	139.3	11023.3	358.3	5.154	82.458	6.374	212.163	56825	21.4	32.860	990	150.3	166.8	10.7	0.337	1648	899	my5744_rel.cz10a_bee
l.i2
l.i2: continue load after secondary indexes created with 5 inserts per transaction
Performance metrics for all DBMS, not just the ones listed above. Some are normalized by throughput, others are not. Legend for results is here.
ips	qps	rps	rmbps	wps	wmbps	rpq	rkbpq	wpi	wkbpi	csps	cpups	cspq	cpupq	dbgb1	dbgb2	rss	maxop	p50	p99	tag
2101	0	7993	124.9	9827.7	309.2	3.805	60.875	4.678	150.701	58110	29.6	27.661	1127	150.8	167.5	10.7	0.092	2073	1764	my5710_rel.cz10a_bee
2008	0	7977	124.6	9769.3	307.4	3.973	63.562	4.865	156.782	58271	29.7	29.019	1183	150.6	167.3	10.7	0.058	1973	1713	my5720_rel.cz10a_bee
2024	0	8087	126.4	9899.2	311.6	3.995	63.920	4.890	157.628	59540	29.5	29.414	1166	150.4	167.1	10.7	0.061	1983	1723	my5730_rel.cz10a_bee
2049	0	8175	127.7	10024.5	315.7	3.990	63.834	4.892	157.758	60660	29.6	29.603	1156	150.3	167.1	10.7	0.065	2028	1709	my5744_rel.cz10a_bee
qr100.L1
qr100.L1: range queries with 100 insert/s per client
Performance metrics for all DBMS, not just the ones listed above. Some are normalized by throughput, others are not. Legend for results is here.
ips	qps	rps	rmbps	wps	wmbps	rpq	rkbpq	wpi	wkbpi	csps	cpups	cspq	cpupq	dbgb1	dbgb2	rss	maxop	p50	p99	tag
100	4090	987	15.4	899.9	27.7	0.241	3.862	9.026	284.571	20679	14.3	5.056	280	150.8	167.5	10.7	0.037	4043	2335	my5710_rel.cz10a_bee
100	3977	877	13.7	760.5	23.5	0.221	3.530	7.628	240.962	19559	14.1	4.918	284	150.6	167.3	10.7	0.035	3948	2493	my5720_rel.cz10a_bee
100	3903	750	11.7	618.3	19.0	0.192	3.074	6.195	194.869	18561	13.9	4.756	285	150.4	167.1	10.7	0.036	3867	2461	my5730_rel.cz10a_bee
100	3870	736	11.5	601.7	18.5	0.190	3.044	6.041	189.905	18404	14.1	4.755	291	150.3	167.1	10.7	0.034	3836	2397	my5744_rel.cz10a_bee
qp100.L2
qp100.L2: point queries with 100 insert/s per client
Performance metrics for all DBMS, not just the ones listed above. Some are normalized by throughput, others are not. Legend for results is here.
ips	qps	rps	rmbps	wps	wmbps	rpq	rkbpq	wpi	wkbpi	csps	cpups	cspq	cpupq	dbgb1	dbgb2	rss	maxop	p50	p99	tag
100	646	6359	99.4	990.6	30.3	9.841	157.463	9.926	310.889	18121	5.4	28.046	669	150.8	167.5	10.7	0.039	655	592	my5710_rel.cz10a_bee
100	647	6369	99.5	986.4	30.2	9.838	157.406	9.884	309.778	18169	5.4	28.064	667	150.6	167.3	10.7	0.040	655	591	my5720_rel.cz10a_bee
100	646	6353	99.3	986.5	30.2	9.841	157.462	9.885	309.392	18202	5.3	28.198	657	150.4	167.1	10.7	0.038	655	591	my5730_rel.cz10a_bee
100	644	6369	99.5	982.2	30.0	9.882	158.107	9.871	309.018	18277	5.5	28.359	683	150.3	167.1	10.7	0.037	655	576	my5744_rel.cz10a_bee
qr500.L3
qr500.L3: range queries with 500 insert/s per client
Performance metrics for all DBMS, not just the ones listed above. Some are normalized by throughput, others are not. Legend for results is here.
ips	qps	rps	rmbps	wps	wmbps	rpq	rkbpq	wpi	wkbpi	csps	cpups	cspq	cpupq	dbgb1	dbgb2	rss	maxop	p50	p99	tag
499	4192	2999	46.9	3214.8	100.2	0.715	11.446	6.445	205.664	32435	18.0	7.738	344	150.8	167.5	10.7	0.030	4142	2590	my5710_rel.cz10a_bee
499	4126	2996	46.8	3211.0	100.1	0.726	11.616	6.440	205.532	32373	18.1	7.846	351	150.6	167.3	10.7	0.037	4077	2509	my5720_rel.cz10a_bee
498	4017	2992	46.8	3207.5	100.0	0.745	11.918	6.445	205.667	32116	18.0	7.995	358	150.4	167.1	10.7	0.016	3980	2413	my5730_rel.cz10a_bee
498	4046	2994	46.8	3213.7	100.1	0.740	11.838	6.457	206.037	32542	18.1	8.042	358	150.3	167.1	10.7	0.024	4012	2412	my5744_rel.cz10a_bee
qp500.L4
qp500.L4: point queries with 500 insert/s per client
Performance metrics for all DBMS, not just the ones listed above. Some are normalized by throughput, others are not. Legend for results is here.
ips	qps	rps	rmbps	wps	wmbps	rpq	rkbpq	wpi	wkbpi	csps	cpups	cspq	cpupq	dbgb1	dbgb2	rss	maxop	p50	p99	tag
499	574	8452	132.1	3519.7	108.7	14.717	235.472	7.056	223.241	30224	9.6	52.628	1337	150.8	167.5	10.7	0.049	575	543	my5710_rel.cz10a_bee
499	573	8439	131.9	3518.5	108.7	14.735	235.757	7.054	223.139	30326	9.7	52.952	1355	150.6	167.3	10.7	0.042	575	543	my5720_rel.cz10a_bee
499	573	8439	131.9	3517.1	108.7	14.727	235.635	7.051	223.077	30558	9.7	53.329	1354	150.4	167.1	10.7	0.044	575	543	my5730_rel.cz10a_bee
498	570	8412	131.4	3507.7	108.6	14.770	236.326	7.039	223.225	30753	9.7	54.001	1363	150.3	167.1	10.7	0.043	575	543	my5744_rel.cz10a_bee
qr1000.L5
qr1000.L5: range queries with 1000 insert/s per client
Performance metrics for all DBMS, not just the ones listed above. Some are normalized by throughput, others are not. Legend for results is here.
ips	qps	rps	rmbps	wps	wmbps	rpq	rkbpq	wpi	wkbpi	csps	cpups	cspq	cpupq	dbgb1	dbgb2	rss	maxop	p50	p99	tag
998	4280	5632	88.0	6332.9	196.9	1.316	21.057	6.344	201.960	48392	22.7	11.308	424	150.8	167.5	10.7	0.033	4251	2366	my5710_rel.cz10a_bee
998	4201	5624	87.9	6323.8	196.6	1.339	21.423	6.335	201.662	48541	22.9	11.555	436	150.6	167.3	10.7	0.038	4171	2541	my5720_rel.cz10a_bee
998	4212	5625	87.9	6322.7	196.6	1.335	21.365	6.337	201.740	48747	22.8	11.573	433	150.4	167.1	10.7	0.036	4171	2648	my5730_rel.cz10a_bee
997	4132	5624	87.9	6327.6	196.6	1.361	21.780	6.349	202.023	48905	22.9	11.837	443	150.3	167.1	10.7	0.034	4123	2445	my5744_rel.cz10a_bee
qp1000.L6
qp1000.L6: point queries with 1000 insert/s per client
Performance metrics for all DBMS, not just the ones listed above. Some are normalized by throughput, others are not. Legend for results is here.
ips	qps	rps	rmbps	wps	wmbps	rpq	rkbpq	wpi	wkbpi	csps	cpups	cspq	cpupq	dbgb1	dbgb2	rss	maxop	p50	p99	tag
998	521	10708	167.3	6389.5	196.6	20.549	328.784	6.400	201.645	44653	14.5	85.691	2226	150.8	167.5	10.7	0.047	512	463	my5710_rel.cz10a_bee
998	520	10697	167.1	6381.0	196.5	20.587	329.387	6.392	201.545	44830	14.6	86.278	2248	150.6	167.3	10.7	0.043	512	463	my5720_rel.cz10a_bee
998	520	10702	167.2	6382.6	196.4	20.566	329.051	6.393	201.499	45228	14.6	86.911	2244	150.4	167.1	10.7	0.045	512	463	my5730_rel.cz10a_bee
997	518	10698	167.2	6394.1	196.7	20.638	330.202	6.412	201.993	45667	14.6	88.092	2253	150.3	167.1	10.7	0.046	512	448	my5744_rel.cz10a_bee
l.i0
- l.i0: load without secondary indexes
- Legend for results is here.
- Each entry lists the percentage of responses that fit in that bucket (slower than max time for previous bucket, faster than min time for next bucket).
Insert response time histogram
256us	1ms	4ms	16ms	64ms	256ms	1s	4s	16s	gt	max	tag
0.000	2.011	97.652	0.318	0.016	0.002	0.000	0.000	0.000	0.000	0.120	my5710_rel.cz10a_bee
0.000	0.866	98.795	0.321	0.016	0.002	0.000	0.000	0.000	0.000	0.122	my5720_rel.cz10a_bee
0.000	0.445	99.185	0.220	0.148	0.002	0.000	0.000	0.000	0.000	0.118	my5730_rel.cz10a_bee
0.000	0.415	99.215	0.218	0.149	0.003	0.000	0.000	0.000	0.000	0.121	my5744_rel.cz10a_bee
l.x
- l.x: create secondary indexes
- Legend for results is here.
- Each entry lists the percentage of responses that fit in that bucket (slower than max time for previous bucket, faster than min time for next bucket).
TODO - determine whether there is data for create index response time
l.i1
- l.i1: continue load after secondary indexes created with 50 inserts per transaction
- Legend for results is here.
- Each entry lists the percentage of responses that fit in that bucket (slower than max time for previous bucket, faster than min time for next bucket).
Insert response time histogram
256us	1ms	4ms	16ms	64ms	256ms	1s	4s	16s	gt	max	tag
0.000	0.000	0.000	24.575	70.234	5.191	0.000	0.000	0.000	0.000	0.251	my5710_rel.cz10a_bee
0.000	0.000	0.000	23.384	71.421	5.194	0.001	0.000	0.000	0.000	0.266	my5720_rel.cz10a_bee
0.000	0.000	0.000	22.980	71.529	5.489	0.003	0.000	0.000	0.000	0.348	my5730_rel.cz10a_bee
0.000	0.000	0.000	23.245	71.362	5.389	0.004	0.000	0.000	0.000	0.337	my5744_rel.cz10a_bee
Delete response time histogram
256us	1ms	4ms	16ms	64ms	256ms	1s	4s	16s	gt	max	tag
0.000	0.000	84.642	15.163	0.188	0.007	0.000	0.000	0.000	0.000	0.128	my5710_rel.cz10a_bee
0.000	0.000	83.526	16.286	0.186	0.001	0.000	0.000	0.000	0.000	0.140	my5720_rel.cz10a_bee
0.000	0.000	86.684	13.071	0.239	0.006	0.000	0.000	0.000	0.000	0.077	my5730_rel.cz10a_bee
0.000	0.000	84.528	15.205	0.261	0.006	0.000	0.000	0.000	0.000	0.103	my5744_rel.cz10a_bee
l.i2
- l.i2: continue load after secondary indexes created with 5 inserts per transaction
- Legend for results is here.
- Each entry lists the percentage of responses that fit in that bucket (slower than max time for previous bucket, faster than min time for next bucket).
Insert response time histogram
256us	1ms	4ms	16ms	64ms	256ms	1s	4s	16s	gt	max	tag
0.000	8.330	83.292	8.013	0.364	0.001	0.000	0.000	0.000	0.000	0.092	my5710_rel.cz10a_bee
0.000	6.410	84.348	8.928	0.314	0.000	0.000	0.000	0.000	0.000	0.058	my5720_rel.cz10a_bee
0.000	6.602	84.097	8.971	0.331	0.000	0.000	0.000	0.000	0.000	0.061	my5730_rel.cz10a_bee
0.000	6.983	83.892	8.825	0.298	0.001	0.000	0.000	0.000	0.000	0.065	my5744_rel.cz10a_bee
Delete response time histogram
256us	1ms	4ms	16ms	64ms	256ms	1s	4s	16s	gt	max	tag
0.000	58.217	41.197	0.565	0.021	0.001	0.000	0.000	0.000	0.000	0.091	my5710_rel.cz10a_bee
0.000	50.113	49.166	0.704	0.017	0.000	0.000	0.000	0.000	0.000	0.039	my5720_rel.cz10a_bee
0.000	55.534	43.807	0.638	0.020	0.001	0.000	0.000	0.000	0.000	0.075	my5730_rel.cz10a_bee
0.000	57.111	42.193	0.678	0.018	0.000	0.000	0.000	0.000	0.000	0.064	my5744_rel.cz10a_bee
qr100.L1
- qr100.L1: range queries with 100 insert/s per client
- Legend for results is here.
- Each entry lists the percentage of responses that fit in that bucket (slower than max time for previous bucket, faster than min time for next bucket).
Query response time histogram
256us	1ms	4ms	16ms	64ms	256ms	1s	4s	16s	gt	max	tag
71.193	28.639	0.154	0.015	nonzero	0.000	0.000	0.000	0.000	0.000	0.037	my5710_rel.cz10a_bee
67.843	31.986	0.155	0.015	nonzero	0.000	0.000	0.000	0.000	0.000	0.035	my5720_rel.cz10a_bee
65.037	34.793	0.155	0.016	nonzero	0.000	0.000	0.000	0.000	0.000	0.036	my5730_rel.cz10a_bee
65.433	34.397	0.155	0.015	nonzero	0.000	0.000	0.000	0.000	0.000	0.034	my5744_rel.cz10a_bee
Insert response time histogram
256us	1ms	4ms	16ms	64ms	256ms	1s	4s	16s	gt	max	tag
0.000	0.000	0.000	18.833	81.083	0.083	0.000	0.000	0.000	0.000	0.086	my5710_rel.cz10a_bee
0.000	0.000	0.000	17.361	82.639	0.000	0.000	0.000	0.000	0.000	0.037	my5720_rel.cz10a_bee
0.000	0.000	0.000	19.417	80.556	0.028	0.000	0.000	0.000	0.000	0.076	my5730_rel.cz10a_bee
0.000	0.000	0.000	25.444	74.556	0.000	0.000	0.000	0.000	0.000	0.064	my5744_rel.cz10a_bee
Delete response time histogram
256us	1ms	4ms	16ms	64ms	256ms	1s	4s	16s	gt	max	tag
0.000	0.000	98.417	1.361	0.222	0.000	0.000	0.000	0.000	0.000	0.028	my5710_rel.cz10a_bee
0.000	0.000	97.611	2.389	0.000	0.000	0.000	0.000	0.000	0.000	0.013	my5720_rel.cz10a_bee
0.000	0.000	99.111	0.889	0.000	0.000	0.000	0.000	0.000	0.000	0.013	my5730_rel.cz10a_bee
0.000	0.000	98.417	1.583	0.000	0.000	0.000	0.000	0.000	0.000	0.016	my5744_rel.cz10a_bee
qp100.L2
- qp100.L2: point queries with 100 insert/s per client
- Legend for results is here.
- Each entry lists the percentage of responses that fit in that bucket (slower than max time for previous bucket, faster than min time for next bucket).
Query response time histogram
256us	1ms	4ms	16ms	64ms	256ms	1s	4s	16s	gt	max	tag
0.000	0.387	99.280	0.332	0.001	0.000	0.000	0.000	0.000	0.000	0.039	my5710_rel.cz10a_bee
0.000	0.397	99.264	0.338	0.001	0.000	0.000	0.000	0.000	0.000	0.040	my5720_rel.cz10a_bee
0.000	0.384	99.281	0.334	0.001	0.000	0.000	0.000	0.000	0.000	0.038	my5730_rel.cz10a_bee
0.000	0.381	99.282	0.336	0.001	0.000	0.000	0.000	0.000	0.000	0.037	my5744_rel.cz10a_bee
Insert response time histogram
256us	1ms	4ms	16ms	64ms	256ms	1s	4s	16s	gt	max	tag
0.000	0.000	0.000	19.278	80.722	0.000	0.000	0.000	0.000	0.000	0.060	my5710_rel.cz10a_bee
0.000	0.000	0.000	16.222	83.778	0.000	0.000	0.000	0.000	0.000	0.038	my5720_rel.cz10a_bee
0.000	0.000	0.000	18.000	82.000	0.000	0.000	0.000	0.000	0.000	0.039	my5730_rel.cz10a_bee
0.000	0.000	0.000	30.056	69.944	0.000	0.000	0.000	0.000	0.000	0.052	my5744_rel.cz10a_bee
Delete response time histogram
256us	1ms	4ms	16ms	64ms	256ms	1s	4s	16s	gt	max	tag
0.000	0.000	99.333	0.667	0.000	0.000	0.000	0.000	0.000	0.000	0.010	my5710_rel.cz10a_bee
0.000	0.000	99.389	0.611	0.000	0.000	0.000	0.000	0.000	0.000	0.010	my5720_rel.cz10a_bee
0.000	0.000	99.556	0.444	0.000	0.000	0.000	0.000	0.000	0.000	0.010	my5730_rel.cz10a_bee
0.000	0.000	99.250	0.750	0.000	0.000	0.000	0.000	0.000	0.000	0.011	my5744_rel.cz10a_bee
qr500.L3
- qr500.L3: range queries with 500 insert/s per client
- Legend for results is here.
- Each entry lists the percentage of responses that fit in that bucket (slower than max time for previous bucket, faster than min time for next bucket).
Query response time histogram
256us	1ms	4ms	16ms	64ms	256ms	1s	4s	16s	gt	max	tag
74.936	24.881	0.159	0.024	nonzero	0.000	0.000	0.000	0.000	0.000	0.030	my5710_rel.cz10a_bee
73.117	26.694	0.163	0.026	nonzero	0.000	0.000	0.000	0.000	0.000	0.037	my5720_rel.cz10a_bee
70.072	29.737	0.167	0.024	0.000	0.000	0.000	0.000	0.000	0.000	0.016	my5730_rel.cz10a_bee
70.837	28.976	0.166	0.022	nonzero	0.000	0.000	0.000	0.000	0.000	0.024	my5744_rel.cz10a_bee
Insert response time histogram
256us	1ms	4ms	16ms	64ms	256ms	1s	4s	16s	gt	max	tag
0.000	0.000	0.000	77.056	22.944	0.000	0.000	0.000	0.000	0.000	0.053	my5710_rel.cz10a_bee
0.000	0.000	0.000	71.978	28.022	0.000	0.000	0.000	0.000	0.000	0.055	my5720_rel.cz10a_bee
0.000	0.000	0.000	76.700	23.300	0.000	0.000	0.000	0.000	0.000	0.040	my5730_rel.cz10a_bee
0.000	0.000	0.000	80.244	19.756	0.000	0.000	0.000	0.000	0.000	0.059	my5744_rel.cz10a_bee
Delete response time histogram
256us	1ms	4ms	16ms	64ms	256ms	1s	4s	16s	gt	max	tag
0.000	0.000	99.017	0.972	0.011	0.000	0.000	0.000	0.000	0.000	0.024	my5710_rel.cz10a_bee
0.000	0.000	98.517	1.483	0.000	0.000	0.000	0.000	0.000	0.000	0.016	my5720_rel.cz10a_bee
0.000	0.000	99.106	0.894	0.000	0.000	0.000	0.000	0.000	0.000	0.012	my5730_rel.cz10a_bee
0.000	0.000	94.733	5.261	0.006	0.000	0.000	0.000	0.000	0.000	0.019	my5744_rel.cz10a_bee
qp500.L4
- qp500.L4: point queries with 500 insert/s per client
- Legend for results is here.
- Each entry lists the percentage of responses that fit in that bucket (slower than max time for previous bucket, faster than min time for next bucket).
Query response time histogram
256us	1ms	4ms	16ms	64ms	256ms	1s	4s	16s	gt	max	tag
0.000	0.019	97.621	2.354	0.007	0.000	0.000	0.000	0.000	0.000	0.049	my5710_rel.cz10a_bee
0.000	0.018	97.633	2.343	0.006	0.000	0.000	0.000	0.000	0.000	0.042	my5720_rel.cz10a_bee
0.000	0.019	97.617	2.357	0.007	0.000	0.000	0.000	0.000	0.000	0.044	my5730_rel.cz10a_bee
0.000	0.017	97.610	2.366	0.007	0.000	0.000	0.000	0.000	0.000	0.043	my5744_rel.cz10a_bee
Insert response time histogram
256us	1ms	4ms	16ms	64ms	256ms	1s	4s	16s	gt	max	tag
0.000	0.000	0.000	87.667	12.289	0.044	0.000	0.000	0.000	0.000	0.089	my5710_rel.cz10a_bee
0.000	0.000	0.000	86.222	13.739	0.039	0.000	0.000	0.000	0.000	0.077	my5720_rel.cz10a_bee
0.000	0.000	0.000	87.006	12.961	0.033	0.000	0.000	0.000	0.000	0.091	my5730_rel.cz10a_bee
0.000	0.000	0.000	91.033	8.939	0.028	0.000	0.000	0.000	0.000	0.077	my5744_rel.cz10a_bee
Delete response time histogram
256us	1ms	4ms	16ms	64ms	256ms	1s	4s	16s	gt	max	tag
0.000	0.000	98.894	1.100	0.006	0.000	0.000	0.000	0.000	0.000	0.018	my5710_rel.cz10a_bee
0.000	0.000	98.789	1.200	0.011	0.000	0.000	0.000	0.000	0.000	0.019	my5720_rel.cz10a_bee
0.000	0.000	98.889	1.106	0.006	0.000	0.000	0.000	0.000	0.000	0.020	my5730_rel.cz10a_bee
0.000	0.000	95.406	4.572	0.022	0.000	0.000	0.000	0.000	0.000	0.020	my5744_rel.cz10a_bee
qr1000.L5
- qr1000.L5: range queries with 1000 insert/s per client
- Legend for results is here.
- Each entry lists the percentage of responses that fit in that bucket (slower than max time for previous bucket, faster than min time for next bucket).
Query response time histogram
256us	1ms	4ms	16ms	64ms	256ms	1s	4s	16s	gt	max	tag
76.898	22.919	0.168	0.015	nonzero	0.000	0.000	0.000	0.000	0.000	0.033	my5710_rel.cz10a_bee
74.801	25.006	0.176	0.017	nonzero	0.000	0.000	0.000	0.000	0.000	0.038	my5720_rel.cz10a_bee
74.973	24.842	0.171	0.014	nonzero	0.000	0.000	0.000	0.000	0.000	0.036	my5730_rel.cz10a_bee
74.149	25.661	0.176	0.014	nonzero	0.000	0.000	0.000	0.000	0.000	0.034	my5744_rel.cz10a_bee
Insert response time histogram
256us	1ms	4ms	16ms	64ms	256ms	1s	4s	16s	gt	max	tag
0.000	0.000	0.000	93.978	6.014	0.008	0.000	0.000	0.000	0.000	0.070	my5710_rel.cz10a_bee
0.000	0.000	0.000	92.750	7.250	0.000	0.000	0.000	0.000	0.000	0.058	my5720_rel.cz10a_bee
0.000	0.000	0.000	92.517	7.469	0.014	0.000	0.000	0.000	0.000	0.085	my5730_rel.cz10a_bee
0.000	0.000	0.000	91.981	8.000	0.019	0.000	0.000	0.000	0.000	0.081	my5744_rel.cz10a_bee
Delete response time histogram
256us	1ms	4ms	16ms	64ms	256ms	1s	4s	16s	gt	max	tag
0.000	0.000	98.217	1.742	0.042	0.000	0.000	0.000	0.000	0.000	0.036	my5710_rel.cz10a_bee
0.000	0.000	97.861	2.136	0.003	0.000	0.000	0.000	0.000	0.000	0.021	my5720_rel.cz10a_bee
0.000	0.000	97.431	2.539	0.031	0.000	0.000	0.000	0.000	0.000	0.049	my5730_rel.cz10a_bee
0.000	0.000	95.925	4.056	0.019	0.000	0.000	0.000	0.000	0.000	0.046	my5744_rel.cz10a_bee
qp1000.L6
- qp1000.L6: point queries with 1000 insert/s per client
- Legend for results is here.
- Each entry lists the percentage of responses that fit in that bucket (slower than max time for previous bucket, faster than min time for next bucket).
Query response time histogram
256us	1ms	4ms	16ms	64ms	256ms	1s	4s	16s	gt	max	tag
0.000	0.003	95.058	4.924	0.014	0.000	0.000	0.000	0.000	0.000	0.047	my5710_rel.cz10a_bee
0.000	0.004	95.020	4.962	0.013	0.000	0.000	0.000	0.000	0.000	0.043	my5720_rel.cz10a_bee
0.000	0.004	94.990	4.992	0.014	0.000	0.000	0.000	0.000	0.000	0.045	my5730_rel.cz10a_bee
0.000	0.005	94.973	5.009	0.013	0.000	0.000	0.000	0.000	0.000	0.046	my5744_rel.cz10a_bee
Insert response time histogram
256us	1ms	4ms	16ms	64ms	256ms	1s	4s	16s	gt	max	tag
0.000	0.000	0.000	75.117	24.714	0.169	0.000	0.000	0.000	0.000	0.100	my5710_rel.cz10a_bee
0.000	0.000	0.000	76.436	23.394	0.169	0.000	0.000	0.000	0.000	0.094	my5720_rel.cz10a_bee
0.000	0.000	0.000	77.008	22.819	0.172	0.000	0.000	0.000	0.000	0.085	my5730_rel.cz10a_bee
0.000	0.000	0.000	71.981	27.814	0.206	0.000	0.000	0.000	0.000	0.089	my5744_rel.cz10a_bee
Delete response time histogram
256us	1ms	4ms	16ms	64ms	256ms	1s	4s	16s	gt	max	tag
0.000	0.000	97.519	2.447	0.031	0.003	0.000	0.000	0.000	0.000	0.087	my5710_rel.cz10a_bee
0.000	0.000	97.572	2.406	0.022	0.000	0.000	0.000	0.000	0.000	0.025	my5720_rel.cz10a_bee
0.000	0.000	97.728	2.242	0.031	0.000	0.000	0.000	0.000	0.000	0.057	my5730_rel.cz10a_bee
0.000	0.000	96.692	3.286	0.022	0.000	0.000	0.000	0.000	0.000	0.060	my5744_rel.cz10a_bee