Introduction
This is a report for the insert benchmark with 800M docs and 1 client(s). It is generated by scripts (bash, awk, sed) and Tufte might not be impressed. An overview of the insert benchmark is here and a short update is here. Below, by DBMS, I mean DBMS+version.config. An example is my8020.c10b40 where my means MySQL, 8020 is version 8.0.20 and c10b40 is the name for the configuration file.
The test server has 8 AMD cores, 16G RAM and an NVMe SSD. It is described here as the Beelink. The benchmark was run with 1 client and there were 1 or 3 connections per client (1 for queries or inserts without rate limits, 1+1 for rate limited inserts+deletes). It uses 1 table. It loads 800M rows per table without secondary indexes, creates 3 secondary indexes per table, then inserts 5m rows per table with a delete per insert to avoid growing the table. It then does 6 read+write tests for 1800s each that do queries as fast as possible with 100,100,500,500,1000,1000 inserts/s and the same for deletes/s per client concurrent with the queries. The database is larger than memory. Clients and the DBMS share one server. The per-database configs are in the per-database subdirectories here.
The tested DBMS are:
- my5621_rel.cz10a_bee - MySQL 5.6.21 with InnoDB, rel build that uses CMAKE_BUILD_TYPE=Release, cz10a_bee config
- my5631_rel.cz10a_bee - MySQL 5.6.31 with InnoDB, rel build, cz10a_bee config
- my5641_rel.cz10a_bee - MySQL 5.6.41 with InnoDB, rel build, cz10a_bee config
- my5651_rel.cz10a_bee - MySQL 5.6.51 with InnoDB, rel build, cz10a_bee config
Contents
- Summary
- l.i0: load without secondary indexes
- l.x: create secondary indexes
- l.i1: continue load after secondary indexes created with 50 inserts per transaction
- l.i2: continue load after secondary indexes created with 5 inserts per transaction
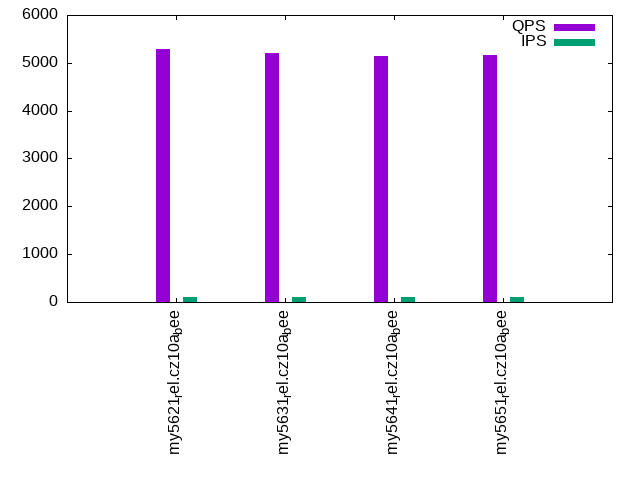
- qr100.L1: range queries with 100 insert/s per client
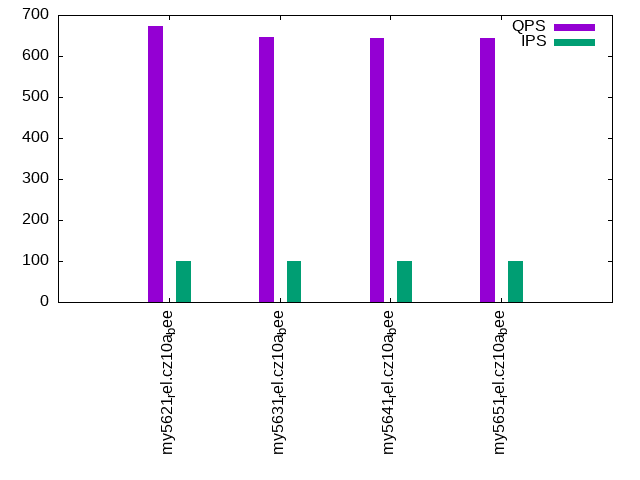
- qp100.L2: point queries with 100 insert/s per client
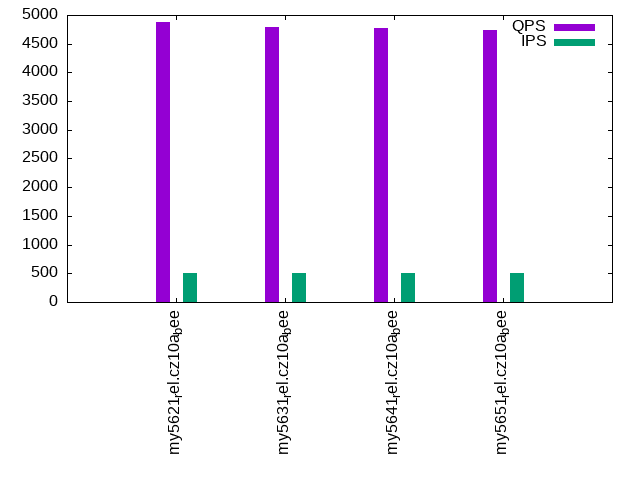
- qr500.L3: range queries with 500 insert/s per client
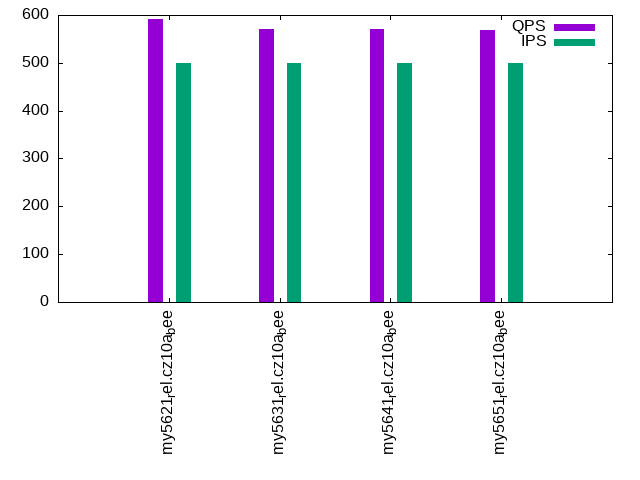
- qp500.L4: point queries with 500 insert/s per client
- qr1000.L5: range queries with 1000 insert/s per client
- qp1000.L6: point queries with 1000 insert/s per client
Summary
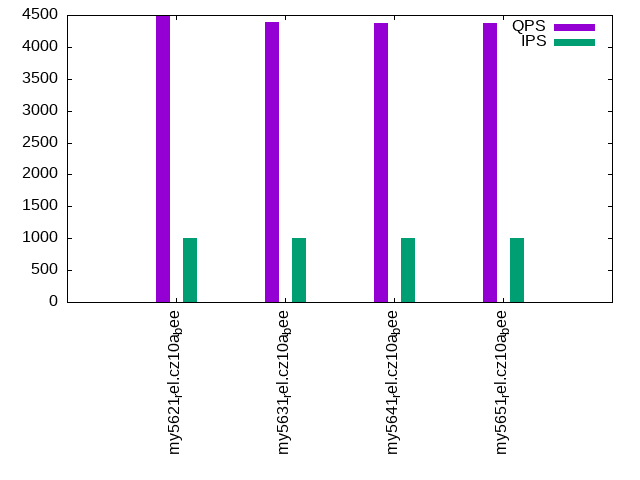
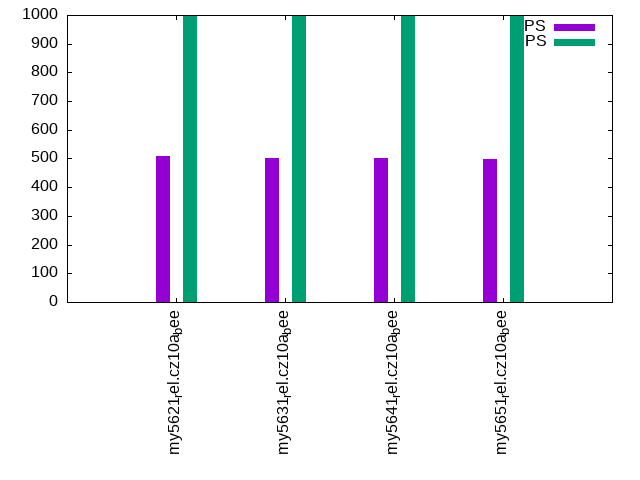
The numbers are inserts/s for l.i0, l.i1 and l.i2, indexed docs (or rows) /s for l.x and queries/s for qr100, qp100 thru qr1000, qp1000" The values are the average rate over the entire test for inserts (IPS) and queries (QPS). The range of values for IPS and QPS is split into 3 parts: bottom 25%, middle 50%, top 25%. Values in the bottom 25% have a red background, values in the top 25% have a green background and values in the middle have no color. A gray background is used for values that can be ignored because the DBMS did not sustain the target insert rate. Red backgrounds are not used when the minimum value is within 80% of the max value.
| dbms | l.i0 | l.x | l.i1 | l.i2 | qr100 | qp100 | qr500 | qp500 | qr1000 | qp1000 |
|---|---|---|---|---|---|---|---|---|---|---|
| my5621_rel.cz10a_bee | 101048 | 80800 | 1332 | 1645 | 5291 | 672 | 4877 | 592 | 4477 | 510 |
| my5631_rel.cz10a_bee | 91880 | 81708 | 1320 | 1621 | 5205 | 647 | 4797 | 570 | 4392 | 502 |
| my5641_rel.cz10a_bee | 92368 | 76518 | 1321 | 1629 | 5152 | 645 | 4770 | 570 | 4382 | 501 |
| my5651_rel.cz10a_bee | 92904 | 81875 | 1327 | 1626 | 5161 | 645 | 4730 | 569 | 4370 | 499 |
This table has relative throughput, throughput for the DBMS relative to the DBMS in the first line, using the absolute throughput from the previous table. Values less than 0.95 have a yellow background. Values greater than 1.05 have a blue background.
| dbms | l.i0 | l.x | l.i1 | l.i2 | qr100 | qp100 | qr500 | qp500 | qr1000 | qp1000 |
|---|---|---|---|---|---|---|---|---|---|---|
| my5621_rel.cz10a_bee | 1.00 | 1.00 | 1.00 | 1.00 | 1.00 | 1.00 | 1.00 | 1.00 | 1.00 | 1.00 |
| my5631_rel.cz10a_bee | 0.91 | 1.01 | 0.99 | 0.99 | 0.98 | 0.96 | 0.98 | 0.96 | 0.98 | 0.98 |
| my5641_rel.cz10a_bee | 0.91 | 0.95 | 0.99 | 0.99 | 0.97 | 0.96 | 0.98 | 0.96 | 0.98 | 0.98 |
| my5651_rel.cz10a_bee | 0.92 | 1.01 | 1.00 | 0.99 | 0.98 | 0.96 | 0.97 | 0.96 | 0.98 | 0.98 |
This lists the average rate of inserts/s for the tests that do inserts concurrent with queries. For such tests the query rate is listed in the table above. The read+write tests are setup so that the insert rate should match the target rate every second. Cells that are not at least 95% of the target have a red background to indicate a failure to satisfy the target.
| dbms | qr100.L1 | qp100.L2 | qr500.L3 | qp500.L4 | qr1000.L5 | qp1000.L6 |
|---|---|---|---|---|---|---|
| my5621_rel.cz10a_bee | 100 | 100 | 499 | 499 | 998 | 998 |
| my5631_rel.cz10a_bee | 100 | 100 | 499 | 499 | 998 | 998 |
| my5641_rel.cz10a_bee | 100 | 100 | 499 | 499 | 998 | 999 |
| my5651_rel.cz10a_bee | 100 | 100 | 499 | 499 | 998 | 998 |
| target | 100 | 100 | 500 | 500 | 1000 | 1000 |
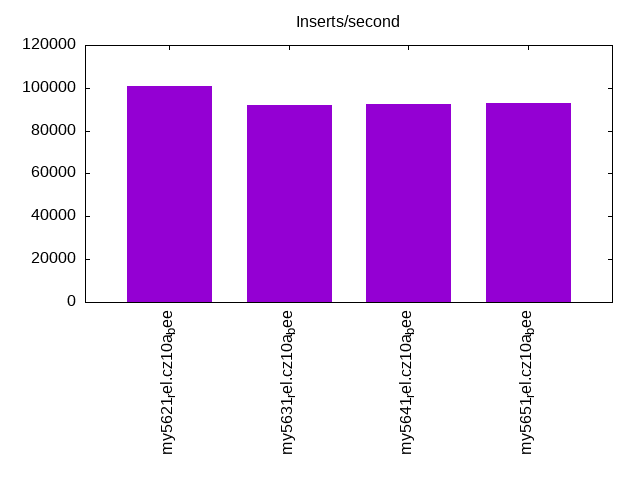
l.i0
l.i0: load without secondary indexes. Graphs for performance per 1-second interval are here.
Average throughput:
Insert response time histogram: each cell has the percentage of responses that take <= the time in the header and max is the max response time in seconds. For the max column values in the top 25% of the range have a red background and in the bottom 25% of the range have a green background. The red background is not used when the min value is within 80% of the max value.
| dbms | 256us | 1ms | 4ms | 16ms | 64ms | 256ms | 1s | 4s | 16s | gt | max |
|---|---|---|---|---|---|---|---|---|---|---|---|
| my5621_rel.cz10a_bee | 92.077 | 7.801 | 0.118 | 0.003 | 0.002 | 0.103 | |||||
| my5631_rel.cz10a_bee | 61.238 | 38.614 | 0.085 | 0.060 | 0.004 | 0.215 | |||||
| my5641_rel.cz10a_bee | 64.912 | 34.941 | 0.083 | 0.060 | 0.004 | 0.184 | |||||
| my5651_rel.cz10a_bee | 70.153 | 29.700 | 0.082 | 0.061 | 0.004 | 0.230 |
Performance metrics for the DBMS listed above. Some are normalized by throughput, others are not. Legend for results is here.
ips	qps	rps	rmbps	wps	wmbps	rpq	rkbpq	wpi	wkbpi	csps	cpups	cspq	cpupq	dbgb1	dbgb2	rss	maxop	p50	p99	tag
101048	0	885	3.5	512.2	36.4	0.009	0.035	0.005	0.369	12625	22.4	0.125	18	52.6	69.1	10.6	0.103	101218	90965	my5621_rel.cz10a_bee
91880	0	804	3.1	459.8	33.2	0.009	0.035	0.005	0.370	11605	21.9	0.126	19	52.6	69.1	10.6	0.215	91908	76270	my5631_rel.cz10a_bee
92368	0	809	3.2	460.8	33.3	0.009	0.035	0.005	0.369	11658	21.9	0.126	19	52.6	69.1	10.6	0.184	92500	76089	my5641_rel.cz10a_bee
92904	0	814	3.2	465.3	33.5	0.009	0.035	0.005	0.370	11744	22.0	0.126	19	52.6	69.1	10.6	0.230	93197	76048	my5651_rel.cz10a_bee
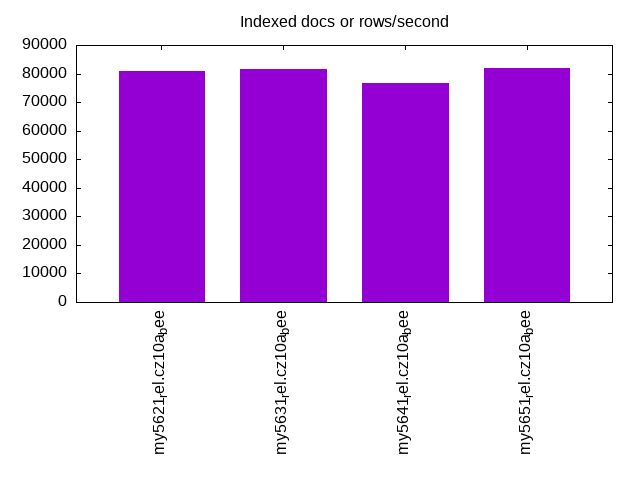
l.x
l.x: create secondary indexes.
Average throughput:
Performance metrics for the DBMS listed above. Some are normalized by throughput, others are not. Legend for results is here.
ips	qps	rps	rmbps	wps	wmbps	rpq	rkbpq	wpi	wkbpi	csps	cpups	cspq	cpupq	dbgb1	dbgb2	rss	maxop	p50	p99	tag
80800	0	568	81.7	708.8	103.6	0.007	1.035	0.009	1.312	1840	11.2	0.023	11	111.4	127.9	10.8	0.002	NA	NA	my5621_rel.cz10a_bee
81708	0	546	82.6	699.6	104.7	0.007	1.035	0.009	1.312	1807	11.3	0.022	11	111.4	127.9	10.8	0.002	NA	NA	my5631_rel.cz10a_bee
76518	0	516	77.4	671.5	98.2	0.007	1.035	0.009	1.315	1788	10.9	0.023	11	111.4	127.9	10.8	0.003	NA	NA	my5641_rel.cz10a_bee
81875	0	550	82.7	709.1	105.0	0.007	1.035	0.009	1.313	1857	11.1	0.023	11	111.4	127.9	10.8	0.003	NA	NA	my5651_rel.cz10a_bee
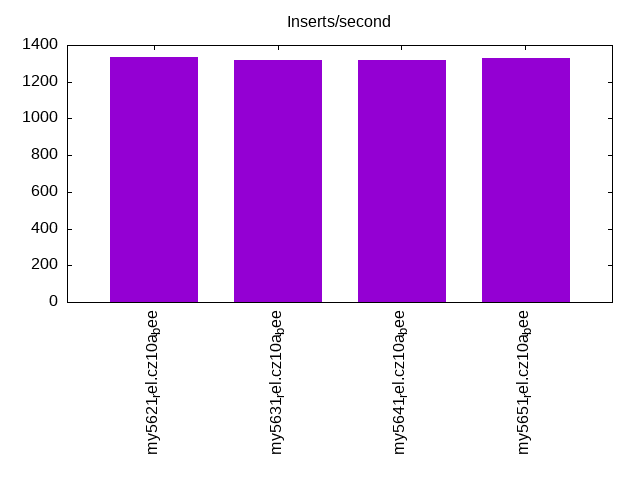
l.i1
l.i1: continue load after secondary indexes created with 50 inserts per transaction. Graphs for performance per 1-second interval are here.
Average throughput:
Insert response time histogram: each cell has the percentage of responses that take <= the time in the header and max is the max response time in seconds. For the max column values in the top 25% of the range have a red background and in the bottom 25% of the range have a green background. The red background is not used when the min value is within 80% of the max value.
| dbms | 256us | 1ms | 4ms | 16ms | 64ms | 256ms | 1s | 4s | 16s | gt | max |
|---|---|---|---|---|---|---|---|---|---|---|---|
| my5621_rel.cz10a_bee | 0.585 | 89.492 | 9.921 | 0.001 | 0.689 | ||||||
| my5631_rel.cz10a_bee | 0.475 | 89.359 | 10.161 | 0.005 | 0.797 | ||||||
| my5641_rel.cz10a_bee | 0.496 | 89.450 | 10.050 | 0.004 | 0.863 | ||||||
| my5651_rel.cz10a_bee | 0.484 | 89.338 | 10.174 | 0.005 | 0.710 |
Delete response time histogram: each cell has the percentage of responses that take <= the time in the header and max is the max response time in seconds. For the max column values in the top 25% of the range have a red background and in the bottom 25% of the range have a green background. The red background is not used when the min value is within 80% of the max value.
| dbms | 256us | 1ms | 4ms | 16ms | 64ms | 256ms | 1s | 4s | 16s | gt | max |
|---|---|---|---|---|---|---|---|---|---|---|---|
| my5621_rel.cz10a_bee | 7.965 | 87.580 | 4.446 | 0.007 | 0.001 | 0.557 | |||||
| my5631_rel.cz10a_bee | 7.706 | 87.669 | 4.617 | 0.006 | 0.001 | 0.639 | |||||
| my5641_rel.cz10a_bee | 7.303 | 88.135 | 4.553 | 0.009 | 0.001 | 0.681 | |||||
| my5651_rel.cz10a_bee | 6.101 | 89.356 | 4.539 | 0.003 | 0.001 | 0.588 |
Performance metrics for the DBMS listed above. Some are normalized by throughput, others are not. Legend for results is here.
ips	qps	rps	rmbps	wps	wmbps	rpq	rkbpq	wpi	wkbpi	csps	cpups	cspq	cpupq	dbgb1	dbgb2	rss	maxop	p50	p99	tag
1332	0	7474	116.2	9084.5	296.7	5.613	89.362	6.823	228.150	42966	14.2	32.269	853	148.0	164.5	10.5	0.689	1249	899	my5621_rel.cz10a_bee
1320	0	7426	115.5	9092.6	294.6	5.624	89.532	6.886	228.446	42609	14.2	32.267	860	147.9	164.4	10.5	0.797	1249	849	my5631_rel.cz10a_bee
1321	0	7430	115.5	9109.5	295.0	5.623	89.523	6.894	228.597	42852	14.2	32.429	860	147.9	164.4	10.5	0.863	1249	849	my5641_rel.cz10a_bee
1327	0	7445	115.8	9122.0	295.5	5.612	89.348	6.876	228.071	43015	14.3	32.425	862	148.0	164.5	10.5	0.710	1249	849	my5651_rel.cz10a_bee
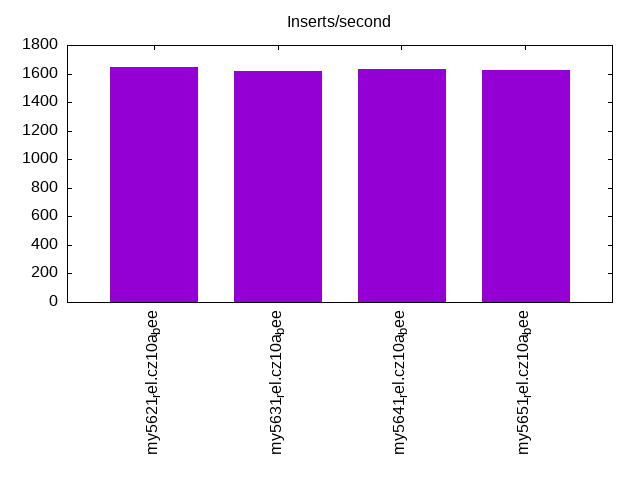
l.i2
l.i2: continue load after secondary indexes created with 5 inserts per transaction. Graphs for performance per 1-second interval are here.
Average throughput:
Insert response time histogram: each cell has the percentage of responses that take <= the time in the header and max is the max response time in seconds. For the max column values in the top 25% of the range have a red background and in the bottom 25% of the range have a green background. The red background is not used when the min value is within 80% of the max value.
| dbms | 256us | 1ms | 4ms | 16ms | 64ms | 256ms | 1s | 4s | 16s | gt | max |
|---|---|---|---|---|---|---|---|---|---|---|---|
| my5621_rel.cz10a_bee | 3.379 | 82.553 | 13.617 | 0.451 | 0.001 | 0.066 | |||||
| my5631_rel.cz10a_bee | 3.125 | 82.522 | 13.857 | 0.496 | 0.062 | ||||||
| my5641_rel.cz10a_bee | 3.193 | 82.624 | 13.713 | 0.470 | 0.001 | 0.065 | |||||
| my5651_rel.cz10a_bee | 3.236 | 82.431 | 13.881 | 0.452 | 0.061 |
Delete response time histogram: each cell has the percentage of responses that take <= the time in the header and max is the max response time in seconds. For the max column values in the top 25% of the range have a red background and in the bottom 25% of the range have a green background. The red background is not used when the min value is within 80% of the max value.
| dbms | 256us | 1ms | 4ms | 16ms | 64ms | 256ms | 1s | 4s | 16s | gt | max |
|---|---|---|---|---|---|---|---|---|---|---|---|
| my5621_rel.cz10a_bee | 19.262 | 77.797 | 2.847 | 0.093 | 0.058 | ||||||
| my5631_rel.cz10a_bee | 17.482 | 79.429 | 2.968 | 0.121 | 0.061 | ||||||
| my5641_rel.cz10a_bee | 18.896 | 78.067 | 2.939 | 0.099 | 0.061 | ||||||
| my5651_rel.cz10a_bee | 18.626 | 78.331 | 2.943 | 0.101 | 0.044 |
Performance metrics for the DBMS listed above. Some are normalized by throughput, others are not. Legend for results is here.
ips	qps	rps	rmbps	wps	wmbps	rpq	rkbpq	wpi	wkbpi	csps	cpups	cspq	cpupq	dbgb1	dbgb2	rss	maxop	p50	p99	tag
1645	0	7757	115.2	8791.9	275.6	4.716	71.734	5.346	171.567	48881	20.8	29.720	1012	148.0	164.5	10.5	0.066	1663	1344	my5621_rel.cz10a_bee
1621	0	7674	114.0	8766.9	272.5	4.735	72.039	5.409	172.160	48228	20.8	29.758	1027	147.9	164.5	10.5	0.062	1638	1328	my5631_rel.cz10a_bee
1629	0	7698	114.4	8814.6	273.5	4.727	71.909	5.412	171.958	48528	20.8	29.797	1022	147.9	164.4	10.5	0.065	1644	1333	my5641_rel.cz10a_bee
1626	0	7700	114.4	8779.8	272.8	4.735	72.047	5.400	171.814	48447	20.8	29.795	1023	148.0	164.5	10.5	0.061	1643	1334	my5651_rel.cz10a_bee
qr100.L1
qr100.L1: range queries with 100 insert/s per client. Graphs for performance per 1-second interval are here.
Average throughput:
Query response time histogram: each cell has the percentage of responses that take <= the time in the header and max is the max response time in seconds. For max values in the top 25% of the range have a red background and in the bottom 25% of the range have a green background. The red background is not used when the min value is within 80% of the max value.
| dbms | 256us | 1ms | 4ms | 16ms | 64ms | 256ms | 1s | 4s | 16s | gt | max |
|---|---|---|---|---|---|---|---|---|---|---|---|
| my5621_rel.cz10a_bee | 94.658 | 5.190 | 0.136 | 0.015 | nonzero | 0.020 | |||||
| my5631_rel.cz10a_bee | 94.125 | 5.727 | 0.132 | 0.015 | nonzero | 0.023 | |||||
| my5641_rel.cz10a_bee | 93.917 | 5.934 | 0.134 | 0.015 | nonzero | 0.019 | |||||
| my5651_rel.cz10a_bee | 93.948 | 5.898 | 0.137 | 0.017 | nonzero | 0.017 |
Insert response time histogram: each cell has the percentage of responses that take <= the time in the header and max is the max response time in seconds. For max values in the top 25% of the range have a red background and in the bottom 25% of the range have a green background. The red background is not used when the min value is within 80% of the max value.
| dbms | 256us | 1ms | 4ms | 16ms | 64ms | 256ms | 1s | 4s | 16s | gt | max |
|---|---|---|---|---|---|---|---|---|---|---|---|
| my5621_rel.cz10a_bee | 0.083 | 99.778 | 0.139 | 0.083 | |||||||
| my5631_rel.cz10a_bee | 0.056 | 99.528 | 0.417 | 0.128 | |||||||
| my5641_rel.cz10a_bee | 0.167 | 99.778 | 0.056 | 0.075 | |||||||
| my5651_rel.cz10a_bee | 0.222 | 99.583 | 0.194 | 0.107 |
Delete response time histogram: each cell has the percentage of responses that take <= the time in the header and max is the max response time in seconds. For max values in the top 25% of the range have a red background and in the bottom 25% of the range have a green background. The red background is not used when the min value is within 80% of the max value.
| dbms | 256us | 1ms | 4ms | 16ms | 64ms | 256ms | 1s | 4s | 16s | gt | max |
|---|---|---|---|---|---|---|---|---|---|---|---|
| my5621_rel.cz10a_bee | 17.278 | 80.972 | 1.750 | 0.040 | |||||||
| my5631_rel.cz10a_bee | 15.889 | 81.722 | 2.389 | 0.045 | |||||||
| my5641_rel.cz10a_bee | 17.389 | 81.361 | 1.250 | 0.034 | |||||||
| my5651_rel.cz10a_bee | 17.500 | 80.611 | 1.889 | 0.035 |
Performance metrics for the DBMS listed above. Some are normalized by throughput, others are not. Legend for results is here.
ips	qps	rps	rmbps	wps	wmbps	rpq	rkbpq	wpi	wkbpi	csps	cpups	cspq	cpupq	dbgb1	dbgb2	rss	maxop	p50	p99	tag
100	5291	632	9.8	552.0	17.2	0.119	1.900	5.531	176.057	23201	13.1	4.385	198	148.0	164.5	10.5	0.020	5290	3772	my5621_rel.cz10a_bee
100	5205	631	9.8	647.0	19.9	0.121	1.930	6.490	204.354	23198	13.2	4.457	203	147.9	164.5	10.5	0.023	5198	3292	my5631_rel.cz10a_bee
100	5152	631	9.8	556.0	17.1	0.122	1.947	5.571	175.954	22676	13.0	4.401	202	147.9	164.4	10.5	0.019	5147	3419	my5641_rel.cz10a_bee
100	5161	632	9.8	622.4	19.1	0.122	1.947	6.237	196.355	22923	13.2	4.442	205	148.0	164.5	10.5	0.017	5162	3261	my5651_rel.cz10a_bee
qp100.L2
qp100.L2: point queries with 100 insert/s per client. Graphs for performance per 1-second interval are here.
Average throughput:
Query response time histogram: each cell has the percentage of responses that take <= the time in the header and max is the max response time in seconds. For max values in the top 25% of the range have a red background and in the bottom 25% of the range have a green background. The red background is not used when the min value is within 80% of the max value.
| dbms | 256us | 1ms | 4ms | 16ms | 64ms | 256ms | 1s | 4s | 16s | gt | max |
|---|---|---|---|---|---|---|---|---|---|---|---|
| my5621_rel.cz10a_bee | 0.874 | 98.899 | 0.226 | 0.001 | 0.037 | ||||||
| my5631_rel.cz10a_bee | 0.561 | 99.203 | 0.235 | 0.001 | 0.036 | ||||||
| my5641_rel.cz10a_bee | 0.500 | 99.279 | 0.220 | 0.001 | 0.039 | ||||||
| my5651_rel.cz10a_bee | 0.527 | 99.236 | 0.236 | 0.001 | 0.036 |
Insert response time histogram: each cell has the percentage of responses that take <= the time in the header and max is the max response time in seconds. For max values in the top 25% of the range have a red background and in the bottom 25% of the range have a green background. The red background is not used when the min value is within 80% of the max value.
| dbms | 256us | 1ms | 4ms | 16ms | 64ms | 256ms | 1s | 4s | 16s | gt | max |
|---|---|---|---|---|---|---|---|---|---|---|---|
| my5621_rel.cz10a_bee | 0.278 | 99.389 | 0.333 | 0.115 | |||||||
| my5631_rel.cz10a_bee | 0.111 | 99.639 | 0.250 | 0.082 | |||||||
| my5641_rel.cz10a_bee | 0.167 | 99.500 | 0.333 | 0.098 | |||||||
| my5651_rel.cz10a_bee | 0.083 | 99.611 | 0.306 | 0.094 |
Delete response time histogram: each cell has the percentage of responses that take <= the time in the header and max is the max response time in seconds. For max values in the top 25% of the range have a red background and in the bottom 25% of the range have a green background. The red background is not used when the min value is within 80% of the max value.
| dbms | 256us | 1ms | 4ms | 16ms | 64ms | 256ms | 1s | 4s | 16s | gt | max |
|---|---|---|---|---|---|---|---|---|---|---|---|
| my5621_rel.cz10a_bee | 62.472 | 37.028 | 0.472 | 0.028 | 0.070 | ||||||
| my5631_rel.cz10a_bee | 58.222 | 41.111 | 0.667 | 0.049 | |||||||
| my5641_rel.cz10a_bee | 66.000 | 33.444 | 0.556 | 0.055 | |||||||
| my5651_rel.cz10a_bee | 66.194 | 33.500 | 0.306 | 0.041 |
Performance metrics for the DBMS listed above. Some are normalized by throughput, others are not. Legend for results is here.
ips	qps	rps	rmbps	wps	wmbps	rpq	rkbpq	wpi	wkbpi	csps	cpups	cspq	cpupq	dbgb1	dbgb2	rss	maxop	p50	p99	tag
100	672	6554	102.4	994.2	30.5	9.758	156.047	9.962	313.152	18215	4.7	27.118	560	148.0	164.5	10.5	0.037	672	575	my5621_rel.cz10a_bee
100	647	6343	99.1	864.9	26.3	9.799	156.709	8.666	270.225	17277	4.6	26.692	569	147.9	164.5	10.5	0.036	655	591	my5631_rel.cz10a_bee
100	645	6333	98.9	965.4	29.4	9.818	157.006	9.673	301.912	17582	4.5	27.259	558	147.9	164.4	10.5	0.039	655	559	my5641_rel.cz10a_bee
100	645	6327	98.8	888.5	27.0	9.811	156.891	8.903	277.307	17310	4.7	26.842	583	148.0	164.5	10.5	0.036	655	591	my5651_rel.cz10a_bee
qr500.L3
qr500.L3: range queries with 500 insert/s per client. Graphs for performance per 1-second interval are here.
Average throughput:
Query response time histogram: each cell has the percentage of responses that take <= the time in the header and max is the max response time in seconds. For max values in the top 25% of the range have a red background and in the bottom 25% of the range have a green background. The red background is not used when the min value is within 80% of the max value.
| dbms | 256us | 1ms | 4ms | 16ms | 64ms | 256ms | 1s | 4s | 16s | gt | max |
|---|---|---|---|---|---|---|---|---|---|---|---|
| my5621_rel.cz10a_bee | 89.493 | 10.245 | 0.235 | 0.027 | 0.013 | ||||||
| my5631_rel.cz10a_bee | 88.787 | 10.945 | 0.239 | 0.028 | nonzero | 0.036 | |||||
| my5641_rel.cz10a_bee | 88.673 | 11.048 | 0.251 | 0.027 | nonzero | 0.017 | |||||
| my5651_rel.cz10a_bee | 88.236 | 11.477 | 0.259 | 0.028 | nonzero | 0.039 |
Insert response time histogram: each cell has the percentage of responses that take <= the time in the header and max is the max response time in seconds. For max values in the top 25% of the range have a red background and in the bottom 25% of the range have a green background. The red background is not used when the min value is within 80% of the max value.
| dbms | 256us | 1ms | 4ms | 16ms | 64ms | 256ms | 1s | 4s | 16s | gt | max |
|---|---|---|---|---|---|---|---|---|---|---|---|
| my5621_rel.cz10a_bee | 6.639 | 93.328 | 0.033 | 0.072 | |||||||
| my5631_rel.cz10a_bee | 5.689 | 94.272 | 0.039 | 0.089 | |||||||
| my5641_rel.cz10a_bee | 5.383 | 94.567 | 0.050 | 0.074 | |||||||
| my5651_rel.cz10a_bee | 5.694 | 94.211 | 0.094 | 0.079 |
Delete response time histogram: each cell has the percentage of responses that take <= the time in the header and max is the max response time in seconds. For max values in the top 25% of the range have a red background and in the bottom 25% of the range have a green background. The red background is not used when the min value is within 80% of the max value.
| dbms | 256us | 1ms | 4ms | 16ms | 64ms | 256ms | 1s | 4s | 16s | gt | max |
|---|---|---|---|---|---|---|---|---|---|---|---|
| my5621_rel.cz10a_bee | 14.367 | 85.361 | 0.272 | 0.028 | |||||||
| my5631_rel.cz10a_bee | 13.822 | 85.917 | 0.261 | 0.027 | |||||||
| my5641_rel.cz10a_bee | 11.967 | 87.739 | 0.294 | 0.029 | |||||||
| my5651_rel.cz10a_bee | 12.522 | 86.994 | 0.483 | 0.035 |
Performance metrics for the DBMS listed above. Some are normalized by throughput, others are not. Legend for results is here.
ips	qps	rps	rmbps	wps	wmbps	rpq	rkbpq	wpi	wkbpi	csps	cpups	cspq	cpupq	dbgb1	dbgb2	rss	maxop	p50	p99	tag
499	4877	2978	46.3	3115.4	96.8	0.611	9.723	6.246	198.693	33746	16.6	6.919	272	148.0	164.5	10.5	0.013	4891	2955	my5621_rel.cz10a_bee
499	4797	2978	46.3	3154.2	97.1	0.621	9.886	6.324	199.369	33469	16.6	6.977	277	147.9	164.5	10.5	0.036	4811	2876	my5631_rel.cz10a_bee
499	4770	2978	46.3	3167.7	97.5	0.624	9.945	6.351	200.165	33399	16.6	7.003	278	147.9	164.4	10.5	0.017	4783	2855	my5641_rel.cz10a_bee
499	4730	2978	46.3	3168.8	97.5	0.630	10.025	6.349	200.063	33261	16.6	7.031	281	148.0	164.5	10.5	0.039	4747	2812	my5651_rel.cz10a_bee
qp500.L4
qp500.L4: point queries with 500 insert/s per client. Graphs for performance per 1-second interval are here.
Average throughput:
Query response time histogram: each cell has the percentage of responses that take <= the time in the header and max is the max response time in seconds. For max values in the top 25% of the range have a red background and in the bottom 25% of the range have a green background. The red background is not used when the min value is within 80% of the max value.
| dbms | 256us | 1ms | 4ms | 16ms | 64ms | 256ms | 1s | 4s | 16s | gt | max |
|---|---|---|---|---|---|---|---|---|---|---|---|
| my5621_rel.cz10a_bee | 0.060 | 97.954 | 1.979 | 0.007 | 0.044 | ||||||
| my5631_rel.cz10a_bee | 0.033 | 97.757 | 2.203 | 0.007 | 0.043 | ||||||
| my5641_rel.cz10a_bee | 0.033 | 97.752 | 2.207 | 0.008 | 0.047 | ||||||
| my5651_rel.cz10a_bee | 0.028 | 97.769 | 2.195 | 0.007 | 0.047 |
Insert response time histogram: each cell has the percentage of responses that take <= the time in the header and max is the max response time in seconds. For max values in the top 25% of the range have a red background and in the bottom 25% of the range have a green background. The red background is not used when the min value is within 80% of the max value.
| dbms | 256us | 1ms | 4ms | 16ms | 64ms | 256ms | 1s | 4s | 16s | gt | max |
|---|---|---|---|---|---|---|---|---|---|---|---|
| my5621_rel.cz10a_bee | 4.894 | 94.283 | 0.822 | 0.142 | |||||||
| my5631_rel.cz10a_bee | 4.739 | 94.183 | 1.078 | 0.116 | |||||||
| my5641_rel.cz10a_bee | 4.111 | 94.528 | 1.361 | 0.117 | |||||||
| my5651_rel.cz10a_bee | 4.972 | 94.261 | 0.767 | 0.116 |
Delete response time histogram: each cell has the percentage of responses that take <= the time in the header and max is the max response time in seconds. For max values in the top 25% of the range have a red background and in the bottom 25% of the range have a green background. The red background is not used when the min value is within 80% of the max value.
| dbms | 256us | 1ms | 4ms | 16ms | 64ms | 256ms | 1s | 4s | 16s | gt | max |
|---|---|---|---|---|---|---|---|---|---|---|---|
| my5621_rel.cz10a_bee | 24.906 | 72.711 | 2.383 | 0.061 | |||||||
| my5631_rel.cz10a_bee | 23.906 | 73.400 | 2.694 | 0.050 | |||||||
| my5641_rel.cz10a_bee | 23.994 | 73.400 | 2.600 | 0.006 | 0.085 | ||||||
| my5651_rel.cz10a_bee | 23.094 | 74.089 | 2.817 | 0.062 |
Performance metrics for the DBMS listed above. Some are normalized by throughput, others are not. Legend for results is here.
ips	qps	rps	rmbps	wps	wmbps	rpq	rkbpq	wpi	wkbpi	csps	cpups	cspq	cpupq	dbgb1	dbgb2	rss	maxop	p50	p99	tag
499	592	8592	134.0	3487.4	107.7	14.526	232.035	6.992	221.138	28846	8.1	48.768	1096	148.0	164.5	10.5	0.044	591	559	my5621_rel.cz10a_bee
499	570	8400	131.0	3514.1	107.6	14.729	235.275	7.045	220.809	28392	8.1	49.784	1136	147.9	164.5	10.5	0.043	575	543	my5631_rel.cz10a_bee
499	570	8392	130.9	3514.7	107.6	14.727	235.237	7.042	220.701	28410	8.2	49.859	1151	147.9	164.4	10.5	0.047	575	543	my5641_rel.cz10a_bee
499	569	8390	130.9	3516.2	107.6	14.742	235.477	7.045	220.797	28420	8.1	49.939	1139	148.0	164.5	10.5	0.047	575	543	my5651_rel.cz10a_bee
qr1000.L5
qr1000.L5: range queries with 1000 insert/s per client. Graphs for performance per 1-second interval are here.
Average throughput:
Query response time histogram: each cell has the percentage of responses that take <= the time in the header and max is the max response time in seconds. For max values in the top 25% of the range have a red background and in the bottom 25% of the range have a green background. The red background is not used when the min value is within 80% of the max value.
| dbms | 256us | 1ms | 4ms | 16ms | 64ms | 256ms | 1s | 4s | 16s | gt | max |
|---|---|---|---|---|---|---|---|---|---|---|---|
| my5621_rel.cz10a_bee | 83.099 | 16.478 | 0.399 | 0.024 | nonzero | 0.048 | |||||
| my5631_rel.cz10a_bee | 81.805 | 17.763 | 0.409 | 0.024 | nonzero | 0.037 | |||||
| my5641_rel.cz10a_bee | 81.626 | 17.951 | 0.402 | 0.021 | nonzero | 0.038 | |||||
| my5651_rel.cz10a_bee | 81.667 | 17.919 | 0.392 | 0.021 | nonzero | 0.034 |
Insert response time histogram: each cell has the percentage of responses that take <= the time in the header and max is the max response time in seconds. For max values in the top 25% of the range have a red background and in the bottom 25% of the range have a green background. The red background is not used when the min value is within 80% of the max value.
| dbms | 256us | 1ms | 4ms | 16ms | 64ms | 256ms | 1s | 4s | 16s | gt | max |
|---|---|---|---|---|---|---|---|---|---|---|---|
| my5621_rel.cz10a_bee | 27.506 | 72.186 | 0.308 | 0.119 | |||||||
| my5631_rel.cz10a_bee | 25.214 | 74.497 | 0.289 | 0.100 | |||||||
| my5641_rel.cz10a_bee | 24.442 | 75.278 | 0.281 | 0.112 | |||||||
| my5651_rel.cz10a_bee | 25.397 | 74.311 | 0.292 | 0.107 |
Delete response time histogram: each cell has the percentage of responses that take <= the time in the header and max is the max response time in seconds. For max values in the top 25% of the range have a red background and in the bottom 25% of the range have a green background. The red background is not used when the min value is within 80% of the max value.
| dbms | 256us | 1ms | 4ms | 16ms | 64ms | 256ms | 1s | 4s | 16s | gt | max |
|---|---|---|---|---|---|---|---|---|---|---|---|
| my5621_rel.cz10a_bee | 14.575 | 84.967 | 0.458 | 0.043 | |||||||
| my5631_rel.cz10a_bee | 12.911 | 86.633 | 0.456 | 0.054 | |||||||
| my5641_rel.cz10a_bee | 12.492 | 87.072 | 0.436 | 0.048 | |||||||
| my5651_rel.cz10a_bee | 12.594 | 86.919 | 0.486 | 0.055 |
Performance metrics for the DBMS listed above. Some are normalized by throughput, others are not. Legend for results is here.
ips	qps	rps	rmbps	wps	wmbps	rpq	rkbpq	wpi	wkbpi	csps	cpups	cspq	cpupq	dbgb1	dbgb2	rss	maxop	p50	p99	tag
998	4477	5636	87.6	6272.2	194.0	1.259	20.044	6.283	199.013	47624	20.3	10.637	363	148.0	164.5	10.5	0.048	4571	2347	my5621_rel.cz10a_bee
998	4392	5637	87.6	6332.6	194.1	1.283	20.434	6.347	199.264	47330	20.3	10.775	370	147.9	164.5	10.5	0.037	4475	2367	my5631_rel.cz10a_bee
998	4382	5635	87.6	6332.5	194.1	1.286	20.478	6.347	199.253	47508	20.5	10.843	374	147.9	164.4	10.5	0.038	4461	2462	my5641_rel.cz10a_bee
998	4370	5636	87.6	6334.8	194.2	1.290	20.535	6.346	199.206	47253	20.3	10.812	372	148.0	164.5	10.5	0.034	4443	2445	my5651_rel.cz10a_bee
qp1000.L6
qp1000.L6: point queries with 1000 insert/s per client. Graphs for performance per 1-second interval are here.
Average throughput:
Query response time histogram: each cell has the percentage of responses that take <= the time in the header and max is the max response time in seconds. For max values in the top 25% of the range have a red background and in the bottom 25% of the range have a green background. The red background is not used when the min value is within 80% of the max value.
| dbms | 256us | 1ms | 4ms | 16ms | 64ms | 256ms | 1s | 4s | 16s | gt | max |
|---|---|---|---|---|---|---|---|---|---|---|---|
| my5621_rel.cz10a_bee | 0.009 | 94.884 | 5.093 | 0.014 | 0.043 | ||||||
| my5631_rel.cz10a_bee | 0.006 | 94.797 | 5.183 | 0.014 | 0.045 | ||||||
| my5641_rel.cz10a_bee | 0.004 | 94.833 | 5.149 | 0.014 | 0.047 | ||||||
| my5651_rel.cz10a_bee | 0.005 | 94.856 | 5.125 | 0.013 | 0.047 |
Insert response time histogram: each cell has the percentage of responses that take <= the time in the header and max is the max response time in seconds. For max values in the top 25% of the range have a red background and in the bottom 25% of the range have a green background. The red background is not used when the min value is within 80% of the max value.
| dbms | 256us | 1ms | 4ms | 16ms | 64ms | 256ms | 1s | 4s | 16s | gt | max |
|---|---|---|---|---|---|---|---|---|---|---|---|
| my5621_rel.cz10a_bee | 18.006 | 79.586 | 2.408 | 0.112 | |||||||
| my5631_rel.cz10a_bee | 15.758 | 81.528 | 2.714 | 0.118 | |||||||
| my5641_rel.cz10a_bee | 15.092 | 82.439 | 2.469 | 0.116 | |||||||
| my5651_rel.cz10a_bee | 17.192 | 81.167 | 1.642 | 0.113 |
Delete response time histogram: each cell has the percentage of responses that take <= the time in the header and max is the max response time in seconds. For max values in the top 25% of the range have a red background and in the bottom 25% of the range have a green background. The red background is not used when the min value is within 80% of the max value.
| dbms | 256us | 1ms | 4ms | 16ms | 64ms | 256ms | 1s | 4s | 16s | gt | max |
|---|---|---|---|---|---|---|---|---|---|---|---|
| my5621_rel.cz10a_bee | 19.608 | 78.978 | 1.414 | 0.062 | |||||||
| my5631_rel.cz10a_bee | 19.344 | 79.225 | 1.431 | 0.061 | |||||||
| my5641_rel.cz10a_bee | 19.092 | 79.425 | 1.483 | 0.051 | |||||||
| my5651_rel.cz10a_bee | 17.981 | 80.608 | 1.411 | 0.058 |
Performance metrics for the DBMS listed above. Some are normalized by throughput, others are not. Legend for results is here.
ips	qps	rps	rmbps	wps	wmbps	rpq	rkbpq	wpi	wkbpi	csps	cpups	cspq	cpupq	dbgb1	dbgb2	rss	maxop	p50	p99	tag
998	510	10634	165.7	6360.1	195.8	20.842	332.619	6.371	200.818	41822	12.5	81.972	1960	148.0	164.5	10.5	0.043	511	479	my5621_rel.cz10a_bee
998	502	10550	164.4	6418.0	195.8	21.025	335.521	6.429	200.829	41686	12.4	83.074	1977	147.9	164.5	10.5	0.045	496	463	my5631_rel.cz10a_bee
999	501	10538	164.2	6414.6	195.7	21.038	335.728	6.422	200.684	41759	12.8	83.368	2044	147.9	164.4	10.5	0.047	495	463	my5641_rel.cz10a_bee
998	499	10528	164.1	6413.6	195.7	21.099	336.701	6.424	200.702	41638	12.3	83.442	1972	148.0	164.5	10.5	0.047	495	463	my5651_rel.cz10a_bee
l.i0
l.i0: load without secondary indexes
Performance metrics for all DBMS, not just the ones listed above. Some are normalized by throughput, others are not. Legend for results is here.
ips	qps	rps	rmbps	wps	wmbps	rpq	rkbpq	wpi	wkbpi	csps	cpups	cspq	cpupq	dbgb1	dbgb2	rss	maxop	p50	p99	tag
101048	0	885	3.5	512.2	36.4	0.009	0.035	0.005	0.369	12625	22.4	0.125	18	52.6	69.1	10.6	0.103	101218	90965	my5621_rel.cz10a_bee
91880	0	804	3.1	459.8	33.2	0.009	0.035	0.005	0.370	11605	21.9	0.126	19	52.6	69.1	10.6	0.215	91908	76270	my5631_rel.cz10a_bee
92368	0	809	3.2	460.8	33.3	0.009	0.035	0.005	0.369	11658	21.9	0.126	19	52.6	69.1	10.6	0.184	92500	76089	my5641_rel.cz10a_bee
92904	0	814	3.2	465.3	33.5	0.009	0.035	0.005	0.370	11744	22.0	0.126	19	52.6	69.1	10.6	0.230	93197	76048	my5651_rel.cz10a_bee
l.x
l.x: create secondary indexes
Performance metrics for all DBMS, not just the ones listed above. Some are normalized by throughput, others are not. Legend for results is here.
ips	qps	rps	rmbps	wps	wmbps	rpq	rkbpq	wpi	wkbpi	csps	cpups	cspq	cpupq	dbgb1	dbgb2	rss	maxop	p50	p99	tag
80800	0	568	81.7	708.8	103.6	0.007	1.035	0.009	1.312	1840	11.2	0.023	11	111.4	127.9	10.8	0.002	NA	NA	my5621_rel.cz10a_bee
81708	0	546	82.6	699.6	104.7	0.007	1.035	0.009	1.312	1807	11.3	0.022	11	111.4	127.9	10.8	0.002	NA	NA	my5631_rel.cz10a_bee
76518	0	516	77.4	671.5	98.2	0.007	1.035	0.009	1.315	1788	10.9	0.023	11	111.4	127.9	10.8	0.003	NA	NA	my5641_rel.cz10a_bee
81875	0	550	82.7	709.1	105.0	0.007	1.035	0.009	1.313	1857	11.1	0.023	11	111.4	127.9	10.8	0.003	NA	NA	my5651_rel.cz10a_bee
l.i1
l.i1: continue load after secondary indexes created with 50 inserts per transaction
Performance metrics for all DBMS, not just the ones listed above. Some are normalized by throughput, others are not. Legend for results is here.
ips	qps	rps	rmbps	wps	wmbps	rpq	rkbpq	wpi	wkbpi	csps	cpups	cspq	cpupq	dbgb1	dbgb2	rss	maxop	p50	p99	tag
1332	0	7474	116.2	9084.5	296.7	5.613	89.362	6.823	228.150	42966	14.2	32.269	853	148.0	164.5	10.5	0.689	1249	899	my5621_rel.cz10a_bee
1320	0	7426	115.5	9092.6	294.6	5.624	89.532	6.886	228.446	42609	14.2	32.267	860	147.9	164.4	10.5	0.797	1249	849	my5631_rel.cz10a_bee
1321	0	7430	115.5	9109.5	295.0	5.623	89.523	6.894	228.597	42852	14.2	32.429	860	147.9	164.4	10.5	0.863	1249	849	my5641_rel.cz10a_bee
1327	0	7445	115.8	9122.0	295.5	5.612	89.348	6.876	228.071	43015	14.3	32.425	862	148.0	164.5	10.5	0.710	1249	849	my5651_rel.cz10a_bee
l.i2
l.i2: continue load after secondary indexes created with 5 inserts per transaction
Performance metrics for all DBMS, not just the ones listed above. Some are normalized by throughput, others are not. Legend for results is here.
ips	qps	rps	rmbps	wps	wmbps	rpq	rkbpq	wpi	wkbpi	csps	cpups	cspq	cpupq	dbgb1	dbgb2	rss	maxop	p50	p99	tag
1645	0	7757	115.2	8791.9	275.6	4.716	71.734	5.346	171.567	48881	20.8	29.720	1012	148.0	164.5	10.5	0.066	1663	1344	my5621_rel.cz10a_bee
1621	0	7674	114.0	8766.9	272.5	4.735	72.039	5.409	172.160	48228	20.8	29.758	1027	147.9	164.5	10.5	0.062	1638	1328	my5631_rel.cz10a_bee
1629	0	7698	114.4	8814.6	273.5	4.727	71.909	5.412	171.958	48528	20.8	29.797	1022	147.9	164.4	10.5	0.065	1644	1333	my5641_rel.cz10a_bee
1626	0	7700	114.4	8779.8	272.8	4.735	72.047	5.400	171.814	48447	20.8	29.795	1023	148.0	164.5	10.5	0.061	1643	1334	my5651_rel.cz10a_bee
qr100.L1
qr100.L1: range queries with 100 insert/s per client
Performance metrics for all DBMS, not just the ones listed above. Some are normalized by throughput, others are not. Legend for results is here.
ips	qps	rps	rmbps	wps	wmbps	rpq	rkbpq	wpi	wkbpi	csps	cpups	cspq	cpupq	dbgb1	dbgb2	rss	maxop	p50	p99	tag
100	5291	632	9.8	552.0	17.2	0.119	1.900	5.531	176.057	23201	13.1	4.385	198	148.0	164.5	10.5	0.020	5290	3772	my5621_rel.cz10a_bee
100	5205	631	9.8	647.0	19.9	0.121	1.930	6.490	204.354	23198	13.2	4.457	203	147.9	164.5	10.5	0.023	5198	3292	my5631_rel.cz10a_bee
100	5152	631	9.8	556.0	17.1	0.122	1.947	5.571	175.954	22676	13.0	4.401	202	147.9	164.4	10.5	0.019	5147	3419	my5641_rel.cz10a_bee
100	5161	632	9.8	622.4	19.1	0.122	1.947	6.237	196.355	22923	13.2	4.442	205	148.0	164.5	10.5	0.017	5162	3261	my5651_rel.cz10a_bee
qp100.L2
qp100.L2: point queries with 100 insert/s per client
Performance metrics for all DBMS, not just the ones listed above. Some are normalized by throughput, others are not. Legend for results is here.
ips	qps	rps	rmbps	wps	wmbps	rpq	rkbpq	wpi	wkbpi	csps	cpups	cspq	cpupq	dbgb1	dbgb2	rss	maxop	p50	p99	tag
100	672	6554	102.4	994.2	30.5	9.758	156.047	9.962	313.152	18215	4.7	27.118	560	148.0	164.5	10.5	0.037	672	575	my5621_rel.cz10a_bee
100	647	6343	99.1	864.9	26.3	9.799	156.709	8.666	270.225	17277	4.6	26.692	569	147.9	164.5	10.5	0.036	655	591	my5631_rel.cz10a_bee
100	645	6333	98.9	965.4	29.4	9.818	157.006	9.673	301.912	17582	4.5	27.259	558	147.9	164.4	10.5	0.039	655	559	my5641_rel.cz10a_bee
100	645	6327	98.8	888.5	27.0	9.811	156.891	8.903	277.307	17310	4.7	26.842	583	148.0	164.5	10.5	0.036	655	591	my5651_rel.cz10a_bee
qr500.L3
qr500.L3: range queries with 500 insert/s per client
Performance metrics for all DBMS, not just the ones listed above. Some are normalized by throughput, others are not. Legend for results is here.
ips	qps	rps	rmbps	wps	wmbps	rpq	rkbpq	wpi	wkbpi	csps	cpups	cspq	cpupq	dbgb1	dbgb2	rss	maxop	p50	p99	tag
499	4877	2978	46.3	3115.4	96.8	0.611	9.723	6.246	198.693	33746	16.6	6.919	272	148.0	164.5	10.5	0.013	4891	2955	my5621_rel.cz10a_bee
499	4797	2978	46.3	3154.2	97.1	0.621	9.886	6.324	199.369	33469	16.6	6.977	277	147.9	164.5	10.5	0.036	4811	2876	my5631_rel.cz10a_bee
499	4770	2978	46.3	3167.7	97.5	0.624	9.945	6.351	200.165	33399	16.6	7.003	278	147.9	164.4	10.5	0.017	4783	2855	my5641_rel.cz10a_bee
499	4730	2978	46.3	3168.8	97.5	0.630	10.025	6.349	200.063	33261	16.6	7.031	281	148.0	164.5	10.5	0.039	4747	2812	my5651_rel.cz10a_bee
qp500.L4
qp500.L4: point queries with 500 insert/s per client
Performance metrics for all DBMS, not just the ones listed above. Some are normalized by throughput, others are not. Legend for results is here.
ips	qps	rps	rmbps	wps	wmbps	rpq	rkbpq	wpi	wkbpi	csps	cpups	cspq	cpupq	dbgb1	dbgb2	rss	maxop	p50	p99	tag
499	592	8592	134.0	3487.4	107.7	14.526	232.035	6.992	221.138	28846	8.1	48.768	1096	148.0	164.5	10.5	0.044	591	559	my5621_rel.cz10a_bee
499	570	8400	131.0	3514.1	107.6	14.729	235.275	7.045	220.809	28392	8.1	49.784	1136	147.9	164.5	10.5	0.043	575	543	my5631_rel.cz10a_bee
499	570	8392	130.9	3514.7	107.6	14.727	235.237	7.042	220.701	28410	8.2	49.859	1151	147.9	164.4	10.5	0.047	575	543	my5641_rel.cz10a_bee
499	569	8390	130.9	3516.2	107.6	14.742	235.477	7.045	220.797	28420	8.1	49.939	1139	148.0	164.5	10.5	0.047	575	543	my5651_rel.cz10a_bee
qr1000.L5
qr1000.L5: range queries with 1000 insert/s per client
Performance metrics for all DBMS, not just the ones listed above. Some are normalized by throughput, others are not. Legend for results is here.
ips	qps	rps	rmbps	wps	wmbps	rpq	rkbpq	wpi	wkbpi	csps	cpups	cspq	cpupq	dbgb1	dbgb2	rss	maxop	p50	p99	tag
998	4477	5636	87.6	6272.2	194.0	1.259	20.044	6.283	199.013	47624	20.3	10.637	363	148.0	164.5	10.5	0.048	4571	2347	my5621_rel.cz10a_bee
998	4392	5637	87.6	6332.6	194.1	1.283	20.434	6.347	199.264	47330	20.3	10.775	370	147.9	164.5	10.5	0.037	4475	2367	my5631_rel.cz10a_bee
998	4382	5635	87.6	6332.5	194.1	1.286	20.478	6.347	199.253	47508	20.5	10.843	374	147.9	164.4	10.5	0.038	4461	2462	my5641_rel.cz10a_bee
998	4370	5636	87.6	6334.8	194.2	1.290	20.535	6.346	199.206	47253	20.3	10.812	372	148.0	164.5	10.5	0.034	4443	2445	my5651_rel.cz10a_bee
qp1000.L6
qp1000.L6: point queries with 1000 insert/s per client
Performance metrics for all DBMS, not just the ones listed above. Some are normalized by throughput, others are not. Legend for results is here.
ips	qps	rps	rmbps	wps	wmbps	rpq	rkbpq	wpi	wkbpi	csps	cpups	cspq	cpupq	dbgb1	dbgb2	rss	maxop	p50	p99	tag
998	510	10634	165.7	6360.1	195.8	20.842	332.619	6.371	200.818	41822	12.5	81.972	1960	148.0	164.5	10.5	0.043	511	479	my5621_rel.cz10a_bee
998	502	10550	164.4	6418.0	195.8	21.025	335.521	6.429	200.829	41686	12.4	83.074	1977	147.9	164.5	10.5	0.045	496	463	my5631_rel.cz10a_bee
999	501	10538	164.2	6414.6	195.7	21.038	335.728	6.422	200.684	41759	12.8	83.368	2044	147.9	164.4	10.5	0.047	495	463	my5641_rel.cz10a_bee
998	499	10528	164.1	6413.6	195.7	21.099	336.701	6.424	200.702	41638	12.3	83.442	1972	148.0	164.5	10.5	0.047	495	463	my5651_rel.cz10a_bee
l.i0
- l.i0: load without secondary indexes
- Legend for results is here.
- Each entry lists the percentage of responses that fit in that bucket (slower than max time for previous bucket, faster than min time for next bucket).
Insert response time histogram
256us	1ms	4ms	16ms	64ms	256ms	1s	4s	16s	gt	max	tag
0.000	92.077	7.801	0.118	0.003	0.002	0.000	0.000	0.000	0.000	0.103	my5621_rel.cz10a_bee
0.000	61.238	38.614	0.085	0.060	0.004	0.000	0.000	0.000	0.000	0.215	my5631_rel.cz10a_bee
0.000	64.912	34.941	0.083	0.060	0.004	0.000	0.000	0.000	0.000	0.184	my5641_rel.cz10a_bee
0.000	70.153	29.700	0.082	0.061	0.004	0.000	0.000	0.000	0.000	0.230	my5651_rel.cz10a_bee
l.x
- l.x: create secondary indexes
- Legend for results is here.
- Each entry lists the percentage of responses that fit in that bucket (slower than max time for previous bucket, faster than min time for next bucket).
TODO - determine whether there is data for create index response time
l.i1
- l.i1: continue load after secondary indexes created with 50 inserts per transaction
- Legend for results is here.
- Each entry lists the percentage of responses that fit in that bucket (slower than max time for previous bucket, faster than min time for next bucket).
Insert response time histogram
256us	1ms	4ms	16ms	64ms	256ms	1s	4s	16s	gt	max	tag
0.000	0.000	0.000	0.585	89.492	9.921	0.001	0.000	0.000	0.000	0.689	my5621_rel.cz10a_bee
0.000	0.000	0.000	0.475	89.359	10.161	0.005	0.000	0.000	0.000	0.797	my5631_rel.cz10a_bee
0.000	0.000	0.000	0.496	89.450	10.050	0.004	0.000	0.000	0.000	0.863	my5641_rel.cz10a_bee
0.000	0.000	0.000	0.484	89.338	10.174	0.005	0.000	0.000	0.000	0.710	my5651_rel.cz10a_bee
Delete response time histogram
256us	1ms	4ms	16ms	64ms	256ms	1s	4s	16s	gt	max	tag
0.000	0.000	7.965	87.580	4.446	0.007	0.001	0.000	0.000	0.000	0.557	my5621_rel.cz10a_bee
0.000	0.000	7.706	87.669	4.617	0.006	0.001	0.000	0.000	0.000	0.639	my5631_rel.cz10a_bee
0.000	0.000	7.303	88.135	4.553	0.009	0.001	0.000	0.000	0.000	0.681	my5641_rel.cz10a_bee
0.000	0.000	6.101	89.356	4.539	0.003	0.001	0.000	0.000	0.000	0.588	my5651_rel.cz10a_bee
l.i2
- l.i2: continue load after secondary indexes created with 5 inserts per transaction
- Legend for results is here.
- Each entry lists the percentage of responses that fit in that bucket (slower than max time for previous bucket, faster than min time for next bucket).
Insert response time histogram
256us	1ms	4ms	16ms	64ms	256ms	1s	4s	16s	gt	max	tag
0.000	3.379	82.553	13.617	0.451	0.001	0.000	0.000	0.000	0.000	0.066	my5621_rel.cz10a_bee
0.000	3.125	82.522	13.857	0.496	0.000	0.000	0.000	0.000	0.000	0.062	my5631_rel.cz10a_bee
0.000	3.193	82.624	13.713	0.470	0.001	0.000	0.000	0.000	0.000	0.065	my5641_rel.cz10a_bee
0.000	3.236	82.431	13.881	0.452	0.000	0.000	0.000	0.000	0.000	0.061	my5651_rel.cz10a_bee
Delete response time histogram
256us	1ms	4ms	16ms	64ms	256ms	1s	4s	16s	gt	max	tag
0.000	19.262	77.797	2.847	0.093	0.000	0.000	0.000	0.000	0.000	0.058	my5621_rel.cz10a_bee
0.000	17.482	79.429	2.968	0.121	0.000	0.000	0.000	0.000	0.000	0.061	my5631_rel.cz10a_bee
0.000	18.896	78.067	2.939	0.099	0.000	0.000	0.000	0.000	0.000	0.061	my5641_rel.cz10a_bee
0.000	18.626	78.331	2.943	0.101	0.000	0.000	0.000	0.000	0.000	0.044	my5651_rel.cz10a_bee
qr100.L1
- qr100.L1: range queries with 100 insert/s per client
- Legend for results is here.
- Each entry lists the percentage of responses that fit in that bucket (slower than max time for previous bucket, faster than min time for next bucket).
Query response time histogram
256us	1ms	4ms	16ms	64ms	256ms	1s	4s	16s	gt	max	tag
94.658	5.190	0.136	0.015	nonzero	0.000	0.000	0.000	0.000	0.000	0.020	my5621_rel.cz10a_bee
94.125	5.727	0.132	0.015	nonzero	0.000	0.000	0.000	0.000	0.000	0.023	my5631_rel.cz10a_bee
93.917	5.934	0.134	0.015	nonzero	0.000	0.000	0.000	0.000	0.000	0.019	my5641_rel.cz10a_bee
93.948	5.898	0.137	0.017	nonzero	0.000	0.000	0.000	0.000	0.000	0.017	my5651_rel.cz10a_bee
Insert response time histogram
256us	1ms	4ms	16ms	64ms	256ms	1s	4s	16s	gt	max	tag
0.000	0.000	0.000	0.083	99.778	0.139	0.000	0.000	0.000	0.000	0.083	my5621_rel.cz10a_bee
0.000	0.000	0.000	0.056	99.528	0.417	0.000	0.000	0.000	0.000	0.128	my5631_rel.cz10a_bee
0.000	0.000	0.000	0.167	99.778	0.056	0.000	0.000	0.000	0.000	0.075	my5641_rel.cz10a_bee
0.000	0.000	0.000	0.222	99.583	0.194	0.000	0.000	0.000	0.000	0.107	my5651_rel.cz10a_bee
Delete response time histogram
256us	1ms	4ms	16ms	64ms	256ms	1s	4s	16s	gt	max	tag
0.000	0.000	17.278	80.972	1.750	0.000	0.000	0.000	0.000	0.000	0.040	my5621_rel.cz10a_bee
0.000	0.000	15.889	81.722	2.389	0.000	0.000	0.000	0.000	0.000	0.045	my5631_rel.cz10a_bee
0.000	0.000	17.389	81.361	1.250	0.000	0.000	0.000	0.000	0.000	0.034	my5641_rel.cz10a_bee
0.000	0.000	17.500	80.611	1.889	0.000	0.000	0.000	0.000	0.000	0.035	my5651_rel.cz10a_bee
qp100.L2
- qp100.L2: point queries with 100 insert/s per client
- Legend for results is here.
- Each entry lists the percentage of responses that fit in that bucket (slower than max time for previous bucket, faster than min time for next bucket).
Query response time histogram
256us	1ms	4ms	16ms	64ms	256ms	1s	4s	16s	gt	max	tag
0.000	0.874	98.899	0.226	0.001	0.000	0.000	0.000	0.000	0.000	0.037	my5621_rel.cz10a_bee
0.000	0.561	99.203	0.235	0.001	0.000	0.000	0.000	0.000	0.000	0.036	my5631_rel.cz10a_bee
0.000	0.500	99.279	0.220	0.001	0.000	0.000	0.000	0.000	0.000	0.039	my5641_rel.cz10a_bee
0.000	0.527	99.236	0.236	0.001	0.000	0.000	0.000	0.000	0.000	0.036	my5651_rel.cz10a_bee
Insert response time histogram
256us	1ms	4ms	16ms	64ms	256ms	1s	4s	16s	gt	max	tag
0.000	0.000	0.000	0.278	99.389	0.333	0.000	0.000	0.000	0.000	0.115	my5621_rel.cz10a_bee
0.000	0.000	0.000	0.111	99.639	0.250	0.000	0.000	0.000	0.000	0.082	my5631_rel.cz10a_bee
0.000	0.000	0.000	0.167	99.500	0.333	0.000	0.000	0.000	0.000	0.098	my5641_rel.cz10a_bee
0.000	0.000	0.000	0.083	99.611	0.306	0.000	0.000	0.000	0.000	0.094	my5651_rel.cz10a_bee
Delete response time histogram
256us	1ms	4ms	16ms	64ms	256ms	1s	4s	16s	gt	max	tag
0.000	0.000	62.472	37.028	0.472	0.028	0.000	0.000	0.000	0.000	0.070	my5621_rel.cz10a_bee
0.000	0.000	58.222	41.111	0.667	0.000	0.000	0.000	0.000	0.000	0.049	my5631_rel.cz10a_bee
0.000	0.000	66.000	33.444	0.556	0.000	0.000	0.000	0.000	0.000	0.055	my5641_rel.cz10a_bee
0.000	0.000	66.194	33.500	0.306	0.000	0.000	0.000	0.000	0.000	0.041	my5651_rel.cz10a_bee
qr500.L3
- qr500.L3: range queries with 500 insert/s per client
- Legend for results is here.
- Each entry lists the percentage of responses that fit in that bucket (slower than max time for previous bucket, faster than min time for next bucket).
Query response time histogram
256us	1ms	4ms	16ms	64ms	256ms	1s	4s	16s	gt	max	tag
89.493	10.245	0.235	0.027	0.000	0.000	0.000	0.000	0.000	0.000	0.013	my5621_rel.cz10a_bee
88.787	10.945	0.239	0.028	nonzero	0.000	0.000	0.000	0.000	0.000	0.036	my5631_rel.cz10a_bee
88.673	11.048	0.251	0.027	nonzero	0.000	0.000	0.000	0.000	0.000	0.017	my5641_rel.cz10a_bee
88.236	11.477	0.259	0.028	nonzero	0.000	0.000	0.000	0.000	0.000	0.039	my5651_rel.cz10a_bee
Insert response time histogram
256us	1ms	4ms	16ms	64ms	256ms	1s	4s	16s	gt	max	tag
0.000	0.000	0.000	6.639	93.328	0.033	0.000	0.000	0.000	0.000	0.072	my5621_rel.cz10a_bee
0.000	0.000	0.000	5.689	94.272	0.039	0.000	0.000	0.000	0.000	0.089	my5631_rel.cz10a_bee
0.000	0.000	0.000	5.383	94.567	0.050	0.000	0.000	0.000	0.000	0.074	my5641_rel.cz10a_bee
0.000	0.000	0.000	5.694	94.211	0.094	0.000	0.000	0.000	0.000	0.079	my5651_rel.cz10a_bee
Delete response time histogram
256us	1ms	4ms	16ms	64ms	256ms	1s	4s	16s	gt	max	tag
0.000	0.000	14.367	85.361	0.272	0.000	0.000	0.000	0.000	0.000	0.028	my5621_rel.cz10a_bee
0.000	0.000	13.822	85.917	0.261	0.000	0.000	0.000	0.000	0.000	0.027	my5631_rel.cz10a_bee
0.000	0.000	11.967	87.739	0.294	0.000	0.000	0.000	0.000	0.000	0.029	my5641_rel.cz10a_bee
0.000	0.000	12.522	86.994	0.483	0.000	0.000	0.000	0.000	0.000	0.035	my5651_rel.cz10a_bee
qp500.L4
- qp500.L4: point queries with 500 insert/s per client
- Legend for results is here.
- Each entry lists the percentage of responses that fit in that bucket (slower than max time for previous bucket, faster than min time for next bucket).
Query response time histogram
256us	1ms	4ms	16ms	64ms	256ms	1s	4s	16s	gt	max	tag
0.000	0.060	97.954	1.979	0.007	0.000	0.000	0.000	0.000	0.000	0.044	my5621_rel.cz10a_bee
0.000	0.033	97.757	2.203	0.007	0.000	0.000	0.000	0.000	0.000	0.043	my5631_rel.cz10a_bee
0.000	0.033	97.752	2.207	0.008	0.000	0.000	0.000	0.000	0.000	0.047	my5641_rel.cz10a_bee
0.000	0.028	97.769	2.195	0.007	0.000	0.000	0.000	0.000	0.000	0.047	my5651_rel.cz10a_bee
Insert response time histogram
256us	1ms	4ms	16ms	64ms	256ms	1s	4s	16s	gt	max	tag
0.000	0.000	0.000	4.894	94.283	0.822	0.000	0.000	0.000	0.000	0.142	my5621_rel.cz10a_bee
0.000	0.000	0.000	4.739	94.183	1.078	0.000	0.000	0.000	0.000	0.116	my5631_rel.cz10a_bee
0.000	0.000	0.000	4.111	94.528	1.361	0.000	0.000	0.000	0.000	0.117	my5641_rel.cz10a_bee
0.000	0.000	0.000	4.972	94.261	0.767	0.000	0.000	0.000	0.000	0.116	my5651_rel.cz10a_bee
Delete response time histogram
256us	1ms	4ms	16ms	64ms	256ms	1s	4s	16s	gt	max	tag
0.000	0.000	24.906	72.711	2.383	0.000	0.000	0.000	0.000	0.000	0.061	my5621_rel.cz10a_bee
0.000	0.000	23.906	73.400	2.694	0.000	0.000	0.000	0.000	0.000	0.050	my5631_rel.cz10a_bee
0.000	0.000	23.994	73.400	2.600	0.006	0.000	0.000	0.000	0.000	0.085	my5641_rel.cz10a_bee
0.000	0.000	23.094	74.089	2.817	0.000	0.000	0.000	0.000	0.000	0.062	my5651_rel.cz10a_bee
qr1000.L5
- qr1000.L5: range queries with 1000 insert/s per client
- Legend for results is here.
- Each entry lists the percentage of responses that fit in that bucket (slower than max time for previous bucket, faster than min time for next bucket).
Query response time histogram
256us	1ms	4ms	16ms	64ms	256ms	1s	4s	16s	gt	max	tag
83.099	16.478	0.399	0.024	nonzero	0.000	0.000	0.000	0.000	0.000	0.048	my5621_rel.cz10a_bee
81.805	17.763	0.409	0.024	nonzero	0.000	0.000	0.000	0.000	0.000	0.037	my5631_rel.cz10a_bee
81.626	17.951	0.402	0.021	nonzero	0.000	0.000	0.000	0.000	0.000	0.038	my5641_rel.cz10a_bee
81.667	17.919	0.392	0.021	nonzero	0.000	0.000	0.000	0.000	0.000	0.034	my5651_rel.cz10a_bee
Insert response time histogram
256us	1ms	4ms	16ms	64ms	256ms	1s	4s	16s	gt	max	tag
0.000	0.000	0.000	27.506	72.186	0.308	0.000	0.000	0.000	0.000	0.119	my5621_rel.cz10a_bee
0.000	0.000	0.000	25.214	74.497	0.289	0.000	0.000	0.000	0.000	0.100	my5631_rel.cz10a_bee
0.000	0.000	0.000	24.442	75.278	0.281	0.000	0.000	0.000	0.000	0.112	my5641_rel.cz10a_bee
0.000	0.000	0.000	25.397	74.311	0.292	0.000	0.000	0.000	0.000	0.107	my5651_rel.cz10a_bee
Delete response time histogram
256us	1ms	4ms	16ms	64ms	256ms	1s	4s	16s	gt	max	tag
0.000	0.000	14.575	84.967	0.458	0.000	0.000	0.000	0.000	0.000	0.043	my5621_rel.cz10a_bee
0.000	0.000	12.911	86.633	0.456	0.000	0.000	0.000	0.000	0.000	0.054	my5631_rel.cz10a_bee
0.000	0.000	12.492	87.072	0.436	0.000	0.000	0.000	0.000	0.000	0.048	my5641_rel.cz10a_bee
0.000	0.000	12.594	86.919	0.486	0.000	0.000	0.000	0.000	0.000	0.055	my5651_rel.cz10a_bee
qp1000.L6
- qp1000.L6: point queries with 1000 insert/s per client
- Legend for results is here.
- Each entry lists the percentage of responses that fit in that bucket (slower than max time for previous bucket, faster than min time for next bucket).
Query response time histogram
256us	1ms	4ms	16ms	64ms	256ms	1s	4s	16s	gt	max	tag
0.000	0.009	94.884	5.093	0.014	0.000	0.000	0.000	0.000	0.000	0.043	my5621_rel.cz10a_bee
0.000	0.006	94.797	5.183	0.014	0.000	0.000	0.000	0.000	0.000	0.045	my5631_rel.cz10a_bee
0.000	0.004	94.833	5.149	0.014	0.000	0.000	0.000	0.000	0.000	0.047	my5641_rel.cz10a_bee
0.000	0.005	94.856	5.125	0.013	0.000	0.000	0.000	0.000	0.000	0.047	my5651_rel.cz10a_bee
Insert response time histogram
256us	1ms	4ms	16ms	64ms	256ms	1s	4s	16s	gt	max	tag
0.000	0.000	0.000	18.006	79.586	2.408	0.000	0.000	0.000	0.000	0.112	my5621_rel.cz10a_bee
0.000	0.000	0.000	15.758	81.528	2.714	0.000	0.000	0.000	0.000	0.118	my5631_rel.cz10a_bee
0.000	0.000	0.000	15.092	82.439	2.469	0.000	0.000	0.000	0.000	0.116	my5641_rel.cz10a_bee
0.000	0.000	0.000	17.192	81.167	1.642	0.000	0.000	0.000	0.000	0.113	my5651_rel.cz10a_bee
Delete response time histogram
256us	1ms	4ms	16ms	64ms	256ms	1s	4s	16s	gt	max	tag
0.000	0.000	19.608	78.978	1.414	0.000	0.000	0.000	0.000	0.000	0.062	my5621_rel.cz10a_bee
0.000	0.000	19.344	79.225	1.431	0.000	0.000	0.000	0.000	0.000	0.061	my5631_rel.cz10a_bee
0.000	0.000	19.092	79.425	1.483	0.000	0.000	0.000	0.000	0.000	0.051	my5641_rel.cz10a_bee
0.000	0.000	17.981	80.608	1.411	0.000	0.000	0.000	0.000	0.000	0.058	my5651_rel.cz10a_bee