Introduction
This is a report for the insert benchmark with 4000M docs and 20 client(s). It is generated by scripts (bash, awk, sed) and Tufte might not be impressed. An overview of the insert benchmark is here and a short update is here. Below, by DBMS, I mean DBMS+version.config. An example is my8020.c10b40 where my means MySQL, 8020 is version 8.0.20 and c10b40 is the name for the configuration file.
The test server is an ax162-s from Hetzner (see here) with 48 cores, AMD SMT disabled, 128G RAM and ext4 using 2 NVMe devices with SW RAID 1. The benchmark was run with 20 clients and there were 1 or 3 connections per client (1 for queries or inserts without rate limits, 1+1 for rate limited inserts+deletes). It uses 8 tables with a table per client. It loads 200M rows per table without secondary indexes, creates 3 secondary indexes per table, then inserts 4m+1m rows per table with a delete per insert to avoid growing the table. It then does 6 read+write tests for 1800s each that do queries as fast as possible with 100,100,500,500,1000,1000 inserts/s and the same for deletes/s per client concurrent with the queries. The database is larger than memory. Clients and the DBMS share one server.
The tested DBMS are:
- ma100618_rel_withdbg.cz11a_c32r128 - MariaDB 10.6.18 compiled with CMAKE_BUILD_TYPE=RelWithDebInfo using my.cnf.cz11a_c32r128
- ma100618_rel_withdbg.cz11a_lwas4k_c32r128 - MariaDB 10.6.18 compiled with CMAKE_BUILD_TYPE=RelWithDebInfo using my.cnf.cz11a_lwas4k_c32r128
- ma100619_rel_withdbg.cz11a_c32r128 - MariaDB 10.6.19 compiled with CMAKE_BUILD_TYPE=RelWithDebInfo using my.cnf.cz11a_c32r128
- ma100619_rel_withdbg.cz11a_lwas4k_c32r128 - MariaDB 10.6.19 compiled with CMAKE_BUILD_TYPE=RelWithDebInfo using my.cnf.cz11a_lwas4k_c32r128
- ma101108_rel_withdbg.cz11a_c32r128 - MariaDB 10.11.8 compiled with CMAKE_BUILD_TYPE=RelWithDebInfo using my.cnf.cz11a_c32r128
- ma101109_rel_withdbg.cz11a_c32r128 - MariaDB 10.11.9 compiled with CMAKE_BUILD_TYPE=RelWithDebInfo using my.cnf.cz11a_c32r128
- ma101109_rel_withdbg.cz11a_lwas4k_c32r128 - MariaDB 10.11.9 compiled with CMAKE_BUILD_TYPE=RelWithDebInfo using my.cnf.cz11a_lwas4k_c32r128
Contents
- Summary
- l.i0: load without secondary indexes
- l.x: create secondary indexes
- l.i1: continue load after secondary indexes created with 50 inserts per transaction
- l.i2: continue load after secondary indexes created with 5 inserts per transaction
- qr100.L1: range queries with 100 insert/s per client
- qp100.L2: point queries with 100 insert/s per client
- qr500.L3: range queries with 500 insert/s per client
- qp500.L4: point queries with 500 insert/s per client
- qr1000.L5: range queries with 1000 insert/s per client
- qp1000.L6: point queries with 1000 insert/s per client
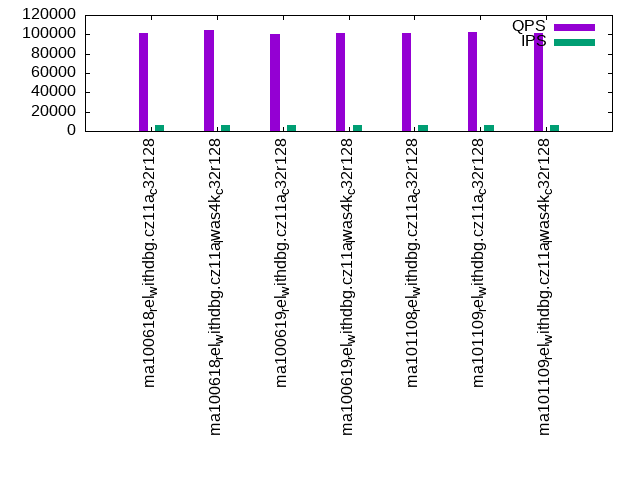
Summary
The numbers are inserts/s for l.i0, l.i1 and l.i2, indexed docs (or rows) /s for l.x and queries/s for qr100, qp100 thru qr1000, qp1000" The values are the average rate over the entire test for inserts (IPS) and queries (QPS). The range of values for IPS and QPS is split into 3 parts: bottom 25%, middle 50%, top 25%. Values in the bottom 25% have a red background, values in the top 25% have a green background and values in the middle have no color. A gray background is used for values that can be ignored because the DBMS did not sustain the target insert rate. Red backgrounds are not used when the minimum value is within 80% of the max value.
| dbms | l.i0 | l.x | l.i1 | l.i2 | qr100 | qp100 | qr500 | qp500 | qr1000 | qp1000 |
|---|---|---|---|---|---|---|---|---|---|---|
| ma100618_rel_withdbg.cz11a_c32r128 | 332474 | 1589194 | 6345 | 8042 | 172045 | 18274 | 95942 | 8260 | 101389 | 7308 |
| ma100618_rel_withdbg.cz11a_lwas4k_c32r128 | 326531 | 1516875 | 6373 | 7755 | 173142 | 18374 | 95306 | 8357 | 104580 | 6903 |
| ma100619_rel_withdbg.cz11a_c32r128 | 324675 | 1520334 | 6535 | 7383 | 171886 | 18225 | 93324 | 7381 | 100056 | 7253 |
| ma100619_rel_withdbg.cz11a_lwas4k_c32r128 | 324517 | 1520334 | 6495 | 7556 | 171676 | 18139 | 94134 | 6688 | 101603 | 7103 |
| ma101108_rel_withdbg.cz11a_c32r128 | 282486 | 1614205 | 6017 | 7225 | 173023 | 17662 | 95370 | 6127 | 101699 | 5408 |
| ma101109_rel_withdbg.cz11a_c32r128 | 280505 | 1536098 | 6195 | 6625 | 176360 | 17785 | 96906 | 4820 | 102202 | 5109 |
| ma101109_rel_withdbg.cz11a_lwas4k_c32r128 | 279076 | 1549187 | 6121 | 7135 | 175678 | 17794 | 94950 | 5573 | 101317 | 5674 |
This table has relative throughput, throughput for the DBMS relative to the DBMS in the first line, using the absolute throughput from the previous table. Values less than 0.95 have a yellow background. Values greater than 1.05 have a blue background.
| dbms | l.i0 | l.x | l.i1 | l.i2 | qr100 | qp100 | qr500 | qp500 | qr1000 | qp1000 |
|---|---|---|---|---|---|---|---|---|---|---|
| ma100618_rel_withdbg.cz11a_c32r128 | 1.00 | 1.00 | 1.00 | 1.00 | 1.00 | 1.00 | 1.00 | 1.00 | 1.00 | 1.00 |
| ma100618_rel_withdbg.cz11a_lwas4k_c32r128 | 0.98 | 0.95 | 1.00 | 0.96 | 1.01 | 1.01 | 0.99 | 1.01 | 1.03 | 0.94 |
| ma100619_rel_withdbg.cz11a_c32r128 | 0.98 | 0.96 | 1.03 | 0.92 | 1.00 | 1.00 | 0.97 | 0.89 | 0.99 | 0.99 |
| ma100619_rel_withdbg.cz11a_lwas4k_c32r128 | 0.98 | 0.96 | 1.02 | 0.94 | 1.00 | 0.99 | 0.98 | 0.81 | 1.00 | 0.97 |
| ma101108_rel_withdbg.cz11a_c32r128 | 0.85 | 1.02 | 0.95 | 0.90 | 1.01 | 0.97 | 0.99 | 0.74 | 1.00 | 0.74 |
| ma101109_rel_withdbg.cz11a_c32r128 | 0.84 | 0.97 | 0.98 | 0.82 | 1.03 | 0.97 | 1.01 | 0.58 | 1.01 | 0.70 |
| ma101109_rel_withdbg.cz11a_lwas4k_c32r128 | 0.84 | 0.97 | 0.96 | 0.89 | 1.02 | 0.97 | 0.99 | 0.67 | 1.00 | 0.78 |
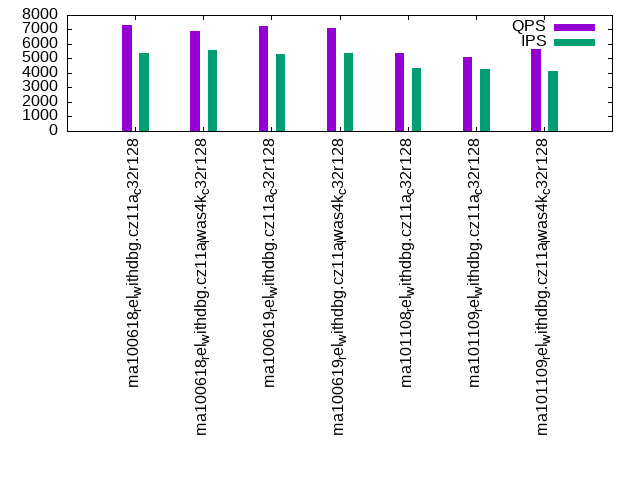
This lists the average rate of inserts/s for the tests that do inserts concurrent with queries. For such tests the query rate is listed in the table above. The read+write tests are setup so that the insert rate should match the target rate every second. Cells that are not at least 95% of the target have a red background to indicate a failure to satisfy the target.
| dbms | qr100.L1 | qp100.L2 | qr500.L3 | qp500.L4 | qr1000.L5 | qp1000.L6 |
|---|---|---|---|---|---|---|
| ma100618_rel_withdbg.cz11a_c32r128 | 1976 | 1976 | 8388 | 4763 | 6675 | 5396 |
| ma100618_rel_withdbg.cz11a_lwas4k_c32r128 | 1976 | 1976 | 8156 | 4662 | 6458 | 5577 |
| ma100619_rel_withdbg.cz11a_c32r128 | 1976 | 1976 | 8423 | 5114 | 6494 | 5314 |
| ma100619_rel_withdbg.cz11a_lwas4k_c32r128 | 1976 | 1976 | 8310 | 5389 | 6244 | 5392 |
| ma101108_rel_withdbg.cz11a_c32r128 | 1977 | 1976 | 8061 | 3950 | 5968 | 4337 |
| ma101109_rel_withdbg.cz11a_c32r128 | 1976 | 1976 | 7829 | 4114 | 5738 | 4290 |
| ma101109_rel_withdbg.cz11a_lwas4k_c32r128 | 1976 | 1976 | 8299 | 4047 | 6053 | 4115 |
| target | 2000 | 2000 | 10000 | 10000 | 20000 | 20000 |
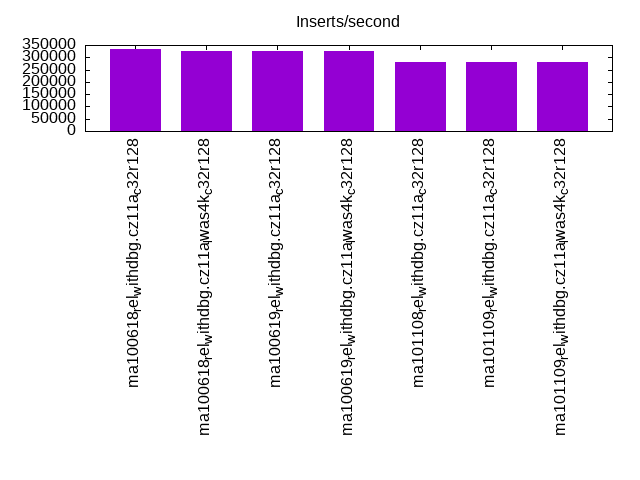
l.i0
l.i0: load without secondary indexes. Graphs for performance per 1-second interval are here.
Average throughput:
Insert response time histogram: each cell has the percentage of responses that take <= the time in the header and max is the max response time in seconds. For the max column values in the top 25% of the range have a red background and in the bottom 25% of the range have a green background. The red background is not used when the min value is within 80% of the max value.
| dbms | 256us | 1ms | 4ms | 16ms | 64ms | 256ms | 1s | 4s | 16s | gt | max |
|---|---|---|---|---|---|---|---|---|---|---|---|
| ma100618_rel_withdbg.cz11a_c32r128 | 0.139 | 1.294 | 98.331 | 0.044 | 0.112 | 0.081 | 0.672 | ||||
| ma100618_rel_withdbg.cz11a_lwas4k_c32r128 | 0.105 | 0.777 | 98.879 | 0.047 | 0.112 | 0.080 | 0.657 | ||||
| ma100619_rel_withdbg.cz11a_c32r128 | 0.107 | 0.732 | 98.932 | 0.037 | 0.111 | 0.081 | 0.667 | ||||
| ma100619_rel_withdbg.cz11a_lwas4k_c32r128 | 0.131 | 0.817 | 98.821 | 0.042 | 0.109 | 0.081 | 0.659 | ||||
| ma101108_rel_withdbg.cz11a_c32r128 | 0.074 | 0.305 | 99.376 | 0.046 | 0.106 | 0.093 | 0.661 | ||||
| ma101109_rel_withdbg.cz11a_c32r128 | 0.070 | 0.237 | 99.449 | 0.042 | 0.107 | 0.095 | 0.668 | ||||
| ma101109_rel_withdbg.cz11a_lwas4k_c32r128 | 0.110 | 0.245 | 99.407 | 0.036 | 0.106 | 0.096 | 0.677 |
Performance metrics for the DBMS listed above. Some are normalized by throughput, others are not. Legend for results is here.
ips	qps	rps	rmbps	wps	wmbps	rpq	rkbpq	wpi	wkbpi	csps	cpups	cspq	cpupq	dbgb1	dbgb2	rss	maxop	p50	p99	tag
332474	0	1	0.0	2334.3	97.4	0.000	0.000	0.007	0.300	856927	50.8	2.577	73	263.2	365.2	101.4	0.672	17681	200	ma100618_rel_withdbg.cz11a_c32r128
326531	0	2	0.1	2301.7	95.7	0.000	0.000	0.007	0.300	864796	51.0	2.648	75	263.2	365.2	101.4	0.657	17082	200	ma100618_rel_withdbg.cz11a_lwas4k_c32r128
324675	0	2	0.0	2275.9	95.0	0.000	0.000	0.007	0.300	863264	51.0	2.659	75	263.2	365.2	101.4	0.667	16987	200	ma100619_rel_withdbg.cz11a_c32r128
324517	0	1	0.0	2280.3	95.0	0.000	0.000	0.007	0.300	882386	50.8	2.719	75	263.2	365.2	101.4	0.659	17082	200	ma100619_rel_withdbg.cz11a_lwas4k_c32r128
282486	0	2686	10.5	2008.0	85.1	0.010	0.038	0.007	0.308	256601	50.2	0.908	85	263.2	365.2	101.4	0.661	14784	200	ma101108_rel_withdbg.cz11a_c32r128
280505	0	2614	10.2	1993.3	84.5	0.009	0.037	0.007	0.308	252763	50.6	0.901	87	263.2	365.2	101.4	0.668	14584	200	ma101109_rel_withdbg.cz11a_c32r128
279076	0	1	0.0	1983.2	84.0	0.000	0.000	0.007	0.308	241798	51.1	0.866	88	263.2	365.1	101.4	0.677	14584	200	ma101109_rel_withdbg.cz11a_lwas4k_c32r128
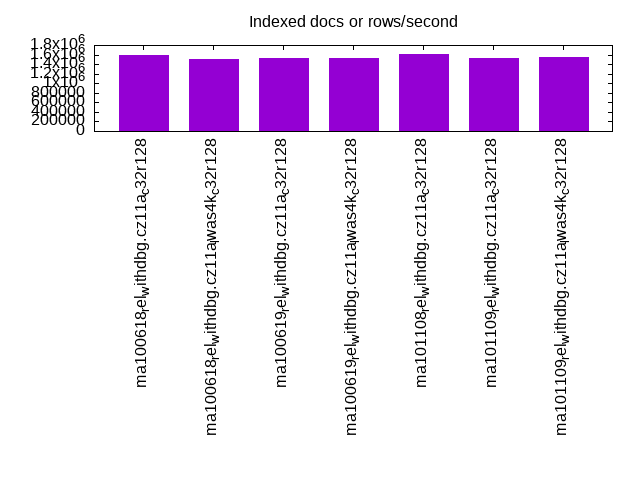
l.x
l.x: create secondary indexes.
Average throughput:
Performance metrics for the DBMS listed above. Some are normalized by throughput, others are not. Legend for results is here.
ips	qps	rps	rmbps	wps	wmbps	rpq	rkbpq	wpi	wkbpi	csps	cpups	cspq	cpupq	dbgb1	dbgb2	rss	maxop	p50	p99	tag
1589194	0	17318	1421.7	18586.1	1571.6	0.011	0.916	0.012	1.013	91399	23.2	0.058	7	557.5	659.5	101.8	0.002	NA	NA	ma100618_rel_withdbg.cz11a_c32r128
1516875	0	16526	1352.1	18114.3	1506.1	0.011	0.913	0.012	1.017	90744	22.8	0.060	7	557.5	659.5	101.8	0.002	NA	NA	ma100618_rel_withdbg.cz11a_lwas4k_c32r128
1520334	0	16548	1355.6	18105.8	1508.3	0.011	0.913	0.012	1.016	92279	23.4	0.061	7	557.5	659.5	101.8	0.002	NA	NA	ma100619_rel_withdbg.cz11a_c32r128
1520334	0	16570	1353.4	18145.3	1508.5	0.011	0.912	0.012	1.016	90501	23.4	0.060	7	557.5	659.5	101.8	0.002	NA	NA	ma100619_rel_withdbg.cz11a_lwas4k_c32r128
1614205	0	17524	1435.3	19225.7	1597.2	0.011	0.911	0.012	1.013	72953	24.8	0.045	7	557.5	659.5	101.8	0.002	NA	NA	ma101108_rel_withdbg.cz11a_c32r128
1536098	0	16806	1372.7	18422.0	1522.0	0.011	0.915	0.012	1.015	82615	23.3	0.054	7	557.5	659.5	101.8	0.006	NA	NA	ma101109_rel_withdbg.cz11a_c32r128
1549187	0	16856	1380.5	18183.8	1530.0	0.011	0.912	0.012	1.011	75231	23.9	0.049	7	557.5	659.4	101.8	0.004	NA	NA	ma101109_rel_withdbg.cz11a_lwas4k_c32r128
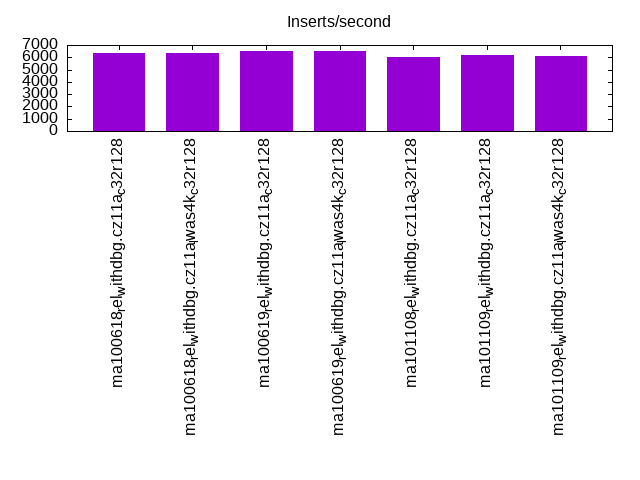
l.i1
l.i1: continue load after secondary indexes created with 50 inserts per transaction. Graphs for performance per 1-second interval are here.
Average throughput:
Insert response time histogram: each cell has the percentage of responses that take <= the time in the header and max is the max response time in seconds. For the max column values in the top 25% of the range have a red background and in the bottom 25% of the range have a green background. The red background is not used when the min value is within 80% of the max value.
| dbms | 256us | 1ms | 4ms | 16ms | 64ms | 256ms | 1s | 4s | 16s | gt | max |
|---|---|---|---|---|---|---|---|---|---|---|---|
| ma100618_rel_withdbg.cz11a_c32r128 | 0.019 | 18.500 | 54.555 | 26.918 | 0.005 | 0.001 | 0.003 | 93.672 | |||
| ma100618_rel_withdbg.cz11a_lwas4k_c32r128 | 0.019 | 17.018 | 57.185 | 25.773 | 0.001 | 0.002 | 0.002 | 48.749 | |||
| ma100619_rel_withdbg.cz11a_c32r128 | 0.047 | 17.175 | 58.828 | 23.944 | 0.001 | 0.002 | 0.003 | 56.130 | |||
| ma100619_rel_withdbg.cz11a_lwas4k_c32r128 | 0.024 | 18.113 | 57.384 | 24.473 | 0.002 | 0.003 | 0.001 | 66.617 | |||
| ma101108_rel_withdbg.cz11a_c32r128 | 0.937 | 14.962 | 57.925 | 26.172 | nonzero | 0.001 | 0.003 | 49.840 | |||
| ma101109_rel_withdbg.cz11a_c32r128 | 1.281 | 14.880 | 59.094 | 24.743 | 0.001 | 70.919 | |||||
| ma101109_rel_withdbg.cz11a_lwas4k_c32r128 | 1.321 | 14.947 | 58.585 | 25.139 | 0.003 | 0.003 | 0.002 | 76.798 |
Delete response time histogram: each cell has the percentage of responses that take <= the time in the header and max is the max response time in seconds. For the max column values in the top 25% of the range have a red background and in the bottom 25% of the range have a green background. The red background is not used when the min value is within 80% of the max value.
| dbms | 256us | 1ms | 4ms | 16ms | 64ms | 256ms | 1s | 4s | 16s | gt | max |
|---|---|---|---|---|---|---|---|---|---|---|---|
| ma100618_rel_withdbg.cz11a_c32r128 | 0.103 | 47.317 | 27.511 | 25.065 | 0.001 | 0.001 | 0.001 | 87.278 | |||
| ma100618_rel_withdbg.cz11a_lwas4k_c32r128 | 0.092 | 45.368 | 30.180 | 24.356 | nonzero | 0.002 | 0.001 | 48.678 | |||
| ma100619_rel_withdbg.cz11a_c32r128 | 0.107 | 46.894 | 30.456 | 22.540 | nonzero | 0.002 | 0.001 | 55.333 | |||
| ma100619_rel_withdbg.cz11a_lwas4k_c32r128 | 0.060 | 46.042 | 30.913 | 22.981 | 0.001 | 0.001 | 0.001 | 65.612 | |||
| ma101108_rel_withdbg.cz11a_c32r128 | 9.878 | 24.395 | 41.739 | 23.986 | nonzero | 0.001 | nonzero | 49.751 | |||
| ma101109_rel_withdbg.cz11a_c32r128 | 9.588 | 25.151 | 42.757 | 22.502 | nonzero | nonzero | 0.001 | 70.828 | |||
| ma101109_rel_withdbg.cz11a_lwas4k_c32r128 | 10.092 | 24.675 | 42.370 | 22.859 | 0.001 | 0.002 | 0.001 | 76.742 |
Performance metrics for the DBMS listed above. Some are normalized by throughput, others are not. Legend for results is here.
ips	qps	rps	rmbps	wps	wmbps	rpq	rkbpq	wpi	wkbpi	csps	cpups	cspq	cpupq	dbgb1	dbgb2	rss	maxop	p50	p99	tag
6345	0	38413	600.2	37731.7	1032.6	6.054	96.862	5.947	166.648	769589	13.3	121.289	1006	724.8	827.3	100.5	93.672	300	50	ma100618_rel_withdbg.cz11a_c32r128
6373	0	38031	594.2	37426.1	1023.4	5.968	95.478	5.873	164.441	782682	13.3	122.814	1002	724.5	827.1	100.6	48.749	300	100	ma100618_rel_withdbg.cz11a_lwas4k_c32r128
6535	0	38480	601.2	37931.3	1039.8	5.888	94.206	5.804	162.924	802518	16.1	122.795	1182	725.4	828.0	100.9	56.130	300	100	ma100619_rel_withdbg.cz11a_c32r128
6495	0	38638	603.7	37960.9	1040.6	5.949	95.180	5.845	164.063	795621	15.5	122.497	1145	723.2	825.8	100.8	66.617	300	100	ma100619_rel_withdbg.cz11a_lwas4k_c32r128
6017	0	36677	569.1	35566.1	971.7	6.096	96.852	5.911	165.372	852868	12.7	141.748	1013	726.0	828.6	100.6	49.840	300	100	ma101108_rel_withdbg.cz11a_c32r128
6195	0	36934	573.0	35767.6	980.7	5.962	94.711	5.773	162.104	872089	14.7	140.766	1139	723.9	826.6	100.6	70.919	300	100	ma101109_rel_withdbg.cz11a_c32r128
6121	0	36566	571.3	35805.3	981.5	5.974	95.575	5.849	164.191	863805	14.2	141.115	1113	723.8	826.5	100.9	76.798	300	100	ma101109_rel_withdbg.cz11a_lwas4k_c32r128
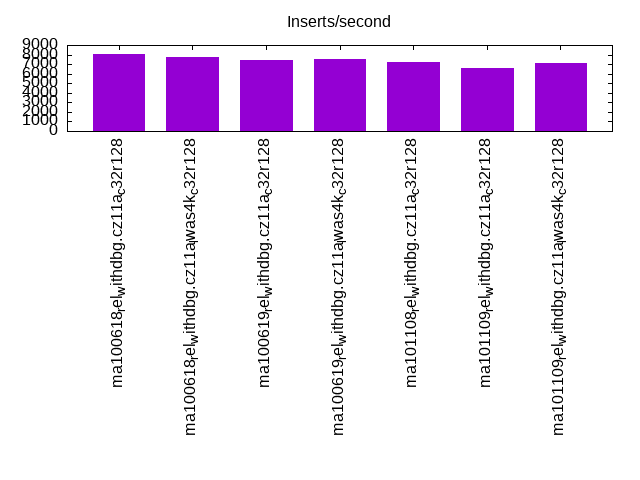
l.i2
l.i2: continue load after secondary indexes created with 5 inserts per transaction. Graphs for performance per 1-second interval are here.
Average throughput:
Insert response time histogram: each cell has the percentage of responses that take <= the time in the header and max is the max response time in seconds. For the max column values in the top 25% of the range have a red background and in the bottom 25% of the range have a green background. The red background is not used when the min value is within 80% of the max value.
| dbms | 256us | 1ms | 4ms | 16ms | 64ms | 256ms | 1s | 4s | 16s | gt | max |
|---|---|---|---|---|---|---|---|---|---|---|---|
| ma100618_rel_withdbg.cz11a_c32r128 | 0.042 | 16.311 | 65.535 | 17.673 | 0.410 | 0.028 | 0.001 | 1.771 | |||
| ma100618_rel_withdbg.cz11a_lwas4k_c32r128 | 0.043 | 15.053 | 65.862 | 18.584 | 0.433 | 0.024 | 0.001 | 2.128 | |||
| ma100619_rel_withdbg.cz11a_c32r128 | 0.039 | 14.723 | 65.781 | 18.927 | 0.506 | 0.023 | 0.001 | 1.377 | |||
| ma100619_rel_withdbg.cz11a_lwas4k_c32r128 | 0.048 | 15.330 | 66.272 | 16.434 | 1.883 | 0.032 | 0.001 | 2.509 | |||
| ma101108_rel_withdbg.cz11a_c32r128 | nonzero | 0.017 | 8.729 | 69.686 | 21.120 | 0.429 | 0.020 | 0.001 | 1.241 | ||
| ma101109_rel_withdbg.cz11a_c32r128 | 0.013 | 7.928 | 69.918 | 19.129 | 2.989 | 0.023 | 0.001 | 0.001 | 4.330 | ||
| ma101109_rel_withdbg.cz11a_lwas4k_c32r128 | 0.039 | 9.058 | 69.814 | 20.063 | 1.010 | 0.015 | 0.001 | 2.084 |
Delete response time histogram: each cell has the percentage of responses that take <= the time in the header and max is the max response time in seconds. For the max column values in the top 25% of the range have a red background and in the bottom 25% of the range have a green background. The red background is not used when the min value is within 80% of the max value.
| dbms | 256us | 1ms | 4ms | 16ms | 64ms | 256ms | 1s | 4s | 16s | gt | max |
|---|---|---|---|---|---|---|---|---|---|---|---|
| ma100618_rel_withdbg.cz11a_c32r128 | nonzero | 0.226 | 31.670 | 53.724 | 14.038 | 0.330 | 0.010 | 0.001 | 1.771 | ||
| ma100618_rel_withdbg.cz11a_lwas4k_c32r128 | nonzero | 0.207 | 30.515 | 53.871 | 15.017 | 0.383 | 0.007 | 0.001 | 2.128 | ||
| ma100619_rel_withdbg.cz11a_c32r128 | nonzero | 0.205 | 30.324 | 53.428 | 15.593 | 0.442 | 0.006 | 0.001 | 1.371 | ||
| ma100619_rel_withdbg.cz11a_lwas4k_c32r128 | nonzero | 0.237 | 30.616 | 54.472 | 12.899 | 1.764 | 0.011 | 0.001 | 2.509 | ||
| ma101108_rel_withdbg.cz11a_c32r128 | nonzero | 0.091 | 19.540 | 64.858 | 15.141 | 0.363 | 0.007 | 0.001 | 1.241 | ||
| ma101109_rel_withdbg.cz11a_c32r128 | nonzero | 0.073 | 18.625 | 65.598 | 12.811 | 2.885 | 0.007 | 0.001 | nonzero | 4.329 | |
| ma101109_rel_withdbg.cz11a_lwas4k_c32r128 | nonzero | 0.181 | 21.148 | 64.096 | 13.744 | 0.826 | 0.005 | 0.001 | 2.084 |
Performance metrics for the DBMS listed above. Some are normalized by throughput, others are not. Legend for results is here.
ips	qps	rps	rmbps	wps	wmbps	rpq	rkbpq	wpi	wkbpi	csps	cpups	cspq	cpupq	dbgb1	dbgb2	rss	maxop	p50	p99	tag
8042	0	39326	614.5	35529.7	988.5	4.890	78.243	4.418	125.869	885009	16.2	110.051	967	724.8	827.3	100.5	1.771	504	80	ma100618_rel_withdbg.cz11a_c32r128
7755	0	39585	618.5	35341.8	983.3	5.104	81.671	4.557	129.845	851189	15.5	109.761	959	724.5	827.1	100.6	2.128	484	75	ma100618_rel_withdbg.cz11a_lwas4k_c32r128
7383	0	40854	638.3	36003.5	1006.0	5.534	88.539	4.877	139.533	823619	17.5	111.561	1138	725.4	828.0	100.9	1.377	420	70	ma100619_rel_withdbg.cz11a_c32r128
7556	0	40462	632.2	35404.7	989.7	5.355	85.683	4.686	134.131	848209	17.4	112.261	1105	723.2	825.8	100.8	2.509	485	60	ma100619_rel_withdbg.cz11a_lwas4k_c32r128
7225	0	37908	573.2	32392.5	901.2	5.246	81.242	4.483	127.720	922986	14.4	127.742	957	726.0	828.6	100.6	1.241	455	80	ma101108_rel_withdbg.cz11a_c32r128
6625	0	38902	589.9	32572.5	909.9	5.872	91.184	4.917	140.641	881165	15.7	133.012	1138	723.9	826.6	100.5	4.330	435	55	ma101109_rel_withdbg.cz11a_c32r128
7135	0	36880	576.3	32238.9	900.5	5.169	82.701	4.518	129.230	926021	15.8	129.782	1063	723.8	826.5	100.8	2.084	465	65	ma101109_rel_withdbg.cz11a_lwas4k_c32r128
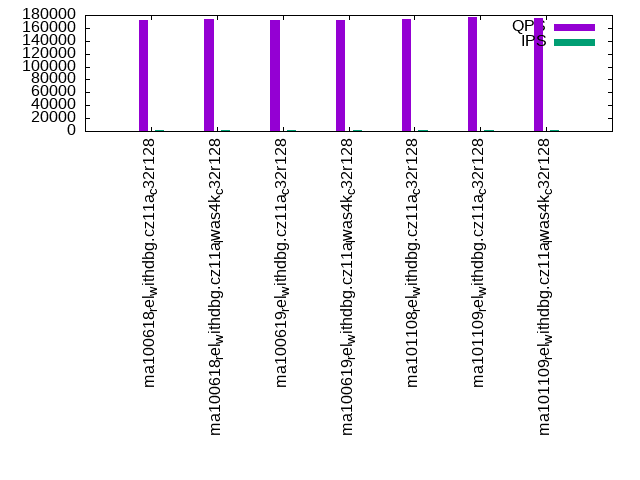
qr100.L1
qr100.L1: range queries with 100 insert/s per client. Graphs for performance per 1-second interval are here.
Average throughput:
Query response time histogram: each cell has the percentage of responses that take <= the time in the header and max is the max response time in seconds. For max values in the top 25% of the range have a red background and in the bottom 25% of the range have a green background. The red background is not used when the min value is within 80% of the max value.
| dbms | 256us | 1ms | 4ms | 16ms | 64ms | 256ms | 1s | 4s | 16s | gt | max |
|---|---|---|---|---|---|---|---|---|---|---|---|
| ma100618_rel_withdbg.cz11a_c32r128 | 99.552 | 0.408 | 0.035 | 0.004 | nonzero | nonzero | 0.132 | ||||
| ma100618_rel_withdbg.cz11a_lwas4k_c32r128 | 99.528 | 0.433 | 0.034 | 0.004 | nonzero | nonzero | 0.197 | ||||
| ma100619_rel_withdbg.cz11a_c32r128 | 99.662 | 0.300 | 0.035 | 0.003 | nonzero | 0.021 | |||||
| ma100619_rel_withdbg.cz11a_lwas4k_c32r128 | 99.589 | 0.371 | 0.038 | 0.002 | nonzero | nonzero | 0.113 | ||||
| ma101108_rel_withdbg.cz11a_c32r128 | 99.494 | 0.465 | 0.036 | 0.005 | nonzero | nonzero | 0.153 | ||||
| ma101109_rel_withdbg.cz11a_c32r128 | 99.584 | 0.376 | 0.038 | 0.003 | nonzero | nonzero | 0.173 | ||||
| ma101109_rel_withdbg.cz11a_lwas4k_c32r128 | 99.568 | 0.390 | 0.040 | 0.002 | nonzero | nonzero | 0.148 |
Insert response time histogram: each cell has the percentage of responses that take <= the time in the header and max is the max response time in seconds. For max values in the top 25% of the range have a red background and in the bottom 25% of the range have a green background. The red background is not used when the min value is within 80% of the max value.
| dbms | 256us | 1ms | 4ms | 16ms | 64ms | 256ms | 1s | 4s | 16s | gt | max |
|---|---|---|---|---|---|---|---|---|---|---|---|
| ma100618_rel_withdbg.cz11a_c32r128 | 0.457 | 99.182 | 0.361 | 0.198 | |||||||
| ma100618_rel_withdbg.cz11a_lwas4k_c32r128 | 0.447 | 99.303 | 0.250 | 0.236 | |||||||
| ma100619_rel_withdbg.cz11a_c32r128 | 2.018 | 97.982 | 0.052 | ||||||||
| ma100619_rel_withdbg.cz11a_lwas4k_c32r128 | 2.933 | 96.933 | 0.133 | 0.185 | |||||||
| ma101108_rel_withdbg.cz11a_c32r128 | 22.215 | 77.224 | 0.561 | 0.182 | |||||||
| ma101109_rel_withdbg.cz11a_c32r128 | 29.571 | 69.846 | 0.583 | 0.208 | |||||||
| ma101109_rel_withdbg.cz11a_lwas4k_c32r128 | 30.510 | 68.737 | 0.753 | 0.223 |
Delete response time histogram: each cell has the percentage of responses that take <= the time in the header and max is the max response time in seconds. For max values in the top 25% of the range have a red background and in the bottom 25% of the range have a green background. The red background is not used when the min value is within 80% of the max value.
| dbms | 256us | 1ms | 4ms | 16ms | 64ms | 256ms | 1s | 4s | 16s | gt | max |
|---|---|---|---|---|---|---|---|---|---|---|---|
| ma100618_rel_withdbg.cz11a_c32r128 | 0.750 | 99.029 | 0.221 | 0.191 | |||||||
| ma100618_rel_withdbg.cz11a_lwas4k_c32r128 | 0.672 | 99.218 | 0.110 | 0.222 | |||||||
| ma100619_rel_withdbg.cz11a_c32r128 | 8.513 | 91.487 | 0.053 | ||||||||
| ma100619_rel_withdbg.cz11a_lwas4k_c32r128 | 9.156 | 90.807 | 0.037 | 0.147 | |||||||
| ma101108_rel_withdbg.cz11a_c32r128 | 63.458 | 36.344 | 0.197 | 0.175 | |||||||
| ma101109_rel_withdbg.cz11a_c32r128 | 66.329 | 33.494 | 0.176 | 0.193 | |||||||
| ma101109_rel_withdbg.cz11a_lwas4k_c32r128 | 70.428 | 29.308 | 0.264 | 0.211 |
Performance metrics for the DBMS listed above. Some are normalized by throughput, others are not. Legend for results is here.
ips	qps	rps	rmbps	wps	wmbps	rpq	rkbpq	wpi	wkbpi	csps	cpups	cspq	cpupq	dbgb1	dbgb2	rss	maxop	p50	p99	tag
1976	172045	9139	142.8	6001.8	168.5	0.053	0.850	3.038	87.313	735597	43.4	4.276	121	724.8	827.3	100.4	0.132	8774	7320	ma100618_rel_withdbg.cz11a_c32r128
1976	173142	9159	143.1	5995.6	168.0	0.053	0.846	3.035	87.086	740545	43.5	4.277	121	724.5	827.1	100.4	0.197	8841	7594	ma100618_rel_withdbg.cz11a_lwas4k_c32r128
1976	171886	9156	143.1	6005.3	168.8	0.053	0.852	3.039	87.494	728360	44.1	4.237	123	725.4	828.0	100.4	0.021	8789	7226	ma100619_rel_withdbg.cz11a_c32r128
1976	171676	9150	143.0	5948.5	167.5	0.053	0.853	3.011	86.820	729196	44.1	4.248	123	723.2	825.8	100.4	0.113	8695	7096	ma100619_rel_withdbg.cz11a_lwas4k_c32r128
1977	173023	9221	143.1	5957.3	167.0	0.053	0.847	3.013	86.508	728223	43.3	4.209	120	726.0	828.6	100.4	0.153	8790	7368	ma101108_rel_withdbg.cz11a_c32r128
1976	176360	9253	143.4	5936.7	167.0	0.052	0.833	3.005	86.575	735891	44.1	4.173	120	723.9	826.6	100.4	0.173	8982	7512	ma101109_rel_withdbg.cz11a_c32r128
1976	175678	9144	142.9	5917.7	166.6	0.052	0.833	2.995	86.368	733333	44.2	4.174	121	723.8	826.5	100.4	0.148	8967	7736	ma101109_rel_withdbg.cz11a_lwas4k_c32r128
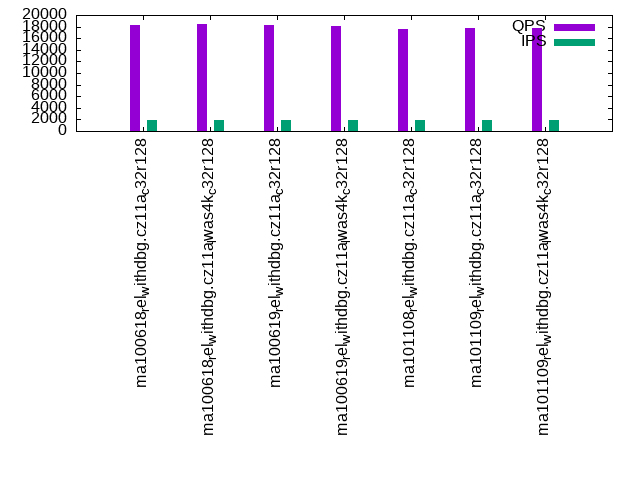
qp100.L2
qp100.L2: point queries with 100 insert/s per client. Graphs for performance per 1-second interval are here.
Average throughput:
Query response time histogram: each cell has the percentage of responses that take <= the time in the header and max is the max response time in seconds. For max values in the top 25% of the range have a red background and in the bottom 25% of the range have a green background. The red background is not used when the min value is within 80% of the max value.
| dbms | 256us | 1ms | 4ms | 16ms | 64ms | 256ms | 1s | 4s | 16s | gt | max |
|---|---|---|---|---|---|---|---|---|---|---|---|
| ma100618_rel_withdbg.cz11a_c32r128 | 0.007 | 57.994 | 41.579 | 0.379 | 0.039 | 0.001 | 0.237 | ||||
| ma100618_rel_withdbg.cz11a_lwas4k_c32r128 | 0.008 | 58.345 | 41.256 | 0.355 | 0.034 | 0.001 | nonzero | 0.360 | |||
| ma100619_rel_withdbg.cz11a_c32r128 | 0.006 | 57.006 | 42.617 | 0.339 | 0.031 | 0.001 | 0.239 | ||||
| ma100619_rel_withdbg.cz11a_lwas4k_c32r128 | 0.007 | 57.706 | 41.831 | 0.421 | 0.034 | 0.001 | nonzero | 0.269 | |||
| ma101108_rel_withdbg.cz11a_c32r128 | 0.005 | 55.918 | 43.501 | 0.505 | 0.069 | 0.002 | 0.247 | ||||
| ma101109_rel_withdbg.cz11a_c32r128 | 0.005 | 55.314 | 44.213 | 0.417 | 0.048 | 0.002 | nonzero | 0.260 | |||
| ma101109_rel_withdbg.cz11a_lwas4k_c32r128 | 0.006 | 55.909 | 43.583 | 0.444 | 0.056 | 0.002 | nonzero | 0.276 |
Insert response time histogram: each cell has the percentage of responses that take <= the time in the header and max is the max response time in seconds. For max values in the top 25% of the range have a red background and in the bottom 25% of the range have a green background. The red background is not used when the min value is within 80% of the max value.
| dbms | 256us | 1ms | 4ms | 16ms | 64ms | 256ms | 1s | 4s | 16s | gt | max |
|---|---|---|---|---|---|---|---|---|---|---|---|
| ma100618_rel_withdbg.cz11a_c32r128 | 0.182 | 88.322 | 11.354 | 0.142 | 0.357 | ||||||
| ma100618_rel_withdbg.cz11a_lwas4k_c32r128 | 0.151 | 89.808 | 9.943 | 0.097 | 0.431 | ||||||
| ma100619_rel_withdbg.cz11a_c32r128 | 0.183 | 90.742 | 8.963 | 0.112 | 0.372 | ||||||
| ma100619_rel_withdbg.cz11a_lwas4k_c32r128 | 0.178 | 88.001 | 11.767 | 0.054 | 0.310 | ||||||
| ma101108_rel_withdbg.cz11a_c32r128 | 0.160 | 84.385 | 14.892 | 0.564 | 0.401 | ||||||
| ma101109_rel_withdbg.cz11a_c32r128 | 0.214 | 89.885 | 9.363 | 0.539 | 0.438 | ||||||
| ma101109_rel_withdbg.cz11a_lwas4k_c32r128 | 0.193 | 87.796 | 11.392 | 0.619 | 0.403 |
Delete response time histogram: each cell has the percentage of responses that take <= the time in the header and max is the max response time in seconds. For max values in the top 25% of the range have a red background and in the bottom 25% of the range have a green background. The red background is not used when the min value is within 80% of the max value.
| dbms | 256us | 1ms | 4ms | 16ms | 64ms | 256ms | 1s | 4s | 16s | gt | max |
|---|---|---|---|---|---|---|---|---|---|---|---|
| ma100618_rel_withdbg.cz11a_c32r128 | 0.326 | 91.339 | 8.325 | 0.010 | 0.309 | ||||||
| ma100618_rel_withdbg.cz11a_lwas4k_c32r128 | 0.272 | 92.003 | 7.694 | 0.031 | 0.429 | ||||||
| ma100619_rel_withdbg.cz11a_c32r128 | 0.310 | 93.082 | 6.600 | 0.008 | 0.291 | ||||||
| ma100619_rel_withdbg.cz11a_lwas4k_c32r128 | 0.283 | 91.533 | 8.174 | 0.010 | 0.301 | ||||||
| ma101108_rel_withdbg.cz11a_c32r128 | 0.343 | 88.172 | 11.432 | 0.053 | 0.352 | ||||||
| ma101109_rel_withdbg.cz11a_c32r128 | 0.367 | 92.193 | 7.378 | 0.062 | 0.400 | ||||||
| ma101109_rel_withdbg.cz11a_lwas4k_c32r128 | 0.315 | 90.503 | 9.075 | 0.107 | 0.323 |
Performance metrics for the DBMS listed above. Some are normalized by throughput, others are not. Legend for results is here.
ips	qps	rps	rmbps	wps	wmbps	rpq	rkbpq	wpi	wkbpi	csps	cpups	cspq	cpupq	dbgb1	dbgb2	rss	maxop	p50	p99	tag
1976	18274	133792	2090.5	12568.0	345.9	7.322	117.145	6.361	179.283	483431	14.4	26.455	378	724.8	827.3	100.4	0.237	959	224	ma100618_rel_withdbg.cz11a_c32r128
1976	18374	134460	2100.9	12591.5	346.3	7.318	117.090	6.373	179.466	482991	14.3	26.287	374	724.5	827.1	100.4	0.360	975	224	ma100618_rel_withdbg.cz11a_lwas4k_c32r128
1976	18225	133482	2085.7	12526.8	345.8	7.324	117.186	6.340	179.208	470258	14.9	25.803	392	725.4	828.0	100.4	0.239	959	224	ma100619_rel_withdbg.cz11a_c32r128
1976	18139	132879	2076.2	12527.2	345.9	7.326	117.210	6.340	179.248	475430	14.6	26.211	386	723.2	825.8	100.4	0.269	959	224	ma100619_rel_withdbg.cz11a_lwas4k_c32r128
1976	17662	129866	2028.2	12556.6	345.5	7.353	117.590	6.355	179.046	529988	15.8	30.007	429	726.0	828.6	100.4	0.247	943	192	ma101108_rel_withdbg.cz11a_c32r128
1976	17785	130670	2040.5	12544.6	346.1	7.347	117.487	6.349	179.378	509733	15.8	28.661	426	723.9	826.6	100.4	0.260	943	192	ma101109_rel_withdbg.cz11a_c32r128
1976	17794	130587	2040.4	12532.2	346.0	7.339	117.422	6.343	179.305	516973	15.6	29.054	421	723.8	826.5	100.4	0.276	943	192	ma101109_rel_withdbg.cz11a_lwas4k_c32r128
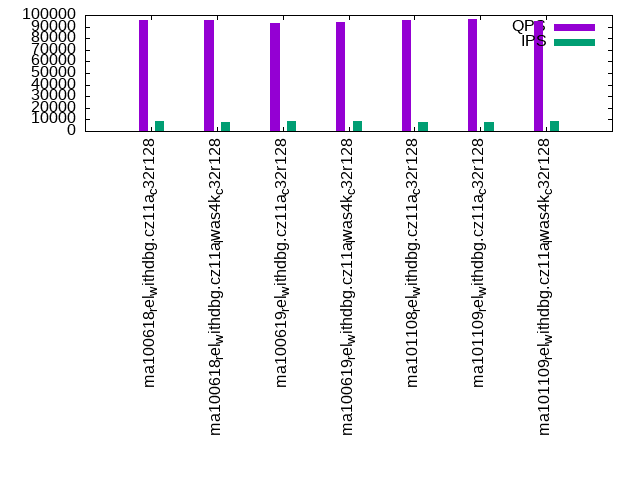
qr500.L3
qr500.L3: range queries with 500 insert/s per client. Graphs for performance per 1-second interval are here.
Average throughput:
Query response time histogram: each cell has the percentage of responses that take <= the time in the header and max is the max response time in seconds. For max values in the top 25% of the range have a red background and in the bottom 25% of the range have a green background. The red background is not used when the min value is within 80% of the max value.
| dbms | 256us | 1ms | 4ms | 16ms | 64ms | 256ms | 1s | 4s | 16s | gt | max |
|---|---|---|---|---|---|---|---|---|---|---|---|
| ma100618_rel_withdbg.cz11a_c32r128 | 93.395 | 5.219 | 1.175 | 0.152 | 0.053 | 0.005 | 0.001 | 0.372 | |||
| ma100618_rel_withdbg.cz11a_lwas4k_c32r128 | 93.276 | 5.194 | 1.319 | 0.155 | 0.049 | 0.005 | 0.001 | 0.400 | |||
| ma100619_rel_withdbg.cz11a_c32r128 | 93.014 | 5.250 | 1.502 | 0.186 | 0.043 | 0.004 | 0.001 | 0.384 | |||
| ma100619_rel_withdbg.cz11a_lwas4k_c32r128 | 93.421 | 5.078 | 1.286 | 0.161 | 0.049 | 0.005 | 0.001 | 0.426 | |||
| ma101108_rel_withdbg.cz11a_c32r128 | 93.284 | 5.421 | 1.089 | 0.145 | 0.055 | 0.005 | 0.001 | 0.389 | |||
| ma101109_rel_withdbg.cz11a_c32r128 | 93.235 | 5.398 | 1.149 | 0.163 | 0.050 | 0.005 | 0.001 | 0.417 | |||
| ma101109_rel_withdbg.cz11a_lwas4k_c32r128 | 93.263 | 5.402 | 1.118 | 0.154 | 0.058 | 0.005 | 0.001 | 0.403 |
Insert response time histogram: each cell has the percentage of responses that take <= the time in the header and max is the max response time in seconds. For max values in the top 25% of the range have a red background and in the bottom 25% of the range have a green background. The red background is not used when the min value is within 80% of the max value.
| dbms | 256us | 1ms | 4ms | 16ms | 64ms | 256ms | 1s | 4s | 16s | gt | max |
|---|---|---|---|---|---|---|---|---|---|---|---|
| ma100618_rel_withdbg.cz11a_c32r128 | 0.334 | 55.856 | 27.993 | 15.818 | 0.931 | ||||||
| ma100618_rel_withdbg.cz11a_lwas4k_c32r128 | 0.444 | 51.732 | 31.443 | 16.379 | 0.001 | 1.104 | |||||
| ma100619_rel_withdbg.cz11a_c32r128 | 0.408 | 46.266 | 40.599 | 12.727 | 0.954 | ||||||
| ma100619_rel_withdbg.cz11a_lwas4k_c32r128 | 0.567 | 52.156 | 32.557 | 14.720 | 0.975 | ||||||
| ma101108_rel_withdbg.cz11a_c32r128 | 6.557 | 50.723 | 23.737 | 18.984 | 0.661 | ||||||
| ma101109_rel_withdbg.cz11a_c32r128 | 5.290 | 45.017 | 31.140 | 18.551 | 0.001 | 1.098 | |||||
| ma101109_rel_withdbg.cz11a_lwas4k_c32r128 | 6.398 | 51.611 | 24.681 | 17.309 | 0.949 |
Delete response time histogram: each cell has the percentage of responses that take <= the time in the header and max is the max response time in seconds. For max values in the top 25% of the range have a red background and in the bottom 25% of the range have a green background. The red background is not used when the min value is within 80% of the max value.
| dbms | 256us | 1ms | 4ms | 16ms | 64ms | 256ms | 1s | 4s | 16s | gt | max |
|---|---|---|---|---|---|---|---|---|---|---|---|
| ma100618_rel_withdbg.cz11a_c32r128 | 0.489 | 61.733 | 23.915 | 13.864 | 0.840 | ||||||
| ma100618_rel_withdbg.cz11a_lwas4k_c32r128 | 0.666 | 59.218 | 25.435 | 14.681 | nonzero | 1.004 | |||||
| ma100619_rel_withdbg.cz11a_c32r128 | 0.657 | 56.334 | 31.753 | 11.256 | 0.913 | ||||||
| ma100619_rel_withdbg.cz11a_lwas4k_c32r128 | 0.688 | 59.451 | 26.936 | 12.926 | 0.899 | ||||||
| ma101108_rel_withdbg.cz11a_c32r128 | 24.500 | 38.021 | 20.611 | 16.868 | 0.656 | ||||||
| ma101109_rel_withdbg.cz11a_c32r128 | 20.269 | 36.098 | 27.041 | 16.591 | 0.982 | ||||||
| ma101109_rel_withdbg.cz11a_lwas4k_c32r128 | 23.915 | 39.486 | 21.526 | 15.074 | 0.896 |
Performance metrics for the DBMS listed above. Some are normalized by throughput, others are not. Legend for results is here.
ips	qps	rps	rmbps	wps	wmbps	rpq	rkbpq	wpi	wkbpi	csps	cpups	cspq	cpupq	dbgb1	dbgb2	rss	maxop	p50	p99	tag
8388	95942	35074	548.0	34534.5	953.0	0.366	5.849	4.117	116.343	1046054	41.5	10.903	208	725.0	827.6	100.6	0.372	4779	2749	ma100618_rel_withdbg.cz11a_c32r128
8156	95306	35060	547.8	34250.0	945.5	0.368	5.886	4.199	118.711	1037952	41.5	10.891	209	724.7	827.3	100.6	0.400	4734	2829	ma100618_rel_withdbg.cz11a_lwas4k_c32r128
8423	93324	34939	545.9	34187.1	946.4	0.374	5.990	4.059	115.056	1058552	43.2	11.343	222	725.7	828.3	100.7	0.384	4587	2765	ma100619_rel_withdbg.cz11a_c32r128
8310	94134	35409	553.3	34416.0	953.5	0.376	6.018	4.141	117.494	1026899	42.8	10.909	218	723.4	826.0	100.6	0.426	4669	2845	ma100619_rel_withdbg.cz11a_lwas4k_c32r128
8061	95370	36609	567.1	35168.4	970.8	0.384	6.089	4.363	123.328	1052763	40.5	11.039	204	726.2	828.8	100.6	0.389	4747	2493	ma101108_rel_withdbg.cz11a_c32r128
7829	96906	36127	559.8	34360.9	952.2	0.373	5.916	4.389	124.535	1064931	42.4	10.989	210	724.1	826.8	100.6	0.417	4685	2733	ma101109_rel_withdbg.cz11a_c32r128
8299	94950	35644	556.9	34883.3	965.8	0.375	6.006	4.203	119.175	1052262	41.6	11.082	210	724.1	826.8	100.7	0.403	4667	2573	ma101109_rel_withdbg.cz11a_lwas4k_c32r128
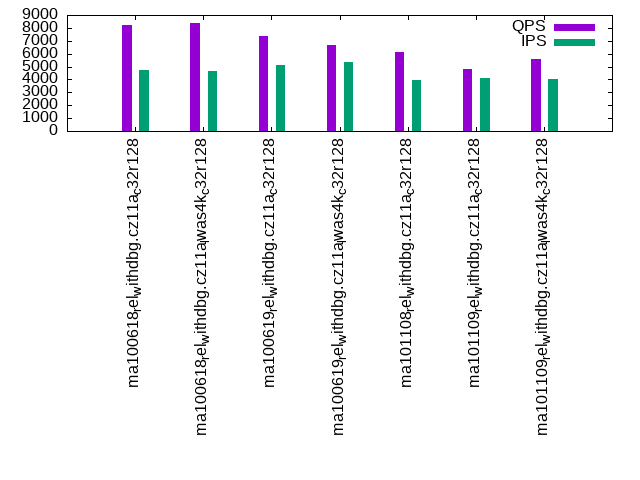
qp500.L4
qp500.L4: point queries with 500 insert/s per client. Graphs for performance per 1-second interval are here.
Average throughput:
Query response time histogram: each cell has the percentage of responses that take <= the time in the header and max is the max response time in seconds. For max values in the top 25% of the range have a red background and in the bottom 25% of the range have a green background. The red background is not used when the min value is within 80% of the max value.
| dbms | 256us | 1ms | 4ms | 16ms | 64ms | 256ms | 1s | 4s | 16s | gt | max |
|---|---|---|---|---|---|---|---|---|---|---|---|
| ma100618_rel_withdbg.cz11a_c32r128 | nonzero | 10.026 | 80.742 | 8.325 | 0.903 | 0.002 | 0.004 | 0.387 | |||
| ma100618_rel_withdbg.cz11a_lwas4k_c32r128 | nonzero | 10.275 | 80.996 | 7.734 | 0.988 | 0.002 | 0.005 | 0.487 | |||
| ma100619_rel_withdbg.cz11a_c32r128 | nonzero | 7.716 | 80.078 | 10.947 | 1.252 | 0.002 | 0.005 | 0.395 | |||
| ma100619_rel_withdbg.cz11a_lwas4k_c32r128 | nonzero | 7.259 | 77.905 | 13.027 | 1.802 | 0.002 | 0.006 | 0.365 | |||
| ma101108_rel_withdbg.cz11a_c32r128 | nonzero | 9.416 | 73.788 | 13.557 | 3.223 | 0.013 | 0.004 | 0.339 | |||
| ma101109_rel_withdbg.cz11a_c32r128 | nonzero | 5.966 | 70.594 | 18.078 | 5.345 | 0.011 | 0.005 | 0.340 | |||
| ma101109_rel_withdbg.cz11a_lwas4k_c32r128 | nonzero | 7.150 | 74.794 | 13.891 | 4.147 | 0.014 | 0.004 | 0.358 |
Insert response time histogram: each cell has the percentage of responses that take <= the time in the header and max is the max response time in seconds. For max values in the top 25% of the range have a red background and in the bottom 25% of the range have a green background. The red background is not used when the min value is within 80% of the max value.
| dbms | 256us | 1ms | 4ms | 16ms | 64ms | 256ms | 1s | 4s | 16s | gt | max |
|---|---|---|---|---|---|---|---|---|---|---|---|
| ma100618_rel_withdbg.cz11a_c32r128 | 0.154 | 22.588 | 28.380 | 48.878 | 0.860 | ||||||
| ma100618_rel_withdbg.cz11a_lwas4k_c32r128 | 0.089 | 21.067 | 27.397 | 51.446 | 0.855 | ||||||
| ma100619_rel_withdbg.cz11a_c32r128 | 0.144 | 24.450 | 33.479 | 41.928 | 0.811 | ||||||
| ma100619_rel_withdbg.cz11a_lwas4k_c32r128 | 0.258 | 28.572 | 35.495 | 35.676 | 0.754 | ||||||
| ma101108_rel_withdbg.cz11a_c32r128 | 0.017 | 14.961 | 22.737 | 62.284 | 0.829 | ||||||
| ma101109_rel_withdbg.cz11a_c32r128 | 0.055 | 17.691 | 27.259 | 54.995 | 0.817 | ||||||
| ma101109_rel_withdbg.cz11a_lwas4k_c32r128 | 0.021 | 16.104 | 25.330 | 58.544 | 0.791 |
Delete response time histogram: each cell has the percentage of responses that take <= the time in the header and max is the max response time in seconds. For max values in the top 25% of the range have a red background and in the bottom 25% of the range have a green background. The red background is not used when the min value is within 80% of the max value.
| dbms | 256us | 1ms | 4ms | 16ms | 64ms | 256ms | 1s | 4s | 16s | gt | max |
|---|---|---|---|---|---|---|---|---|---|---|---|
| ma100618_rel_withdbg.cz11a_c32r128 | 0.627 | 24.749 | 26.513 | 48.111 | 0.817 | ||||||
| ma100618_rel_withdbg.cz11a_lwas4k_c32r128 | 0.404 | 22.805 | 25.890 | 50.901 | 0.815 | ||||||
| ma100619_rel_withdbg.cz11a_c32r128 | 0.568 | 26.413 | 32.004 | 41.015 | 0.771 | ||||||
| ma100619_rel_withdbg.cz11a_lwas4k_c32r128 | 0.833 | 30.346 | 34.242 | 34.580 | 0.714 | ||||||
| ma101108_rel_withdbg.cz11a_c32r128 | 0.073 | 16.481 | 28.536 | 54.910 | 0.794 | ||||||
| ma101109_rel_withdbg.cz11a_c32r128 | 0.101 | 19.462 | 35.457 | 44.980 | 0.779 | ||||||
| ma101109_rel_withdbg.cz11a_lwas4k_c32r128 | 0.096 | 17.707 | 32.698 | 49.499 | 0.727 |
Performance metrics for the DBMS listed above. Some are normalized by throughput, others are not. Legend for results is here.
ips	qps	rps	rmbps	wps	wmbps	rpq	rkbpq	wpi	wkbpi	csps	cpups	cspq	cpupq	dbgb1	dbgb2	rss	maxop	p50	p99	tag
4763	8260	102649	1604.0	34658.7	959.3	12.428	198.855	7.276	206.230	853488	17.0	103.330	988	725.0	827.7	100.6	0.387	464	80	ma100618_rel_withdbg.cz11a_c32r128
4662	8357	103092	1610.8	34385.2	951.3	12.336	197.380	7.376	208.955	844434	16.8	101.046	965	724.9	827.6	100.6	0.487	464	80	ma100618_rel_withdbg.cz11a_lwas4k_c32r128
5114	7381	96764	1511.9	34944.8	969.6	13.110	209.751	6.834	194.164	891135	19.4	120.730	1262	725.8	828.5	100.6	0.395	384	80	ma100619_rel_withdbg.cz11a_c32r128
5389	6688	90483	1413.8	34548.4	957.7	13.529	216.463	6.411	181.973	937677	19.1	140.201	1371	723.6	826.2	100.6	0.365	336	80	ma100619_rel_withdbg.cz11a_lwas4k_c32r128
3950	6127	77265	1205.1	26692.8	738.0	12.610	201.395	6.758	191.318	1167465	18.7	190.535	1465	726.3	828.9	100.6	0.339	304	32	ma101108_rel_withdbg.cz11a_c32r128
4114	4820	65997	1029.0	25654.0	710.8	13.692	218.590	6.235	176.902	1232016	19.8	255.594	1972	724.1	826.8	100.6	0.340	208	48	ma101109_rel_withdbg.cz11a_c32r128
4047	5573	73109	1142.3	26663.6	739.3	13.119	209.906	6.589	187.088	1171408	19.3	210.205	1662	724.3	827.0	100.6	0.358	240	32	ma101109_rel_withdbg.cz11a_lwas4k_c32r128
qr1000.L5
qr1000.L5: range queries with 1000 insert/s per client. Graphs for performance per 1-second interval are here.
Average throughput:
Query response time histogram: each cell has the percentage of responses that take <= the time in the header and max is the max response time in seconds. For max values in the top 25% of the range have a red background and in the bottom 25% of the range have a green background. The red background is not used when the min value is within 80% of the max value.
| dbms | 256us | 1ms | 4ms | 16ms | 64ms | 256ms | 1s | 4s | 16s | gt | max |
|---|---|---|---|---|---|---|---|---|---|---|---|
| ma100618_rel_withdbg.cz11a_c32r128 | 92.867 | 5.498 | 1.450 | 0.167 | 0.015 | 0.002 | nonzero | 0.376 | |||
| ma100618_rel_withdbg.cz11a_lwas4k_c32r128 | 92.977 | 5.566 | 1.289 | 0.156 | 0.010 | 0.002 | nonzero | 0.452 | |||
| ma100619_rel_withdbg.cz11a_c32r128 | 93.047 | 5.042 | 1.734 | 0.162 | 0.012 | 0.002 | nonzero | 0.377 | |||
| ma100619_rel_withdbg.cz11a_lwas4k_c32r128 | 93.214 | 5.069 | 1.565 | 0.140 | 0.010 | 0.002 | nonzero | 0.378 | |||
| ma101108_rel_withdbg.cz11a_c32r128 | 92.826 | 5.764 | 1.194 | 0.193 | 0.021 | 0.002 | nonzero | 0.362 | |||
| ma101109_rel_withdbg.cz11a_c32r128 | 93.203 | 5.317 | 1.273 | 0.183 | 0.021 | 0.002 | nonzero | 0.359 | |||
| ma101109_rel_withdbg.cz11a_lwas4k_c32r128 | 92.892 | 5.489 | 1.413 | 0.188 | 0.016 | 0.002 | nonzero | 0.359 |
Insert response time histogram: each cell has the percentage of responses that take <= the time in the header and max is the max response time in seconds. For max values in the top 25% of the range have a red background and in the bottom 25% of the range have a green background. The red background is not used when the min value is within 80% of the max value.
| dbms | 256us | 1ms | 4ms | 16ms | 64ms | 256ms | 1s | 4s | 16s | gt | max |
|---|---|---|---|---|---|---|---|---|---|---|---|
| ma100618_rel_withdbg.cz11a_c32r128 | 0.053 | 17.759 | 56.582 | 25.605 | 0.001 | 1.152 | |||||
| ma100618_rel_withdbg.cz11a_lwas4k_c32r128 | 0.111 | 15.221 | 57.381 | 27.286 | 0.001 | 1.047 | |||||
| ma100619_rel_withdbg.cz11a_c32r128 | 0.030 | 15.809 | 57.468 | 26.690 | 0.002 | 1.057 | |||||
| ma100619_rel_withdbg.cz11a_lwas4k_c32r128 | 0.087 | 15.506 | 54.411 | 29.994 | 0.001 | 1.168 | |||||
| ma101108_rel_withdbg.cz11a_c32r128 | 0.812 | 16.774 | 50.901 | 31.513 | nonzero | 1.110 | |||||
| ma101109_rel_withdbg.cz11a_c32r128 | 0.656 | 15.080 | 51.159 | 33.102 | 0.002 | 1.263 | |||||
| ma101109_rel_withdbg.cz11a_lwas4k_c32r128 | 0.970 | 16.482 | 53.091 | 29.455 | 0.001 | 1.141 |
Delete response time histogram: each cell has the percentage of responses that take <= the time in the header and max is the max response time in seconds. For max values in the top 25% of the range have a red background and in the bottom 25% of the range have a green background. The red background is not used when the min value is within 80% of the max value.
| dbms | 256us | 1ms | 4ms | 16ms | 64ms | 256ms | 1s | 4s | 16s | gt | max |
|---|---|---|---|---|---|---|---|---|---|---|---|
| ma100618_rel_withdbg.cz11a_c32r128 | 0.077 | 37.278 | 37.795 | 24.850 | nonzero | 1.010 | |||||
| ma100618_rel_withdbg.cz11a_lwas4k_c32r128 | 0.142 | 35.552 | 37.677 | 26.629 | nonzero | 1.006 | |||||
| ma100619_rel_withdbg.cz11a_c32r128 | 0.065 | 37.037 | 36.850 | 26.047 | nonzero | 1.036 | |||||
| ma100619_rel_withdbg.cz11a_lwas4k_c32r128 | 0.215 | 35.953 | 34.463 | 29.368 | 0.001 | 1.059 | |||||
| ma101108_rel_withdbg.cz11a_c32r128 | 9.769 | 17.116 | 43.586 | 29.529 | nonzero | 1.080 | |||||
| ma101109_rel_withdbg.cz11a_c32r128 | 8.980 | 15.660 | 44.361 | 30.997 | 0.002 | 1.199 | |||||
| ma101109_rel_withdbg.cz11a_lwas4k_c32r128 | 10.403 | 15.868 | 46.259 | 27.468 | 0.001 | 1.057 |
Performance metrics for the DBMS listed above. Some are normalized by throughput, others are not. Legend for results is here.
ips	qps	rps	rmbps	wps	wmbps	rpq	rkbpq	wpi	wkbpi	csps	cpups	cspq	cpupq	dbgb1	dbgb2	rss	maxop	p50	p99	tag
6675	101389	36547	571.1	35601.9	985.6	0.360	5.768	5.333	151.189	1054059	44.0	10.396	208	725.0	827.7	100.7	0.376	5036	2830	ma100618_rel_withdbg.cz11a_c32r128
6458	104580	36657	572.8	35373.0	979.8	0.351	5.608	5.477	155.341	1049879	44.2	10.039	203	724.9	827.6	100.7	0.452	5402	3404	ma100618_rel_withdbg.cz11a_lwas4k_c32r128
6494	100056	37234	581.8	35825.4	995.5	0.372	5.954	5.517	156.992	1021089	45.9	10.205	220	725.8	828.5	100.7	0.377	5180	1534	ma100619_rel_withdbg.cz11a_c32r128
6244	101603	38082	595.0	36093.7	1003.7	0.375	5.997	5.780	164.589	1000119	46.1	9.843	218	723.6	826.3	100.7	0.378	5434	2925	ma100619_rel_withdbg.cz11a_lwas4k_c32r128
5968	101699	35986	558.8	34090.4	944.0	0.354	5.627	5.712	161.973	1080468	42.8	10.624	202	726.3	829.0	100.7	0.362	5146	1790	ma101108_rel_withdbg.cz11a_c32r128
5738	102202	36253	563.2	34006.1	945.5	0.355	5.642	5.927	168.730	1055350	44.3	10.326	208	724.2	826.9	100.7	0.359	5466	847	ma101109_rel_withdbg.cz11a_c32r128
6053	101317	35135	549.0	33577.8	933.0	0.347	5.549	5.547	157.830	1071698	44.5	10.578	211	724.3	827.0	100.7	0.359	4859	3069	ma101109_rel_withdbg.cz11a_lwas4k_c32r128
qp1000.L6
qp1000.L6: point queries with 1000 insert/s per client. Graphs for performance per 1-second interval are here.
Average throughput:
Query response time histogram: each cell has the percentage of responses that take <= the time in the header and max is the max response time in seconds. For max values in the top 25% of the range have a red background and in the bottom 25% of the range have a green background. The red background is not used when the min value is within 80% of the max value.
| dbms | 256us | 1ms | 4ms | 16ms | 64ms | 256ms | 1s | 4s | 16s | gt | max |
|---|---|---|---|---|---|---|---|---|---|---|---|
| ma100618_rel_withdbg.cz11a_c32r128 | nonzero | 8.984 | 77.773 | 11.908 | 1.329 | 0.002 | 0.003 | 0.377 | |||
| ma100618_rel_withdbg.cz11a_lwas4k_c32r128 | nonzero | 7.986 | 76.808 | 13.649 | 1.550 | 0.003 | 0.004 | 0.493 | |||
| ma100619_rel_withdbg.cz11a_c32r128 | nonzero | 7.902 | 79.497 | 11.115 | 1.481 | 0.001 | 0.004 | 0.390 | |||
| ma100619_rel_withdbg.cz11a_lwas4k_c32r128 | nonzero | 8.111 | 78.808 | 11.394 | 1.682 | 0.002 | 0.004 | 0.379 | |||
| ma101108_rel_withdbg.cz11a_c32r128 | nonzero | 8.166 | 73.760 | 13.569 | 4.470 | 0.031 | 0.003 | 0.342 | |||
| ma101109_rel_withdbg.cz11a_c32r128 | nonzero | 6.972 | 73.513 | 14.535 | 4.946 | 0.032 | 0.003 | 0.333 | |||
| ma101109_rel_withdbg.cz11a_lwas4k_c32r128 | nonzero | 6.789 | 74.851 | 14.647 | 3.695 | 0.014 | 0.004 | 0.356 |
Insert response time histogram: each cell has the percentage of responses that take <= the time in the header and max is the max response time in seconds. For max values in the top 25% of the range have a red background and in the bottom 25% of the range have a green background. The red background is not used when the min value is within 80% of the max value.
| dbms | 256us | 1ms | 4ms | 16ms | 64ms | 256ms | 1s | 4s | 16s | gt | max |
|---|---|---|---|---|---|---|---|---|---|---|---|
| ma100618_rel_withdbg.cz11a_c32r128 | 0.004 | 25.506 | 34.043 | 40.447 | nonzero | 1.025 | |||||
| ma100618_rel_withdbg.cz11a_lwas4k_c32r128 | 0.034 | 24.500 | 38.581 | 36.884 | 0.001 | 1.013 | |||||
| ma100619_rel_withdbg.cz11a_c32r128 | 0.013 | 21.831 | 37.878 | 40.277 | 0.749 | ||||||
| ma100619_rel_withdbg.cz11a_lwas4k_c32r128 | 0.022 | 22.271 | 38.685 | 39.021 | 0.001 | 1.010 | |||||
| ma101108_rel_withdbg.cz11a_c32r128 | 0.040 | 18.546 | 27.729 | 53.685 | 0.748 | ||||||
| ma101109_rel_withdbg.cz11a_c32r128 | 0.020 | 18.271 | 28.556 | 53.153 | 0.749 | ||||||
| ma101109_rel_withdbg.cz11a_lwas4k_c32r128 | 17.387 | 23.391 | 59.222 | 0.906 |
Delete response time histogram: each cell has the percentage of responses that take <= the time in the header and max is the max response time in seconds. For max values in the top 25% of the range have a red background and in the bottom 25% of the range have a green background. The red background is not used when the min value is within 80% of the max value.
| dbms | 256us | 1ms | 4ms | 16ms | 64ms | 256ms | 1s | 4s | 16s | gt | max |
|---|---|---|---|---|---|---|---|---|---|---|---|
| ma100618_rel_withdbg.cz11a_c32r128 | 0.005 | 30.807 | 29.963 | 39.224 | nonzero | 1.004 | |||||
| ma100618_rel_withdbg.cz11a_lwas4k_c32r128 | 0.054 | 29.537 | 34.642 | 35.768 | 0.990 | ||||||
| ma100619_rel_withdbg.cz11a_c32r128 | 0.022 | 25.445 | 35.347 | 39.186 | 0.730 | ||||||
| ma100619_rel_withdbg.cz11a_lwas4k_c32r128 | 0.031 | 27.344 | 34.741 | 37.885 | nonzero | 1.003 | |||||
| ma101108_rel_withdbg.cz11a_c32r128 | 0.109 | 20.227 | 32.887 | 46.776 | 0.692 | ||||||
| ma101109_rel_withdbg.cz11a_c32r128 | 0.098 | 19.778 | 34.281 | 45.843 | 0.728 | ||||||
| ma101109_rel_withdbg.cz11a_lwas4k_c32r128 | 0.016 | 18.978 | 28.386 | 52.619 | 0.893 |
Performance metrics for the DBMS listed above. Some are normalized by throughput, others are not. Legend for results is here.
ips	qps	rps	rmbps	wps	wmbps	rpq	rkbpq	wpi	wkbpi	csps	cpups	cspq	cpupq	dbgb1	dbgb2	rss	maxop	p50	p99	tag
5396	7308	95015	1484.6	34997.4	967.5	13.001	208.012	6.485	183.581	939783	17.8	128.589	1169	725.1	827.8	100.6	0.377	352	96	ma100618_rel_withdbg.cz11a_c32r128
5577	6903	91407	1428.2	34616.4	956.6	13.242	211.872	6.207	175.649	965233	17.9	139.832	1245	724.9	827.7	100.7	0.493	336	80	ma100618_rel_withdbg.cz11a_lwas4k_c32r128
5314	7253	95359	1490.0	34975.2	970.3	13.147	210.354	6.581	186.957	921028	19.6	126.982	1297	725.8	828.5	100.6	0.390	352	80	ma100619_rel_withdbg.cz11a_c32r128
5392	7103	93857	1466.5	34673.9	961.7	13.213	211.410	6.430	182.632	929242	19.2	130.818	1297	723.7	826.4	100.7	0.379	352	80	ma100619_rel_withdbg.cz11a_lwas4k_c32r128
4337	5408	70778	1103.6	26294.7	726.6	13.089	208.987	6.063	171.557	1203944	18.9	222.643	1678	726.4	829.1	100.7	0.342	176	32	ma101108_rel_withdbg.cz11a_c32r128
4290	5109	68608	1069.7	26047.4	722.0	13.429	214.407	6.071	172.317	1205954	19.7	236.045	1851	724.4	827.1	100.6	0.333	160	32	ma101109_rel_withdbg.cz11a_c32r128
4115	5674	74312	1161.1	27055.3	750.7	13.097	209.555	6.574	186.791	1171478	19.3	206.468	1633	724.3	827.0	100.6	0.356	256	48	ma101109_rel_withdbg.cz11a_lwas4k_c32r128
l.i0
l.i0: load without secondary indexes
Performance metrics for all DBMS, not just the ones listed above. Some are normalized by throughput, others are not. Legend for results is here.
ips	qps	rps	rmbps	wps	wmbps	rpq	rkbpq	wpi	wkbpi	csps	cpups	cspq	cpupq	dbgb1	dbgb2	rss	maxop	p50	p99	tag
332474	0	1	0.0	2334.3	97.4	0.000	0.000	0.007	0.300	856927	50.8	2.577	73	263.2	365.2	101.4	0.672	17681	200	ma100618_rel_withdbg.cz11a_c32r128
326531	0	2	0.1	2301.7	95.7	0.000	0.000	0.007	0.300	864796	51.0	2.648	75	263.2	365.2	101.4	0.657	17082	200	ma100618_rel_withdbg.cz11a_lwas4k_c32r128
324675	0	2	0.0	2275.9	95.0	0.000	0.000	0.007	0.300	863264	51.0	2.659	75	263.2	365.2	101.4	0.667	16987	200	ma100619_rel_withdbg.cz11a_c32r128
324517	0	1	0.0	2280.3	95.0	0.000	0.000	0.007	0.300	882386	50.8	2.719	75	263.2	365.2	101.4	0.659	17082	200	ma100619_rel_withdbg.cz11a_lwas4k_c32r128
282486	0	2686	10.5	2008.0	85.1	0.010	0.038	0.007	0.308	256601	50.2	0.908	85	263.2	365.2	101.4	0.661	14784	200	ma101108_rel_withdbg.cz11a_c32r128
280505	0	2614	10.2	1993.3	84.5	0.009	0.037	0.007	0.308	252763	50.6	0.901	87	263.2	365.2	101.4	0.668	14584	200	ma101109_rel_withdbg.cz11a_c32r128
279076	0	1	0.0	1983.2	84.0	0.000	0.000	0.007	0.308	241798	51.1	0.866	88	263.2	365.1	101.4	0.677	14584	200	ma101109_rel_withdbg.cz11a_lwas4k_c32r128
l.x
l.x: create secondary indexes
Performance metrics for all DBMS, not just the ones listed above. Some are normalized by throughput, others are not. Legend for results is here.
ips	qps	rps	rmbps	wps	wmbps	rpq	rkbpq	wpi	wkbpi	csps	cpups	cspq	cpupq	dbgb1	dbgb2	rss	maxop	p50	p99	tag
1589194	0	17318	1421.7	18586.1	1571.6	0.011	0.916	0.012	1.013	91399	23.2	0.058	7	557.5	659.5	101.8	0.002	NA	NA	ma100618_rel_withdbg.cz11a_c32r128
1516875	0	16526	1352.1	18114.3	1506.1	0.011	0.913	0.012	1.017	90744	22.8	0.060	7	557.5	659.5	101.8	0.002	NA	NA	ma100618_rel_withdbg.cz11a_lwas4k_c32r128
1520334	0	16548	1355.6	18105.8	1508.3	0.011	0.913	0.012	1.016	92279	23.4	0.061	7	557.5	659.5	101.8	0.002	NA	NA	ma100619_rel_withdbg.cz11a_c32r128
1520334	0	16570	1353.4	18145.3	1508.5	0.011	0.912	0.012	1.016	90501	23.4	0.060	7	557.5	659.5	101.8	0.002	NA	NA	ma100619_rel_withdbg.cz11a_lwas4k_c32r128
1614205	0	17524	1435.3	19225.7	1597.2	0.011	0.911	0.012	1.013	72953	24.8	0.045	7	557.5	659.5	101.8	0.002	NA	NA	ma101108_rel_withdbg.cz11a_c32r128
1536098	0	16806	1372.7	18422.0	1522.0	0.011	0.915	0.012	1.015	82615	23.3	0.054	7	557.5	659.5	101.8	0.006	NA	NA	ma101109_rel_withdbg.cz11a_c32r128
1549187	0	16856	1380.5	18183.8	1530.0	0.011	0.912	0.012	1.011	75231	23.9	0.049	7	557.5	659.4	101.8	0.004	NA	NA	ma101109_rel_withdbg.cz11a_lwas4k_c32r128
l.i1
l.i1: continue load after secondary indexes created with 50 inserts per transaction
Performance metrics for all DBMS, not just the ones listed above. Some are normalized by throughput, others are not. Legend for results is here.
ips	qps	rps	rmbps	wps	wmbps	rpq	rkbpq	wpi	wkbpi	csps	cpups	cspq	cpupq	dbgb1	dbgb2	rss	maxop	p50	p99	tag
6345	0	38413	600.2	37731.7	1032.6	6.054	96.862	5.947	166.648	769589	13.3	121.289	1006	724.8	827.3	100.5	93.672	300	50	ma100618_rel_withdbg.cz11a_c32r128
6373	0	38031	594.2	37426.1	1023.4	5.968	95.478	5.873	164.441	782682	13.3	122.814	1002	724.5	827.1	100.6	48.749	300	100	ma100618_rel_withdbg.cz11a_lwas4k_c32r128
6535	0	38480	601.2	37931.3	1039.8	5.888	94.206	5.804	162.924	802518	16.1	122.795	1182	725.4	828.0	100.9	56.130	300	100	ma100619_rel_withdbg.cz11a_c32r128
6495	0	38638	603.7	37960.9	1040.6	5.949	95.180	5.845	164.063	795621	15.5	122.497	1145	723.2	825.8	100.8	66.617	300	100	ma100619_rel_withdbg.cz11a_lwas4k_c32r128
6017	0	36677	569.1	35566.1	971.7	6.096	96.852	5.911	165.372	852868	12.7	141.748	1013	726.0	828.6	100.6	49.840	300	100	ma101108_rel_withdbg.cz11a_c32r128
6195	0	36934	573.0	35767.6	980.7	5.962	94.711	5.773	162.104	872089	14.7	140.766	1139	723.9	826.6	100.6	70.919	300	100	ma101109_rel_withdbg.cz11a_c32r128
6121	0	36566	571.3	35805.3	981.5	5.974	95.575	5.849	164.191	863805	14.2	141.115	1113	723.8	826.5	100.9	76.798	300	100	ma101109_rel_withdbg.cz11a_lwas4k_c32r128
l.i2
l.i2: continue load after secondary indexes created with 5 inserts per transaction
Performance metrics for all DBMS, not just the ones listed above. Some are normalized by throughput, others are not. Legend for results is here.
ips	qps	rps	rmbps	wps	wmbps	rpq	rkbpq	wpi	wkbpi	csps	cpups	cspq	cpupq	dbgb1	dbgb2	rss	maxop	p50	p99	tag
8042	0	39326	614.5	35529.7	988.5	4.890	78.243	4.418	125.869	885009	16.2	110.051	967	724.8	827.3	100.5	1.771	504	80	ma100618_rel_withdbg.cz11a_c32r128
7755	0	39585	618.5	35341.8	983.3	5.104	81.671	4.557	129.845	851189	15.5	109.761	959	724.5	827.1	100.6	2.128	484	75	ma100618_rel_withdbg.cz11a_lwas4k_c32r128
7383	0	40854	638.3	36003.5	1006.0	5.534	88.539	4.877	139.533	823619	17.5	111.561	1138	725.4	828.0	100.9	1.377	420	70	ma100619_rel_withdbg.cz11a_c32r128
7556	0	40462	632.2	35404.7	989.7	5.355	85.683	4.686	134.131	848209	17.4	112.261	1105	723.2	825.8	100.8	2.509	485	60	ma100619_rel_withdbg.cz11a_lwas4k_c32r128
7225	0	37908	573.2	32392.5	901.2	5.246	81.242	4.483	127.720	922986	14.4	127.742	957	726.0	828.6	100.6	1.241	455	80	ma101108_rel_withdbg.cz11a_c32r128
6625	0	38902	589.9	32572.5	909.9	5.872	91.184	4.917	140.641	881165	15.7	133.012	1138	723.9	826.6	100.5	4.330	435	55	ma101109_rel_withdbg.cz11a_c32r128
7135	0	36880	576.3	32238.9	900.5	5.169	82.701	4.518	129.230	926021	15.8	129.782	1063	723.8	826.5	100.8	2.084	465	65	ma101109_rel_withdbg.cz11a_lwas4k_c32r128
qr100.L1
qr100.L1: range queries with 100 insert/s per client
Performance metrics for all DBMS, not just the ones listed above. Some are normalized by throughput, others are not. Legend for results is here.
ips	qps	rps	rmbps	wps	wmbps	rpq	rkbpq	wpi	wkbpi	csps	cpups	cspq	cpupq	dbgb1	dbgb2	rss	maxop	p50	p99	tag
1976	172045	9139	142.8	6001.8	168.5	0.053	0.850	3.038	87.313	735597	43.4	4.276	121	724.8	827.3	100.4	0.132	8774	7320	ma100618_rel_withdbg.cz11a_c32r128
1976	173142	9159	143.1	5995.6	168.0	0.053	0.846	3.035	87.086	740545	43.5	4.277	121	724.5	827.1	100.4	0.197	8841	7594	ma100618_rel_withdbg.cz11a_lwas4k_c32r128
1976	171886	9156	143.1	6005.3	168.8	0.053	0.852	3.039	87.494	728360	44.1	4.237	123	725.4	828.0	100.4	0.021	8789	7226	ma100619_rel_withdbg.cz11a_c32r128
1976	171676	9150	143.0	5948.5	167.5	0.053	0.853	3.011	86.820	729196	44.1	4.248	123	723.2	825.8	100.4	0.113	8695	7096	ma100619_rel_withdbg.cz11a_lwas4k_c32r128
1977	173023	9221	143.1	5957.3	167.0	0.053	0.847	3.013	86.508	728223	43.3	4.209	120	726.0	828.6	100.4	0.153	8790	7368	ma101108_rel_withdbg.cz11a_c32r128
1976	176360	9253	143.4	5936.7	167.0	0.052	0.833	3.005	86.575	735891	44.1	4.173	120	723.9	826.6	100.4	0.173	8982	7512	ma101109_rel_withdbg.cz11a_c32r128
1976	175678	9144	142.9	5917.7	166.6	0.052	0.833	2.995	86.368	733333	44.2	4.174	121	723.8	826.5	100.4	0.148	8967	7736	ma101109_rel_withdbg.cz11a_lwas4k_c32r128
qp100.L2
qp100.L2: point queries with 100 insert/s per client
Performance metrics for all DBMS, not just the ones listed above. Some are normalized by throughput, others are not. Legend for results is here.
ips	qps	rps	rmbps	wps	wmbps	rpq	rkbpq	wpi	wkbpi	csps	cpups	cspq	cpupq	dbgb1	dbgb2	rss	maxop	p50	p99	tag
1976	18274	133792	2090.5	12568.0	345.9	7.322	117.145	6.361	179.283	483431	14.4	26.455	378	724.8	827.3	100.4	0.237	959	224	ma100618_rel_withdbg.cz11a_c32r128
1976	18374	134460	2100.9	12591.5	346.3	7.318	117.090	6.373	179.466	482991	14.3	26.287	374	724.5	827.1	100.4	0.360	975	224	ma100618_rel_withdbg.cz11a_lwas4k_c32r128
1976	18225	133482	2085.7	12526.8	345.8	7.324	117.186	6.340	179.208	470258	14.9	25.803	392	725.4	828.0	100.4	0.239	959	224	ma100619_rel_withdbg.cz11a_c32r128
1976	18139	132879	2076.2	12527.2	345.9	7.326	117.210	6.340	179.248	475430	14.6	26.211	386	723.2	825.8	100.4	0.269	959	224	ma100619_rel_withdbg.cz11a_lwas4k_c32r128
1976	17662	129866	2028.2	12556.6	345.5	7.353	117.590	6.355	179.046	529988	15.8	30.007	429	726.0	828.6	100.4	0.247	943	192	ma101108_rel_withdbg.cz11a_c32r128
1976	17785	130670	2040.5	12544.6	346.1	7.347	117.487	6.349	179.378	509733	15.8	28.661	426	723.9	826.6	100.4	0.260	943	192	ma101109_rel_withdbg.cz11a_c32r128
1976	17794	130587	2040.4	12532.2	346.0	7.339	117.422	6.343	179.305	516973	15.6	29.054	421	723.8	826.5	100.4	0.276	943	192	ma101109_rel_withdbg.cz11a_lwas4k_c32r128
qr500.L3
qr500.L3: range queries with 500 insert/s per client
Performance metrics for all DBMS, not just the ones listed above. Some are normalized by throughput, others are not. Legend for results is here.
ips	qps	rps	rmbps	wps	wmbps	rpq	rkbpq	wpi	wkbpi	csps	cpups	cspq	cpupq	dbgb1	dbgb2	rss	maxop	p50	p99	tag
8388	95942	35074	548.0	34534.5	953.0	0.366	5.849	4.117	116.343	1046054	41.5	10.903	208	725.0	827.6	100.6	0.372	4779	2749	ma100618_rel_withdbg.cz11a_c32r128
8156	95306	35060	547.8	34250.0	945.5	0.368	5.886	4.199	118.711	1037952	41.5	10.891	209	724.7	827.3	100.6	0.400	4734	2829	ma100618_rel_withdbg.cz11a_lwas4k_c32r128
8423	93324	34939	545.9	34187.1	946.4	0.374	5.990	4.059	115.056	1058552	43.2	11.343	222	725.7	828.3	100.7	0.384	4587	2765	ma100619_rel_withdbg.cz11a_c32r128
8310	94134	35409	553.3	34416.0	953.5	0.376	6.018	4.141	117.494	1026899	42.8	10.909	218	723.4	826.0	100.6	0.426	4669	2845	ma100619_rel_withdbg.cz11a_lwas4k_c32r128
8061	95370	36609	567.1	35168.4	970.8	0.384	6.089	4.363	123.328	1052763	40.5	11.039	204	726.2	828.8	100.6	0.389	4747	2493	ma101108_rel_withdbg.cz11a_c32r128
7829	96906	36127	559.8	34360.9	952.2	0.373	5.916	4.389	124.535	1064931	42.4	10.989	210	724.1	826.8	100.6	0.417	4685	2733	ma101109_rel_withdbg.cz11a_c32r128
8299	94950	35644	556.9	34883.3	965.8	0.375	6.006	4.203	119.175	1052262	41.6	11.082	210	724.1	826.8	100.7	0.403	4667	2573	ma101109_rel_withdbg.cz11a_lwas4k_c32r128
qp500.L4
qp500.L4: point queries with 500 insert/s per client
Performance metrics for all DBMS, not just the ones listed above. Some are normalized by throughput, others are not. Legend for results is here.
ips	qps	rps	rmbps	wps	wmbps	rpq	rkbpq	wpi	wkbpi	csps	cpups	cspq	cpupq	dbgb1	dbgb2	rss	maxop	p50	p99	tag
4763	8260	102649	1604.0	34658.7	959.3	12.428	198.855	7.276	206.230	853488	17.0	103.330	988	725.0	827.7	100.6	0.387	464	80	ma100618_rel_withdbg.cz11a_c32r128
4662	8357	103092	1610.8	34385.2	951.3	12.336	197.380	7.376	208.955	844434	16.8	101.046	965	724.9	827.6	100.6	0.487	464	80	ma100618_rel_withdbg.cz11a_lwas4k_c32r128
5114	7381	96764	1511.9	34944.8	969.6	13.110	209.751	6.834	194.164	891135	19.4	120.730	1262	725.8	828.5	100.6	0.395	384	80	ma100619_rel_withdbg.cz11a_c32r128
5389	6688	90483	1413.8	34548.4	957.7	13.529	216.463	6.411	181.973	937677	19.1	140.201	1371	723.6	826.2	100.6	0.365	336	80	ma100619_rel_withdbg.cz11a_lwas4k_c32r128
3950	6127	77265	1205.1	26692.8	738.0	12.610	201.395	6.758	191.318	1167465	18.7	190.535	1465	726.3	828.9	100.6	0.339	304	32	ma101108_rel_withdbg.cz11a_c32r128
4114	4820	65997	1029.0	25654.0	710.8	13.692	218.590	6.235	176.902	1232016	19.8	255.594	1972	724.1	826.8	100.6	0.340	208	48	ma101109_rel_withdbg.cz11a_c32r128
4047	5573	73109	1142.3	26663.6	739.3	13.119	209.906	6.589	187.088	1171408	19.3	210.205	1662	724.3	827.0	100.6	0.358	240	32	ma101109_rel_withdbg.cz11a_lwas4k_c32r128
qr1000.L5
qr1000.L5: range queries with 1000 insert/s per client
Performance metrics for all DBMS, not just the ones listed above. Some are normalized by throughput, others are not. Legend for results is here.
ips	qps	rps	rmbps	wps	wmbps	rpq	rkbpq	wpi	wkbpi	csps	cpups	cspq	cpupq	dbgb1	dbgb2	rss	maxop	p50	p99	tag
6675	101389	36547	571.1	35601.9	985.6	0.360	5.768	5.333	151.189	1054059	44.0	10.396	208	725.0	827.7	100.7	0.376	5036	2830	ma100618_rel_withdbg.cz11a_c32r128
6458	104580	36657	572.8	35373.0	979.8	0.351	5.608	5.477	155.341	1049879	44.2	10.039	203	724.9	827.6	100.7	0.452	5402	3404	ma100618_rel_withdbg.cz11a_lwas4k_c32r128
6494	100056	37234	581.8	35825.4	995.5	0.372	5.954	5.517	156.992	1021089	45.9	10.205	220	725.8	828.5	100.7	0.377	5180	1534	ma100619_rel_withdbg.cz11a_c32r128
6244	101603	38082	595.0	36093.7	1003.7	0.375	5.997	5.780	164.589	1000119	46.1	9.843	218	723.6	826.3	100.7	0.378	5434	2925	ma100619_rel_withdbg.cz11a_lwas4k_c32r128
5968	101699	35986	558.8	34090.4	944.0	0.354	5.627	5.712	161.973	1080468	42.8	10.624	202	726.3	829.0	100.7	0.362	5146	1790	ma101108_rel_withdbg.cz11a_c32r128
5738	102202	36253	563.2	34006.1	945.5	0.355	5.642	5.927	168.730	1055350	44.3	10.326	208	724.2	826.9	100.7	0.359	5466	847	ma101109_rel_withdbg.cz11a_c32r128
6053	101317	35135	549.0	33577.8	933.0	0.347	5.549	5.547	157.830	1071698	44.5	10.578	211	724.3	827.0	100.7	0.359	4859	3069	ma101109_rel_withdbg.cz11a_lwas4k_c32r128
qp1000.L6
qp1000.L6: point queries with 1000 insert/s per client
Performance metrics for all DBMS, not just the ones listed above. Some are normalized by throughput, others are not. Legend for results is here.
ips	qps	rps	rmbps	wps	wmbps	rpq	rkbpq	wpi	wkbpi	csps	cpups	cspq	cpupq	dbgb1	dbgb2	rss	maxop	p50	p99	tag
5396	7308	95015	1484.6	34997.4	967.5	13.001	208.012	6.485	183.581	939783	17.8	128.589	1169	725.1	827.8	100.6	0.377	352	96	ma100618_rel_withdbg.cz11a_c32r128
5577	6903	91407	1428.2	34616.4	956.6	13.242	211.872	6.207	175.649	965233	17.9	139.832	1245	724.9	827.7	100.7	0.493	336	80	ma100618_rel_withdbg.cz11a_lwas4k_c32r128
5314	7253	95359	1490.0	34975.2	970.3	13.147	210.354	6.581	186.957	921028	19.6	126.982	1297	725.8	828.5	100.6	0.390	352	80	ma100619_rel_withdbg.cz11a_c32r128
5392	7103	93857	1466.5	34673.9	961.7	13.213	211.410	6.430	182.632	929242	19.2	130.818	1297	723.7	826.4	100.7	0.379	352	80	ma100619_rel_withdbg.cz11a_lwas4k_c32r128
4337	5408	70778	1103.6	26294.7	726.6	13.089	208.987	6.063	171.557	1203944	18.9	222.643	1678	726.4	829.1	100.7	0.342	176	32	ma101108_rel_withdbg.cz11a_c32r128
4290	5109	68608	1069.7	26047.4	722.0	13.429	214.407	6.071	172.317	1205954	19.7	236.045	1851	724.4	827.1	100.6	0.333	160	32	ma101109_rel_withdbg.cz11a_c32r128
4115	5674	74312	1161.1	27055.3	750.7	13.097	209.555	6.574	186.791	1171478	19.3	206.468	1633	724.3	827.0	100.6	0.356	256	48	ma101109_rel_withdbg.cz11a_lwas4k_c32r128
l.i0
- l.i0: load without secondary indexes
- Legend for results is here.
- Each entry lists the percentage of responses that fit in that bucket (slower than max time for previous bucket, faster than min time for next bucket).
Insert response time histogram
256us	1ms	4ms	16ms	64ms	256ms	1s	4s	16s	gt	max	tag
0.000	0.139	1.294	98.331	0.044	0.112	0.081	0.000	0.000	0.000	0.672	ma100618_rel_withdbg.cz11a_c32r128
0.000	0.105	0.777	98.879	0.047	0.112	0.080	0.000	0.000	0.000	0.657	ma100618_rel_withdbg.cz11a_lwas4k_c32r128
0.000	0.107	0.732	98.932	0.037	0.111	0.081	0.000	0.000	0.000	0.667	ma100619_rel_withdbg.cz11a_c32r128
0.000	0.131	0.817	98.821	0.042	0.109	0.081	0.000	0.000	0.000	0.659	ma100619_rel_withdbg.cz11a_lwas4k_c32r128
0.000	0.074	0.305	99.376	0.046	0.106	0.093	0.000	0.000	0.000	0.661	ma101108_rel_withdbg.cz11a_c32r128
0.000	0.070	0.237	99.449	0.042	0.107	0.095	0.000	0.000	0.000	0.668	ma101109_rel_withdbg.cz11a_c32r128
0.000	0.110	0.245	99.407	0.036	0.106	0.096	0.000	0.000	0.000	0.677	ma101109_rel_withdbg.cz11a_lwas4k_c32r128
l.x
- l.x: create secondary indexes
- Legend for results is here.
- Each entry lists the percentage of responses that fit in that bucket (slower than max time for previous bucket, faster than min time for next bucket).
TODO - determine whether there is data for create index response time
l.i1
- l.i1: continue load after secondary indexes created with 50 inserts per transaction
- Legend for results is here.
- Each entry lists the percentage of responses that fit in that bucket (slower than max time for previous bucket, faster than min time for next bucket).
Insert response time histogram
256us	1ms	4ms	16ms	64ms	256ms	1s	4s	16s	gt	max	tag
0.000	0.000	0.000	0.019	18.500	54.555	26.918	0.005	0.001	0.003	93.672	ma100618_rel_withdbg.cz11a_c32r128
0.000	0.000	0.000	0.019	17.018	57.185	25.773	0.001	0.002	0.002	48.749	ma100618_rel_withdbg.cz11a_lwas4k_c32r128
0.000	0.000	0.000	0.047	17.175	58.828	23.944	0.001	0.002	0.003	56.130	ma100619_rel_withdbg.cz11a_c32r128
0.000	0.000	0.000	0.024	18.113	57.384	24.473	0.002	0.003	0.001	66.617	ma100619_rel_withdbg.cz11a_lwas4k_c32r128
0.000	0.000	0.000	0.937	14.962	57.925	26.172	nonzero	0.001	0.003	49.840	ma101108_rel_withdbg.cz11a_c32r128
0.000	0.000	0.000	1.281	14.880	59.094	24.743	0.000	0.000	0.001	70.919	ma101109_rel_withdbg.cz11a_c32r128
0.000	0.000	0.000	1.321	14.947	58.585	25.139	0.003	0.003	0.002	76.798	ma101109_rel_withdbg.cz11a_lwas4k_c32r128
Delete response time histogram
256us	1ms	4ms	16ms	64ms	256ms	1s	4s	16s	gt	max	tag
0.000	0.000	0.000	0.103	47.317	27.511	25.065	0.001	0.001	0.001	87.278	ma100618_rel_withdbg.cz11a_c32r128
0.000	0.000	0.000	0.092	45.368	30.180	24.356	nonzero	0.002	0.001	48.678	ma100618_rel_withdbg.cz11a_lwas4k_c32r128
0.000	0.000	0.000	0.107	46.894	30.456	22.540	nonzero	0.002	0.001	55.333	ma100619_rel_withdbg.cz11a_c32r128
0.000	0.000	0.000	0.060	46.042	30.913	22.981	0.001	0.001	0.001	65.612	ma100619_rel_withdbg.cz11a_lwas4k_c32r128
0.000	0.000	0.000	9.878	24.395	41.739	23.986	nonzero	0.001	nonzero	49.751	ma101108_rel_withdbg.cz11a_c32r128
0.000	0.000	0.000	9.588	25.151	42.757	22.502	nonzero	nonzero	0.001	70.828	ma101109_rel_withdbg.cz11a_c32r128
0.000	0.000	0.000	10.092	24.675	42.370	22.859	0.001	0.002	0.001	76.742	ma101109_rel_withdbg.cz11a_lwas4k_c32r128
l.i2
- l.i2: continue load after secondary indexes created with 5 inserts per transaction
- Legend for results is here.
- Each entry lists the percentage of responses that fit in that bucket (slower than max time for previous bucket, faster than min time for next bucket).
Insert response time histogram
256us	1ms	4ms	16ms	64ms	256ms	1s	4s	16s	gt	max	tag
0.000	0.042	16.311	65.535	17.673	0.410	0.028	0.001	0.000	0.000	1.771	ma100618_rel_withdbg.cz11a_c32r128
0.000	0.043	15.053	65.862	18.584	0.433	0.024	0.001	0.000	0.000	2.128	ma100618_rel_withdbg.cz11a_lwas4k_c32r128
0.000	0.039	14.723	65.781	18.927	0.506	0.023	0.001	0.000	0.000	1.377	ma100619_rel_withdbg.cz11a_c32r128
0.000	0.048	15.330	66.272	16.434	1.883	0.032	0.001	0.000	0.000	2.509	ma100619_rel_withdbg.cz11a_lwas4k_c32r128
nonzero	0.017	8.729	69.686	21.120	0.429	0.020	0.001	0.000	0.000	1.241	ma101108_rel_withdbg.cz11a_c32r128
0.000	0.013	7.928	69.918	19.129	2.989	0.023	0.001	0.001	0.000	4.330	ma101109_rel_withdbg.cz11a_c32r128
0.000	0.039	9.058	69.814	20.063	1.010	0.015	0.001	0.000	0.000	2.084	ma101109_rel_withdbg.cz11a_lwas4k_c32r128
Delete response time histogram
256us	1ms	4ms	16ms	64ms	256ms	1s	4s	16s	gt	max	tag
nonzero	0.226	31.670	53.724	14.038	0.330	0.010	0.001	0.000	0.000	1.771	ma100618_rel_withdbg.cz11a_c32r128
nonzero	0.207	30.515	53.871	15.017	0.383	0.007	0.001	0.000	0.000	2.128	ma100618_rel_withdbg.cz11a_lwas4k_c32r128
nonzero	0.205	30.324	53.428	15.593	0.442	0.006	0.001	0.000	0.000	1.371	ma100619_rel_withdbg.cz11a_c32r128
nonzero	0.237	30.616	54.472	12.899	1.764	0.011	0.001	0.000	0.000	2.509	ma100619_rel_withdbg.cz11a_lwas4k_c32r128
nonzero	0.091	19.540	64.858	15.141	0.363	0.007	0.001	0.000	0.000	1.241	ma101108_rel_withdbg.cz11a_c32r128
nonzero	0.073	18.625	65.598	12.811	2.885	0.007	0.001	nonzero	0.000	4.329	ma101109_rel_withdbg.cz11a_c32r128
nonzero	0.181	21.148	64.096	13.744	0.826	0.005	0.001	0.000	0.000	2.084	ma101109_rel_withdbg.cz11a_lwas4k_c32r128
qr100.L1
- qr100.L1: range queries with 100 insert/s per client
- Legend for results is here.
- Each entry lists the percentage of responses that fit in that bucket (slower than max time for previous bucket, faster than min time for next bucket).
Query response time histogram
256us	1ms	4ms	16ms	64ms	256ms	1s	4s	16s	gt	max	tag
99.552	0.408	0.035	0.004	nonzero	nonzero	0.000	0.000	0.000	0.000	0.132	ma100618_rel_withdbg.cz11a_c32r128
99.528	0.433	0.034	0.004	nonzero	nonzero	0.000	0.000	0.000	0.000	0.197	ma100618_rel_withdbg.cz11a_lwas4k_c32r128
99.662	0.300	0.035	0.003	nonzero	0.000	0.000	0.000	0.000	0.000	0.021	ma100619_rel_withdbg.cz11a_c32r128
99.589	0.371	0.038	0.002	nonzero	nonzero	0.000	0.000	0.000	0.000	0.113	ma100619_rel_withdbg.cz11a_lwas4k_c32r128
99.494	0.465	0.036	0.005	nonzero	nonzero	0.000	0.000	0.000	0.000	0.153	ma101108_rel_withdbg.cz11a_c32r128
99.584	0.376	0.038	0.003	nonzero	nonzero	0.000	0.000	0.000	0.000	0.173	ma101109_rel_withdbg.cz11a_c32r128
99.568	0.390	0.040	0.002	nonzero	nonzero	0.000	0.000	0.000	0.000	0.148	ma101109_rel_withdbg.cz11a_lwas4k_c32r128
Insert response time histogram
256us	1ms	4ms	16ms	64ms	256ms	1s	4s	16s	gt	max	tag
0.000	0.000	0.000	0.457	99.182	0.361	0.000	0.000	0.000	0.000	0.198	ma100618_rel_withdbg.cz11a_c32r128
0.000	0.000	0.000	0.447	99.303	0.250	0.000	0.000	0.000	0.000	0.236	ma100618_rel_withdbg.cz11a_lwas4k_c32r128
0.000	0.000	0.000	2.018	97.982	0.000	0.000	0.000	0.000	0.000	0.052	ma100619_rel_withdbg.cz11a_c32r128
0.000	0.000	0.000	2.933	96.933	0.133	0.000	0.000	0.000	0.000	0.185	ma100619_rel_withdbg.cz11a_lwas4k_c32r128
0.000	0.000	0.000	22.215	77.224	0.561	0.000	0.000	0.000	0.000	0.182	ma101108_rel_withdbg.cz11a_c32r128
0.000	0.000	0.000	29.571	69.846	0.583	0.000	0.000	0.000	0.000	0.208	ma101109_rel_withdbg.cz11a_c32r128
0.000	0.000	0.000	30.510	68.737	0.753	0.000	0.000	0.000	0.000	0.223	ma101109_rel_withdbg.cz11a_lwas4k_c32r128
Delete response time histogram
256us	1ms	4ms	16ms	64ms	256ms	1s	4s	16s	gt	max	tag
0.000	0.000	0.000	0.750	99.029	0.221	0.000	0.000	0.000	0.000	0.191	ma100618_rel_withdbg.cz11a_c32r128
0.000	0.000	0.000	0.672	99.218	0.110	0.000	0.000	0.000	0.000	0.222	ma100618_rel_withdbg.cz11a_lwas4k_c32r128
0.000	0.000	0.000	8.513	91.487	0.000	0.000	0.000	0.000	0.000	0.053	ma100619_rel_withdbg.cz11a_c32r128
0.000	0.000	0.000	9.156	90.807	0.037	0.000	0.000	0.000	0.000	0.147	ma100619_rel_withdbg.cz11a_lwas4k_c32r128
0.000	0.000	0.000	63.458	36.344	0.197	0.000	0.000	0.000	0.000	0.175	ma101108_rel_withdbg.cz11a_c32r128
0.000	0.000	0.000	66.329	33.494	0.176	0.000	0.000	0.000	0.000	0.193	ma101109_rel_withdbg.cz11a_c32r128
0.000	0.000	0.000	70.428	29.308	0.264	0.000	0.000	0.000	0.000	0.211	ma101109_rel_withdbg.cz11a_lwas4k_c32r128
qp100.L2
- qp100.L2: point queries with 100 insert/s per client
- Legend for results is here.
- Each entry lists the percentage of responses that fit in that bucket (slower than max time for previous bucket, faster than min time for next bucket).
Query response time histogram
256us	1ms	4ms	16ms	64ms	256ms	1s	4s	16s	gt	max	tag
0.007	57.994	41.579	0.379	0.039	0.001	0.000	0.000	0.000	0.000	0.237	ma100618_rel_withdbg.cz11a_c32r128
0.008	58.345	41.256	0.355	0.034	0.001	nonzero	0.000	0.000	0.000	0.360	ma100618_rel_withdbg.cz11a_lwas4k_c32r128
0.006	57.006	42.617	0.339	0.031	0.001	0.000	0.000	0.000	0.000	0.239	ma100619_rel_withdbg.cz11a_c32r128
0.007	57.706	41.831	0.421	0.034	0.001	nonzero	0.000	0.000	0.000	0.269	ma100619_rel_withdbg.cz11a_lwas4k_c32r128
0.005	55.918	43.501	0.505	0.069	0.002	0.000	0.000	0.000	0.000	0.247	ma101108_rel_withdbg.cz11a_c32r128
0.005	55.314	44.213	0.417	0.048	0.002	nonzero	0.000	0.000	0.000	0.260	ma101109_rel_withdbg.cz11a_c32r128
0.006	55.909	43.583	0.444	0.056	0.002	nonzero	0.000	0.000	0.000	0.276	ma101109_rel_withdbg.cz11a_lwas4k_c32r128
Insert response time histogram
256us	1ms	4ms	16ms	64ms	256ms	1s	4s	16s	gt	max	tag
0.000	0.000	0.000	0.182	88.322	11.354	0.142	0.000	0.000	0.000	0.357	ma100618_rel_withdbg.cz11a_c32r128
0.000	0.000	0.000	0.151	89.808	9.943	0.097	0.000	0.000	0.000	0.431	ma100618_rel_withdbg.cz11a_lwas4k_c32r128
0.000	0.000	0.000	0.183	90.742	8.963	0.112	0.000	0.000	0.000	0.372	ma100619_rel_withdbg.cz11a_c32r128
0.000	0.000	0.000	0.178	88.001	11.767	0.054	0.000	0.000	0.000	0.310	ma100619_rel_withdbg.cz11a_lwas4k_c32r128
0.000	0.000	0.000	0.160	84.385	14.892	0.564	0.000	0.000	0.000	0.401	ma101108_rel_withdbg.cz11a_c32r128
0.000	0.000	0.000	0.214	89.885	9.363	0.539	0.000	0.000	0.000	0.438	ma101109_rel_withdbg.cz11a_c32r128
0.000	0.000	0.000	0.193	87.796	11.392	0.619	0.000	0.000	0.000	0.403	ma101109_rel_withdbg.cz11a_lwas4k_c32r128
Delete response time histogram
256us	1ms	4ms	16ms	64ms	256ms	1s	4s	16s	gt	max	tag
0.000	0.000	0.000	0.326	91.339	8.325	0.010	0.000	0.000	0.000	0.309	ma100618_rel_withdbg.cz11a_c32r128
0.000	0.000	0.000	0.272	92.003	7.694	0.031	0.000	0.000	0.000	0.429	ma100618_rel_withdbg.cz11a_lwas4k_c32r128
0.000	0.000	0.000	0.310	93.082	6.600	0.008	0.000	0.000	0.000	0.291	ma100619_rel_withdbg.cz11a_c32r128
0.000	0.000	0.000	0.283	91.533	8.174	0.010	0.000	0.000	0.000	0.301	ma100619_rel_withdbg.cz11a_lwas4k_c32r128
0.000	0.000	0.000	0.343	88.172	11.432	0.053	0.000	0.000	0.000	0.352	ma101108_rel_withdbg.cz11a_c32r128
0.000	0.000	0.000	0.367	92.193	7.378	0.062	0.000	0.000	0.000	0.400	ma101109_rel_withdbg.cz11a_c32r128
0.000	0.000	0.000	0.315	90.503	9.075	0.107	0.000	0.000	0.000	0.323	ma101109_rel_withdbg.cz11a_lwas4k_c32r128
qr500.L3
- qr500.L3: range queries with 500 insert/s per client
- Legend for results is here.
- Each entry lists the percentage of responses that fit in that bucket (slower than max time for previous bucket, faster than min time for next bucket).
Query response time histogram
256us	1ms	4ms	16ms	64ms	256ms	1s	4s	16s	gt	max	tag
93.395	5.219	1.175	0.152	0.053	0.005	0.001	0.000	0.000	0.000	0.372	ma100618_rel_withdbg.cz11a_c32r128
93.276	5.194	1.319	0.155	0.049	0.005	0.001	0.000	0.000	0.000	0.400	ma100618_rel_withdbg.cz11a_lwas4k_c32r128
93.014	5.250	1.502	0.186	0.043	0.004	0.001	0.000	0.000	0.000	0.384	ma100619_rel_withdbg.cz11a_c32r128
93.421	5.078	1.286	0.161	0.049	0.005	0.001	0.000	0.000	0.000	0.426	ma100619_rel_withdbg.cz11a_lwas4k_c32r128
93.284	5.421	1.089	0.145	0.055	0.005	0.001	0.000	0.000	0.000	0.389	ma101108_rel_withdbg.cz11a_c32r128
93.235	5.398	1.149	0.163	0.050	0.005	0.001	0.000	0.000	0.000	0.417	ma101109_rel_withdbg.cz11a_c32r128
93.263	5.402	1.118	0.154	0.058	0.005	0.001	0.000	0.000	0.000	0.403	ma101109_rel_withdbg.cz11a_lwas4k_c32r128
Insert response time histogram
256us	1ms	4ms	16ms	64ms	256ms	1s	4s	16s	gt	max	tag
0.000	0.000	0.000	0.334	55.856	27.993	15.818	0.000	0.000	0.000	0.931	ma100618_rel_withdbg.cz11a_c32r128
0.000	0.000	0.000	0.444	51.732	31.443	16.379	0.001	0.000	0.000	1.104	ma100618_rel_withdbg.cz11a_lwas4k_c32r128
0.000	0.000	0.000	0.408	46.266	40.599	12.727	0.000	0.000	0.000	0.954	ma100619_rel_withdbg.cz11a_c32r128
0.000	0.000	0.000	0.567	52.156	32.557	14.720	0.000	0.000	0.000	0.975	ma100619_rel_withdbg.cz11a_lwas4k_c32r128
0.000	0.000	0.000	6.557	50.723	23.737	18.984	0.000	0.000	0.000	0.661	ma101108_rel_withdbg.cz11a_c32r128
0.000	0.000	0.000	5.290	45.017	31.140	18.551	0.001	0.000	0.000	1.098	ma101109_rel_withdbg.cz11a_c32r128
0.000	0.000	0.000	6.398	51.611	24.681	17.309	0.000	0.000	0.000	0.949	ma101109_rel_withdbg.cz11a_lwas4k_c32r128
Delete response time histogram
256us	1ms	4ms	16ms	64ms	256ms	1s	4s	16s	gt	max	tag
0.000	0.000	0.000	0.489	61.733	23.915	13.864	0.000	0.000	0.000	0.840	ma100618_rel_withdbg.cz11a_c32r128
0.000	0.000	0.000	0.666	59.218	25.435	14.681	nonzero	0.000	0.000	1.004	ma100618_rel_withdbg.cz11a_lwas4k_c32r128
0.000	0.000	0.000	0.657	56.334	31.753	11.256	0.000	0.000	0.000	0.913	ma100619_rel_withdbg.cz11a_c32r128
0.000	0.000	0.000	0.688	59.451	26.936	12.926	0.000	0.000	0.000	0.899	ma100619_rel_withdbg.cz11a_lwas4k_c32r128
0.000	0.000	0.000	24.500	38.021	20.611	16.868	0.000	0.000	0.000	0.656	ma101108_rel_withdbg.cz11a_c32r128
0.000	0.000	0.000	20.269	36.098	27.041	16.591	0.000	0.000	0.000	0.982	ma101109_rel_withdbg.cz11a_c32r128
0.000	0.000	0.000	23.915	39.486	21.526	15.074	0.000	0.000	0.000	0.896	ma101109_rel_withdbg.cz11a_lwas4k_c32r128
qp500.L4
- qp500.L4: point queries with 500 insert/s per client
- Legend for results is here.
- Each entry lists the percentage of responses that fit in that bucket (slower than max time for previous bucket, faster than min time for next bucket).
Query response time histogram
256us	1ms	4ms	16ms	64ms	256ms	1s	4s	16s	gt	max	tag
nonzero	10.026	80.742	8.325	0.903	0.002	0.004	0.000	0.000	0.000	0.387	ma100618_rel_withdbg.cz11a_c32r128
nonzero	10.275	80.996	7.734	0.988	0.002	0.005	0.000	0.000	0.000	0.487	ma100618_rel_withdbg.cz11a_lwas4k_c32r128
nonzero	7.716	80.078	10.947	1.252	0.002	0.005	0.000	0.000	0.000	0.395	ma100619_rel_withdbg.cz11a_c32r128
nonzero	7.259	77.905	13.027	1.802	0.002	0.006	0.000	0.000	0.000	0.365	ma100619_rel_withdbg.cz11a_lwas4k_c32r128
nonzero	9.416	73.788	13.557	3.223	0.013	0.004	0.000	0.000	0.000	0.339	ma101108_rel_withdbg.cz11a_c32r128
nonzero	5.966	70.594	18.078	5.345	0.011	0.005	0.000	0.000	0.000	0.340	ma101109_rel_withdbg.cz11a_c32r128
nonzero	7.150	74.794	13.891	4.147	0.014	0.004	0.000	0.000	0.000	0.358	ma101109_rel_withdbg.cz11a_lwas4k_c32r128
Insert response time histogram
256us	1ms	4ms	16ms	64ms	256ms	1s	4s	16s	gt	max	tag
0.000	0.000	0.000	0.154	22.588	28.380	48.878	0.000	0.000	0.000	0.860	ma100618_rel_withdbg.cz11a_c32r128
0.000	0.000	0.000	0.089	21.067	27.397	51.446	0.000	0.000	0.000	0.855	ma100618_rel_withdbg.cz11a_lwas4k_c32r128
0.000	0.000	0.000	0.144	24.450	33.479	41.928	0.000	0.000	0.000	0.811	ma100619_rel_withdbg.cz11a_c32r128
0.000	0.000	0.000	0.258	28.572	35.495	35.676	0.000	0.000	0.000	0.754	ma100619_rel_withdbg.cz11a_lwas4k_c32r128
0.000	0.000	0.000	0.017	14.961	22.737	62.284	0.000	0.000	0.000	0.829	ma101108_rel_withdbg.cz11a_c32r128
0.000	0.000	0.000	0.055	17.691	27.259	54.995	0.000	0.000	0.000	0.817	ma101109_rel_withdbg.cz11a_c32r128
0.000	0.000	0.000	0.021	16.104	25.330	58.544	0.000	0.000	0.000	0.791	ma101109_rel_withdbg.cz11a_lwas4k_c32r128
Delete response time histogram
256us	1ms	4ms	16ms	64ms	256ms	1s	4s	16s	gt	max	tag
0.000	0.000	0.000	0.627	24.749	26.513	48.111	0.000	0.000	0.000	0.817	ma100618_rel_withdbg.cz11a_c32r128
0.000	0.000	0.000	0.404	22.805	25.890	50.901	0.000	0.000	0.000	0.815	ma100618_rel_withdbg.cz11a_lwas4k_c32r128
0.000	0.000	0.000	0.568	26.413	32.004	41.015	0.000	0.000	0.000	0.771	ma100619_rel_withdbg.cz11a_c32r128
0.000	0.000	0.000	0.833	30.346	34.242	34.580	0.000	0.000	0.000	0.714	ma100619_rel_withdbg.cz11a_lwas4k_c32r128
0.000	0.000	0.000	0.073	16.481	28.536	54.910	0.000	0.000	0.000	0.794	ma101108_rel_withdbg.cz11a_c32r128
0.000	0.000	0.000	0.101	19.462	35.457	44.980	0.000	0.000	0.000	0.779	ma101109_rel_withdbg.cz11a_c32r128
0.000	0.000	0.000	0.096	17.707	32.698	49.499	0.000	0.000	0.000	0.727	ma101109_rel_withdbg.cz11a_lwas4k_c32r128
qr1000.L5
- qr1000.L5: range queries with 1000 insert/s per client
- Legend for results is here.
- Each entry lists the percentage of responses that fit in that bucket (slower than max time for previous bucket, faster than min time for next bucket).
Query response time histogram
256us	1ms	4ms	16ms	64ms	256ms	1s	4s	16s	gt	max	tag
92.867	5.498	1.450	0.167	0.015	0.002	nonzero	0.000	0.000	0.000	0.376	ma100618_rel_withdbg.cz11a_c32r128
92.977	5.566	1.289	0.156	0.010	0.002	nonzero	0.000	0.000	0.000	0.452	ma100618_rel_withdbg.cz11a_lwas4k_c32r128
93.047	5.042	1.734	0.162	0.012	0.002	nonzero	0.000	0.000	0.000	0.377	ma100619_rel_withdbg.cz11a_c32r128
93.214	5.069	1.565	0.140	0.010	0.002	nonzero	0.000	0.000	0.000	0.378	ma100619_rel_withdbg.cz11a_lwas4k_c32r128
92.826	5.764	1.194	0.193	0.021	0.002	nonzero	0.000	0.000	0.000	0.362	ma101108_rel_withdbg.cz11a_c32r128
93.203	5.317	1.273	0.183	0.021	0.002	nonzero	0.000	0.000	0.000	0.359	ma101109_rel_withdbg.cz11a_c32r128
92.892	5.489	1.413	0.188	0.016	0.002	nonzero	0.000	0.000	0.000	0.359	ma101109_rel_withdbg.cz11a_lwas4k_c32r128
Insert response time histogram
256us	1ms	4ms	16ms	64ms	256ms	1s	4s	16s	gt	max	tag
0.000	0.000	0.000	0.053	17.759	56.582	25.605	0.001	0.000	0.000	1.152	ma100618_rel_withdbg.cz11a_c32r128
0.000	0.000	0.000	0.111	15.221	57.381	27.286	0.001	0.000	0.000	1.047	ma100618_rel_withdbg.cz11a_lwas4k_c32r128
0.000	0.000	0.000	0.030	15.809	57.468	26.690	0.002	0.000	0.000	1.057	ma100619_rel_withdbg.cz11a_c32r128
0.000	0.000	0.000	0.087	15.506	54.411	29.994	0.001	0.000	0.000	1.168	ma100619_rel_withdbg.cz11a_lwas4k_c32r128
0.000	0.000	0.000	0.812	16.774	50.901	31.513	nonzero	0.000	0.000	1.110	ma101108_rel_withdbg.cz11a_c32r128
0.000	0.000	0.000	0.656	15.080	51.159	33.102	0.002	0.000	0.000	1.263	ma101109_rel_withdbg.cz11a_c32r128
0.000	0.000	0.000	0.970	16.482	53.091	29.455	0.001	0.000	0.000	1.141	ma101109_rel_withdbg.cz11a_lwas4k_c32r128
Delete response time histogram
256us	1ms	4ms	16ms	64ms	256ms	1s	4s	16s	gt	max	tag
0.000	0.000	0.000	0.077	37.278	37.795	24.850	nonzero	0.000	0.000	1.010	ma100618_rel_withdbg.cz11a_c32r128
0.000	0.000	0.000	0.142	35.552	37.677	26.629	nonzero	0.000	0.000	1.006	ma100618_rel_withdbg.cz11a_lwas4k_c32r128
0.000	0.000	0.000	0.065	37.037	36.850	26.047	nonzero	0.000	0.000	1.036	ma100619_rel_withdbg.cz11a_c32r128
0.000	0.000	0.000	0.215	35.953	34.463	29.368	0.001	0.000	0.000	1.059	ma100619_rel_withdbg.cz11a_lwas4k_c32r128
0.000	0.000	0.000	9.769	17.116	43.586	29.529	nonzero	0.000	0.000	1.080	ma101108_rel_withdbg.cz11a_c32r128
0.000	0.000	0.000	8.980	15.660	44.361	30.997	0.002	0.000	0.000	1.199	ma101109_rel_withdbg.cz11a_c32r128
0.000	0.000	0.000	10.403	15.868	46.259	27.468	0.001	0.000	0.000	1.057	ma101109_rel_withdbg.cz11a_lwas4k_c32r128
qp1000.L6
- qp1000.L6: point queries with 1000 insert/s per client
- Legend for results is here.
- Each entry lists the percentage of responses that fit in that bucket (slower than max time for previous bucket, faster than min time for next bucket).
Query response time histogram
256us	1ms	4ms	16ms	64ms	256ms	1s	4s	16s	gt	max	tag
nonzero	8.984	77.773	11.908	1.329	0.002	0.003	0.000	0.000	0.000	0.377	ma100618_rel_withdbg.cz11a_c32r128
nonzero	7.986	76.808	13.649	1.550	0.003	0.004	0.000	0.000	0.000	0.493	ma100618_rel_withdbg.cz11a_lwas4k_c32r128
nonzero	7.902	79.497	11.115	1.481	0.001	0.004	0.000	0.000	0.000	0.390	ma100619_rel_withdbg.cz11a_c32r128
nonzero	8.111	78.808	11.394	1.682	0.002	0.004	0.000	0.000	0.000	0.379	ma100619_rel_withdbg.cz11a_lwas4k_c32r128
nonzero	8.166	73.760	13.569	4.470	0.031	0.003	0.000	0.000	0.000	0.342	ma101108_rel_withdbg.cz11a_c32r128
nonzero	6.972	73.513	14.535	4.946	0.032	0.003	0.000	0.000	0.000	0.333	ma101109_rel_withdbg.cz11a_c32r128
nonzero	6.789	74.851	14.647	3.695	0.014	0.004	0.000	0.000	0.000	0.356	ma101109_rel_withdbg.cz11a_lwas4k_c32r128
Insert response time histogram
256us	1ms	4ms	16ms	64ms	256ms	1s	4s	16s	gt	max	tag
0.000	0.000	0.000	0.004	25.506	34.043	40.447	nonzero	0.000	0.000	1.025	ma100618_rel_withdbg.cz11a_c32r128
0.000	0.000	0.000	0.034	24.500	38.581	36.884	0.001	0.000	0.000	1.013	ma100618_rel_withdbg.cz11a_lwas4k_c32r128
0.000	0.000	0.000	0.013	21.831	37.878	40.277	0.000	0.000	0.000	0.749	ma100619_rel_withdbg.cz11a_c32r128
0.000	0.000	0.000	0.022	22.271	38.685	39.021	0.001	0.000	0.000	1.010	ma100619_rel_withdbg.cz11a_lwas4k_c32r128
0.000	0.000	0.000	0.040	18.546	27.729	53.685	0.000	0.000	0.000	0.748	ma101108_rel_withdbg.cz11a_c32r128
0.000	0.000	0.000	0.020	18.271	28.556	53.153	0.000	0.000	0.000	0.749	ma101109_rel_withdbg.cz11a_c32r128
0.000	0.000	0.000	0.000	17.387	23.391	59.222	0.000	0.000	0.000	0.906	ma101109_rel_withdbg.cz11a_lwas4k_c32r128
Delete response time histogram
256us	1ms	4ms	16ms	64ms	256ms	1s	4s	16s	gt	max	tag
0.000	0.000	0.000	0.005	30.807	29.963	39.224	nonzero	0.000	0.000	1.004	ma100618_rel_withdbg.cz11a_c32r128
0.000	0.000	0.000	0.054	29.537	34.642	35.768	0.000	0.000	0.000	0.990	ma100618_rel_withdbg.cz11a_lwas4k_c32r128
0.000	0.000	0.000	0.022	25.445	35.347	39.186	0.000	0.000	0.000	0.730	ma100619_rel_withdbg.cz11a_c32r128
0.000	0.000	0.000	0.031	27.344	34.741	37.885	nonzero	0.000	0.000	1.003	ma100619_rel_withdbg.cz11a_lwas4k_c32r128
0.000	0.000	0.000	0.109	20.227	32.887	46.776	0.000	0.000	0.000	0.692	ma101108_rel_withdbg.cz11a_c32r128
0.000	0.000	0.000	0.098	19.778	34.281	45.843	0.000	0.000	0.000	0.728	ma101109_rel_withdbg.cz11a_c32r128
0.000	0.000	0.000	0.016	18.978	28.386	52.619	0.000	0.000	0.000	0.893	ma101109_rel_withdbg.cz11a_lwas4k_c32r128