Introduction
This is a report for the insert benchmark with 200M docs and 20 client(s). It is generated by scripts (bash, awk, sed) and Tufte might not be impressed. An overview of the insert benchmark is here and a short update is here. Below, by DBMS, I mean DBMS+version.config. An example is my8020.c10b40 where my means MySQL, 8020 is version 8.0.20 and c10b40 is the name for the configuration file.
The test server is an ax162-s from Hetzner (see here) with 48 cores, AMD SMT disabled, 128G RAM and ext4 using 2 NVMe devices with SW RAID 1. The benchmark was run with 20 clients and there were 1 or 3 connections per client (1 for queries or inserts without rate limits, 1+1 for rate limited inserts+deletes). It uses 8 tables with a table per client. It loads 10M rows per table without secondary indexes, creates 3 secondary indexes per table, then inserts 16m+4m rows per table with a delete per insert to avoid growing the table. It then does 6 read+write tests for 1800s each that do queries as fast as possible with 100,100,500,500,1000,1000 inserts/s and the same for deletes/s per client concurrent with the queries. The database is cached in memory. Clients and the DBMS share one server.
The tested DBMS are:
- ma101109_rel_withdbg.cz11a_c32r128 - MariaDB 10.11.9 compiled with CMAKE_BUILD_TYPE=RelWithDebInfo using my.cnf.cz11a_c32r128
- ma110403_rel_withdbg.cz11b_c32r128 - MariaDB 11.4.3 compiled with CMAKE_BUILD_TYPE=RelWithDebInfo using my.cnf.cz11a_c32r128
- my8039_rel_o2nofp.cz11a_c32r128 - MySQL 8.0.39 compiled with CMAKE_BUILD_TYPE=Release, -O2 and frame pointers enabled using my.cnf.cz11a_c32r128
Contents
- Summary
- l.i0: load without secondary indexes
- l.x: create secondary indexes
- l.i1: continue load after secondary indexes created with 50 inserts per transaction
- l.i2: continue load after secondary indexes created with 5 inserts per transaction
- qr100.L1: range queries with 100 insert/s per client
- qp100.L2: point queries with 100 insert/s per client
- qr500.L3: range queries with 500 insert/s per client
- qp500.L4: point queries with 500 insert/s per client
- qr1000.L5: range queries with 1000 insert/s per client
- qp1000.L6: point queries with 1000 insert/s per client
Summary
The numbers are inserts/s for l.i0, l.i1 and l.i2, indexed docs (or rows) /s for l.x and queries/s for qr100, qp100 thru qr1000, qp1000" The values are the average rate over the entire test for inserts (IPS) and queries (QPS). The range of values for IPS and QPS is split into 3 parts: bottom 25%, middle 50%, top 25%. Values in the bottom 25% have a red background, values in the top 25% have a green background and values in the middle have no color. A gray background is used for values that can be ignored because the DBMS did not sustain the target insert rate. Red backgrounds are not used when the minimum value is within 80% of the max value.
| dbms | l.i0 | l.x | l.i1 | l.i2 | qr100 | qp100 | qr500 | qp500 | qr1000 | qp1000 |
|---|---|---|---|---|---|---|---|---|---|---|
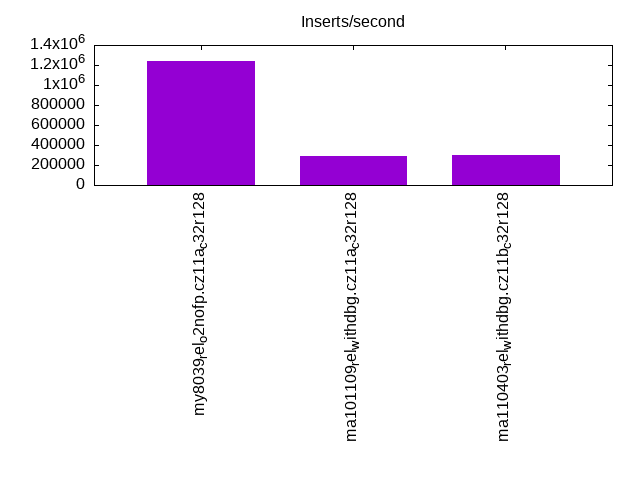
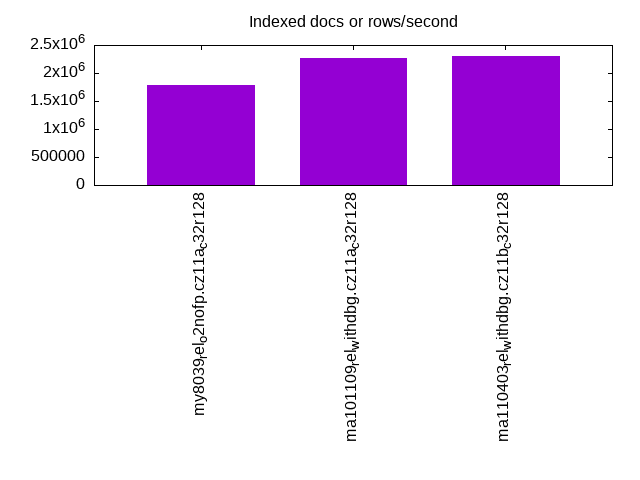
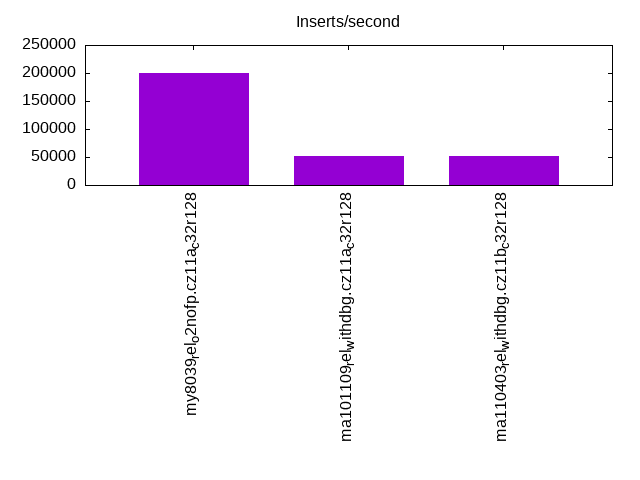
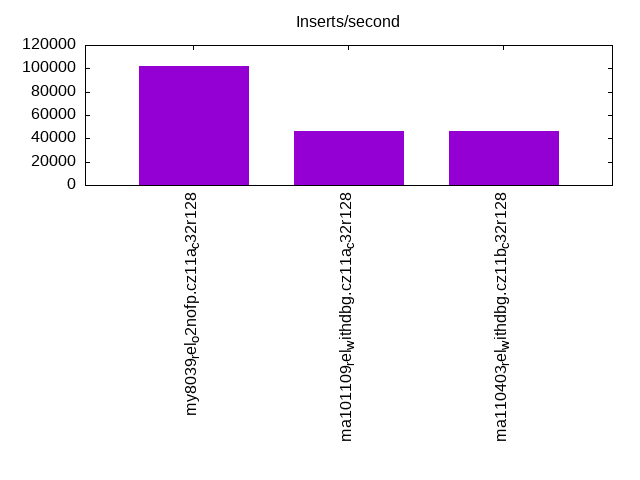
| my8039_rel_o2nofp.cz11a_c32r128 | 1242236 | 1785715 | 200753 | 102041 | 187460 | 120800 | 184773 | 118655 | 180303 | 115161 |
| ma101109_rel_withdbg.cz11a_c32r128 | 289436 | 2272728 | 51298 | 45977 | 189664 | 139258 | 180596 | 138082 | 170338 | 128883 |
| ma110403_rel_withdbg.cz11b_c32r128 | 295421 | 2298852 | 52339 | 46163 | 188368 | 140198 | 179877 | 139698 | 170672 | 130006 |
This table has relative throughput, throughput for the DBMS relative to the DBMS in the first line, using the absolute throughput from the previous table. Values less than 0.95 have a yellow background. Values greater than 1.05 have a blue background.
| dbms | l.i0 | l.x | l.i1 | l.i2 | qr100 | qp100 | qr500 | qp500 | qr1000 | qp1000 |
|---|---|---|---|---|---|---|---|---|---|---|
| my8039_rel_o2nofp.cz11a_c32r128 | 1.00 | 1.00 | 1.00 | 1.00 | 1.00 | 1.00 | 1.00 | 1.00 | 1.00 | 1.00 |
| ma101109_rel_withdbg.cz11a_c32r128 | 0.23 | 1.27 | 0.26 | 0.45 | 1.01 | 1.15 | 0.98 | 1.16 | 0.94 | 1.12 |
| ma110403_rel_withdbg.cz11b_c32r128 | 0.24 | 1.29 | 0.26 | 0.45 | 1.00 | 1.16 | 0.97 | 1.18 | 0.95 | 1.13 |
This lists the average rate of inserts/s for the tests that do inserts concurrent with queries. For such tests the query rate is listed in the table above. The read+write tests are setup so that the insert rate should match the target rate every second. Cells that are not at least 95% of the target have a red background to indicate a failure to satisfy the target.
| dbms | qr100.L1 | qp100.L2 | qr500.L3 | qp500.L4 | qr1000.L5 | qp1000.L6 |
|---|---|---|---|---|---|---|
| my8039_rel_o2nofp.cz11a_c32r128 | 1977 | 1977 | 9885 | 9885 | 19769 | 19769 |
| ma101109_rel_withdbg.cz11a_c32r128 | 1977 | 1977 | 9879 | 9879 | 19769 | 19769 |
| ma110403_rel_withdbg.cz11b_c32r128 | 1976 | 1977 | 9879 | 9879 | 19780 | 19769 |
| target | 2000 | 2000 | 10000 | 10000 | 20000 | 20000 |
l.i0
l.i0: load without secondary indexes. Graphs for performance per 1-second interval are here.
Average throughput:
Insert response time histogram: each cell has the percentage of responses that take <= the time in the header and max is the max response time in seconds. For the max column values in the top 25% of the range have a red background and in the bottom 25% of the range have a green background. The red background is not used when the min value is within 80% of the max value.
| dbms | 256us | 1ms | 4ms | 16ms | 64ms | 256ms | 1s | 4s | 16s | gt | max |
|---|---|---|---|---|---|---|---|---|---|---|---|
| my8039_rel_o2nofp.cz11a_c32r128 | 1.713 | 98.210 | 0.027 | 0.013 | 0.037 | 0.204 | |||||
| ma101109_rel_withdbg.cz11a_c32r128 | 1.303 | 1.770 | 96.806 | 0.013 | 0.087 | 0.022 | 0.528 | ||||
| ma110403_rel_withdbg.cz11b_c32r128 | 1.238 | 1.952 | 96.690 | 0.012 | 0.087 | 0.020 | 0.628 |
Performance metrics for the DBMS listed above. Some are normalized by throughput, others are not. Legend for results is here.
ips	qps	rps	rmbps	wps	wmbps	rpq	rkbpq	wpi	wkbpi	csps	cpups	cspq	cpupq	dbgb1	dbgb2	rss	maxop	p50	p99	tag
1242236	0	1	0.0	4741.8	361.3	0.000	0.000	0.004	0.298	245337	47.3	0.197	18	13.3	113.9	20.8	0.204	75619	61833	my8039_rel_o2nofp.cz11a_c32r128
289436	0	1	0.0	1477.8	77.0	0.000	0.000	0.005	0.272	234236	51.2	0.809	85	13.3	115.2	16.5	0.528	14784	4595	ma101109_rel_withdbg.cz11a_c32r128
295421	0	0	0.0	1500.6	78.0	0.000	0.000	0.005	0.270	239517	51.3	0.811	83	13.3	115.2	16.2	0.628	14988	5194	ma110403_rel_withdbg.cz11b_c32r128
l.x
l.x: create secondary indexes.
Average throughput:
Performance metrics for the DBMS listed above. Some are normalized by throughput, others are not. Legend for results is here.
ips	qps	rps	rmbps	wps	wmbps	rpq	rkbpq	wpi	wkbpi	csps	cpups	cspq	cpupq	dbgb1	dbgb2	rss	maxop	p50	p99	tag
1785715	0	13495	580.7	50836.1	1925.4	0.008	0.333	0.028	1.104	167394	59.2	0.094	16	30.3	130.9	30.2	0.005	NA	NA	my8039_rel_o2nofp.cz11a_c32r128
2272728	0	2	0.0	17275.0	1613.4	0.000	0.000	0.008	0.727	89598	29.5	0.039	6	28.1	130.0	23.7	0.005	NA	NA	ma101109_rel_withdbg.cz11a_c32r128
2298852	0	2	0.0	17289.0	1615.3	0.000	0.000	0.008	0.720	94452	29.9	0.041	6	28.1	130.1	23.9	0.005	NA	NA	ma110403_rel_withdbg.cz11b_c32r128
l.i1
l.i1: continue load after secondary indexes created with 50 inserts per transaction. Graphs for performance per 1-second interval are here.
Average throughput:
Insert response time histogram: each cell has the percentage of responses that take <= the time in the header and max is the max response time in seconds. For the max column values in the top 25% of the range have a red background and in the bottom 25% of the range have a green background. The red background is not used when the min value is within 80% of the max value.
| dbms | 256us | 1ms | 4ms | 16ms | 64ms | 256ms | 1s | 4s | 16s | gt | max |
|---|---|---|---|---|---|---|---|---|---|---|---|
| my8039_rel_o2nofp.cz11a_c32r128 | 64.798 | 34.839 | 0.304 | 0.058 | nonzero | 0.332 | |||||
| ma101109_rel_withdbg.cz11a_c32r128 | 0.023 | 68.409 | 29.806 | 0.350 | 1.411 | 0.390 | |||||
| ma110403_rel_withdbg.cz11b_c32r128 | 0.030 | 73.226 | 25.026 | 0.355 | 1.362 | 0.373 |
Delete response time histogram: each cell has the percentage of responses that take <= the time in the header and max is the max response time in seconds. For the max column values in the top 25% of the range have a red background and in the bottom 25% of the range have a green background. The red background is not used when the min value is within 80% of the max value.
| dbms | 256us | 1ms | 4ms | 16ms | 64ms | 256ms | 1s | 4s | 16s | gt | max |
|---|---|---|---|---|---|---|---|---|---|---|---|
| my8039_rel_o2nofp.cz11a_c32r128 | nonzero | 67.924 | 31.670 | 0.327 | 0.079 | 0.225 | |||||
| ma101109_rel_withdbg.cz11a_c32r128 | 0.084 | 75.469 | 22.689 | 0.353 | 1.406 | 0.388 | |||||
| ma110403_rel_withdbg.cz11b_c32r128 | nonzero | 0.073 | 75.114 | 23.096 | 0.357 | 1.360 | 0.373 |
Performance metrics for the DBMS listed above. Some are normalized by throughput, others are not. Legend for results is here.
ips	qps	rps	rmbps	wps	wmbps	rpq	rkbpq	wpi	wkbpi	csps	cpups	cspq	cpupq	dbgb1	dbgb2	rss	maxop	p50	p99	tag
200753	0	606	9.5	11917.4	500.9	0.003	0.048	0.059	2.555	370103	49.7	1.844	119	48.9	151.5	65.3	0.332	11488	3296	my8039_rel_o2nofp.cz11a_c32r128
51298	0	2136	8.4	7692.0	246.3	0.042	0.168	0.150	4.917	261305	63.0	5.094	589	40.9	143.6	43.2	0.390	3097	150	ma101109_rel_withdbg.cz11a_c32r128
52339	0	2186	8.5	7855.6	248.7	0.042	0.167	0.150	4.867	266290	63.4	5.088	581	40.8	143.4	43.1	0.373	3147	150	ma110403_rel_withdbg.cz11b_c32r128
l.i2
l.i2: continue load after secondary indexes created with 5 inserts per transaction. Graphs for performance per 1-second interval are here.
Average throughput:
Insert response time histogram: each cell has the percentage of responses that take <= the time in the header and max is the max response time in seconds. For the max column values in the top 25% of the range have a red background and in the bottom 25% of the range have a green background. The red background is not used when the min value is within 80% of the max value.
| dbms | 256us | 1ms | 4ms | 16ms | 64ms | 256ms | 1s | 4s | 16s | gt | max |
|---|---|---|---|---|---|---|---|---|---|---|---|
| my8039_rel_o2nofp.cz11a_c32r128 | 0.063 | 78.012 | 19.964 | 1.949 | 0.004 | 0.008 | 0.185 | ||||
| ma101109_rel_withdbg.cz11a_c32r128 | 0.071 | 1.052 | 97.963 | 0.312 | 0.584 | 0.017 | 0.155 | ||||
| ma110403_rel_withdbg.cz11b_c32r128 | 0.067 | 1.207 | 97.808 | 0.318 | 0.583 | 0.016 | 0.155 |
Delete response time histogram: each cell has the percentage of responses that take <= the time in the header and max is the max response time in seconds. For the max column values in the top 25% of the range have a red background and in the bottom 25% of the range have a green background. The red background is not used when the min value is within 80% of the max value.
| dbms | 256us | 1ms | 4ms | 16ms | 64ms | 256ms | 1s | 4s | 16s | gt | max |
|---|---|---|---|---|---|---|---|---|---|---|---|
| my8039_rel_o2nofp.cz11a_c32r128 | 0.067 | 78.244 | 19.746 | 1.931 | 0.004 | 0.008 | 0.194 | ||||
| ma101109_rel_withdbg.cz11a_c32r128 | 0.099 | 1.093 | 97.900 | 0.306 | 0.586 | 0.017 | 0.160 | ||||
| ma110403_rel_withdbg.cz11b_c32r128 | 0.066 | 1.135 | 97.875 | 0.323 | 0.584 | 0.016 | 0.155 |
Performance metrics for the DBMS listed above. Some are normalized by throughput, others are not. Legend for results is here.
ips	qps	rps	rmbps	wps	wmbps	rpq	rkbpq	wpi	wkbpi	csps	cpups	cspq	cpupq	dbgb1	dbgb2	rss	maxop	p50	p99	tag
102041	0	0	0.0	9810.9	405.7	0.000	0.000	0.096	4.072	627095	52.0	6.146	245	48.9	150.1	65.4	0.185	5739	824	my8039_rel_o2nofp.cz11a_c32r128
45977	0	5113	20.0	5882.3	199.0	0.111	0.445	0.128	4.433	563851	55.0	12.264	574	40.9	143.6	43.2	0.155	2462	170	ma101109_rel_withdbg.cz11a_c32r128
46163	0	5135	20.1	5906.0	199.8	0.111	0.445	0.128	4.432	596805	55.1	12.928	573	40.8	143.4	43.1	0.155	2472	175	ma110403_rel_withdbg.cz11b_c32r128
qr100.L1
qr100.L1: range queries with 100 insert/s per client. Graphs for performance per 1-second interval are here.
Average throughput:
Query response time histogram: each cell has the percentage of responses that take <= the time in the header and max is the max response time in seconds. For max values in the top 25% of the range have a red background and in the bottom 25% of the range have a green background. The red background is not used when the min value is within 80% of the max value.
| dbms | 256us | 1ms | 4ms | 16ms | 64ms | 256ms | 1s | 4s | 16s | gt | max |
|---|---|---|---|---|---|---|---|---|---|---|---|
| my8039_rel_o2nofp.cz11a_c32r128 | 99.984 | 0.014 | 0.002 | nonzero | 0.013 | ||||||
| ma101109_rel_withdbg.cz11a_c32r128 | 99.964 | 0.034 | 0.002 | nonzero | 0.009 | ||||||
| ma110403_rel_withdbg.cz11b_c32r128 | 99.963 | 0.036 | 0.002 | nonzero | nonzero | 0.017 |
Insert response time histogram: each cell has the percentage of responses that take <= the time in the header and max is the max response time in seconds. For max values in the top 25% of the range have a red background and in the bottom 25% of the range have a green background. The red background is not used when the min value is within 80% of the max value.
| dbms | 256us | 1ms | 4ms | 16ms | 64ms | 256ms | 1s | 4s | 16s | gt | max |
|---|---|---|---|---|---|---|---|---|---|---|---|
| my8039_rel_o2nofp.cz11a_c32r128 | 98.057 | 1.943 | 0.013 | ||||||||
| ma101109_rel_withdbg.cz11a_c32r128 | 11.285 | 88.607 | 0.108 | 0.025 | |||||||
| ma110403_rel_withdbg.cz11b_c32r128 | 20.899 | 78.871 | 0.231 | 0.026 |
Delete response time histogram: each cell has the percentage of responses that take <= the time in the header and max is the max response time in seconds. For max values in the top 25% of the range have a red background and in the bottom 25% of the range have a green background. The red background is not used when the min value is within 80% of the max value.
| dbms | 256us | 1ms | 4ms | 16ms | 64ms | 256ms | 1s | 4s | 16s | gt | max |
|---|---|---|---|---|---|---|---|---|---|---|---|
| my8039_rel_o2nofp.cz11a_c32r128 | 0.007 | 98.792 | 1.201 | 0.012 | |||||||
| ma101109_rel_withdbg.cz11a_c32r128 | 0.013 | 14.203 | 85.719 | 0.065 | 0.024 | ||||||
| ma110403_rel_withdbg.cz11b_c32r128 | 0.007 | 22.656 | 77.207 | 0.131 | 0.025 |
Performance metrics for the DBMS listed above. Some are normalized by throughput, others are not. Legend for results is here.
ips	qps	rps	rmbps	wps	wmbps	rpq	rkbpq	wpi	wkbpi	csps	cpups	cspq	cpupq	dbgb1	dbgb2	rss	maxop	p50	p99	tag
1977	187460	0	0.0	2278.1	64.8	0.000	0.000	1.152	33.573	723084	42.9	3.857	110	48.9	150.1	65.3	0.013	9478	9094	my8039_rel_o2nofp.cz11a_c32r128
1977	189664	68	0.3	33.5	2.4	0.000	0.001	0.017	1.240	730253	43.5	3.850	110	40.9	143.6	42.9	0.009	9622	9078	ma101109_rel_withdbg.cz11a_c32r128
1976	188368	71	0.3	21.7	2.2	0.000	0.002	0.011	1.137	725493	43.5	3.851	111	40.8	143.4	42.8	0.017	9462	9030	ma110403_rel_withdbg.cz11b_c32r128
qp100.L2
qp100.L2: point queries with 100 insert/s per client. Graphs for performance per 1-second interval are here.
Average throughput:
Query response time histogram: each cell has the percentage of responses that take <= the time in the header and max is the max response time in seconds. For max values in the top 25% of the range have a red background and in the bottom 25% of the range have a green background. The red background is not used when the min value is within 80% of the max value.
| dbms | 256us | 1ms | 4ms | 16ms | 64ms | 256ms | 1s | 4s | 16s | gt | max |
|---|---|---|---|---|---|---|---|---|---|---|---|
| my8039_rel_o2nofp.cz11a_c32r128 | 99.201 | 0.790 | 0.009 | nonzero | 0.011 | ||||||
| ma101109_rel_withdbg.cz11a_c32r128 | 99.194 | 0.799 | 0.006 | nonzero | 0.012 | ||||||
| ma110403_rel_withdbg.cz11b_c32r128 | 99.189 | 0.805 | 0.006 | nonzero | 0.014 |
Insert response time histogram: each cell has the percentage of responses that take <= the time in the header and max is the max response time in seconds. For max values in the top 25% of the range have a red background and in the bottom 25% of the range have a green background. The red background is not used when the min value is within 80% of the max value.
| dbms | 256us | 1ms | 4ms | 16ms | 64ms | 256ms | 1s | 4s | 16s | gt | max |
|---|---|---|---|---|---|---|---|---|---|---|---|
| my8039_rel_o2nofp.cz11a_c32r128 | 99.081 | 0.919 | 0.010 | ||||||||
| ma101109_rel_withdbg.cz11a_c32r128 | 8.612 | 90.482 | 0.906 | 0.026 | |||||||
| ma110403_rel_withdbg.cz11b_c32r128 | 9.451 | 90.343 | 0.206 | 0.023 |
Delete response time histogram: each cell has the percentage of responses that take <= the time in the header and max is the max response time in seconds. For max values in the top 25% of the range have a red background and in the bottom 25% of the range have a green background. The red background is not used when the min value is within 80% of the max value.
| dbms | 256us | 1ms | 4ms | 16ms | 64ms | 256ms | 1s | 4s | 16s | gt | max |
|---|---|---|---|---|---|---|---|---|---|---|---|
| my8039_rel_o2nofp.cz11a_c32r128 | 99.510 | 0.490 | 0.011 | ||||||||
| ma101109_rel_withdbg.cz11a_c32r128 | 0.024 | 8.889 | 90.472 | 0.615 | 0.024 | ||||||
| ma110403_rel_withdbg.cz11b_c32r128 | 10.019 | 89.850 | 0.131 | 0.023 |
Performance metrics for the DBMS listed above. Some are normalized by throughput, others are not. Legend for results is here.
ips	qps	rps	rmbps	wps	wmbps	rpq	rkbpq	wpi	wkbpi	csps	cpups	cspq	cpupq	dbgb1	dbgb2	rss	maxop	p50	p99	tag
1977	120800	0	0.0	247.1	8.6	0.000	0.000	0.125	4.445	477454	41.6	3.952	165	48.9	150.1	65.3	0.011	6121	5770	my8039_rel_o2nofp.cz11a_c32r128
1977	139258	64	0.3	28.4	2.2	0.000	0.002	0.014	1.138	545407	42.0	3.917	145	40.9	143.6	42.9	0.012	7048	6361	ma101109_rel_withdbg.cz11a_c32r128
1977	140198	60	0.2	21.3	2.2	0.000	0.002	0.011	1.129	547693	42.0	3.907	144	40.8	143.4	42.8	0.014	7127	6281	ma110403_rel_withdbg.cz11b_c32r128
qr500.L3
qr500.L3: range queries with 500 insert/s per client. Graphs for performance per 1-second interval are here.
Average throughput:
Query response time histogram: each cell has the percentage of responses that take <= the time in the header and max is the max response time in seconds. For max values in the top 25% of the range have a red background and in the bottom 25% of the range have a green background. The red background is not used when the min value is within 80% of the max value.
| dbms | 256us | 1ms | 4ms | 16ms | 64ms | 256ms | 1s | 4s | 16s | gt | max |
|---|---|---|---|---|---|---|---|---|---|---|---|
| my8039_rel_o2nofp.cz11a_c32r128 | 99.964 | 0.024 | 0.011 | 0.001 | nonzero | 0.027 | |||||
| ma101109_rel_withdbg.cz11a_c32r128 | 99.708 | 0.277 | 0.014 | 0.001 | nonzero | 0.036 | |||||
| ma110403_rel_withdbg.cz11b_c32r128 | 99.701 | 0.287 | 0.013 | nonzero | nonzero | 0.028 |
Insert response time histogram: each cell has the percentage of responses that take <= the time in the header and max is the max response time in seconds. For max values in the top 25% of the range have a red background and in the bottom 25% of the range have a green background. The red background is not used when the min value is within 80% of the max value.
| dbms | 256us | 1ms | 4ms | 16ms | 64ms | 256ms | 1s | 4s | 16s | gt | max |
|---|---|---|---|---|---|---|---|---|---|---|---|
| my8039_rel_o2nofp.cz11a_c32r128 | 78.628 | 21.066 | 0.306 | 0.037 | |||||||
| ma101109_rel_withdbg.cz11a_c32r128 | 0.001 | 4.716 | 79.238 | 16.046 | 0.055 | ||||||
| ma110403_rel_withdbg.cz11b_c32r128 | 0.002 | 4.001 | 81.097 | 14.899 | 0.055 |
Delete response time histogram: each cell has the percentage of responses that take <= the time in the header and max is the max response time in seconds. For max values in the top 25% of the range have a red background and in the bottom 25% of the range have a green background. The red background is not used when the min value is within 80% of the max value.
| dbms | 256us | 1ms | 4ms | 16ms | 64ms | 256ms | 1s | 4s | 16s | gt | max |
|---|---|---|---|---|---|---|---|---|---|---|---|
| my8039_rel_o2nofp.cz11a_c32r128 | 0.014 | 84.300 | 15.463 | 0.224 | 0.038 | ||||||
| ma101109_rel_withdbg.cz11a_c32r128 | 0.020 | 4.376 | 82.901 | 12.704 | 0.057 | ||||||
| ma110403_rel_withdbg.cz11b_c32r128 | 0.015 | 3.835 | 82.891 | 13.259 | 0.057 |
Performance metrics for the DBMS listed above. Some are normalized by throughput, others are not. Legend for results is here.
ips	qps	rps	rmbps	wps	wmbps	rpq	rkbpq	wpi	wkbpi	csps	cpups	cspq	cpupq	dbgb1	dbgb2	rss	maxop	p50	p99	tag
9885	184773	0	0.0	1348.1	47.6	0.000	0.000	0.136	4.928	712444	44.9	3.856	117	48.9	150.1	65.3	0.027	9318	8918	my8039_rel_o2nofp.cz11a_c32r128
9879	180596	333	1.3	1274.7	41.6	0.002	0.007	0.129	4.316	721788	48.2	3.997	128	40.9	143.6	42.9	0.036	9161	8647	ma101109_rel_withdbg.cz11a_c32r128
9879	179877	324	1.3	1260.5	41.4	0.002	0.007	0.128	4.287	719270	48.2	3.999	129	40.8	143.4	42.9	0.028	9126	8535	ma110403_rel_withdbg.cz11b_c32r128
qp500.L4
qp500.L4: point queries with 500 insert/s per client. Graphs for performance per 1-second interval are here.
Average throughput:
Query response time histogram: each cell has the percentage of responses that take <= the time in the header and max is the max response time in seconds. For max values in the top 25% of the range have a red background and in the bottom 25% of the range have a green background. The red background is not used when the min value is within 80% of the max value.
| dbms | 256us | 1ms | 4ms | 16ms | 64ms | 256ms | 1s | 4s | 16s | gt | max |
|---|---|---|---|---|---|---|---|---|---|---|---|
| my8039_rel_o2nofp.cz11a_c32r128 | 98.971 | 0.963 | 0.062 | 0.004 | nonzero | 0.028 | |||||
| ma101109_rel_withdbg.cz11a_c32r128 | 98.459 | 1.516 | 0.025 | nonzero | nonzero | 0.022 | |||||
| ma110403_rel_withdbg.cz11b_c32r128 | 98.561 | 1.417 | 0.022 | nonzero | nonzero | 0.016 |
Insert response time histogram: each cell has the percentage of responses that take <= the time in the header and max is the max response time in seconds. For max values in the top 25% of the range have a red background and in the bottom 25% of the range have a green background. The red background is not used when the min value is within 80% of the max value.
| dbms | 256us | 1ms | 4ms | 16ms | 64ms | 256ms | 1s | 4s | 16s | gt | max |
|---|---|---|---|---|---|---|---|---|---|---|---|
| my8039_rel_o2nofp.cz11a_c32r128 | 82.558 | 17.363 | 0.079 | 0.027 | |||||||
| ma101109_rel_withdbg.cz11a_c32r128 | 0.001 | 4.093 | 77.395 | 18.512 | 0.042 | ||||||
| ma110403_rel_withdbg.cz11b_c32r128 | 0.002 | 4.553 | 80.973 | 14.473 | 0.050 |
Delete response time histogram: each cell has the percentage of responses that take <= the time in the header and max is the max response time in seconds. For max values in the top 25% of the range have a red background and in the bottom 25% of the range have a green background. The red background is not used when the min value is within 80% of the max value.
| dbms | 256us | 1ms | 4ms | 16ms | 64ms | 256ms | 1s | 4s | 16s | gt | max |
|---|---|---|---|---|---|---|---|---|---|---|---|
| my8039_rel_o2nofp.cz11a_c32r128 | 0.001 | 87.772 | 12.175 | 0.051 | 0.030 | ||||||
| ma101109_rel_withdbg.cz11a_c32r128 | 0.016 | 3.416 | 82.204 | 14.363 | 0.034 | ||||||
| ma110403_rel_withdbg.cz11b_c32r128 | 0.009 | 4.373 | 82.851 | 12.767 | 0.037 |
Performance metrics for the DBMS listed above. Some are normalized by throughput, others are not. Legend for results is here.
ips	qps	rps	rmbps	wps	wmbps	rpq	rkbpq	wpi	wkbpi	csps	cpups	cspq	cpupq	dbgb1	dbgb2	rss	maxop	p50	p99	tag
9885	118655	0	0.0	1364.1	48.1	0.000	0.000	0.138	4.985	477892	43.4	4.028	176	48.9	150.1	65.3	0.028	6009	5658	my8039_rel_o2nofp.cz11a_c32r128
9879	138082	341	1.3	1223.7	40.5	0.002	0.010	0.124	4.199	586731	46.5	4.249	162	40.9	143.6	42.9	0.022	7000	6537	ma101109_rel_withdbg.cz11a_c32r128
9879	139698	342	1.3	1212.0	40.3	0.002	0.010	0.123	4.176	592160	46.3	4.239	159	40.8	143.4	42.8	0.016	7082	6571	ma110403_rel_withdbg.cz11b_c32r128
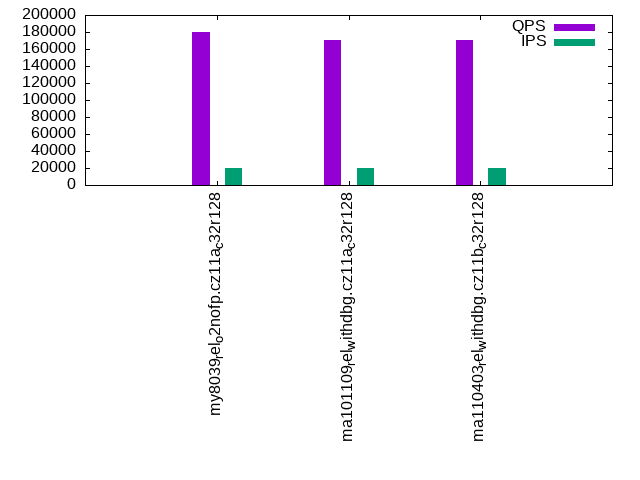
qr1000.L5
qr1000.L5: range queries with 1000 insert/s per client. Graphs for performance per 1-second interval are here.
Average throughput:
Query response time histogram: each cell has the percentage of responses that take <= the time in the header and max is the max response time in seconds. For max values in the top 25% of the range have a red background and in the bottom 25% of the range have a green background. The red background is not used when the min value is within 80% of the max value.
| dbms | 256us | 1ms | 4ms | 16ms | 64ms | 256ms | 1s | 4s | 16s | gt | max |
|---|---|---|---|---|---|---|---|---|---|---|---|
| my8039_rel_o2nofp.cz11a_c32r128 | 99.909 | 0.057 | 0.031 | 0.002 | nonzero | 0.030 | |||||
| ma101109_rel_withdbg.cz11a_c32r128 | 99.383 | 0.586 | 0.030 | 0.002 | nonzero | 0.030 | |||||
| ma110403_rel_withdbg.cz11b_c32r128 | 99.391 | 0.584 | 0.025 | nonzero | nonzero | 0.025 |
Insert response time histogram: each cell has the percentage of responses that take <= the time in the header and max is the max response time in seconds. For max values in the top 25% of the range have a red background and in the bottom 25% of the range have a green background. The red background is not used when the min value is within 80% of the max value.
| dbms | 256us | 1ms | 4ms | 16ms | 64ms | 256ms | 1s | 4s | 16s | gt | max |
|---|---|---|---|---|---|---|---|---|---|---|---|
| my8039_rel_o2nofp.cz11a_c32r128 | 53.542 | 45.298 | 1.161 | 0.044 | |||||||
| ma101109_rel_withdbg.cz11a_c32r128 | nonzero | 2.841 | 72.995 | 24.164 | nonzero | 0.066 | |||||
| ma110403_rel_withdbg.cz11b_c32r128 | 0.007 | 2.655 | 76.861 | 20.476 | nonzero | 0.066 |
Delete response time histogram: each cell has the percentage of responses that take <= the time in the header and max is the max response time in seconds. For max values in the top 25% of the range have a red background and in the bottom 25% of the range have a green background. The red background is not used when the min value is within 80% of the max value.
| dbms | 256us | 1ms | 4ms | 16ms | 64ms | 256ms | 1s | 4s | 16s | gt | max |
|---|---|---|---|---|---|---|---|---|---|---|---|
| my8039_rel_o2nofp.cz11a_c32r128 | 0.012 | 61.040 | 38.056 | 0.893 | 0.063 | ||||||
| ma101109_rel_withdbg.cz11a_c32r128 | 0.018 | 2.202 | 77.707 | 20.073 | nonzero | 0.066 | |||||
| ma110403_rel_withdbg.cz11b_c32r128 | 0.030 | 2.401 | 78.672 | 18.897 | nonzero | 0.072 |
Performance metrics for the DBMS listed above. Some are normalized by throughput, others are not. Legend for results is here.
ips	qps	rps	rmbps	wps	wmbps	rpq	rkbpq	wpi	wkbpi	csps	cpups	cspq	cpupq	dbgb1	dbgb2	rss	maxop	p50	p99	tag
19769	180303	3	0.2	2208.7	82.5	0.000	0.001	0.112	4.274	699976	46.7	3.882	124	48.9	150.1	65.3	0.030	9094	8679	my8039_rel_o2nofp.cz11a_c32r128
19769	170338	636	2.5	2064.7	70.5	0.004	0.015	0.104	3.650	706355	53.5	4.147	151	40.9	143.6	43.0	0.030	8631	8010	ma101109_rel_withdbg.cz11a_c32r128
19780	170672	632	2.5	2066.6	70.4	0.004	0.015	0.104	3.647	710270	53.2	4.162	150	40.8	143.4	42.9	0.025	8599	7943	ma110403_rel_withdbg.cz11b_c32r128
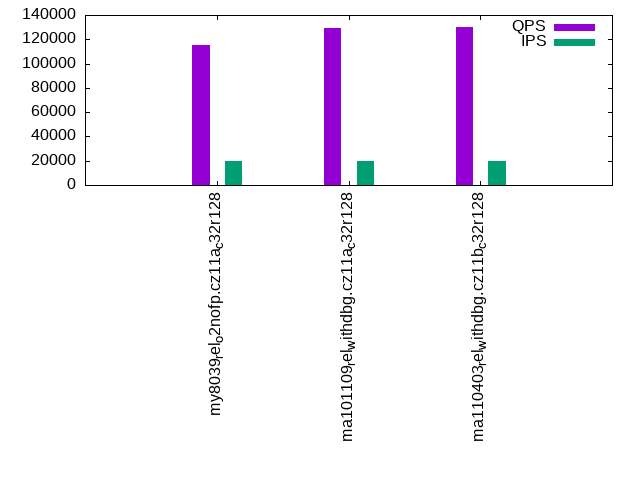
qp1000.L6
qp1000.L6: point queries with 1000 insert/s per client. Graphs for performance per 1-second interval are here.
Average throughput:
Query response time histogram: each cell has the percentage of responses that take <= the time in the header and max is the max response time in seconds. For max values in the top 25% of the range have a red background and in the bottom 25% of the range have a green background. The red background is not used when the min value is within 80% of the max value.
| dbms | 256us | 1ms | 4ms | 16ms | 64ms | 256ms | 1s | 4s | 16s | gt | max |
|---|---|---|---|---|---|---|---|---|---|---|---|
| my8039_rel_o2nofp.cz11a_c32r128 | 98.199 | 1.629 | 0.163 | 0.009 | nonzero | 0.028 | |||||
| ma101109_rel_withdbg.cz11a_c32r128 | 96.909 | 3.055 | 0.036 | nonzero | nonzero | 0.040 | |||||
| ma110403_rel_withdbg.cz11b_c32r128 | 96.840 | 3.123 | 0.037 | nonzero | nonzero | 0.024 |
Insert response time histogram: each cell has the percentage of responses that take <= the time in the header and max is the max response time in seconds. For max values in the top 25% of the range have a red background and in the bottom 25% of the range have a green background. The red background is not used when the min value is within 80% of the max value.
| dbms | 256us | 1ms | 4ms | 16ms | 64ms | 256ms | 1s | 4s | 16s | gt | max |
|---|---|---|---|---|---|---|---|---|---|---|---|
| my8039_rel_o2nofp.cz11a_c32r128 | 58.413 | 41.265 | 0.322 | 0.045 | |||||||
| ma101109_rel_withdbg.cz11a_c32r128 | 0.002 | 2.790 | 74.590 | 22.618 | 0.059 | ||||||
| ma110403_rel_withdbg.cz11b_c32r128 | 0.001 | 2.452 | 76.526 | 21.021 | 0.058 |
Delete response time histogram: each cell has the percentage of responses that take <= the time in the header and max is the max response time in seconds. For max values in the top 25% of the range have a red background and in the bottom 25% of the range have a green background. The red background is not used when the min value is within 80% of the max value.
| dbms | 256us | 1ms | 4ms | 16ms | 64ms | 256ms | 1s | 4s | 16s | gt | max |
|---|---|---|---|---|---|---|---|---|---|---|---|
| my8039_rel_o2nofp.cz11a_c32r128 | 0.003 | 65.987 | 33.767 | 0.243 | 0.043 | ||||||
| ma101109_rel_withdbg.cz11a_c32r128 | 0.015 | 2.089 | 79.730 | 18.166 | 0.059 | ||||||
| ma110403_rel_withdbg.cz11b_c32r128 | 0.008 | 2.199 | 78.469 | 19.325 | 0.054 |
Performance metrics for the DBMS listed above. Some are normalized by throughput, others are not. Legend for results is here.
ips	qps	rps	rmbps	wps	wmbps	rpq	rkbpq	wpi	wkbpi	csps	cpups	cspq	cpupq	dbgb1	dbgb2	rss	maxop	p50	p99	tag
19769	115161	0	0.0	2293.1	84.8	0.000	0.000	0.116	4.390	473339	45.1	4.110	188	48.9	150.1	65.4	0.028	5818	5466	my8039_rel_o2nofp.cz11a_c32r128
19769	128883	667	2.6	2441.5	81.0	0.005	0.021	0.123	4.194	583186	51.6	4.525	192	40.9	143.6	43.0	0.040	6505	5995	ma101109_rel_withdbg.cz11a_c32r128
19769	130006	670	2.6	2442.9	80.9	0.005	0.021	0.124	4.188	594551	51.2	4.573	189	40.8	143.4	42.9	0.024	6585	6087	ma110403_rel_withdbg.cz11b_c32r128
l.i0
l.i0: load without secondary indexes
Performance metrics for all DBMS, not just the ones listed above. Some are normalized by throughput, others are not. Legend for results is here.
ips	qps	rps	rmbps	wps	wmbps	rpq	rkbpq	wpi	wkbpi	csps	cpups	cspq	cpupq	dbgb1	dbgb2	rss	maxop	p50	p99	tag
1242236	0	1	0.0	4741.8	361.3	0.000	0.000	0.004	0.298	245337	47.3	0.197	18	13.3	113.9	20.8	0.204	75619	61833	my8039_rel_o2nofp.cz11a_c32r128
289436	0	1	0.0	1477.8	77.0	0.000	0.000	0.005	0.272	234236	51.2	0.809	85	13.3	115.2	16.5	0.528	14784	4595	ma101109_rel_withdbg.cz11a_c32r128
295421	0	0	0.0	1500.6	78.0	0.000	0.000	0.005	0.270	239517	51.3	0.811	83	13.3	115.2	16.2	0.628	14988	5194	ma110403_rel_withdbg.cz11b_c32r128
l.x
l.x: create secondary indexes
Performance metrics for all DBMS, not just the ones listed above. Some are normalized by throughput, others are not. Legend for results is here.
ips	qps	rps	rmbps	wps	wmbps	rpq	rkbpq	wpi	wkbpi	csps	cpups	cspq	cpupq	dbgb1	dbgb2	rss	maxop	p50	p99	tag
1785715	0	13495	580.7	50836.1	1925.4	0.008	0.333	0.028	1.104	167394	59.2	0.094	16	30.3	130.9	30.2	0.005	NA	NA	my8039_rel_o2nofp.cz11a_c32r128
2272728	0	2	0.0	17275.0	1613.4	0.000	0.000	0.008	0.727	89598	29.5	0.039	6	28.1	130.0	23.7	0.005	NA	NA	ma101109_rel_withdbg.cz11a_c32r128
2298852	0	2	0.0	17289.0	1615.3	0.000	0.000	0.008	0.720	94452	29.9	0.041	6	28.1	130.1	23.9	0.005	NA	NA	ma110403_rel_withdbg.cz11b_c32r128
l.i1
l.i1: continue load after secondary indexes created with 50 inserts per transaction
Performance metrics for all DBMS, not just the ones listed above. Some are normalized by throughput, others are not. Legend for results is here.
ips	qps	rps	rmbps	wps	wmbps	rpq	rkbpq	wpi	wkbpi	csps	cpups	cspq	cpupq	dbgb1	dbgb2	rss	maxop	p50	p99	tag
200753	0	606	9.5	11917.4	500.9	0.003	0.048	0.059	2.555	370103	49.7	1.844	119	48.9	151.5	65.3	0.332	11488	3296	my8039_rel_o2nofp.cz11a_c32r128
51298	0	2136	8.4	7692.0	246.3	0.042	0.168	0.150	4.917	261305	63.0	5.094	589	40.9	143.6	43.2	0.390	3097	150	ma101109_rel_withdbg.cz11a_c32r128
52339	0	2186	8.5	7855.6	248.7	0.042	0.167	0.150	4.867	266290	63.4	5.088	581	40.8	143.4	43.1	0.373	3147	150	ma110403_rel_withdbg.cz11b_c32r128
l.i2
l.i2: continue load after secondary indexes created with 5 inserts per transaction
Performance metrics for all DBMS, not just the ones listed above. Some are normalized by throughput, others are not. Legend for results is here.
ips	qps	rps	rmbps	wps	wmbps	rpq	rkbpq	wpi	wkbpi	csps	cpups	cspq	cpupq	dbgb1	dbgb2	rss	maxop	p50	p99	tag
102041	0	0	0.0	9810.9	405.7	0.000	0.000	0.096	4.072	627095	52.0	6.146	245	48.9	150.1	65.4	0.185	5739	824	my8039_rel_o2nofp.cz11a_c32r128
45977	0	5113	20.0	5882.3	199.0	0.111	0.445	0.128	4.433	563851	55.0	12.264	574	40.9	143.6	43.2	0.155	2462	170	ma101109_rel_withdbg.cz11a_c32r128
46163	0	5135	20.1	5906.0	199.8	0.111	0.445	0.128	4.432	596805	55.1	12.928	573	40.8	143.4	43.1	0.155	2472	175	ma110403_rel_withdbg.cz11b_c32r128
qr100.L1
qr100.L1: range queries with 100 insert/s per client
Performance metrics for all DBMS, not just the ones listed above. Some are normalized by throughput, others are not. Legend for results is here.
ips	qps	rps	rmbps	wps	wmbps	rpq	rkbpq	wpi	wkbpi	csps	cpups	cspq	cpupq	dbgb1	dbgb2	rss	maxop	p50	p99	tag
1977	187460	0	0.0	2278.1	64.8	0.000	0.000	1.152	33.573	723084	42.9	3.857	110	48.9	150.1	65.3	0.013	9478	9094	my8039_rel_o2nofp.cz11a_c32r128
1977	189664	68	0.3	33.5	2.4	0.000	0.001	0.017	1.240	730253	43.5	3.850	110	40.9	143.6	42.9	0.009	9622	9078	ma101109_rel_withdbg.cz11a_c32r128
1976	188368	71	0.3	21.7	2.2	0.000	0.002	0.011	1.137	725493	43.5	3.851	111	40.8	143.4	42.8	0.017	9462	9030	ma110403_rel_withdbg.cz11b_c32r128
qp100.L2
qp100.L2: point queries with 100 insert/s per client
Performance metrics for all DBMS, not just the ones listed above. Some are normalized by throughput, others are not. Legend for results is here.
ips	qps	rps	rmbps	wps	wmbps	rpq	rkbpq	wpi	wkbpi	csps	cpups	cspq	cpupq	dbgb1	dbgb2	rss	maxop	p50	p99	tag
1977	120800	0	0.0	247.1	8.6	0.000	0.000	0.125	4.445	477454	41.6	3.952	165	48.9	150.1	65.3	0.011	6121	5770	my8039_rel_o2nofp.cz11a_c32r128
1977	139258	64	0.3	28.4	2.2	0.000	0.002	0.014	1.138	545407	42.0	3.917	145	40.9	143.6	42.9	0.012	7048	6361	ma101109_rel_withdbg.cz11a_c32r128
1977	140198	60	0.2	21.3	2.2	0.000	0.002	0.011	1.129	547693	42.0	3.907	144	40.8	143.4	42.8	0.014	7127	6281	ma110403_rel_withdbg.cz11b_c32r128
qr500.L3
qr500.L3: range queries with 500 insert/s per client
Performance metrics for all DBMS, not just the ones listed above. Some are normalized by throughput, others are not. Legend for results is here.
ips	qps	rps	rmbps	wps	wmbps	rpq	rkbpq	wpi	wkbpi	csps	cpups	cspq	cpupq	dbgb1	dbgb2	rss	maxop	p50	p99	tag
9885	184773	0	0.0	1348.1	47.6	0.000	0.000	0.136	4.928	712444	44.9	3.856	117	48.9	150.1	65.3	0.027	9318	8918	my8039_rel_o2nofp.cz11a_c32r128
9879	180596	333	1.3	1274.7	41.6	0.002	0.007	0.129	4.316	721788	48.2	3.997	128	40.9	143.6	42.9	0.036	9161	8647	ma101109_rel_withdbg.cz11a_c32r128
9879	179877	324	1.3	1260.5	41.4	0.002	0.007	0.128	4.287	719270	48.2	3.999	129	40.8	143.4	42.9	0.028	9126	8535	ma110403_rel_withdbg.cz11b_c32r128
qp500.L4
qp500.L4: point queries with 500 insert/s per client
Performance metrics for all DBMS, not just the ones listed above. Some are normalized by throughput, others are not. Legend for results is here.
ips	qps	rps	rmbps	wps	wmbps	rpq	rkbpq	wpi	wkbpi	csps	cpups	cspq	cpupq	dbgb1	dbgb2	rss	maxop	p50	p99	tag
9885	118655	0	0.0	1364.1	48.1	0.000	0.000	0.138	4.985	477892	43.4	4.028	176	48.9	150.1	65.3	0.028	6009	5658	my8039_rel_o2nofp.cz11a_c32r128
9879	138082	341	1.3	1223.7	40.5	0.002	0.010	0.124	4.199	586731	46.5	4.249	162	40.9	143.6	42.9	0.022	7000	6537	ma101109_rel_withdbg.cz11a_c32r128
9879	139698	342	1.3	1212.0	40.3	0.002	0.010	0.123	4.176	592160	46.3	4.239	159	40.8	143.4	42.8	0.016	7082	6571	ma110403_rel_withdbg.cz11b_c32r128
qr1000.L5
qr1000.L5: range queries with 1000 insert/s per client
Performance metrics for all DBMS, not just the ones listed above. Some are normalized by throughput, others are not. Legend for results is here.
ips	qps	rps	rmbps	wps	wmbps	rpq	rkbpq	wpi	wkbpi	csps	cpups	cspq	cpupq	dbgb1	dbgb2	rss	maxop	p50	p99	tag
19769	180303	3	0.2	2208.7	82.5	0.000	0.001	0.112	4.274	699976	46.7	3.882	124	48.9	150.1	65.3	0.030	9094	8679	my8039_rel_o2nofp.cz11a_c32r128
19769	170338	636	2.5	2064.7	70.5	0.004	0.015	0.104	3.650	706355	53.5	4.147	151	40.9	143.6	43.0	0.030	8631	8010	ma101109_rel_withdbg.cz11a_c32r128
19780	170672	632	2.5	2066.6	70.4	0.004	0.015	0.104	3.647	710270	53.2	4.162	150	40.8	143.4	42.9	0.025	8599	7943	ma110403_rel_withdbg.cz11b_c32r128
qp1000.L6
qp1000.L6: point queries with 1000 insert/s per client
Performance metrics for all DBMS, not just the ones listed above. Some are normalized by throughput, others are not. Legend for results is here.
ips	qps	rps	rmbps	wps	wmbps	rpq	rkbpq	wpi	wkbpi	csps	cpups	cspq	cpupq	dbgb1	dbgb2	rss	maxop	p50	p99	tag
19769	115161	0	0.0	2293.1	84.8	0.000	0.000	0.116	4.390	473339	45.1	4.110	188	48.9	150.1	65.4	0.028	5818	5466	my8039_rel_o2nofp.cz11a_c32r128
19769	128883	667	2.6	2441.5	81.0	0.005	0.021	0.123	4.194	583186	51.6	4.525	192	40.9	143.6	43.0	0.040	6505	5995	ma101109_rel_withdbg.cz11a_c32r128
19769	130006	670	2.6	2442.9	80.9	0.005	0.021	0.124	4.188	594551	51.2	4.573	189	40.8	143.4	42.9	0.024	6585	6087	ma110403_rel_withdbg.cz11b_c32r128
l.i0
- l.i0: load without secondary indexes
- Legend for results is here.
- Each entry lists the percentage of responses that fit in that bucket (slower than max time for previous bucket, faster than min time for next bucket).
Insert response time histogram
256us	1ms	4ms	16ms	64ms	256ms	1s	4s	16s	gt	max	tag
0.000	1.713	98.210	0.027	0.013	0.037	0.000	0.000	0.000	0.000	0.204	my8039_rel_o2nofp.cz11a_c32r128
0.000	1.303	1.770	96.806	0.013	0.087	0.022	0.000	0.000	0.000	0.528	ma101109_rel_withdbg.cz11a_c32r128
0.000	1.238	1.952	96.690	0.012	0.087	0.020	0.000	0.000	0.000	0.628	ma110403_rel_withdbg.cz11b_c32r128
l.x
- l.x: create secondary indexes
- Legend for results is here.
- Each entry lists the percentage of responses that fit in that bucket (slower than max time for previous bucket, faster than min time for next bucket).
TODO - determine whether there is data for create index response time
l.i1
- l.i1: continue load after secondary indexes created with 50 inserts per transaction
- Legend for results is here.
- Each entry lists the percentage of responses that fit in that bucket (slower than max time for previous bucket, faster than min time for next bucket).
Insert response time histogram
256us	1ms	4ms	16ms	64ms	256ms	1s	4s	16s	gt	max	tag
0.000	0.000	64.798	34.839	0.304	0.058	nonzero	0.000	0.000	0.000	0.332	my8039_rel_o2nofp.cz11a_c32r128
0.000	0.000	0.023	68.409	29.806	0.350	1.411	0.000	0.000	0.000	0.390	ma101109_rel_withdbg.cz11a_c32r128
0.000	0.000	0.030	73.226	25.026	0.355	1.362	0.000	0.000	0.000	0.373	ma110403_rel_withdbg.cz11b_c32r128
Delete response time histogram
256us	1ms	4ms	16ms	64ms	256ms	1s	4s	16s	gt	max	tag
0.000	nonzero	67.924	31.670	0.327	0.079	0.000	0.000	0.000	0.000	0.225	my8039_rel_o2nofp.cz11a_c32r128
0.000	0.000	0.084	75.469	22.689	0.353	1.406	0.000	0.000	0.000	0.388	ma101109_rel_withdbg.cz11a_c32r128
0.000	nonzero	0.073	75.114	23.096	0.357	1.360	0.000	0.000	0.000	0.373	ma110403_rel_withdbg.cz11b_c32r128
l.i2
- l.i2: continue load after secondary indexes created with 5 inserts per transaction
- Legend for results is here.
- Each entry lists the percentage of responses that fit in that bucket (slower than max time for previous bucket, faster than min time for next bucket).
Insert response time histogram
256us	1ms	4ms	16ms	64ms	256ms	1s	4s	16s	gt	max	tag
0.063	78.012	19.964	1.949	0.004	0.008	0.000	0.000	0.000	0.000	0.185	my8039_rel_o2nofp.cz11a_c32r128
0.071	1.052	97.963	0.312	0.584	0.017	0.000	0.000	0.000	0.000	0.155	ma101109_rel_withdbg.cz11a_c32r128
0.067	1.207	97.808	0.318	0.583	0.016	0.000	0.000	0.000	0.000	0.155	ma110403_rel_withdbg.cz11b_c32r128
Delete response time histogram
256us	1ms	4ms	16ms	64ms	256ms	1s	4s	16s	gt	max	tag
0.067	78.244	19.746	1.931	0.004	0.008	0.000	0.000	0.000	0.000	0.194	my8039_rel_o2nofp.cz11a_c32r128
0.099	1.093	97.900	0.306	0.586	0.017	0.000	0.000	0.000	0.000	0.160	ma101109_rel_withdbg.cz11a_c32r128
0.066	1.135	97.875	0.323	0.584	0.016	0.000	0.000	0.000	0.000	0.155	ma110403_rel_withdbg.cz11b_c32r128
qr100.L1
- qr100.L1: range queries with 100 insert/s per client
- Legend for results is here.
- Each entry lists the percentage of responses that fit in that bucket (slower than max time for previous bucket, faster than min time for next bucket).
Query response time histogram
256us	1ms	4ms	16ms	64ms	256ms	1s	4s	16s	gt	max	tag
99.984	0.014	0.002	nonzero	0.000	0.000	0.000	0.000	0.000	0.000	0.013	my8039_rel_o2nofp.cz11a_c32r128
99.964	0.034	0.002	nonzero	0.000	0.000	0.000	0.000	0.000	0.000	0.009	ma101109_rel_withdbg.cz11a_c32r128
99.963	0.036	0.002	nonzero	nonzero	0.000	0.000	0.000	0.000	0.000	0.017	ma110403_rel_withdbg.cz11b_c32r128
Insert response time histogram
256us	1ms	4ms	16ms	64ms	256ms	1s	4s	16s	gt	max	tag
0.000	0.000	98.057	1.943	0.000	0.000	0.000	0.000	0.000	0.000	0.013	my8039_rel_o2nofp.cz11a_c32r128
0.000	0.000	11.285	88.607	0.108	0.000	0.000	0.000	0.000	0.000	0.025	ma101109_rel_withdbg.cz11a_c32r128
0.000	0.000	20.899	78.871	0.231	0.000	0.000	0.000	0.000	0.000	0.026	ma110403_rel_withdbg.cz11b_c32r128
Delete response time histogram
256us	1ms	4ms	16ms	64ms	256ms	1s	4s	16s	gt	max	tag
0.000	0.007	98.792	1.201	0.000	0.000	0.000	0.000	0.000	0.000	0.012	my8039_rel_o2nofp.cz11a_c32r128
0.000	0.013	14.203	85.719	0.065	0.000	0.000	0.000	0.000	0.000	0.024	ma101109_rel_withdbg.cz11a_c32r128
0.000	0.007	22.656	77.207	0.131	0.000	0.000	0.000	0.000	0.000	0.025	ma110403_rel_withdbg.cz11b_c32r128
qp100.L2
- qp100.L2: point queries with 100 insert/s per client
- Legend for results is here.
- Each entry lists the percentage of responses that fit in that bucket (slower than max time for previous bucket, faster than min time for next bucket).
Query response time histogram
256us	1ms	4ms	16ms	64ms	256ms	1s	4s	16s	gt	max	tag
99.201	0.790	0.009	nonzero	0.000	0.000	0.000	0.000	0.000	0.000	0.011	my8039_rel_o2nofp.cz11a_c32r128
99.194	0.799	0.006	nonzero	0.000	0.000	0.000	0.000	0.000	0.000	0.012	ma101109_rel_withdbg.cz11a_c32r128
99.189	0.805	0.006	nonzero	0.000	0.000	0.000	0.000	0.000	0.000	0.014	ma110403_rel_withdbg.cz11b_c32r128
Insert response time histogram
256us	1ms	4ms	16ms	64ms	256ms	1s	4s	16s	gt	max	tag
0.000	0.000	99.081	0.919	0.000	0.000	0.000	0.000	0.000	0.000	0.010	my8039_rel_o2nofp.cz11a_c32r128
0.000	0.000	8.612	90.482	0.906	0.000	0.000	0.000	0.000	0.000	0.026	ma101109_rel_withdbg.cz11a_c32r128
0.000	0.000	9.451	90.343	0.206	0.000	0.000	0.000	0.000	0.000	0.023	ma110403_rel_withdbg.cz11b_c32r128
Delete response time histogram
256us	1ms	4ms	16ms	64ms	256ms	1s	4s	16s	gt	max	tag
0.000	0.000	99.510	0.490	0.000	0.000	0.000	0.000	0.000	0.000	0.011	my8039_rel_o2nofp.cz11a_c32r128
0.000	0.024	8.889	90.472	0.615	0.000	0.000	0.000	0.000	0.000	0.024	ma101109_rel_withdbg.cz11a_c32r128
0.000	0.000	10.019	89.850	0.131	0.000	0.000	0.000	0.000	0.000	0.023	ma110403_rel_withdbg.cz11b_c32r128
qr500.L3
- qr500.L3: range queries with 500 insert/s per client
- Legend for results is here.
- Each entry lists the percentage of responses that fit in that bucket (slower than max time for previous bucket, faster than min time for next bucket).
Query response time histogram
256us	1ms	4ms	16ms	64ms	256ms	1s	4s	16s	gt	max	tag
99.964	0.024	0.011	0.001	nonzero	0.000	0.000	0.000	0.000	0.000	0.027	my8039_rel_o2nofp.cz11a_c32r128
99.708	0.277	0.014	0.001	nonzero	0.000	0.000	0.000	0.000	0.000	0.036	ma101109_rel_withdbg.cz11a_c32r128
99.701	0.287	0.013	nonzero	nonzero	0.000	0.000	0.000	0.000	0.000	0.028	ma110403_rel_withdbg.cz11b_c32r128
Insert response time histogram
256us	1ms	4ms	16ms	64ms	256ms	1s	4s	16s	gt	max	tag
0.000	0.000	78.628	21.066	0.306	0.000	0.000	0.000	0.000	0.000	0.037	my8039_rel_o2nofp.cz11a_c32r128
0.000	0.001	4.716	79.238	16.046	0.000	0.000	0.000	0.000	0.000	0.055	ma101109_rel_withdbg.cz11a_c32r128
0.000	0.002	4.001	81.097	14.899	0.000	0.000	0.000	0.000	0.000	0.055	ma110403_rel_withdbg.cz11b_c32r128
Delete response time histogram
256us	1ms	4ms	16ms	64ms	256ms	1s	4s	16s	gt	max	tag
0.000	0.014	84.300	15.463	0.224	0.000	0.000	0.000	0.000	0.000	0.038	my8039_rel_o2nofp.cz11a_c32r128
0.000	0.020	4.376	82.901	12.704	0.000	0.000	0.000	0.000	0.000	0.057	ma101109_rel_withdbg.cz11a_c32r128
0.000	0.015	3.835	82.891	13.259	0.000	0.000	0.000	0.000	0.000	0.057	ma110403_rel_withdbg.cz11b_c32r128
qp500.L4
- qp500.L4: point queries with 500 insert/s per client
- Legend for results is here.
- Each entry lists the percentage of responses that fit in that bucket (slower than max time for previous bucket, faster than min time for next bucket).
Query response time histogram
256us	1ms	4ms	16ms	64ms	256ms	1s	4s	16s	gt	max	tag
98.971	0.963	0.062	0.004	nonzero	0.000	0.000	0.000	0.000	0.000	0.028	my8039_rel_o2nofp.cz11a_c32r128
98.459	1.516	0.025	nonzero	nonzero	0.000	0.000	0.000	0.000	0.000	0.022	ma101109_rel_withdbg.cz11a_c32r128
98.561	1.417	0.022	nonzero	nonzero	0.000	0.000	0.000	0.000	0.000	0.016	ma110403_rel_withdbg.cz11b_c32r128
Insert response time histogram
256us	1ms	4ms	16ms	64ms	256ms	1s	4s	16s	gt	max	tag
0.000	0.000	82.558	17.363	0.079	0.000	0.000	0.000	0.000	0.000	0.027	my8039_rel_o2nofp.cz11a_c32r128
0.000	0.001	4.093	77.395	18.512	0.000	0.000	0.000	0.000	0.000	0.042	ma101109_rel_withdbg.cz11a_c32r128
0.000	0.002	4.553	80.973	14.473	0.000	0.000	0.000	0.000	0.000	0.050	ma110403_rel_withdbg.cz11b_c32r128
Delete response time histogram
256us	1ms	4ms	16ms	64ms	256ms	1s	4s	16s	gt	max	tag
0.000	0.001	87.772	12.175	0.051	0.000	0.000	0.000	0.000	0.000	0.030	my8039_rel_o2nofp.cz11a_c32r128
0.000	0.016	3.416	82.204	14.363	0.000	0.000	0.000	0.000	0.000	0.034	ma101109_rel_withdbg.cz11a_c32r128
0.000	0.009	4.373	82.851	12.767	0.000	0.000	0.000	0.000	0.000	0.037	ma110403_rel_withdbg.cz11b_c32r128
qr1000.L5
- qr1000.L5: range queries with 1000 insert/s per client
- Legend for results is here.
- Each entry lists the percentage of responses that fit in that bucket (slower than max time for previous bucket, faster than min time for next bucket).
Query response time histogram
256us	1ms	4ms	16ms	64ms	256ms	1s	4s	16s	gt	max	tag
99.909	0.057	0.031	0.002	nonzero	0.000	0.000	0.000	0.000	0.000	0.030	my8039_rel_o2nofp.cz11a_c32r128
99.383	0.586	0.030	0.002	nonzero	0.000	0.000	0.000	0.000	0.000	0.030	ma101109_rel_withdbg.cz11a_c32r128
99.391	0.584	0.025	nonzero	nonzero	0.000	0.000	0.000	0.000	0.000	0.025	ma110403_rel_withdbg.cz11b_c32r128
Insert response time histogram
256us	1ms	4ms	16ms	64ms	256ms	1s	4s	16s	gt	max	tag
0.000	0.000	53.542	45.298	1.161	0.000	0.000	0.000	0.000	0.000	0.044	my8039_rel_o2nofp.cz11a_c32r128
0.000	nonzero	2.841	72.995	24.164	nonzero	0.000	0.000	0.000	0.000	0.066	ma101109_rel_withdbg.cz11a_c32r128
0.000	0.007	2.655	76.861	20.476	nonzero	0.000	0.000	0.000	0.000	0.066	ma110403_rel_withdbg.cz11b_c32r128
Delete response time histogram
256us	1ms	4ms	16ms	64ms	256ms	1s	4s	16s	gt	max	tag
0.000	0.012	61.040	38.056	0.893	0.000	0.000	0.000	0.000	0.000	0.063	my8039_rel_o2nofp.cz11a_c32r128
0.000	0.018	2.202	77.707	20.073	nonzero	0.000	0.000	0.000	0.000	0.066	ma101109_rel_withdbg.cz11a_c32r128
0.000	0.030	2.401	78.672	18.897	nonzero	0.000	0.000	0.000	0.000	0.072	ma110403_rel_withdbg.cz11b_c32r128
qp1000.L6
- qp1000.L6: point queries with 1000 insert/s per client
- Legend for results is here.
- Each entry lists the percentage of responses that fit in that bucket (slower than max time for previous bucket, faster than min time for next bucket).
Query response time histogram
256us	1ms	4ms	16ms	64ms	256ms	1s	4s	16s	gt	max	tag
98.199	1.629	0.163	0.009	nonzero	0.000	0.000	0.000	0.000	0.000	0.028	my8039_rel_o2nofp.cz11a_c32r128
96.909	3.055	0.036	nonzero	nonzero	0.000	0.000	0.000	0.000	0.000	0.040	ma101109_rel_withdbg.cz11a_c32r128
96.840	3.123	0.037	nonzero	nonzero	0.000	0.000	0.000	0.000	0.000	0.024	ma110403_rel_withdbg.cz11b_c32r128
Insert response time histogram
256us	1ms	4ms	16ms	64ms	256ms	1s	4s	16s	gt	max	tag
0.000	0.000	58.413	41.265	0.322	0.000	0.000	0.000	0.000	0.000	0.045	my8039_rel_o2nofp.cz11a_c32r128
0.000	0.002	2.790	74.590	22.618	0.000	0.000	0.000	0.000	0.000	0.059	ma101109_rel_withdbg.cz11a_c32r128
0.000	0.001	2.452	76.526	21.021	0.000	0.000	0.000	0.000	0.000	0.058	ma110403_rel_withdbg.cz11b_c32r128
Delete response time histogram
256us	1ms	4ms	16ms	64ms	256ms	1s	4s	16s	gt	max	tag
0.000	0.003	65.987	33.767	0.243	0.000	0.000	0.000	0.000	0.000	0.043	my8039_rel_o2nofp.cz11a_c32r128
0.000	0.015	2.089	79.730	18.166	0.000	0.000	0.000	0.000	0.000	0.059	ma101109_rel_withdbg.cz11a_c32r128
0.000	0.008	2.199	78.469	19.325	0.000	0.000	0.000	0.000	0.000	0.054	ma110403_rel_withdbg.cz11b_c32r128