Introduction
This is a report for the insert benchmark with 4000M docs and 20 client(s). It is generated by scripts (bash, awk, sed) and Tufte might not be impressed. An overview of the insert benchmark is here and a short update is here. Below, by DBMS, I mean DBMS+version.config. An example is my8020.c10b40 where my means MySQL, 8020 is version 8.0.20 and c10b40 is the name for the configuration file.
The test server is an ax162-s from Hetzner (see here) with 48 cores, AMD SMT disabled, 128G RAM and ext4 using 2 NVMe devices with SW RAID 1. The benchmark was run with 20 clients and there were 1 or 3 connections per client (1 for queries or inserts without rate limits, 1+1 for rate limited inserts+deletes). It uses 8 tables with a table per client. It loads 200M rows per table without secondary indexes, creates 3 secondary indexes per table, then inserts 4m+1m rows per table with a delete per insert to avoid growing the table. It then does 6 read+write tests for 1800s each that do queries as fast as possible with 100,100,500,500,1000,1000 inserts/s and the same for deletes/s per client concurrent with the queries. The database is larger than memory. Clients and the DBMS share one server.
The tested DBMS are:
- my8039_rel_o2nofp.cz11a_nocb_c32r128 - MySQL 8.0.39 compiled with CMAKE_BUILD_TYPE=Release, -O2 and frame pointers enabled using my.cnf.cz11a_nocb_c32r128 with innodb_change_buffering=none
- my8039_rel_o2nofp.cz11a_c32r128 - MySQL 8.0.39 compiled with CMAKE_BUILD_TYPE=Release, -O2 and frame pointers enabled using my.cnf.cz11a_c32r128 with innodb_change_buffering=all
- ma101109_rel_withdbg.cz11a_c32r128 - MariaDB 10.11.9 compiled with CMAKE_BUILD_TYPE=RelWithDebInfo using my.cnf.cz11a_c32r128
- ma110403_rel_withdbg.cz11b_c32r128 - MariaDB 11.4.3 compiled with CMAKE_BUILD_TYPE=RelWithDebInfo using my.cnf.cz11a_c32r128
Contents
- Summary
- l.i0: load without secondary indexes
- l.x: create secondary indexes
- l.i1: continue load after secondary indexes created with 50 inserts per transaction
- l.i2: continue load after secondary indexes created with 5 inserts per transaction
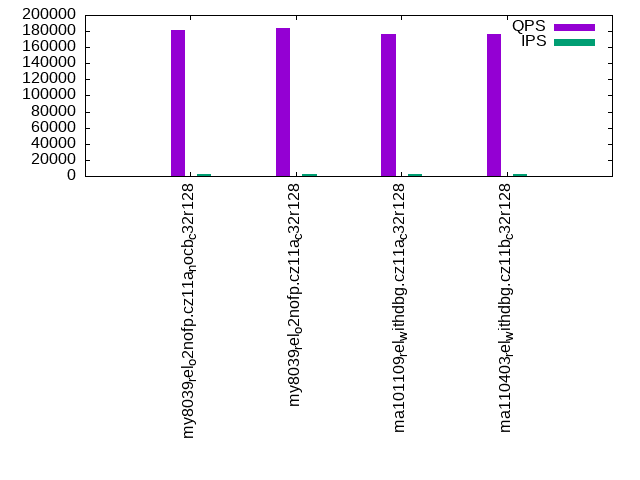
- qr100.L1: range queries with 100 insert/s per client
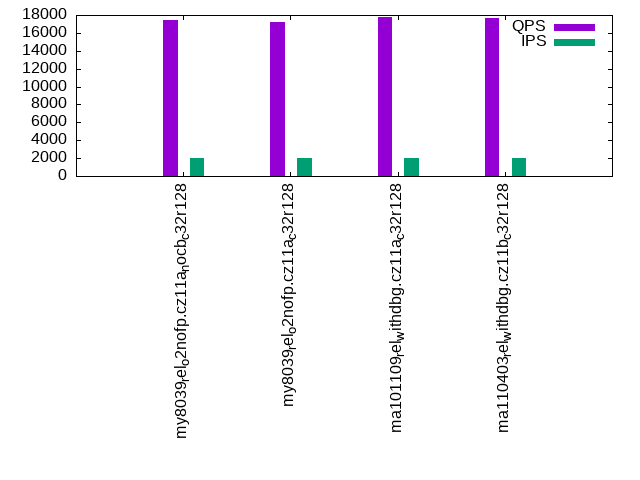
- qp100.L2: point queries with 100 insert/s per client
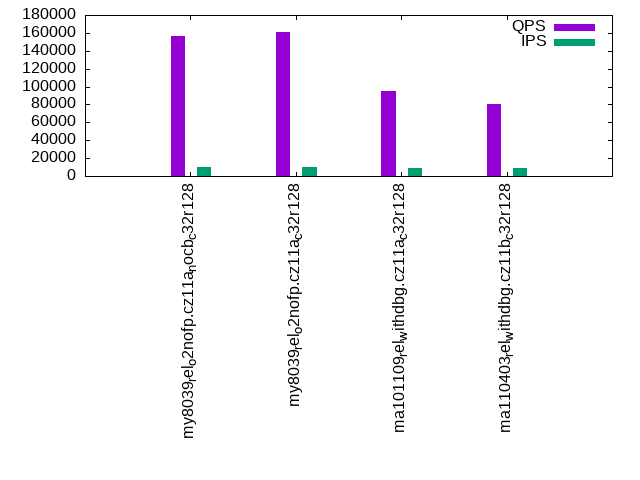
- qr500.L3: range queries with 500 insert/s per client
- qp500.L4: point queries with 500 insert/s per client
- qr1000.L5: range queries with 1000 insert/s per client
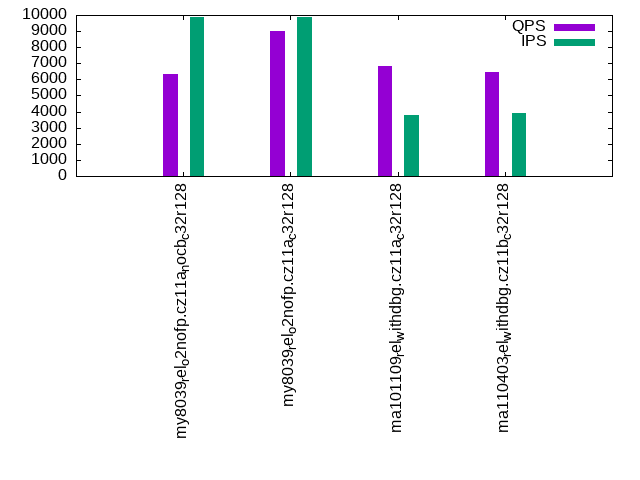
- qp1000.L6: point queries with 1000 insert/s per client
Summary
The numbers are inserts/s for l.i0, l.i1 and l.i2, indexed docs (or rows) /s for l.x and queries/s for qr100, qp100 thru qr1000, qp1000" The values are the average rate over the entire test for inserts (IPS) and queries (QPS). The range of values for IPS and QPS is split into 3 parts: bottom 25%, middle 50%, top 25%. Values in the bottom 25% have a red background, values in the top 25% have a green background and values in the middle have no color. A gray background is used for values that can be ignored because the DBMS did not sustain the target insert rate. Red backgrounds are not used when the minimum value is within 80% of the max value.
| dbms | l.i0 | l.x | l.i1 | l.i2 | qr100 | qp100 | qr500 | qp500 | qr1000 | qp1000 |
|---|---|---|---|---|---|---|---|---|---|---|
| my8039_rel_o2nofp.cz11a_nocb_c32r128 | 1435750 | 1324942 | 8946 | 4529 | 180950 | 17439 | 156129 | 6342 | 101645 | 6833 |
| my8039_rel_o2nofp.cz11a_c32r128 | 1434206 | 1353180 | 16162 | 5682 | 183538 | 17203 | 160796 | 9033 | 119664 | 8645 |
| ma101109_rel_withdbg.cz11a_c32r128 | 281057 | 1573564 | 6122 | 6812 | 176381 | 17765 | 94824 | 6840 | 99044 | 5145 |
| ma110403_rel_withdbg.cz11b_c32r128 | 284698 | 1523229 | 6262 | 7613 | 177008 | 17688 | 80329 | 6488 | 91584 | 5399 |
This table has relative throughput, throughput for the DBMS relative to the DBMS in the first line, using the absolute throughput from the previous table. Values less than 0.95 have a yellow background. Values greater than 1.05 have a blue background.
| dbms | l.i0 | l.x | l.i1 | l.i2 | qr100 | qp100 | qr500 | qp500 | qr1000 | qp1000 |
|---|---|---|---|---|---|---|---|---|---|---|
| my8039_rel_o2nofp.cz11a_nocb_c32r128 | 1.00 | 1.00 | 1.00 | 1.00 | 1.00 | 1.00 | 1.00 | 1.00 | 1.00 | 1.00 |
| my8039_rel_o2nofp.cz11a_c32r128 | 1.00 | 1.02 | 1.81 | 1.25 | 1.01 | 0.99 | 1.03 | 1.42 | 1.18 | 1.27 |
| ma101109_rel_withdbg.cz11a_c32r128 | 0.20 | 1.19 | 0.68 | 1.50 | 0.97 | 1.02 | 0.61 | 1.08 | 0.97 | 0.75 |
| ma110403_rel_withdbg.cz11b_c32r128 | 0.20 | 1.15 | 0.70 | 1.68 | 0.98 | 1.01 | 0.51 | 1.02 | 0.90 | 0.79 |
This lists the average rate of inserts/s for the tests that do inserts concurrent with queries. For such tests the query rate is listed in the table above. The read+write tests are setup so that the insert rate should match the target rate every second. Cells that are not at least 95% of the target have a red background to indicate a failure to satisfy the target.
| dbms | qr100.L1 | qp100.L2 | qr500.L3 | qp500.L4 | qr1000.L5 | qp1000.L6 |
|---|---|---|---|---|---|---|
| my8039_rel_o2nofp.cz11a_nocb_c32r128 | 1977 | 1976 | 9879 | 9885 | 18000 | 6890 |
| my8039_rel_o2nofp.cz11a_c32r128 | 1977 | 1977 | 9885 | 9885 | 19769 | 12609 |
| ma101109_rel_withdbg.cz11a_c32r128 | 1976 | 1976 | 8411 | 3771 | 6235 | 4249 |
| ma110403_rel_withdbg.cz11b_c32r128 | 1976 | 1976 | 8459 | 3909 | 6319 | 4254 |
| target | 2000 | 2000 | 10000 | 10000 | 20000 | 20000 |
l.i0
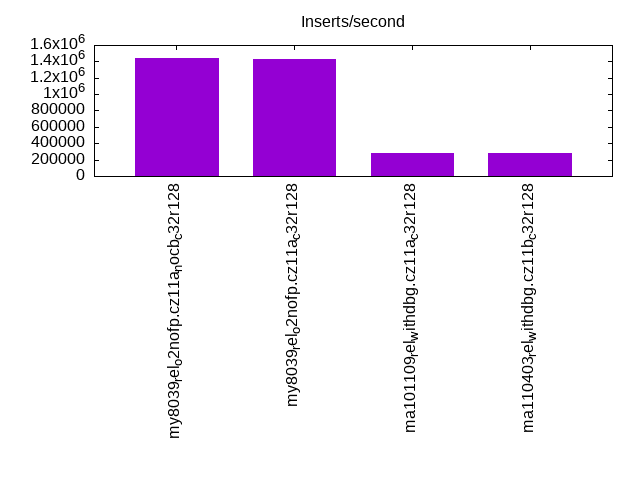
l.i0: load without secondary indexes. Graphs for performance per 1-second interval are here.
Average throughput:
Insert response time histogram: each cell has the percentage of responses that take <= the time in the header and max is the max response time in seconds. For the max column values in the top 25% of the range have a red background and in the bottom 25% of the range have a green background. The red background is not used when the min value is within 80% of the max value.
| dbms | 256us | 1ms | 4ms | 16ms | 64ms | 256ms | 1s | 4s | 16s | gt | max |
|---|---|---|---|---|---|---|---|---|---|---|---|
| my8039_rel_o2nofp.cz11a_nocb_c32r128 | 0.099 | 99.789 | 0.060 | 0.013 | 0.039 | 0.241 | |||||
| my8039_rel_o2nofp.cz11a_c32r128 | 0.086 | 99.802 | 0.060 | 0.014 | 0.038 | 0.228 | |||||
| ma101109_rel_withdbg.cz11a_c32r128 | 0.074 | 0.255 | 99.427 | 0.043 | 0.108 | 0.094 | 0.666 | ||||
| ma110403_rel_withdbg.cz11b_c32r128 | 0.066 | 0.263 | 99.421 | 0.051 | 0.106 | 0.094 | 0.677 |
Performance metrics for the DBMS listed above. Some are normalized by throughput, others are not. Legend for results is here.
ips	qps	rps	rmbps	wps	wmbps	rpq	rkbpq	wpi	wkbpi	csps	cpups	cspq	cpupq	dbgb1	dbgb2	rss	maxop	p50	p99	tag
1435750	0	4	0.0	9764.0	534.0	0.000	0.000	0.007	0.381	295680	55.1	0.206	18	262.3	362.8	108.6	0.241	75019	62233	my8039_rel_o2nofp.cz11a_nocb_c32r128
1434206	0	4	0.0	9732.3	532.7	0.000	0.000	0.007	0.380	295453	55.2	0.206	18	262.3	362.8	108.6	0.228	74720	62333	my8039_rel_o2nofp.cz11a_c32r128
281057	0	2614	10.2	1995.5	84.6	0.009	0.037	0.007	0.308	251834	50.5	0.896	86	263.2	365.2	101.4	0.666	14684	200	ma101109_rel_withdbg.cz11a_c32r128
284698	0	2649	10.4	2030.6	85.8	0.009	0.037	0.007	0.309	256608	50.4	0.901	85	263.2	365.2	101.4	0.677	14884	200	ma110403_rel_withdbg.cz11b_c32r128
l.x
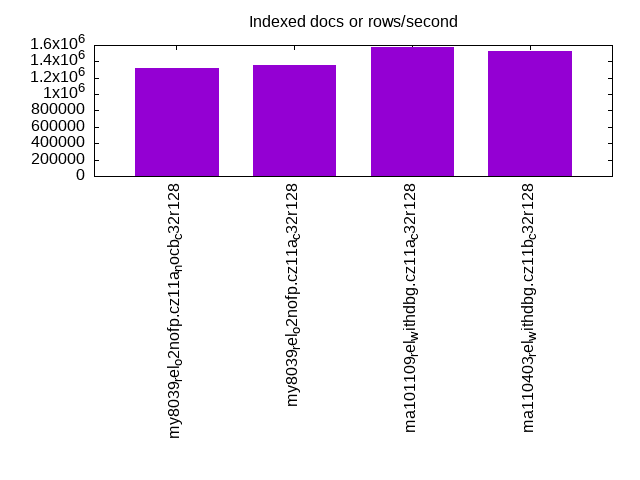
l.x: create secondary indexes.
Average throughput:
Performance metrics for the DBMS listed above. Some are normalized by throughput, others are not. Legend for results is here.
ips	qps	rps	rmbps	wps	wmbps	rpq	rkbpq	wpi	wkbpi	csps	cpups	cspq	cpupq	dbgb1	dbgb2	rss	maxop	p50	p99	tag
1324942	0	33429	1929.3	39549.1	1738.6	0.025	1.491	0.030	1.344	193323	56.1	0.146	20	603.6	704.2	104.9	0.022	NA	NA	my8039_rel_o2nofp.cz11a_nocb_c32r128
1353180	0	34149	1971.3	40424.4	1776.7	0.025	1.492	0.030	1.344	193770	57.0	0.143	20	603.6	704.2	104.9	0.017	NA	NA	my8039_rel_o2nofp.cz11a_c32r128
1573564	0	17191	1407.8	18209.2	1551.0	0.011	0.916	0.012	1.009	78106	23.7	0.050	7	557.5	659.5	101.8	0.002	NA	NA	ma101109_rel_withdbg.cz11a_c32r128
1523229	0	16614	1355.4	19282.1	1511.1	0.011	0.911	0.013	1.016	83878	24.2	0.055	8	557.5	659.5	101.8	0.002	NA	NA	ma110403_rel_withdbg.cz11b_c32r128
l.i1
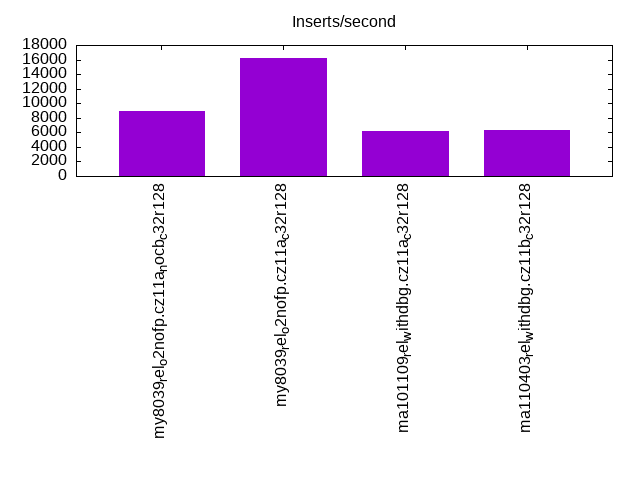
l.i1: continue load after secondary indexes created with 50 inserts per transaction. Graphs for performance per 1-second interval are here.
Average throughput:
Insert response time histogram: each cell has the percentage of responses that take <= the time in the header and max is the max response time in seconds. For the max column values in the top 25% of the range have a red background and in the bottom 25% of the range have a green background. The red background is not used when the min value is within 80% of the max value.
| dbms | 256us | 1ms | 4ms | 16ms | 64ms | 256ms | 1s | 4s | 16s | gt | max |
|---|---|---|---|---|---|---|---|---|---|---|---|
| my8039_rel_o2nofp.cz11a_nocb_c32r128 | 17.796 | 81.883 | 0.321 | 0.489 | |||||||
| my8039_rel_o2nofp.cz11a_c32r128 | 0.105 | 14.232 | 38.037 | 47.286 | 0.340 | 0.499 | |||||
| ma101109_rel_withdbg.cz11a_c32r128 | 1.204 | 16.009 | 57.842 | 24.942 | 0.001 | 0.001 | 0.002 | 128.400 | |||
| ma110403_rel_withdbg.cz11b_c32r128 | 1.917 | 15.311 | 57.804 | 24.950 | 0.008 | 0.005 | 0.005 | 104.927 |
Delete response time histogram: each cell has the percentage of responses that take <= the time in the header and max is the max response time in seconds. For the max column values in the top 25% of the range have a red background and in the bottom 25% of the range have a green background. The red background is not used when the min value is within 80% of the max value.
| dbms | 256us | 1ms | 4ms | 16ms | 64ms | 256ms | 1s | 4s | 16s | gt | max |
|---|---|---|---|---|---|---|---|---|---|---|---|
| my8039_rel_o2nofp.cz11a_nocb_c32r128 | 0.240 | 38.567 | 61.193 | 0.001 | 0.294 | ||||||
| my8039_rel_o2nofp.cz11a_c32r128 | 18.776 | 19.593 | 29.076 | 32.556 | 0.194 | ||||||
| ma101109_rel_withdbg.cz11a_c32r128 | 9.959 | 24.433 | 43.130 | 22.475 | 0.001 | 0.001 | 0.002 | 87.473 | |||
| ma110403_rel_withdbg.cz11b_c32r128 | 10.032 | 19.980 | 45.904 | 24.073 | 0.006 | 0.003 | 0.002 | 102.879 |
Performance metrics for the DBMS listed above. Some are normalized by throughput, others are not. Legend for results is here.
ips	qps	rps	rmbps	wps	wmbps	rpq	rkbpq	wpi	wkbpi	csps	cpups	cspq	cpupq	dbgb1	dbgb2	rss	maxop	p50	p99	tag
8946	0	50536	789.7	68019.4	1794.6	5.649	90.386	7.603	205.404	363105	14.4	40.586	773	814.0	918.2	107.6	0.489	400	300	my8039_rel_o2nofp.cz11a_nocb_c32r128
16162	0	36368	568.3	53216.8	1514.8	2.250	36.005	3.293	95.980	333511	20.7	20.636	615	818.4	935.0	107.6	0.499	699	300	my8039_rel_o2nofp.cz11a_c32r128
6122	0	36608	568.0	35668.6	973.6	5.980	95.006	5.826	162.858	862195	14.3	140.840	1121	723.7	826.3	100.5	128.400	300	0	ma101109_rel_withdbg.cz11a_c32r128
6262	0	38408	596.0	37589.9	1007.8	6.133	97.454	6.003	164.789	868728	13.6	138.726	1042	725.0	827.7	100.5	104.927	300	0	ma110403_rel_withdbg.cz11b_c32r128
l.i2
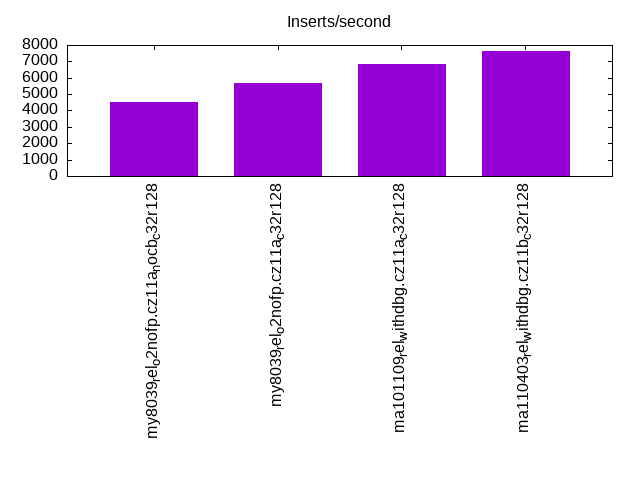
l.i2: continue load after secondary indexes created with 5 inserts per transaction. Graphs for performance per 1-second interval are here.
Average throughput:
Insert response time histogram: each cell has the percentage of responses that take <= the time in the header and max is the max response time in seconds. For the max column values in the top 25% of the range have a red background and in the bottom 25% of the range have a green background. The red background is not used when the min value is within 80% of the max value.
| dbms | 256us | 1ms | 4ms | 16ms | 64ms | 256ms | 1s | 4s | 16s | gt | max |
|---|---|---|---|---|---|---|---|---|---|---|---|
| my8039_rel_o2nofp.cz11a_nocb_c32r128 | 66.488 | 31.542 | 1.970 | 0.136 | |||||||
| my8039_rel_o2nofp.cz11a_c32r128 | 0.083 | 72.400 | 27.311 | 0.206 | 0.167 | ||||||
| ma101109_rel_withdbg.cz11a_c32r128 | 0.012 | 6.985 | 70.904 | 20.664 | 1.413 | 0.021 | 0.001 | 2.729 | |||
| ma110403_rel_withdbg.cz11b_c32r128 | 0.031 | 15.909 | 60.032 | 23.806 | 0.214 | 0.006 | nonzero | nonzero | 4.100 |
Delete response time histogram: each cell has the percentage of responses that take <= the time in the header and max is the max response time in seconds. For the max column values in the top 25% of the range have a red background and in the bottom 25% of the range have a green background. The red background is not used when the min value is within 80% of the max value.
| dbms | 256us | 1ms | 4ms | 16ms | 64ms | 256ms | 1s | 4s | 16s | gt | max |
|---|---|---|---|---|---|---|---|---|---|---|---|
| my8039_rel_o2nofp.cz11a_nocb_c32r128 | 69.236 | 29.778 | 0.986 | 0.136 | |||||||
| my8039_rel_o2nofp.cz11a_c32r128 | 0.260 | 73.200 | 26.459 | 0.080 | 0.167 | ||||||
| ma101109_rel_withdbg.cz11a_c32r128 | nonzero | 0.072 | 17.629 | 66.997 | 14.044 | 1.252 | 0.005 | nonzero | 2.727 | ||
| ma110403_rel_withdbg.cz11b_c32r128 | 0.086 | 25.395 | 54.241 | 20.077 | 0.197 | 0.004 | nonzero | nonzero | 4.100 |
Performance metrics for the DBMS listed above. Some are normalized by throughput, others are not. Legend for results is here.
ips	qps	rps	rmbps	wps	wmbps	rpq	rkbpq	wpi	wkbpi	csps	cpups	cspq	cpupq	dbgb1	dbgb2	rss	maxop	p50	p99	tag
4529	0	44886	701.3	56388.1	1591.3	9.911	158.577	12.451	359.794	352666	15.3	77.870	1622	814.0	915.3	106.0	0.136	140	75	my8039_rel_o2nofp.cz11a_nocb_c32r128
5682	0	38736	605.3	50136.5	1439.4	6.818	109.082	8.824	259.410	335921	17.3	59.122	1462	818.4	932.1	106.0	0.167	140	80	my8039_rel_o2nofp.cz11a_c32r128
6812	0	38701	586.1	31995.9	891.4	5.681	88.108	4.697	134.004	902625	15.7	132.507	1106	723.7	826.3	100.5	2.729	445	65	ma101109_rel_withdbg.cz11a_c32r128
7613	0	40314	608.8	33481.0	935.0	5.295	81.892	4.398	125.764	996146	16.3	130.845	1028	725.0	827.7	100.5	4.100	469	85	ma110403_rel_withdbg.cz11b_c32r128
qr100.L1
qr100.L1: range queries with 100 insert/s per client. Graphs for performance per 1-second interval are here.
Average throughput:
Query response time histogram: each cell has the percentage of responses that take <= the time in the header and max is the max response time in seconds. For max values in the top 25% of the range have a red background and in the bottom 25% of the range have a green background. The red background is not used when the min value is within 80% of the max value.
| dbms | 256us | 1ms | 4ms | 16ms | 64ms | 256ms | 1s | 4s | 16s | gt | max |
|---|---|---|---|---|---|---|---|---|---|---|---|
| my8039_rel_o2nofp.cz11a_nocb_c32r128 | 99.834 | 0.163 | 0.002 | nonzero | nonzero | 0.031 | |||||
| my8039_rel_o2nofp.cz11a_c32r128 | 99.889 | 0.107 | 0.003 | nonzero | 0.013 | ||||||
| ma101109_rel_withdbg.cz11a_c32r128 | 99.633 | 0.330 | 0.034 | 0.003 | nonzero | 0.027 | |||||
| ma110403_rel_withdbg.cz11b_c32r128 | 99.584 | 0.375 | 0.039 | 0.002 | nonzero | nonzero | 0.154 |
Insert response time histogram: each cell has the percentage of responses that take <= the time in the header and max is the max response time in seconds. For max values in the top 25% of the range have a red background and in the bottom 25% of the range have a green background. The red background is not used when the min value is within 80% of the max value.
| dbms | 256us | 1ms | 4ms | 16ms | 64ms | 256ms | 1s | 4s | 16s | gt | max |
|---|---|---|---|---|---|---|---|---|---|---|---|
| my8039_rel_o2nofp.cz11a_nocb_c32r128 | 82.812 | 17.188 | 0.052 | ||||||||
| my8039_rel_o2nofp.cz11a_c32r128 | 95.174 | 4.826 | 0.037 | ||||||||
| ma101109_rel_withdbg.cz11a_c32r128 | 34.196 | 65.803 | 0.001 | 0.065 | |||||||
| ma110403_rel_withdbg.cz11b_c32r128 | 33.228 | 66.319 | 0.453 | 0.198 |
Delete response time histogram: each cell has the percentage of responses that take <= the time in the header and max is the max response time in seconds. For max values in the top 25% of the range have a red background and in the bottom 25% of the range have a green background. The red background is not used when the min value is within 80% of the max value.
| dbms | 256us | 1ms | 4ms | 16ms | 64ms | 256ms | 1s | 4s | 16s | gt | max |
|---|---|---|---|---|---|---|---|---|---|---|---|
| my8039_rel_o2nofp.cz11a_nocb_c32r128 | 94.983 | 5.017 | 0.036 | ||||||||
| my8039_rel_o2nofp.cz11a_c32r128 | 91.606 | 8.394 | 0.013 | ||||||||
| ma101109_rel_withdbg.cz11a_c32r128 | 73.415 | 26.585 | 0.055 | ||||||||
| ma110403_rel_withdbg.cz11b_c32r128 | 68.756 | 31.104 | 0.140 | 0.193 |
Performance metrics for the DBMS listed above. Some are normalized by throughput, others are not. Legend for results is here.
ips	qps	rps	rmbps	wps	wmbps	rpq	rkbpq	wpi	wkbpi	csps	cpups	cspq	cpupq	dbgb1	dbgb2	rss	maxop	p50	p99	tag
1977	180950	8357	130.6	9281.8	266.4	0.046	0.739	4.695	138.009	735420	44.8	4.064	119	814.0	915.3	106.0	0.031	9174	8587	my8039_rel_o2nofp.cz11a_nocb_c32r128
1977	183538	8290	129.5	9300.2	267.9	0.045	0.723	4.704	138.770	746909	45.3	4.070	118	818.4	932.1	106.0	0.013	9366	8711	my8039_rel_o2nofp.cz11a_c32r128
1976	176381	9250	143.4	5991.3	168.0	0.052	0.833	3.032	87.084	733626	44.2	4.159	120	723.7	826.3	100.4	0.027	8950	7419	ma101109_rel_withdbg.cz11a_c32r128
1976	177008	9276	143.7	5988.0	168.4	0.052	0.832	3.031	87.268	738233	44.2	4.171	120	725.0	827.7	100.4	0.154	9017	7544	ma110403_rel_withdbg.cz11b_c32r128
qp100.L2
qp100.L2: point queries with 100 insert/s per client. Graphs for performance per 1-second interval are here.
Average throughput:
Query response time histogram: each cell has the percentage of responses that take <= the time in the header and max is the max response time in seconds. For max values in the top 25% of the range have a red background and in the bottom 25% of the range have a green background. The red background is not used when the min value is within 80% of the max value.
| dbms | 256us | 1ms | 4ms | 16ms | 64ms | 256ms | 1s | 4s | 16s | gt | max |
|---|---|---|---|---|---|---|---|---|---|---|---|
| my8039_rel_o2nofp.cz11a_nocb_c32r128 | 0.002 | 52.586 | 46.635 | 0.777 | nonzero | 0.023 | |||||
| my8039_rel_o2nofp.cz11a_c32r128 | 0.003 | 51.040 | 48.122 | 0.836 | nonzero | 0.017 | |||||
| ma101109_rel_withdbg.cz11a_c32r128 | 0.005 | 55.347 | 44.153 | 0.433 | 0.060 | 0.002 | 0.251 | ||||
| ma110403_rel_withdbg.cz11b_c32r128 | 0.006 | 55.848 | 43.607 | 0.470 | 0.066 | 0.003 | nonzero | 0.301 |
Insert response time histogram: each cell has the percentage of responses that take <= the time in the header and max is the max response time in seconds. For max values in the top 25% of the range have a red background and in the bottom 25% of the range have a green background. The red background is not used when the min value is within 80% of the max value.
| dbms | 256us | 1ms | 4ms | 16ms | 64ms | 256ms | 1s | 4s | 16s | gt | max |
|---|---|---|---|---|---|---|---|---|---|---|---|
| my8039_rel_o2nofp.cz11a_nocb_c32r128 | 3.771 | 95.567 | 0.662 | 0.154 | |||||||
| my8039_rel_o2nofp.cz11a_c32r128 | 42.807 | 57.165 | 0.028 | 0.084 | |||||||
| ma101109_rel_withdbg.cz11a_c32r128 | 0.207 | 87.782 | 11.378 | 0.633 | 0.401 | ||||||
| ma110403_rel_withdbg.cz11b_c32r128 | 0.239 | 88.954 | 10.310 | 0.497 | 0.437 |
Delete response time histogram: each cell has the percentage of responses that take <= the time in the header and max is the max response time in seconds. For max values in the top 25% of the range have a red background and in the bottom 25% of the range have a green background. The red background is not used when the min value is within 80% of the max value.
| dbms | 256us | 1ms | 4ms | 16ms | 64ms | 256ms | 1s | 4s | 16s | gt | max |
|---|---|---|---|---|---|---|---|---|---|---|---|
| my8039_rel_o2nofp.cz11a_nocb_c32r128 | 46.583 | 53.335 | 0.082 | 0.094 | |||||||
| my8039_rel_o2nofp.cz11a_c32r128 | 82.588 | 17.413 | 0.013 | ||||||||
| ma101109_rel_withdbg.cz11a_c32r128 | 0.335 | 90.314 | 9.286 | 0.065 | 0.336 | ||||||
| ma110403_rel_withdbg.cz11b_c32r128 | 0.369 | 90.604 | 8.872 | 0.154 | 0.437 |
Performance metrics for the DBMS listed above. Some are normalized by throughput, others are not. Legend for results is here.
ips	qps	rps	rmbps	wps	wmbps	rpq	rkbpq	wpi	wkbpi	csps	cpups	cspq	cpupq	dbgb1	dbgb2	rss	maxop	p50	p99	tag
1976	17439	128161	2002.5	17556.8	490.1	7.349	117.588	8.886	254.019	377469	16.6	21.646	457	814.0	915.3	106.0	0.023	911	336	my8039_rel_o2nofp.cz11a_nocb_c32r128
1977	17203	126426	1975.4	17480.6	490.4	7.349	117.583	8.842	254.000	373425	16.7	21.707	466	818.4	932.1	106.1	0.017	911	368	my8039_rel_o2nofp.cz11a_c32r128
1976	17765	130543	2038.6	12551.9	345.3	7.348	117.507	6.353	178.982	519686	15.8	29.254	427	723.7	826.3	100.4	0.251	943	192	ma101109_rel_withdbg.cz11a_c32r128
1976	17688	129650	2024.7	12430.2	343.0	7.330	117.209	6.291	177.771	515228	15.6	29.128	423	725.0	827.7	100.4	0.301	943	176	ma110403_rel_withdbg.cz11b_c32r128
qr500.L3
qr500.L3: range queries with 500 insert/s per client. Graphs for performance per 1-second interval are here.
Average throughput:
Query response time histogram: each cell has the percentage of responses that take <= the time in the header and max is the max response time in seconds. For max values in the top 25% of the range have a red background and in the bottom 25% of the range have a green background. The red background is not used when the min value is within 80% of the max value.
| dbms | 256us | 1ms | 4ms | 16ms | 64ms | 256ms | 1s | 4s | 16s | gt | max |
|---|---|---|---|---|---|---|---|---|---|---|---|
| my8039_rel_o2nofp.cz11a_nocb_c32r128 | 99.022 | 0.958 | 0.018 | 0.003 | nonzero | 0.027 | |||||
| my8039_rel_o2nofp.cz11a_c32r128 | 99.284 | 0.687 | 0.027 | 0.002 | nonzero | 0.031 | |||||
| ma101109_rel_withdbg.cz11a_c32r128 | 93.258 | 5.400 | 1.117 | 0.158 | 0.060 | 0.006 | 0.001 | 0.385 | |||
| ma110403_rel_withdbg.cz11b_c32r128 | 92.517 | 5.871 | 1.189 | 0.269 | 0.145 | 0.008 | nonzero | 0.410 |
Insert response time histogram: each cell has the percentage of responses that take <= the time in the header and max is the max response time in seconds. For max values in the top 25% of the range have a red background and in the bottom 25% of the range have a green background. The red background is not used when the min value is within 80% of the max value.
| dbms | 256us | 1ms | 4ms | 16ms | 64ms | 256ms | 1s | 4s | 16s | gt | max |
|---|---|---|---|---|---|---|---|---|---|---|---|
| my8039_rel_o2nofp.cz11a_nocb_c32r128 | 12.625 | 86.725 | 0.650 | 0.109 | |||||||
| my8039_rel_o2nofp.cz11a_c32r128 | 16.750 | 82.219 | 1.031 | 0.117 | |||||||
| ma101109_rel_withdbg.cz11a_c32r128 | 6.011 | 51.984 | 25.444 | 16.561 | 0.979 | ||||||
| ma110403_rel_withdbg.cz11b_c32r128 | 7.521 | 44.047 | 35.467 | 12.964 | 0.973 |
Delete response time histogram: each cell has the percentage of responses that take <= the time in the header and max is the max response time in seconds. For max values in the top 25% of the range have a red background and in the bottom 25% of the range have a green background. The red background is not used when the min value is within 80% of the max value.
| dbms | 256us | 1ms | 4ms | 16ms | 64ms | 256ms | 1s | 4s | 16s | gt | max |
|---|---|---|---|---|---|---|---|---|---|---|---|
| my8039_rel_o2nofp.cz11a_nocb_c32r128 | 27.210 | 72.782 | 0.008 | 0.084 | |||||||
| my8039_rel_o2nofp.cz11a_c32r128 | 42.736 | 56.812 | 0.452 | 0.049 | |||||||
| ma101109_rel_withdbg.cz11a_c32r128 | 24.117 | 39.489 | 22.092 | 14.301 | 0.949 | ||||||
| ma110403_rel_withdbg.cz11b_c32r128 | 17.323 | 39.464 | 31.558 | 11.654 | 0.970 |
Performance metrics for the DBMS listed above. Some are normalized by throughput, others are not. Legend for results is here.
ips	qps	rps	rmbps	wps	wmbps	rpq	rkbpq	wpi	wkbpi	csps	cpups	cspq	cpupq	dbgb1	dbgb2	rss	maxop	p50	p99	tag
9879	156129	40957	640.0	53062.6	1384.9	0.262	4.197	5.371	143.551	813315	54.6	5.209	168	814.0	915.3	106.0	0.027	7863	6969	my8039_rel_o2nofp.cz11a_nocb_c32r128
9885	160796	37394	584.3	45903.2	1278.1	0.233	3.721	4.644	132.408	814123	54.9	5.063	164	818.4	932.1	106.1	0.031	8135	7163	my8039_rel_o2nofp.cz11a_c32r128
8411	94824	35558	550.5	34632.1	955.3	0.375	5.945	4.117	116.300	1061765	41.6	11.197	211	724.0	826.6	100.6	0.385	4715	2573	ma101109_rel_withdbg.cz11a_c32r128
8459	80329	34911	540.7	32875.5	909.2	0.435	6.893	3.887	110.068	1098327	37.5	13.673	224	725.3	828.0	100.6	0.410	3773	1711	ma110403_rel_withdbg.cz11b_c32r128
qp500.L4
qp500.L4: point queries with 500 insert/s per client. Graphs for performance per 1-second interval are here.
Average throughput:
Query response time histogram: each cell has the percentage of responses that take <= the time in the header and max is the max response time in seconds. For max values in the top 25% of the range have a red background and in the bottom 25% of the range have a green background. The red background is not used when the min value is within 80% of the max value.
| dbms | 256us | 1ms | 4ms | 16ms | 64ms | 256ms | 1s | 4s | 16s | gt | max |
|---|---|---|---|---|---|---|---|---|---|---|---|
| my8039_rel_o2nofp.cz11a_nocb_c32r128 | 2.020 | 71.347 | 26.575 | 0.058 | 0.038 | ||||||
| my8039_rel_o2nofp.cz11a_c32r128 | nonzero | 7.351 | 83.312 | 9.326 | 0.011 | 0.026 | |||||
| ma101109_rel_withdbg.cz11a_c32r128 | nonzero | 8.197 | 77.844 | 11.671 | 2.276 | 0.008 | 0.004 | 0.350 | |||
| ma110403_rel_withdbg.cz11b_c32r128 | nonzero | 8.275 | 75.885 | 13.488 | 2.335 | 0.011 | 0.005 | 0.364 |
Insert response time histogram: each cell has the percentage of responses that take <= the time in the header and max is the max response time in seconds. For max values in the top 25% of the range have a red background and in the bottom 25% of the range have a green background. The red background is not used when the min value is within 80% of the max value.
| dbms | 256us | 1ms | 4ms | 16ms | 64ms | 256ms | 1s | 4s | 16s | gt | max |
|---|---|---|---|---|---|---|---|---|---|---|---|
| my8039_rel_o2nofp.cz11a_nocb_c32r128 | 0.481 | 84.641 | 14.878 | 0.156 | |||||||
| my8039_rel_o2nofp.cz11a_c32r128 | 12.871 | 86.998 | 0.131 | 0.135 | |||||||
| ma101109_rel_withdbg.cz11a_c32r128 | 0.004 | 11.724 | 20.341 | 67.931 | 0.793 | ||||||
| ma110403_rel_withdbg.cz11b_c32r128 | 0.017 | 14.397 | 21.066 | 64.520 | 0.872 |
Delete response time histogram: each cell has the percentage of responses that take <= the time in the header and max is the max response time in seconds. For max values in the top 25% of the range have a red background and in the bottom 25% of the range have a green background. The red background is not used when the min value is within 80% of the max value.
| dbms | 256us | 1ms | 4ms | 16ms | 64ms | 256ms | 1s | 4s | 16s | gt | max |
|---|---|---|---|---|---|---|---|---|---|---|---|
| my8039_rel_o2nofp.cz11a_nocb_c32r128 | 1.305 | 97.689 | 1.007 | 0.109 | |||||||
| my8039_rel_o2nofp.cz11a_c32r128 | 28.848 | 70.028 | 1.124 | 0.050 | |||||||
| ma101109_rel_withdbg.cz11a_c32r128 | 0.049 | 12.999 | 25.152 | 61.800 | 0.718 | ||||||
| ma110403_rel_withdbg.cz11b_c32r128 | 0.053 | 15.607 | 22.188 | 62.152 | 0.728 |
Performance metrics for the DBMS listed above. Some are normalized by throughput, others are not. Legend for results is here.
ips	qps	rps	rmbps	wps	wmbps	rpq	rkbpq	wpi	wkbpi	csps	cpups	cspq	cpupq	dbgb1	dbgb2	rss	maxop	p50	p99	tag
9885	6342	101749	1589.8	68089.4	1668.7	16.043	256.683	6.888	172.875	451846	20.7	71.242	1567	814.0	915.3	106.0	0.038	320	176	my8039_rel_o2nofp.cz11a_nocb_c32r128
9885	9033	108421	1694.1	47732.9	1328.5	12.003	192.052	4.829	137.630	426771	22.5	47.247	1196	818.4	932.1	106.0	0.026	463	240	my8039_rel_o2nofp.cz11a_c32r128
3771	6840	85557	1334.7	28539.1	789.8	12.508	199.817	7.568	214.463	1097140	19.3	160.401	1354	724.1	826.8	100.6	0.350	368	48	ma101109_rel_withdbg.cz11a_c32r128
3909	6488	82583	1288.1	29008.2	804.7	12.729	203.319	7.421	210.803	1098779	19.0	169.366	1406	725.3	828.0	100.6	0.364	336	64	ma110403_rel_withdbg.cz11b_c32r128
qr1000.L5
qr1000.L5: range queries with 1000 insert/s per client. Graphs for performance per 1-second interval are here.
Average throughput:
Query response time histogram: each cell has the percentage of responses that take <= the time in the header and max is the max response time in seconds. For max values in the top 25% of the range have a red background and in the bottom 25% of the range have a green background. The red background is not used when the min value is within 80% of the max value.
| dbms | 256us | 1ms | 4ms | 16ms | 64ms | 256ms | 1s | 4s | 16s | gt | max |
|---|---|---|---|---|---|---|---|---|---|---|---|
| my8039_rel_o2nofp.cz11a_nocb_c32r128 | 90.487 | 8.172 | 1.329 | 0.011 | 0.001 | 0.062 | |||||
| my8039_rel_o2nofp.cz11a_c32r128 | 95.984 | 3.116 | 0.887 | 0.013 | nonzero | 0.029 | |||||
| ma101109_rel_withdbg.cz11a_c32r128 | 92.743 | 5.583 | 1.432 | 0.218 | 0.022 | 0.002 | nonzero | 0.357 | |||
| ma110403_rel_withdbg.cz11b_c32r128 | 92.534 | 5.753 | 1.343 | 0.310 | 0.058 | 0.002 | nonzero | 0.365 |
Insert response time histogram: each cell has the percentage of responses that take <= the time in the header and max is the max response time in seconds. For max values in the top 25% of the range have a red background and in the bottom 25% of the range have a green background. The red background is not used when the min value is within 80% of the max value.
| dbms | 256us | 1ms | 4ms | 16ms | 64ms | 256ms | 1s | 4s | 16s | gt | max |
|---|---|---|---|---|---|---|---|---|---|---|---|
| my8039_rel_o2nofp.cz11a_nocb_c32r128 | 0.220 | 80.267 | 19.512 | nonzero | 0.273 | ||||||
| my8039_rel_o2nofp.cz11a_c32r128 | nonzero | 35.224 | 64.740 | 0.036 | 0.099 | ||||||
| ma101109_rel_withdbg.cz11a_c32r128 | 0.893 | 16.800 | 55.613 | 26.694 | 0.949 | ||||||
| ma110403_rel_withdbg.cz11b_c32r128 | 1.339 | 17.440 | 54.362 | 26.859 | 0.847 |
Delete response time histogram: each cell has the percentage of responses that take <= the time in the header and max is the max response time in seconds. For max values in the top 25% of the range have a red background and in the bottom 25% of the range have a green background. The red background is not used when the min value is within 80% of the max value.
| dbms | 256us | 1ms | 4ms | 16ms | 64ms | 256ms | 1s | 4s | 16s | gt | max |
|---|---|---|---|---|---|---|---|---|---|---|---|
| my8039_rel_o2nofp.cz11a_nocb_c32r128 | 0.428 | 83.632 | 15.940 | 0.181 | |||||||
| my8039_rel_o2nofp.cz11a_c32r128 | 27.508 | 69.473 | 3.019 | 0.053 | |||||||
| ma101109_rel_withdbg.cz11a_c32r128 | 10.273 | 16.492 | 48.571 | 24.664 | 0.919 | ||||||
| ma110403_rel_withdbg.cz11b_c32r128 | 7.570 | 17.881 | 48.543 | 26.006 | 0.841 |
Performance metrics for the DBMS listed above. Some are normalized by throughput, others are not. Legend for results is here.
ips	qps	rps	rmbps	wps	wmbps	rpq	rkbpq	wpi	wkbpi	csps	cpups	cspq	cpupq	dbgb1	dbgb2	rss	maxop	p50	p99	tag
18000	101645	61806	965.7	86723.3	2085.2	0.608	9.729	4.818	118.624	736844	56.8	7.249	268	814.0	917.0	106.0	0.062	4956	4189	my8039_rel_o2nofp.cz11a_nocb_c32r128
19769	119664	36933	577.1	48339.8	1389.8	0.309	4.938	2.445	71.989	678256	59.3	5.668	238	818.4	932.9	106.0	0.029	5929	5114	my8039_rel_o2nofp.cz11a_c32r128
6235	99044	34701	538.7	33275.5	921.0	0.350	5.570	5.337	151.270	1094931	43.9	11.055	213	724.1	826.9	100.7	0.357	4555	2493	ma101109_rel_withdbg.cz11a_c32r128
6319	91584	35759	555.2	33619.7	934.0	0.390	6.208	5.320	151.347	1130405	41.7	12.343	219	725.3	828.1	100.7	0.365	4475	1998	ma110403_rel_withdbg.cz11b_c32r128
qp1000.L6
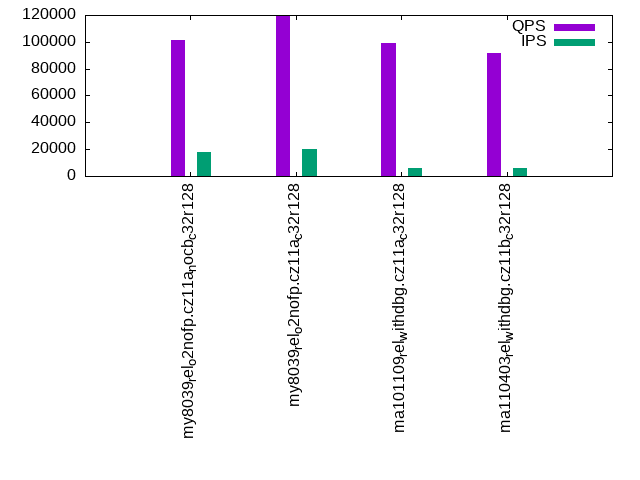
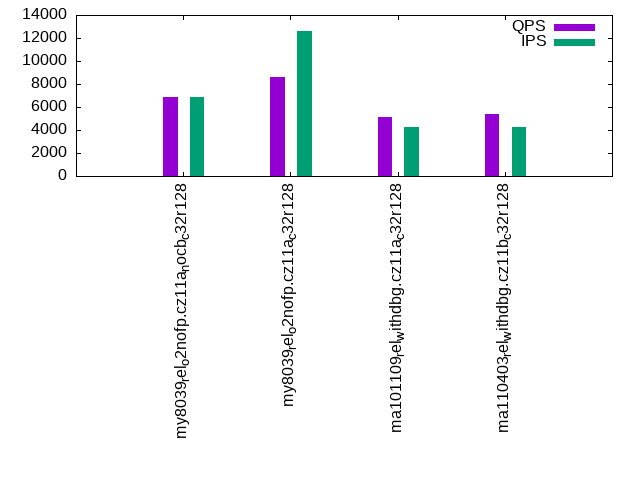
qp1000.L6: point queries with 1000 insert/s per client. Graphs for performance per 1-second interval are here.
Average throughput:
Query response time histogram: each cell has the percentage of responses that take <= the time in the header and max is the max response time in seconds. For max values in the top 25% of the range have a red background and in the bottom 25% of the range have a green background. The red background is not used when the min value is within 80% of the max value.
| dbms | 256us | 1ms | 4ms | 16ms | 64ms | 256ms | 1s | 4s | 16s | gt | max |
|---|---|---|---|---|---|---|---|---|---|---|---|
| my8039_rel_o2nofp.cz11a_nocb_c32r128 | nonzero | 1.352 | 81.136 | 17.509 | 0.003 | 0.037 | |||||
| my8039_rel_o2nofp.cz11a_c32r128 | nonzero | 4.860 | 85.374 | 9.750 | 0.015 | 0.061 | |||||
| ma101109_rel_withdbg.cz11a_c32r128 | nonzero | 6.758 | 73.157 | 15.276 | 4.777 | 0.031 | 0.003 | 0.348 | |||
| ma110403_rel_withdbg.cz11b_c32r128 | nonzero | 7.569 | 72.449 | 16.155 | 3.794 | 0.029 | 0.004 | 0.365 |
Insert response time histogram: each cell has the percentage of responses that take <= the time in the header and max is the max response time in seconds. For max values in the top 25% of the range have a red background and in the bottom 25% of the range have a green background. The red background is not used when the min value is within 80% of the max value.
| dbms | 256us | 1ms | 4ms | 16ms | 64ms | 256ms | 1s | 4s | 16s | gt | max |
|---|---|---|---|---|---|---|---|---|---|---|---|
| my8039_rel_o2nofp.cz11a_nocb_c32r128 | 100.000 | 0.241 | |||||||||
| my8039_rel_o2nofp.cz11a_c32r128 | nonzero | 7.312 | 29.467 | 63.220 | 0.001 | 0.265 | |||||
| ma101109_rel_withdbg.cz11a_c32r128 | 0.017 | 18.919 | 26.387 | 54.677 | 0.814 | ||||||
| ma110403_rel_withdbg.cz11b_c32r128 | 0.010 | 18.284 | 26.764 | 54.942 | 0.796 |
Delete response time histogram: each cell has the percentage of responses that take <= the time in the header and max is the max response time in seconds. For max values in the top 25% of the range have a red background and in the bottom 25% of the range have a green background. The red background is not used when the min value is within 80% of the max value.
| dbms | 256us | 1ms | 4ms | 16ms | 64ms | 256ms | 1s | 4s | 16s | gt | max |
|---|---|---|---|---|---|---|---|---|---|---|---|
| my8039_rel_o2nofp.cz11a_nocb_c32r128 | 100.000 | 0.231 | |||||||||
| my8039_rel_o2nofp.cz11a_c32r128 | 2.437 | 19.883 | 21.146 | 56.534 | 0.254 | ||||||
| ma101109_rel_withdbg.cz11a_c32r128 | 0.080 | 20.470 | 31.576 | 47.875 | 0.806 | ||||||
| ma110403_rel_withdbg.cz11b_c32r128 | 0.044 | 19.524 | 27.865 | 52.567 | 0.751 |
Performance metrics for the DBMS listed above. Some are normalized by throughput, others are not. Legend for results is here.
ips	qps	rps	rmbps	wps	wmbps	rpq	rkbpq	wpi	wkbpi	csps	cpups	cspq	cpupq	dbgb1	dbgb2	rss	maxop	p50	p99	tag
6890	6833	105196	1643.7	58597.3	1615.2	15.395	246.315	8.505	240.051	467126	19.8	68.360	1391	814.0	917.7	106.0	0.037	352	256	my8039_rel_o2nofp.cz11a_nocb_c32r128
12609	8645	106609	1665.8	47165.1	1337.3	12.331	197.304	3.740	108.604	464367	26.9	53.713	1494	818.4	934.5	106.0	0.061	448	240	my8039_rel_o2nofp.cz11a_c32r128
4249	5145	68951	1075.1	26209.6	724.2	13.403	213.993	6.168	174.533	1213545	19.4	235.887	1810	724.1	826.9	100.6	0.348	208	32	ma101109_rel_withdbg.cz11a_c32r128
4254	5399	72009	1122.9	27554.0	763.9	13.337	212.961	6.477	183.867	1177901	19.1	218.154	1698	725.4	828.2	100.6	0.365	224	48	ma110403_rel_withdbg.cz11b_c32r128
l.i0
l.i0: load without secondary indexes
Performance metrics for all DBMS, not just the ones listed above. Some are normalized by throughput, others are not. Legend for results is here.
ips	qps	rps	rmbps	wps	wmbps	rpq	rkbpq	wpi	wkbpi	csps	cpups	cspq	cpupq	dbgb1	dbgb2	rss	maxop	p50	p99	tag
1435750	0	4	0.0	9764.0	534.0	0.000	0.000	0.007	0.381	295680	55.1	0.206	18	262.3	362.8	108.6	0.241	75019	62233	my8039_rel_o2nofp.cz11a_nocb_c32r128
1434206	0	4	0.0	9732.3	532.7	0.000	0.000	0.007	0.380	295453	55.2	0.206	18	262.3	362.8	108.6	0.228	74720	62333	my8039_rel_o2nofp.cz11a_c32r128
281057	0	2614	10.2	1995.5	84.6	0.009	0.037	0.007	0.308	251834	50.5	0.896	86	263.2	365.2	101.4	0.666	14684	200	ma101109_rel_withdbg.cz11a_c32r128
284698	0	2649	10.4	2030.6	85.8	0.009	0.037	0.007	0.309	256608	50.4	0.901	85	263.2	365.2	101.4	0.677	14884	200	ma110403_rel_withdbg.cz11b_c32r128
l.x
l.x: create secondary indexes
Performance metrics for all DBMS, not just the ones listed above. Some are normalized by throughput, others are not. Legend for results is here.
ips	qps	rps	rmbps	wps	wmbps	rpq	rkbpq	wpi	wkbpi	csps	cpups	cspq	cpupq	dbgb1	dbgb2	rss	maxop	p50	p99	tag
1324942	0	33429	1929.3	39549.1	1738.6	0.025	1.491	0.030	1.344	193323	56.1	0.146	20	603.6	704.2	104.9	0.022	NA	NA	my8039_rel_o2nofp.cz11a_nocb_c32r128
1353180	0	34149	1971.3	40424.4	1776.7	0.025	1.492	0.030	1.344	193770	57.0	0.143	20	603.6	704.2	104.9	0.017	NA	NA	my8039_rel_o2nofp.cz11a_c32r128
1573564	0	17191	1407.8	18209.2	1551.0	0.011	0.916	0.012	1.009	78106	23.7	0.050	7	557.5	659.5	101.8	0.002	NA	NA	ma101109_rel_withdbg.cz11a_c32r128
1523229	0	16614	1355.4	19282.1	1511.1	0.011	0.911	0.013	1.016	83878	24.2	0.055	8	557.5	659.5	101.8	0.002	NA	NA	ma110403_rel_withdbg.cz11b_c32r128
l.i1
l.i1: continue load after secondary indexes created with 50 inserts per transaction
Performance metrics for all DBMS, not just the ones listed above. Some are normalized by throughput, others are not. Legend for results is here.
ips	qps	rps	rmbps	wps	wmbps	rpq	rkbpq	wpi	wkbpi	csps	cpups	cspq	cpupq	dbgb1	dbgb2	rss	maxop	p50	p99	tag
8946	0	50536	789.7	68019.4	1794.6	5.649	90.386	7.603	205.404	363105	14.4	40.586	773	814.0	918.2	107.6	0.489	400	300	my8039_rel_o2nofp.cz11a_nocb_c32r128
16162	0	36368	568.3	53216.8	1514.8	2.250	36.005	3.293	95.980	333511	20.7	20.636	615	818.4	935.0	107.6	0.499	699	300	my8039_rel_o2nofp.cz11a_c32r128
6122	0	36608	568.0	35668.6	973.6	5.980	95.006	5.826	162.858	862195	14.3	140.840	1121	723.7	826.3	100.5	128.400	300	0	ma101109_rel_withdbg.cz11a_c32r128
6262	0	38408	596.0	37589.9	1007.8	6.133	97.454	6.003	164.789	868728	13.6	138.726	1042	725.0	827.7	100.5	104.927	300	0	ma110403_rel_withdbg.cz11b_c32r128
l.i2
l.i2: continue load after secondary indexes created with 5 inserts per transaction
Performance metrics for all DBMS, not just the ones listed above. Some are normalized by throughput, others are not. Legend for results is here.
ips	qps	rps	rmbps	wps	wmbps	rpq	rkbpq	wpi	wkbpi	csps	cpups	cspq	cpupq	dbgb1	dbgb2	rss	maxop	p50	p99	tag
4529	0	44886	701.3	56388.1	1591.3	9.911	158.577	12.451	359.794	352666	15.3	77.870	1622	814.0	915.3	106.0	0.136	140	75	my8039_rel_o2nofp.cz11a_nocb_c32r128
5682	0	38736	605.3	50136.5	1439.4	6.818	109.082	8.824	259.410	335921	17.3	59.122	1462	818.4	932.1	106.0	0.167	140	80	my8039_rel_o2nofp.cz11a_c32r128
6812	0	38701	586.1	31995.9	891.4	5.681	88.108	4.697	134.004	902625	15.7	132.507	1106	723.7	826.3	100.5	2.729	445	65	ma101109_rel_withdbg.cz11a_c32r128
7613	0	40314	608.8	33481.0	935.0	5.295	81.892	4.398	125.764	996146	16.3	130.845	1028	725.0	827.7	100.5	4.100	469	85	ma110403_rel_withdbg.cz11b_c32r128
qr100.L1
qr100.L1: range queries with 100 insert/s per client
Performance metrics for all DBMS, not just the ones listed above. Some are normalized by throughput, others are not. Legend for results is here.
ips	qps	rps	rmbps	wps	wmbps	rpq	rkbpq	wpi	wkbpi	csps	cpups	cspq	cpupq	dbgb1	dbgb2	rss	maxop	p50	p99	tag
1977	180950	8357	130.6	9281.8	266.4	0.046	0.739	4.695	138.009	735420	44.8	4.064	119	814.0	915.3	106.0	0.031	9174	8587	my8039_rel_o2nofp.cz11a_nocb_c32r128
1977	183538	8290	129.5	9300.2	267.9	0.045	0.723	4.704	138.770	746909	45.3	4.070	118	818.4	932.1	106.0	0.013	9366	8711	my8039_rel_o2nofp.cz11a_c32r128
1976	176381	9250	143.4	5991.3	168.0	0.052	0.833	3.032	87.084	733626	44.2	4.159	120	723.7	826.3	100.4	0.027	8950	7419	ma101109_rel_withdbg.cz11a_c32r128
1976	177008	9276	143.7	5988.0	168.4	0.052	0.832	3.031	87.268	738233	44.2	4.171	120	725.0	827.7	100.4	0.154	9017	7544	ma110403_rel_withdbg.cz11b_c32r128
qp100.L2
qp100.L2: point queries with 100 insert/s per client
Performance metrics for all DBMS, not just the ones listed above. Some are normalized by throughput, others are not. Legend for results is here.
ips	qps	rps	rmbps	wps	wmbps	rpq	rkbpq	wpi	wkbpi	csps	cpups	cspq	cpupq	dbgb1	dbgb2	rss	maxop	p50	p99	tag
1976	17439	128161	2002.5	17556.8	490.1	7.349	117.588	8.886	254.019	377469	16.6	21.646	457	814.0	915.3	106.0	0.023	911	336	my8039_rel_o2nofp.cz11a_nocb_c32r128
1977	17203	126426	1975.4	17480.6	490.4	7.349	117.583	8.842	254.000	373425	16.7	21.707	466	818.4	932.1	106.1	0.017	911	368	my8039_rel_o2nofp.cz11a_c32r128
1976	17765	130543	2038.6	12551.9	345.3	7.348	117.507	6.353	178.982	519686	15.8	29.254	427	723.7	826.3	100.4	0.251	943	192	ma101109_rel_withdbg.cz11a_c32r128
1976	17688	129650	2024.7	12430.2	343.0	7.330	117.209	6.291	177.771	515228	15.6	29.128	423	725.0	827.7	100.4	0.301	943	176	ma110403_rel_withdbg.cz11b_c32r128
qr500.L3
qr500.L3: range queries with 500 insert/s per client
Performance metrics for all DBMS, not just the ones listed above. Some are normalized by throughput, others are not. Legend for results is here.
ips	qps	rps	rmbps	wps	wmbps	rpq	rkbpq	wpi	wkbpi	csps	cpups	cspq	cpupq	dbgb1	dbgb2	rss	maxop	p50	p99	tag
9879	156129	40957	640.0	53062.6	1384.9	0.262	4.197	5.371	143.551	813315	54.6	5.209	168	814.0	915.3	106.0	0.027	7863	6969	my8039_rel_o2nofp.cz11a_nocb_c32r128
9885	160796	37394	584.3	45903.2	1278.1	0.233	3.721	4.644	132.408	814123	54.9	5.063	164	818.4	932.1	106.1	0.031	8135	7163	my8039_rel_o2nofp.cz11a_c32r128
8411	94824	35558	550.5	34632.1	955.3	0.375	5.945	4.117	116.300	1061765	41.6	11.197	211	724.0	826.6	100.6	0.385	4715	2573	ma101109_rel_withdbg.cz11a_c32r128
8459	80329	34911	540.7	32875.5	909.2	0.435	6.893	3.887	110.068	1098327	37.5	13.673	224	725.3	828.0	100.6	0.410	3773	1711	ma110403_rel_withdbg.cz11b_c32r128
qp500.L4
qp500.L4: point queries with 500 insert/s per client
Performance metrics for all DBMS, not just the ones listed above. Some are normalized by throughput, others are not. Legend for results is here.
ips	qps	rps	rmbps	wps	wmbps	rpq	rkbpq	wpi	wkbpi	csps	cpups	cspq	cpupq	dbgb1	dbgb2	rss	maxop	p50	p99	tag
9885	6342	101749	1589.8	68089.4	1668.7	16.043	256.683	6.888	172.875	451846	20.7	71.242	1567	814.0	915.3	106.0	0.038	320	176	my8039_rel_o2nofp.cz11a_nocb_c32r128
9885	9033	108421	1694.1	47732.9	1328.5	12.003	192.052	4.829	137.630	426771	22.5	47.247	1196	818.4	932.1	106.0	0.026	463	240	my8039_rel_o2nofp.cz11a_c32r128
3771	6840	85557	1334.7	28539.1	789.8	12.508	199.817	7.568	214.463	1097140	19.3	160.401	1354	724.1	826.8	100.6	0.350	368	48	ma101109_rel_withdbg.cz11a_c32r128
3909	6488	82583	1288.1	29008.2	804.7	12.729	203.319	7.421	210.803	1098779	19.0	169.366	1406	725.3	828.0	100.6	0.364	336	64	ma110403_rel_withdbg.cz11b_c32r128
qr1000.L5
qr1000.L5: range queries with 1000 insert/s per client
Performance metrics for all DBMS, not just the ones listed above. Some are normalized by throughput, others are not. Legend for results is here.
ips	qps	rps	rmbps	wps	wmbps	rpq	rkbpq	wpi	wkbpi	csps	cpups	cspq	cpupq	dbgb1	dbgb2	rss	maxop	p50	p99	tag
18000	101645	61806	965.7	86723.3	2085.2	0.608	9.729	4.818	118.624	736844	56.8	7.249	268	814.0	917.0	106.0	0.062	4956	4189	my8039_rel_o2nofp.cz11a_nocb_c32r128
19769	119664	36933	577.1	48339.8	1389.8	0.309	4.938	2.445	71.989	678256	59.3	5.668	238	818.4	932.9	106.0	0.029	5929	5114	my8039_rel_o2nofp.cz11a_c32r128
6235	99044	34701	538.7	33275.5	921.0	0.350	5.570	5.337	151.270	1094931	43.9	11.055	213	724.1	826.9	100.7	0.357	4555	2493	ma101109_rel_withdbg.cz11a_c32r128
6319	91584	35759	555.2	33619.7	934.0	0.390	6.208	5.320	151.347	1130405	41.7	12.343	219	725.3	828.1	100.7	0.365	4475	1998	ma110403_rel_withdbg.cz11b_c32r128
qp1000.L6
qp1000.L6: point queries with 1000 insert/s per client
Performance metrics for all DBMS, not just the ones listed above. Some are normalized by throughput, others are not. Legend for results is here.
ips	qps	rps	rmbps	wps	wmbps	rpq	rkbpq	wpi	wkbpi	csps	cpups	cspq	cpupq	dbgb1	dbgb2	rss	maxop	p50	p99	tag
6890	6833	105196	1643.7	58597.3	1615.2	15.395	246.315	8.505	240.051	467126	19.8	68.360	1391	814.0	917.7	106.0	0.037	352	256	my8039_rel_o2nofp.cz11a_nocb_c32r128
12609	8645	106609	1665.8	47165.1	1337.3	12.331	197.304	3.740	108.604	464367	26.9	53.713	1494	818.4	934.5	106.0	0.061	448	240	my8039_rel_o2nofp.cz11a_c32r128
4249	5145	68951	1075.1	26209.6	724.2	13.403	213.993	6.168	174.533	1213545	19.4	235.887	1810	724.1	826.9	100.6	0.348	208	32	ma101109_rel_withdbg.cz11a_c32r128
4254	5399	72009	1122.9	27554.0	763.9	13.337	212.961	6.477	183.867	1177901	19.1	218.154	1698	725.4	828.2	100.6	0.365	224	48	ma110403_rel_withdbg.cz11b_c32r128
l.i0
- l.i0: load without secondary indexes
- Legend for results is here.
- Each entry lists the percentage of responses that fit in that bucket (slower than max time for previous bucket, faster than min time for next bucket).
Insert response time histogram
256us	1ms	4ms	16ms	64ms	256ms	1s	4s	16s	gt	max	tag
0.000	0.099	99.789	0.060	0.013	0.039	0.000	0.000	0.000	0.000	0.241	my8039_rel_o2nofp.cz11a_nocb_c32r128
0.000	0.086	99.802	0.060	0.014	0.038	0.000	0.000	0.000	0.000	0.228	my8039_rel_o2nofp.cz11a_c32r128
0.000	0.074	0.255	99.427	0.043	0.108	0.094	0.000	0.000	0.000	0.666	ma101109_rel_withdbg.cz11a_c32r128
0.000	0.066	0.263	99.421	0.051	0.106	0.094	0.000	0.000	0.000	0.677	ma110403_rel_withdbg.cz11b_c32r128
l.x
- l.x: create secondary indexes
- Legend for results is here.
- Each entry lists the percentage of responses that fit in that bucket (slower than max time for previous bucket, faster than min time for next bucket).
TODO - determine whether there is data for create index response time
l.i1
- l.i1: continue load after secondary indexes created with 50 inserts per transaction
- Legend for results is here.
- Each entry lists the percentage of responses that fit in that bucket (slower than max time for previous bucket, faster than min time for next bucket).
Insert response time histogram
256us	1ms	4ms	16ms	64ms	256ms	1s	4s	16s	gt	max	tag
0.000	0.000	0.000	0.000	17.796	81.883	0.321	0.000	0.000	0.000	0.489	my8039_rel_o2nofp.cz11a_nocb_c32r128
0.000	0.000	0.105	14.232	38.037	47.286	0.340	0.000	0.000	0.000	0.499	my8039_rel_o2nofp.cz11a_c32r128
0.000	0.000	0.000	1.204	16.009	57.842	24.942	0.001	0.001	0.002	128.400	ma101109_rel_withdbg.cz11a_c32r128
0.000	0.000	0.000	1.917	15.311	57.804	24.950	0.008	0.005	0.005	104.927	ma110403_rel_withdbg.cz11b_c32r128
Delete response time histogram
256us	1ms	4ms	16ms	64ms	256ms	1s	4s	16s	gt	max	tag
0.000	0.000	0.000	0.240	38.567	61.193	0.001	0.000	0.000	0.000	0.294	my8039_rel_o2nofp.cz11a_nocb_c32r128
0.000	0.000	18.776	19.593	29.076	32.556	0.000	0.000	0.000	0.000	0.194	my8039_rel_o2nofp.cz11a_c32r128
0.000	0.000	0.000	9.959	24.433	43.130	22.475	0.001	0.001	0.002	87.473	ma101109_rel_withdbg.cz11a_c32r128
0.000	0.000	0.000	10.032	19.980	45.904	24.073	0.006	0.003	0.002	102.879	ma110403_rel_withdbg.cz11b_c32r128
l.i2
- l.i2: continue load after secondary indexes created with 5 inserts per transaction
- Legend for results is here.
- Each entry lists the percentage of responses that fit in that bucket (slower than max time for previous bucket, faster than min time for next bucket).
Insert response time histogram
256us	1ms	4ms	16ms	64ms	256ms	1s	4s	16s	gt	max	tag
0.000	0.000	0.000	66.488	31.542	1.970	0.000	0.000	0.000	0.000	0.136	my8039_rel_o2nofp.cz11a_nocb_c32r128
0.000	0.000	0.083	72.400	27.311	0.206	0.000	0.000	0.000	0.000	0.167	my8039_rel_o2nofp.cz11a_c32r128
0.000	0.012	6.985	70.904	20.664	1.413	0.021	0.001	0.000	0.000	2.729	ma101109_rel_withdbg.cz11a_c32r128
0.000	0.031	15.909	60.032	23.806	0.214	0.006	nonzero	nonzero	0.000	4.100	ma110403_rel_withdbg.cz11b_c32r128
Delete response time histogram
256us	1ms	4ms	16ms	64ms	256ms	1s	4s	16s	gt	max	tag
0.000	0.000	0.000	69.236	29.778	0.986	0.000	0.000	0.000	0.000	0.136	my8039_rel_o2nofp.cz11a_nocb_c32r128
0.000	0.000	0.260	73.200	26.459	0.080	0.000	0.000	0.000	0.000	0.167	my8039_rel_o2nofp.cz11a_c32r128
nonzero	0.072	17.629	66.997	14.044	1.252	0.005	nonzero	0.000	0.000	2.727	ma101109_rel_withdbg.cz11a_c32r128
0.000	0.086	25.395	54.241	20.077	0.197	0.004	nonzero	nonzero	0.000	4.100	ma110403_rel_withdbg.cz11b_c32r128
qr100.L1
- qr100.L1: range queries with 100 insert/s per client
- Legend for results is here.
- Each entry lists the percentage of responses that fit in that bucket (slower than max time for previous bucket, faster than min time for next bucket).
Query response time histogram
256us	1ms	4ms	16ms	64ms	256ms	1s	4s	16s	gt	max	tag
99.834	0.163	0.002	nonzero	nonzero	0.000	0.000	0.000	0.000	0.000	0.031	my8039_rel_o2nofp.cz11a_nocb_c32r128
99.889	0.107	0.003	nonzero	0.000	0.000	0.000	0.000	0.000	0.000	0.013	my8039_rel_o2nofp.cz11a_c32r128
99.633	0.330	0.034	0.003	nonzero	0.000	0.000	0.000	0.000	0.000	0.027	ma101109_rel_withdbg.cz11a_c32r128
99.584	0.375	0.039	0.002	nonzero	nonzero	0.000	0.000	0.000	0.000	0.154	ma110403_rel_withdbg.cz11b_c32r128
Insert response time histogram
256us	1ms	4ms	16ms	64ms	256ms	1s	4s	16s	gt	max	tag
0.000	0.000	0.000	82.812	17.188	0.000	0.000	0.000	0.000	0.000	0.052	my8039_rel_o2nofp.cz11a_nocb_c32r128
0.000	0.000	0.000	95.174	4.826	0.000	0.000	0.000	0.000	0.000	0.037	my8039_rel_o2nofp.cz11a_c32r128
0.000	0.000	0.000	34.196	65.803	0.001	0.000	0.000	0.000	0.000	0.065	ma101109_rel_withdbg.cz11a_c32r128
0.000	0.000	0.000	33.228	66.319	0.453	0.000	0.000	0.000	0.000	0.198	ma110403_rel_withdbg.cz11b_c32r128
Delete response time histogram
256us	1ms	4ms	16ms	64ms	256ms	1s	4s	16s	gt	max	tag
0.000	0.000	0.000	94.983	5.017	0.000	0.000	0.000	0.000	0.000	0.036	my8039_rel_o2nofp.cz11a_nocb_c32r128
0.000	0.000	91.606	8.394	0.000	0.000	0.000	0.000	0.000	0.000	0.013	my8039_rel_o2nofp.cz11a_c32r128
0.000	0.000	0.000	73.415	26.585	0.000	0.000	0.000	0.000	0.000	0.055	ma101109_rel_withdbg.cz11a_c32r128
0.000	0.000	0.000	68.756	31.104	0.140	0.000	0.000	0.000	0.000	0.193	ma110403_rel_withdbg.cz11b_c32r128
qp100.L2
- qp100.L2: point queries with 100 insert/s per client
- Legend for results is here.
- Each entry lists the percentage of responses that fit in that bucket (slower than max time for previous bucket, faster than min time for next bucket).
Query response time histogram
256us	1ms	4ms	16ms	64ms	256ms	1s	4s	16s	gt	max	tag
0.002	52.586	46.635	0.777	nonzero	0.000	0.000	0.000	0.000	0.000	0.023	my8039_rel_o2nofp.cz11a_nocb_c32r128
0.003	51.040	48.122	0.836	nonzero	0.000	0.000	0.000	0.000	0.000	0.017	my8039_rel_o2nofp.cz11a_c32r128
0.005	55.347	44.153	0.433	0.060	0.002	0.000	0.000	0.000	0.000	0.251	ma101109_rel_withdbg.cz11a_c32r128
0.006	55.848	43.607	0.470	0.066	0.003	nonzero	0.000	0.000	0.000	0.301	ma110403_rel_withdbg.cz11b_c32r128
Insert response time histogram
256us	1ms	4ms	16ms	64ms	256ms	1s	4s	16s	gt	max	tag
0.000	0.000	0.000	3.771	95.567	0.662	0.000	0.000	0.000	0.000	0.154	my8039_rel_o2nofp.cz11a_nocb_c32r128
0.000	0.000	0.000	42.807	57.165	0.028	0.000	0.000	0.000	0.000	0.084	my8039_rel_o2nofp.cz11a_c32r128
0.000	0.000	0.000	0.207	87.782	11.378	0.633	0.000	0.000	0.000	0.401	ma101109_rel_withdbg.cz11a_c32r128
0.000	0.000	0.000	0.239	88.954	10.310	0.497	0.000	0.000	0.000	0.437	ma110403_rel_withdbg.cz11b_c32r128
Delete response time histogram
256us	1ms	4ms	16ms	64ms	256ms	1s	4s	16s	gt	max	tag
0.000	0.000	0.000	46.583	53.335	0.082	0.000	0.000	0.000	0.000	0.094	my8039_rel_o2nofp.cz11a_nocb_c32r128
0.000	0.000	82.588	17.413	0.000	0.000	0.000	0.000	0.000	0.000	0.013	my8039_rel_o2nofp.cz11a_c32r128
0.000	0.000	0.000	0.335	90.314	9.286	0.065	0.000	0.000	0.000	0.336	ma101109_rel_withdbg.cz11a_c32r128
0.000	0.000	0.000	0.369	90.604	8.872	0.154	0.000	0.000	0.000	0.437	ma110403_rel_withdbg.cz11b_c32r128
qr500.L3
- qr500.L3: range queries with 500 insert/s per client
- Legend for results is here.
- Each entry lists the percentage of responses that fit in that bucket (slower than max time for previous bucket, faster than min time for next bucket).
Query response time histogram
256us	1ms	4ms	16ms	64ms	256ms	1s	4s	16s	gt	max	tag
99.022	0.958	0.018	0.003	nonzero	0.000	0.000	0.000	0.000	0.000	0.027	my8039_rel_o2nofp.cz11a_nocb_c32r128
99.284	0.687	0.027	0.002	nonzero	0.000	0.000	0.000	0.000	0.000	0.031	my8039_rel_o2nofp.cz11a_c32r128
93.258	5.400	1.117	0.158	0.060	0.006	0.001	0.000	0.000	0.000	0.385	ma101109_rel_withdbg.cz11a_c32r128
92.517	5.871	1.189	0.269	0.145	0.008	nonzero	0.000	0.000	0.000	0.410	ma110403_rel_withdbg.cz11b_c32r128
Insert response time histogram
256us	1ms	4ms	16ms	64ms	256ms	1s	4s	16s	gt	max	tag
0.000	0.000	0.000	12.625	86.725	0.650	0.000	0.000	0.000	0.000	0.109	my8039_rel_o2nofp.cz11a_nocb_c32r128
0.000	0.000	0.000	16.750	82.219	1.031	0.000	0.000	0.000	0.000	0.117	my8039_rel_o2nofp.cz11a_c32r128
0.000	0.000	0.000	6.011	51.984	25.444	16.561	0.000	0.000	0.000	0.979	ma101109_rel_withdbg.cz11a_c32r128
0.000	0.000	0.000	7.521	44.047	35.467	12.964	0.000	0.000	0.000	0.973	ma110403_rel_withdbg.cz11b_c32r128
Delete response time histogram
256us	1ms	4ms	16ms	64ms	256ms	1s	4s	16s	gt	max	tag
0.000	0.000	0.000	27.210	72.782	0.008	0.000	0.000	0.000	0.000	0.084	my8039_rel_o2nofp.cz11a_nocb_c32r128
0.000	0.000	42.736	56.812	0.452	0.000	0.000	0.000	0.000	0.000	0.049	my8039_rel_o2nofp.cz11a_c32r128
0.000	0.000	0.000	24.117	39.489	22.092	14.301	0.000	0.000	0.000	0.949	ma101109_rel_withdbg.cz11a_c32r128
0.000	0.000	0.000	17.323	39.464	31.558	11.654	0.000	0.000	0.000	0.970	ma110403_rel_withdbg.cz11b_c32r128
qp500.L4
- qp500.L4: point queries with 500 insert/s per client
- Legend for results is here.
- Each entry lists the percentage of responses that fit in that bucket (slower than max time for previous bucket, faster than min time for next bucket).
Query response time histogram
256us	1ms	4ms	16ms	64ms	256ms	1s	4s	16s	gt	max	tag
0.000	2.020	71.347	26.575	0.058	0.000	0.000	0.000	0.000	0.000	0.038	my8039_rel_o2nofp.cz11a_nocb_c32r128
nonzero	7.351	83.312	9.326	0.011	0.000	0.000	0.000	0.000	0.000	0.026	my8039_rel_o2nofp.cz11a_c32r128
nonzero	8.197	77.844	11.671	2.276	0.008	0.004	0.000	0.000	0.000	0.350	ma101109_rel_withdbg.cz11a_c32r128
nonzero	8.275	75.885	13.488	2.335	0.011	0.005	0.000	0.000	0.000	0.364	ma110403_rel_withdbg.cz11b_c32r128
Insert response time histogram
256us	1ms	4ms	16ms	64ms	256ms	1s	4s	16s	gt	max	tag
0.000	0.000	0.000	0.481	84.641	14.878	0.000	0.000	0.000	0.000	0.156	my8039_rel_o2nofp.cz11a_nocb_c32r128
0.000	0.000	0.000	12.871	86.998	0.131	0.000	0.000	0.000	0.000	0.135	my8039_rel_o2nofp.cz11a_c32r128
0.000	0.000	0.000	0.004	11.724	20.341	67.931	0.000	0.000	0.000	0.793	ma101109_rel_withdbg.cz11a_c32r128
0.000	0.000	0.000	0.017	14.397	21.066	64.520	0.000	0.000	0.000	0.872	ma110403_rel_withdbg.cz11b_c32r128
Delete response time histogram
256us	1ms	4ms	16ms	64ms	256ms	1s	4s	16s	gt	max	tag
0.000	0.000	0.000	1.305	97.689	1.007	0.000	0.000	0.000	0.000	0.109	my8039_rel_o2nofp.cz11a_nocb_c32r128
0.000	0.000	28.848	70.028	1.124	0.000	0.000	0.000	0.000	0.000	0.050	my8039_rel_o2nofp.cz11a_c32r128
0.000	0.000	0.000	0.049	12.999	25.152	61.800	0.000	0.000	0.000	0.718	ma101109_rel_withdbg.cz11a_c32r128
0.000	0.000	0.000	0.053	15.607	22.188	62.152	0.000	0.000	0.000	0.728	ma110403_rel_withdbg.cz11b_c32r128
qr1000.L5
- qr1000.L5: range queries with 1000 insert/s per client
- Legend for results is here.
- Each entry lists the percentage of responses that fit in that bucket (slower than max time for previous bucket, faster than min time for next bucket).
Query response time histogram
256us	1ms	4ms	16ms	64ms	256ms	1s	4s	16s	gt	max	tag
90.487	8.172	1.329	0.011	0.001	0.000	0.000	0.000	0.000	0.000	0.062	my8039_rel_o2nofp.cz11a_nocb_c32r128
95.984	3.116	0.887	0.013	nonzero	0.000	0.000	0.000	0.000	0.000	0.029	my8039_rel_o2nofp.cz11a_c32r128
92.743	5.583	1.432	0.218	0.022	0.002	nonzero	0.000	0.000	0.000	0.357	ma101109_rel_withdbg.cz11a_c32r128
92.534	5.753	1.343	0.310	0.058	0.002	nonzero	0.000	0.000	0.000	0.365	ma110403_rel_withdbg.cz11b_c32r128
Insert response time histogram
256us	1ms	4ms	16ms	64ms	256ms	1s	4s	16s	gt	max	tag
0.000	0.000	0.000	0.220	80.267	19.512	nonzero	0.000	0.000	0.000	0.273	my8039_rel_o2nofp.cz11a_nocb_c32r128
0.000	0.000	nonzero	35.224	64.740	0.036	0.000	0.000	0.000	0.000	0.099	my8039_rel_o2nofp.cz11a_c32r128
0.000	0.000	0.000	0.893	16.800	55.613	26.694	0.000	0.000	0.000	0.949	ma101109_rel_withdbg.cz11a_c32r128
0.000	0.000	0.000	1.339	17.440	54.362	26.859	0.000	0.000	0.000	0.847	ma110403_rel_withdbg.cz11b_c32r128
Delete response time histogram
256us	1ms	4ms	16ms	64ms	256ms	1s	4s	16s	gt	max	tag
0.000	0.000	0.000	0.428	83.632	15.940	0.000	0.000	0.000	0.000	0.181	my8039_rel_o2nofp.cz11a_nocb_c32r128
0.000	0.000	27.508	69.473	3.019	0.000	0.000	0.000	0.000	0.000	0.053	my8039_rel_o2nofp.cz11a_c32r128
0.000	0.000	0.000	10.273	16.492	48.571	24.664	0.000	0.000	0.000	0.919	ma101109_rel_withdbg.cz11a_c32r128
0.000	0.000	0.000	7.570	17.881	48.543	26.006	0.000	0.000	0.000	0.841	ma110403_rel_withdbg.cz11b_c32r128
qp1000.L6
- qp1000.L6: point queries with 1000 insert/s per client
- Legend for results is here.
- Each entry lists the percentage of responses that fit in that bucket (slower than max time for previous bucket, faster than min time for next bucket).
Query response time histogram
256us	1ms	4ms	16ms	64ms	256ms	1s	4s	16s	gt	max	tag
nonzero	1.352	81.136	17.509	0.003	0.000	0.000	0.000	0.000	0.000	0.037	my8039_rel_o2nofp.cz11a_nocb_c32r128
nonzero	4.860	85.374	9.750	0.015	0.000	0.000	0.000	0.000	0.000	0.061	my8039_rel_o2nofp.cz11a_c32r128
nonzero	6.758	73.157	15.276	4.777	0.031	0.003	0.000	0.000	0.000	0.348	ma101109_rel_withdbg.cz11a_c32r128
nonzero	7.569	72.449	16.155	3.794	0.029	0.004	0.000	0.000	0.000	0.365	ma110403_rel_withdbg.cz11b_c32r128
Insert response time histogram
256us	1ms	4ms	16ms	64ms	256ms	1s	4s	16s	gt	max	tag
0.000	0.000	0.000	0.000	0.000	100.000	0.000	0.000	0.000	0.000	0.241	my8039_rel_o2nofp.cz11a_nocb_c32r128
0.000	0.000	nonzero	7.312	29.467	63.220	0.001	0.000	0.000	0.000	0.265	my8039_rel_o2nofp.cz11a_c32r128
0.000	0.000	0.000	0.017	18.919	26.387	54.677	0.000	0.000	0.000	0.814	ma101109_rel_withdbg.cz11a_c32r128
0.000	0.000	0.000	0.010	18.284	26.764	54.942	0.000	0.000	0.000	0.796	ma110403_rel_withdbg.cz11b_c32r128
Delete response time histogram
256us	1ms	4ms	16ms	64ms	256ms	1s	4s	16s	gt	max	tag
0.000	0.000	0.000	0.000	0.000	100.000	0.000	0.000	0.000	0.000	0.231	my8039_rel_o2nofp.cz11a_nocb_c32r128
0.000	0.000	2.437	19.883	21.146	56.534	0.000	0.000	0.000	0.000	0.254	my8039_rel_o2nofp.cz11a_c32r128
0.000	0.000	0.000	0.080	20.470	31.576	47.875	0.000	0.000	0.000	0.806	ma101109_rel_withdbg.cz11a_c32r128
0.000	0.000	0.000	0.044	19.524	27.865	52.567	0.000	0.000	0.000	0.751	ma110403_rel_withdbg.cz11b_c32r128