Introduction
This is a report for the insert benchmark with 200M docs and 20 client(s). It is generated by scripts (bash, awk, sed) and Tufte might not be impressed. An overview of the insert benchmark is here and a short update is here. Below, by DBMS, I mean DBMS+version.config. An example is my8020.c10b40 where my means MySQL, 8020 is version 8.0.20 and c10b40 is the name for the configuration file.
The test server is an ax162-s from Hetzner (see here) with 48 cores, AMD SMT disabled, 128G RAM and ext4 using 2 NVMe devices with SW RAID 1. The benchmark was run with 20 clients and there were 1 or 3 connections per client (1 for queries or inserts without rate limits, 1+1 for rate limited inserts+deletes). It uses 8 tables with a table per client. It loads 10M rows per table without secondary indexes, creates 3 secondary indexes per table, then inserts 16m+4m rows per table with a delete per insert to avoid growing the table. It then does 6 read+write tests for 1800s each that do queries as fast as possible with 100,100,500,500,1000,1000 inserts/s and the same for deletes/s per client concurrent with the queries. The database is cached in memory. Clients and the DBMS share one server.
The tested DBMS are:
- my5651_rel_o2nofp.cz11a_c32r128 - MySQL 5.6.51 compilred with CMAKE_BUILD_TYPE=Release, -O2 and frame pointers using the z11a_c32r128 config
- my5744_rel_o2nofp.cz11a_c32r128 - MySQL 5.7.44 compilred with CMAKE_BUILD_TYPE=Release, -O2 and frame pointers using the z11a_c32r128 config
- my8039_rel_o2nofp.cz11a_c32r128 - MySQL 8.0.39 compilred with CMAKE_BUILD_TYPE=Release, -O2 and frame pointers using the z11a_c32r128 config
- pg158_o2nofp.cx9a2a_c32r128 - Postgres 15.8 compiled with -O2 and frame pointers using the x9a2a_c32r128 config
- pg164_o2nofp.cx9a2a_c32r128 - Postgres 16.4 compiled with -O2 and frame pointers using the x9a2a_c32r128 config
- pg17beta3_o2nofp.cx9a2a_c32r128 - Postgres 17 beta3 compiled with -O2 and frame pointers using the x9a2a_c32r128 config
- pg17rc1_o2nofp.cx9a2a_c32r128 - Postgres 17 rc1 compiled with -O2 and frame pointers using the x9a2a_c32r128 config
Contents
- Summary
- l.i0: load without secondary indexes
- l.x: create secondary indexes
- l.i1: continue load after secondary indexes created with 50 inserts per transaction
- l.i2: continue load after secondary indexes created with 5 inserts per transaction
- qr100.L1: range queries with 100 insert/s per client
- qp100.L2: point queries with 100 insert/s per client
- qr500.L3: range queries with 500 insert/s per client
- qp500.L4: point queries with 500 insert/s per client
- qr1000.L5: range queries with 1000 insert/s per client
- qp1000.L6: point queries with 1000 insert/s per client
Summary
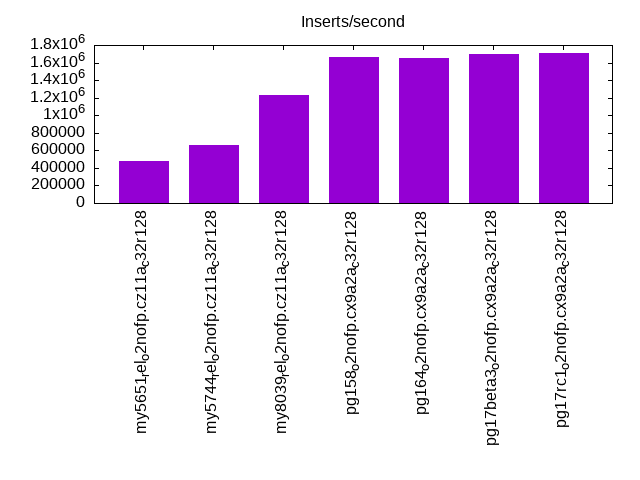
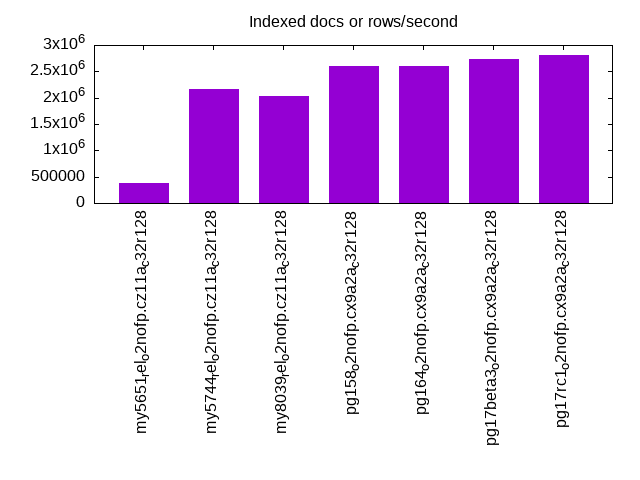
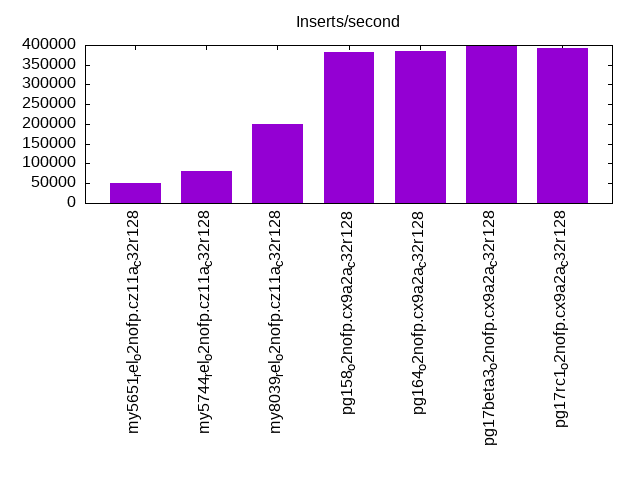
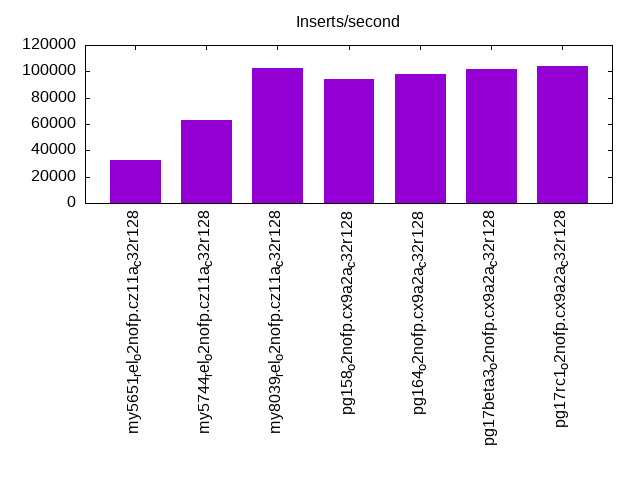
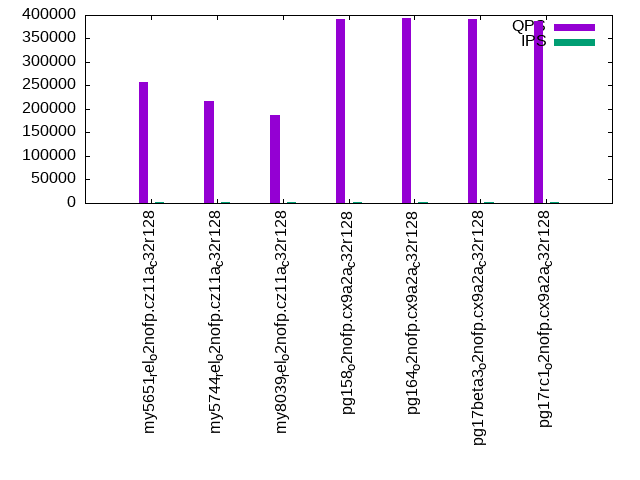
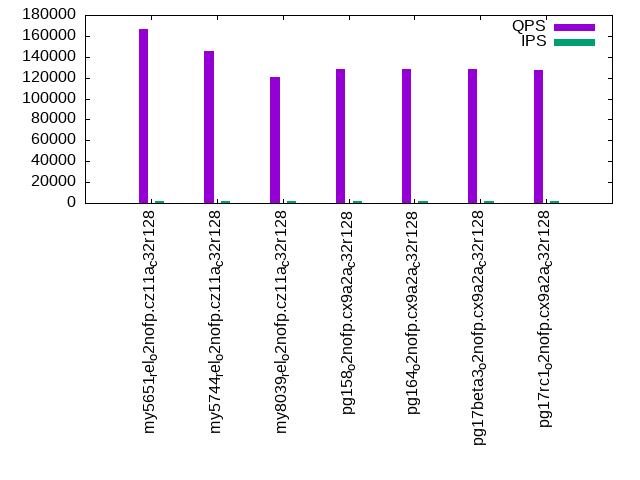
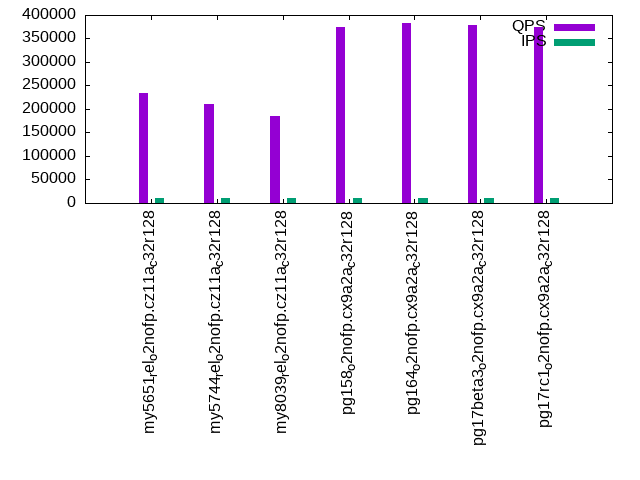
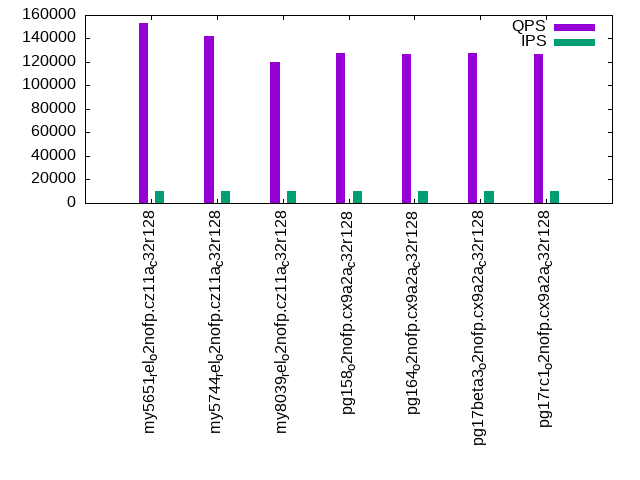
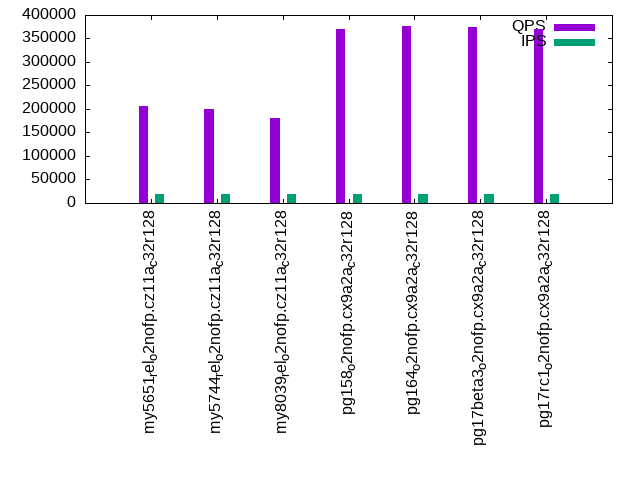
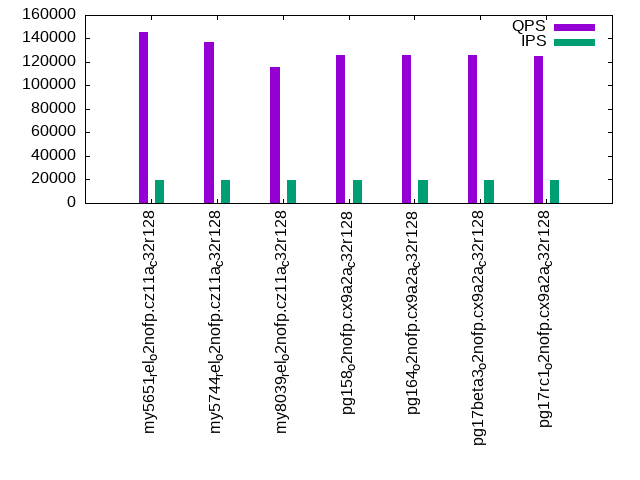
The numbers are inserts/s for l.i0, l.i1 and l.i2, indexed docs (or rows) /s for l.x and queries/s for qr100, qp100 thru qr1000, qp1000" The values are the average rate over the entire test for inserts (IPS) and queries (QPS). The range of values for IPS and QPS is split into 3 parts: bottom 25%, middle 50%, top 25%. Values in the bottom 25% have a red background, values in the top 25% have a green background and values in the middle have no color. A gray background is used for values that can be ignored because the DBMS did not sustain the target insert rate. Red backgrounds are not used when the minimum value is within 80% of the max value.
| dbms | l.i0 | l.x | l.i1 | l.i2 | qr100 | qp100 | qr500 | qp500 | qr1000 | qp1000 |
|---|---|---|---|---|---|---|---|---|---|---|
| my5651_rel_o2nofp.cz11a_c32r128 | 473934 | 386847 | 49836 | 33030 | 257731 | 166449 | 233378 | 153295 | 205653 | 145602 |
| my5744_rel_o2nofp.cz11a_c32r128 | 657895 | 2173914 | 80020 | 62745 | 216775 | 145365 | 210753 | 142159 | 200906 | 137255 |
| my8039_rel_o2nofp.cz11a_c32r128 | 1234568 | 2040817 | 199253 | 102564 | 186950 | 121020 | 184358 | 119707 | 180044 | 115866 |
| pg158_o2nofp.cx9a2a_c32r128 | 1666667 | 2597404 | 383234 | 94007 | 390692 | 128510 | 375186 | 127739 | 370418 | 126017 |
| pg164_o2nofp.cx9a2a_c32r128 | 1652892 | 2597404 | 384615 | 98280 | 392699 | 128251 | 383376 | 127213 | 377223 | 125792 |
| pg17beta3_o2nofp.cx9a2a_c32r128 | 1694915 | 2739727 | 397022 | 101652 | 392546 | 128510 | 378062 | 127254 | 375401 | 125869 |
| pg17rc1_o2nofp.cx9a2a_c32r128 | 1709402 | 2816903 | 393120 | 104167 | 387796 | 127752 | 374957 | 126889 | 370957 | 125252 |
This table has relative throughput, throughput for the DBMS relative to the DBMS in the first line, using the absolute throughput from the previous table. Values less than 0.95 have a yellow background. Values greater than 1.05 have a blue background.
| dbms | l.i0 | l.x | l.i1 | l.i2 | qr100 | qp100 | qr500 | qp500 | qr1000 | qp1000 |
|---|---|---|---|---|---|---|---|---|---|---|
| my5651_rel_o2nofp.cz11a_c32r128 | 1.00 | 1.00 | 1.00 | 1.00 | 1.00 | 1.00 | 1.00 | 1.00 | 1.00 | 1.00 |
| my5744_rel_o2nofp.cz11a_c32r128 | 1.39 | 5.62 | 1.61 | 1.90 | 0.84 | 0.87 | 0.90 | 0.93 | 0.98 | 0.94 |
| my8039_rel_o2nofp.cz11a_c32r128 | 2.60 | 5.28 | 4.00 | 3.11 | 0.73 | 0.73 | 0.79 | 0.78 | 0.88 | 0.80 |
| pg158_o2nofp.cx9a2a_c32r128 | 3.52 | 6.71 | 7.69 | 2.85 | 1.52 | 0.77 | 1.61 | 0.83 | 1.80 | 0.87 |
| pg164_o2nofp.cx9a2a_c32r128 | 3.49 | 6.71 | 7.72 | 2.98 | 1.52 | 0.77 | 1.64 | 0.83 | 1.83 | 0.86 |
| pg17beta3_o2nofp.cx9a2a_c32r128 | 3.58 | 7.08 | 7.97 | 3.08 | 1.52 | 0.77 | 1.62 | 0.83 | 1.83 | 0.86 |
| pg17rc1_o2nofp.cx9a2a_c32r128 | 3.61 | 7.28 | 7.89 | 3.15 | 1.50 | 0.77 | 1.61 | 0.83 | 1.80 | 0.86 |
This lists the average rate of inserts/s for the tests that do inserts concurrent with queries. For such tests the query rate is listed in the table above. The read+write tests are setup so that the insert rate should match the target rate every second. Cells that are not at least 95% of the target have a red background to indicate a failure to satisfy the target.
| dbms | qr100.L1 | qp100.L2 | qr500.L3 | qp500.L4 | qr1000.L5 | qp1000.L6 |
|---|---|---|---|---|---|---|
| my5651_rel_o2nofp.cz11a_c32r128 | 1977 | 1977 | 9885 | 9879 | 19780 | 19769 |
| my5744_rel_o2nofp.cz11a_c32r128 | 1977 | 1977 | 9879 | 9885 | 19769 | 19769 |
| my8039_rel_o2nofp.cz11a_c32r128 | 1977 | 1978 | 9885 | 9879 | 19769 | 19769 |
| pg158_o2nofp.cx9a2a_c32r128 | 1977 | 1977 | 9885 | 9885 | 19758 | 19769 |
| pg164_o2nofp.cx9a2a_c32r128 | 1977 | 1977 | 9885 | 9885 | 19758 | 19769 |
| pg17beta3_o2nofp.cx9a2a_c32r128 | 1978 | 1977 | 9885 | 9885 | 19758 | 19769 |
| pg17rc1_o2nofp.cx9a2a_c32r128 | 1977 | 1977 | 9885 | 9885 | 19758 | 19769 |
| target | 2000 | 2000 | 10000 | 10000 | 20000 | 20000 |
l.i0
l.i0: load without secondary indexes. Graphs for performance per 1-second interval are here.
Average throughput:
Insert response time histogram: each cell has the percentage of responses that take <= the time in the header and max is the max response time in seconds. For the max column values in the top 25% of the range have a red background and in the bottom 25% of the range have a green background. The red background is not used when the min value is within 80% of the max value.
| dbms | 256us | 1ms | 4ms | 16ms | 64ms | 256ms | 1s | 4s | 16s | gt | max |
|---|---|---|---|---|---|---|---|---|---|---|---|
| my5651_rel_o2nofp.cz11a_c32r128 | 2.824 | 56.656 | 40.134 | 0.352 | 0.034 | 0.174 | |||||
| my5744_rel_o2nofp.cz11a_c32r128 | 2.431 | 97.366 | 0.160 | 0.009 | 0.034 | 0.170 | |||||
| my8039_rel_o2nofp.cz11a_c32r128 | 1.706 | 98.226 | 0.021 | 0.012 | 0.035 | 0.203 | |||||
| pg158_o2nofp.cx9a2a_c32r128 | 92.282 | 7.675 | 0.021 | 0.004 | 0.010 | 0.007 | 0.648 | ||||
| pg164_o2nofp.cx9a2a_c32r128 | 92.427 | 7.527 | 0.027 | 0.004 | 0.007 | 0.008 | 0.741 | ||||
| pg17beta3_o2nofp.cx9a2a_c32r128 | 92.966 | 6.986 | 0.025 | 0.006 | 0.008 | 0.009 | 0.489 | ||||
| pg17rc1_o2nofp.cx9a2a_c32r128 | 93.049 | 6.901 | 0.030 | 0.007 | 0.010 | 0.004 | 0.539 |
Performance metrics for the DBMS listed above. Some are normalized by throughput, others are not. Legend for results is here.
ips	qps	rps	rmbps	wps	wmbps	rpq	rkbpq	wpi	wkbpi	csps	cpups	cspq	cpupq	dbgb1	dbgb2	rss	maxop	p50	p99	tag
473934	0	0	0.0	1721.8	130.8	0.000	0.000	0.004	0.283	72579	40.8	0.153	41	13.3	113.8	20.0	0.174	23774	20078	my5651_rel_o2nofp.cz11a_c32r128
657895	0	0	0.0	2742.7	188.4	0.000	0.000	0.004	0.293	74331	42.3	0.113	31	13.3	113.8	21.2	0.170	34563	28869	my5744_rel_o2nofp.cz11a_c32r128
1234568	0	0	0.0	4726.6	360.8	0.000	0.000	0.004	0.299	244411	47.1	0.198	18	13.3	113.9	20.8	0.203	75619	62932	my8039_rel_o2nofp.cz11a_c32r128
1666667	0	1	0.0	6631.3	698.9	0.000	0.000	0.004	0.429	254940	46.0	0.153	13	19.1	51.7	1.9	0.648	110482	30967	pg158_o2nofp.cx9a2a_c32r128
1652892	0	2	0.0	6655.7	704.0	0.000	0.000	0.004	0.436	260915	45.6	0.158	13	19.1	51.7	1.9	0.741	111712	44751	pg164_o2nofp.cx9a2a_c32r128
1694915	0	3	0.0	6699.9	706.9	0.000	0.000	0.004	0.427	265066	45.3	0.156	13	19.1	51.7	1.4	0.489	112778	47449	pg17beta3_o2nofp.cx9a2a_c32r128
1709402	0	0	0.0	6770.0	718.3	0.000	0.000	0.004	0.430	274194	46.8	0.160	13	19.1	51.7	12.2	0.539	112979	49047	pg17rc1_o2nofp.cx9a2a_c32r128
l.x
l.x: create secondary indexes.
Average throughput:
Performance metrics for the DBMS listed above. Some are normalized by throughput, others are not. Legend for results is here.
ips	qps	rps	rmbps	wps	wmbps	rpq	rkbpq	wpi	wkbpi	csps	cpups	cspq	cpupq	dbgb1	dbgb2	rss	maxop	p50	p99	tag
386847	0	0	0.0	19971.2	671.7	0.000	0.000	0.052	1.778	85204	39.8	0.220	49	27.9	128.4	34.7	0.001	NA	NA	my5651_rel_o2nofp.cz11a_c32r128
2173914	0	1	0.0	35495.5	1830.2	0.000	0.000	0.016	0.862	194707	35.7	0.090	8	30.4	130.9	36.6	0.002	NA	NA	my5744_rel_o2nofp.cz11a_c32r128
2040817	0	14851	639.1	55978.1	2116.4	0.007	0.321	0.027	1.062	177713	70.0	0.087	16	30.3	130.9	29.2	0.010	NA	NA	my8039_rel_o2nofp.cz11a_c32r128
2597404	0	0	0.0	6280.5	724.0	0.000	0.000	0.002	0.285	105828	17.8	0.041	3	38.4	88.6	6.9	0.045	NA	NA	pg158_o2nofp.cx9a2a_c32r128
2597404	0	0	0.0	6171.7	713.0	0.000	0.000	0.002	0.281	105324	17.9	0.041	3	38.4	88.6	6.3	0.044	NA	NA	pg164_o2nofp.cx9a2a_c32r128
2739727	0	1	0.0	6884.0	797.9	0.000	0.000	0.003	0.298	40487	17.1	0.015	3	38.4	88.5	6.4	0.044	NA	NA	pg17beta3_o2nofp.cx9a2a_c32r128
2816903	0	0	0.0	7336.8	855.7	0.000	0.000	0.003	0.311	42161	17.9	0.015	3	38.4	88.5	6.4	0.036	NA	NA	pg17rc1_o2nofp.cx9a2a_c32r128
l.i1
l.i1: continue load after secondary indexes created with 50 inserts per transaction. Graphs for performance per 1-second interval are here.
Average throughput:
Insert response time histogram: each cell has the percentage of responses that take <= the time in the header and max is the max response time in seconds. For the max column values in the top 25% of the range have a red background and in the bottom 25% of the range have a green background. The red background is not used when the min value is within 80% of the max value.
| dbms | 256us | 1ms | 4ms | 16ms | 64ms | 256ms | 1s | 4s | 16s | gt | max |
|---|---|---|---|---|---|---|---|---|---|---|---|
| my5651_rel_o2nofp.cz11a_c32r128 | 0.002 | 0.318 | 24.045 | 74.833 | 0.118 | 0.684 | 0.485 | ||||
| my5744_rel_o2nofp.cz11a_c32r128 | 0.151 | 98.134 | 0.718 | 0.308 | 0.688 | 0.309 | |||||
| my8039_rel_o2nofp.cz11a_c32r128 | 65.028 | 34.609 | 0.305 | 0.057 | nonzero | 0.321 | |||||
| pg158_o2nofp.cx9a2a_c32r128 | 1.481 | 91.183 | 6.776 | 0.554 | 0.006 | nonzero | 0.457 | ||||
| pg164_o2nofp.cx9a2a_c32r128 | 1.463 | 90.793 | 7.211 | 0.526 | 0.007 | 0.144 | |||||
| pg17beta3_o2nofp.cx9a2a_c32r128 | 1.512 | 90.550 | 7.418 | 0.516 | 0.004 | 0.001 | 0.435 | ||||
| pg17rc1_o2nofp.cx9a2a_c32r128 | 1.711 | 90.375 | 7.379 | 0.530 | 0.005 | 0.001 | 0.696 |
Delete response time histogram: each cell has the percentage of responses that take <= the time in the header and max is the max response time in seconds. For the max column values in the top 25% of the range have a red background and in the bottom 25% of the range have a green background. The red background is not used when the min value is within 80% of the max value.
| dbms | 256us | 1ms | 4ms | 16ms | 64ms | 256ms | 1s | 4s | 16s | gt | max |
|---|---|---|---|---|---|---|---|---|---|---|---|
| my5651_rel_o2nofp.cz11a_c32r128 | 0.005 | 0.552 | 35.507 | 63.141 | 0.112 | 0.683 | 0.461 | ||||
| my5744_rel_o2nofp.cz11a_c32r128 | 0.001 | 0.350 | 97.725 | 0.931 | 0.395 | 0.598 | 0.309 | ||||
| my8039_rel_o2nofp.cz11a_c32r128 | nonzero | 67.917 | 31.686 | 0.317 | 0.080 | nonzero | 0.311 | ||||
| pg158_o2nofp.cx9a2a_c32r128 | 17.343 | 79.280 | 3.103 | 0.270 | 0.004 | 0.236 | |||||
| pg164_o2nofp.cx9a2a_c32r128 | 17.560 | 79.204 | 3.000 | 0.233 | 0.003 | 0.145 | |||||
| pg17beta3_o2nofp.cx9a2a_c32r128 | 22.012 | 74.851 | 2.899 | 0.235 | 0.003 | nonzero | 0.432 | ||||
| pg17rc1_o2nofp.cx9a2a_c32r128 | 21.586 | 75.302 | 2.879 | 0.229 | 0.003 | nonzero | 0.692 |
Performance metrics for the DBMS listed above. Some are normalized by throughput, others are not. Legend for results is here.
ips	qps	rps	rmbps	wps	wmbps	rpq	rkbpq	wpi	wkbpi	csps	cpups	cspq	cpupq	dbgb1	dbgb2	rss	maxop	p50	p99	tag
49836	0	1046	4.1	3490.5	127.1	0.021	0.084	0.070	2.611	261389	65.8	5.245	634	46.4	148.4	52.8	0.485	2598	150	my5651_rel_o2nofp.cz11a_c32r128
80020	0	0	0.0	5275.3	195.3	0.000	0.000	0.066	2.499	86600	73.4	1.082	440	47.6	149.6	55.3	0.309	4895	150	my5744_rel_o2nofp.cz11a_c32r128
199253	0	601	9.4	11848.3	498.3	0.003	0.048	0.059	2.561	370334	49.2	1.859	119	48.9	151.4	65.3	0.321	11587	3296	my8039_rel_o2nofp.cz11a_c32r128
383234	0	932	5.5	6402.0	594.5	0.002	0.015	0.017	1.588	263431	54.8	0.687	69	56.4	152.4	42.5	0.457	22109	3946	pg158_o2nofp.cx9a2a_c32r128
384615	0	704	3.2	6213.6	589.1	0.002	0.009	0.016	1.568	270915	54.9	0.704	69	56.0	152.0	49.8	0.144	22076	3796	pg164_o2nofp.cx9a2a_c32r128
397022	0	644	2.9	6517.7	622.2	0.002	0.008	0.016	1.605	255362	53.6	0.643	65	56.0	152.0	38.7	0.435	22925	3246	pg17beta3_o2nofp.cx9a2a_c32r128
393120	0	631	2.9	6440.2	612.9	0.002	0.008	0.016	1.597	259091	53.0	0.659	65	56.1	152.1	8.7	0.696	22833	3346	pg17rc1_o2nofp.cx9a2a_c32r128
l.i2
l.i2: continue load after secondary indexes created with 5 inserts per transaction. Graphs for performance per 1-second interval are here.
Average throughput:
Insert response time histogram: each cell has the percentage of responses that take <= the time in the header and max is the max response time in seconds. For the max column values in the top 25% of the range have a red background and in the bottom 25% of the range have a green background. The red background is not used when the min value is within 80% of the max value.
| dbms | 256us | 1ms | 4ms | 16ms | 64ms | 256ms | 1s | 4s | 16s | gt | max |
|---|---|---|---|---|---|---|---|---|---|---|---|
| my5651_rel_o2nofp.cz11a_c32r128 | 0.014 | 2.069 | 86.750 | 10.239 | 0.927 | 0.001 | 0.092 | ||||
| my5744_rel_o2nofp.cz11a_c32r128 | 0.049 | 42.110 | 55.760 | 1.629 | 0.446 | 0.007 | 0.163 | ||||
| my8039_rel_o2nofp.cz11a_c32r128 | 0.064 | 78.666 | 19.292 | 1.966 | 0.003 | 0.008 | 0.194 | ||||
| pg158_o2nofp.cx9a2a_c32r128 | 86.515 | 12.707 | 0.759 | 0.018 | nonzero | 0.032 | |||||
| pg164_o2nofp.cx9a2a_c32r128 | 86.882 | 12.298 | 0.800 | 0.019 | nonzero | nonzero | 0.072 | ||||
| pg17beta3_o2nofp.cx9a2a_c32r128 | 89.994 | 9.644 | 0.345 | 0.017 | nonzero | 0.060 | |||||
| pg17rc1_o2nofp.cx9a2a_c32r128 | 90.301 | 9.346 | 0.340 | 0.013 | nonzero | nonzero | 0.064 |
Delete response time histogram: each cell has the percentage of responses that take <= the time in the header and max is the max response time in seconds. For the max column values in the top 25% of the range have a red background and in the bottom 25% of the range have a green background. The red background is not used when the min value is within 80% of the max value.
| dbms | 256us | 1ms | 4ms | 16ms | 64ms | 256ms | 1s | 4s | 16s | gt | max |
|---|---|---|---|---|---|---|---|---|---|---|---|
| my5651_rel_o2nofp.cz11a_c32r128 | 0.016 | 2.462 | 86.728 | 9.868 | 0.925 | 0.001 | 0.093 | ||||
| my5744_rel_o2nofp.cz11a_c32r128 | 0.044 | 25.552 | 71.722 | 2.229 | 0.446 | 0.007 | 0.162 | ||||
| my8039_rel_o2nofp.cz11a_c32r128 | 0.057 | 78.865 | 19.118 | 1.948 | 0.003 | 0.008 | 0.185 | ||||
| pg158_o2nofp.cx9a2a_c32r128 | 2.689 | 47.820 | 49.470 | 0.021 | nonzero | 0.026 | |||||
| pg164_o2nofp.cx9a2a_c32r128 | 2.912 | 47.843 | 49.218 | 0.026 | 0.001 | nonzero | 0.073 | ||||
| pg17beta3_o2nofp.cx9a2a_c32r128 | 3.694 | 58.911 | 37.332 | 0.063 | 0.001 | 0.061 | |||||
| pg17rc1_o2nofp.cx9a2a_c32r128 | 3.545 | 57.307 | 39.092 | 0.055 | 0.001 | nonzero | 0.064 |
Performance metrics for the DBMS listed above. Some are normalized by throughput, others are not. Legend for results is here.
ips	qps	rps	rmbps	wps	wmbps	rpq	rkbpq	wpi	wkbpi	csps	cpups	cspq	cpupq	dbgb1	dbgb2	rss	maxop	p50	p99	tag
33030	0	4148	16.2	3556.7	130.4	0.126	0.502	0.108	4.043	424241	52.8	12.844	767	46.4	148.4	53.3	0.092	1763	165	my5651_rel_o2nofp.cz11a_c32r128
62745	0	0	0.0	5998.2	229.3	0.000	0.000	0.096	3.742	305780	54.9	4.873	420	47.6	149.6	55.8	0.163	3401	180	my5744_rel_o2nofp.cz11a_c32r128
102564	0	0	0.0	9836.8	407.7	0.000	0.000	0.096	4.071	627582	52.1	6.119	244	48.9	150.1	65.4	0.194	5749	830	my8039_rel_o2nofp.cz11a_c32r128
94007	0	0	0.0	1418.9	135.4	0.000	0.000	0.015	1.475	383097	52.7	4.075	269	56.6	152.7	8.9	0.032	4001	3018	pg158_o2nofp.cx9a2a_c32r128
98280	0	0	0.0	1482.5	142.0	0.000	0.000	0.015	1.480	400824	54.4	4.078	266	56.2	152.3	6.3	0.072	4466	3311	pg164_o2nofp.cx9a2a_c32r128
101652	0	1	0.0	1496.9	143.1	0.000	0.000	0.015	1.442	385029	52.4	3.788	247	56.2	152.3	17.1	0.060	4800	3256	pg17beta3_o2nofp.cx9a2a_c32r128
104167	0	1	0.0	1559.2	147.9	0.000	0.000	0.015	1.454	392508	54.1	3.768	249	56.3	152.4	16.3	0.064	4483	3323	pg17rc1_o2nofp.cx9a2a_c32r128
qr100.L1
qr100.L1: range queries with 100 insert/s per client. Graphs for performance per 1-second interval are here.
Average throughput:
Query response time histogram: each cell has the percentage of responses that take <= the time in the header and max is the max response time in seconds. For max values in the top 25% of the range have a red background and in the bottom 25% of the range have a green background. The red background is not used when the min value is within 80% of the max value.
| dbms | 256us | 1ms | 4ms | 16ms | 64ms | 256ms | 1s | 4s | 16s | gt | max |
|---|---|---|---|---|---|---|---|---|---|---|---|
| my5651_rel_o2nofp.cz11a_c32r128 | 99.957 | 0.037 | 0.005 | nonzero | nonzero | 0.021 | |||||
| my5744_rel_o2nofp.cz11a_c32r128 | 99.991 | 0.007 | 0.002 | nonzero | nonzero | 0.019 | |||||
| my8039_rel_o2nofp.cz11a_c32r128 | 99.983 | 0.015 | 0.002 | nonzero | 0.016 | ||||||
| pg158_o2nofp.cx9a2a_c32r128 | 99.997 | 0.002 | 0.001 | nonzero | nonzero | 0.017 | |||||
| pg164_o2nofp.cx9a2a_c32r128 | 99.997 | 0.002 | 0.001 | nonzero | 0.010 | ||||||
| pg17beta3_o2nofp.cx9a2a_c32r128 | 99.997 | 0.002 | 0.001 | nonzero | nonzero | 0.028 | |||||
| pg17rc1_o2nofp.cx9a2a_c32r128 | 99.996 | 0.002 | 0.001 | nonzero | 0.012 |
Insert response time histogram: each cell has the percentage of responses that take <= the time in the header and max is the max response time in seconds. For max values in the top 25% of the range have a red background and in the bottom 25% of the range have a green background. The red background is not used when the min value is within 80% of the max value.
| dbms | 256us | 1ms | 4ms | 16ms | 64ms | 256ms | 1s | 4s | 16s | gt | max |
|---|---|---|---|---|---|---|---|---|---|---|---|
| my5651_rel_o2nofp.cz11a_c32r128 | 42.160 | 56.356 | 1.485 | 0.032 | |||||||
| my5744_rel_o2nofp.cz11a_c32r128 | 98.861 | 1.139 | 0.012 | ||||||||
| my8039_rel_o2nofp.cz11a_c32r128 | 96.807 | 3.181 | 0.013 | 0.017 | |||||||
| pg158_o2nofp.cx9a2a_c32r128 | 99.612 | 0.383 | 0.004 | 0.023 | |||||||
| pg164_o2nofp.cx9a2a_c32r128 | 0.001 | 99.672 | 0.326 | 0.011 | |||||||
| pg17beta3_o2nofp.cx9a2a_c32r128 | 0.001 | 99.688 | 0.307 | 0.004 | 0.029 | ||||||
| pg17rc1_o2nofp.cx9a2a_c32r128 | 0.004 | 99.722 | 0.268 | 0.006 | 0.023 |
Delete response time histogram: each cell has the percentage of responses that take <= the time in the header and max is the max response time in seconds. For max values in the top 25% of the range have a red background and in the bottom 25% of the range have a green background. The red background is not used when the min value is within 80% of the max value.
| dbms | 256us | 1ms | 4ms | 16ms | 64ms | 256ms | 1s | 4s | 16s | gt | max |
|---|---|---|---|---|---|---|---|---|---|---|---|
| my5651_rel_o2nofp.cz11a_c32r128 | 0.019 | 54.632 | 44.474 | 0.875 | 0.036 | ||||||
| my5744_rel_o2nofp.cz11a_c32r128 | 0.082 | 99.336 | 0.582 | 0.012 | |||||||
| my8039_rel_o2nofp.cz11a_c32r128 | 0.013 | 97.826 | 2.150 | 0.011 | 0.019 | ||||||
| pg158_o2nofp.cx9a2a_c32r128 | 66.736 | 33.233 | 0.029 | 0.001 | 0.023 | ||||||
| pg164_o2nofp.cx9a2a_c32r128 | 69.793 | 30.185 | 0.022 | 0.006 | |||||||
| pg17beta3_o2nofp.cx9a2a_c32r128 | 68.083 | 31.897 | 0.017 | 0.003 | 0.029 | ||||||
| pg17rc1_o2nofp.cx9a2a_c32r128 | 67.436 | 32.539 | 0.021 | 0.004 | 0.025 |
Performance metrics for the DBMS listed above. Some are normalized by throughput, others are not. Legend for results is here.
ips	qps	rps	rmbps	wps	wmbps	rpq	rkbpq	wpi	wkbpi	csps	cpups	cspq	cpupq	dbgb1	dbgb2	rss	maxop	p50	p99	tag
1977	257731	56	0.2	1430.5	41.1	0.000	0.001	0.724	21.295	990903	42.6	3.845	79	46.4	148.4	53.3	0.021	13090	11827	my5651_rel_o2nofp.cz11a_c32r128
1977	216775	0	0.0	2689.8	75.7	0.000	0.000	1.361	39.213	835987	43.6	3.856	97	47.6	149.6	55.9	0.019	10932	10261	my5744_rel_o2nofp.cz11a_c32r128
1977	186950	0	0.0	2447.0	69.4	0.000	0.000	1.238	35.968	721662	43.1	3.860	111	48.9	150.1	65.4	0.016	9413	9017	my8039_rel_o2nofp.cz11a_c32r128
1977	390692	0	0.0	122.2	10.4	0.000	0.000	0.062	5.388	1484857	42.6	3.801	52	56.6	152.7	0.5	0.017	20065	18412	pg158_o2nofp.cx9a2a_c32r128
1977	392699	0	0.0	120.9	10.4	0.000	0.000	0.061	5.401	1492924	42.5	3.802	52	56.2	152.2	2.0	0.010	19659	18043	pg164_o2nofp.cx9a2a_c32r128
1978	392546	1	0.0	121.6	10.4	0.000	0.000	0.061	5.409	1490918	42.5	3.798	52	56.2	152.3	0.5	0.028	19818	18108	pg17beta3_o2nofp.cx9a2a_c32r128
1977	387796	0	0.0	129.2	10.5	0.000	0.000	0.065	5.421	1474076	42.6	3.801	53	56.3	152.4	0.5	0.012	19691	18147	pg17rc1_o2nofp.cx9a2a_c32r128
qp100.L2
qp100.L2: point queries with 100 insert/s per client. Graphs for performance per 1-second interval are here.
Average throughput:
Query response time histogram: each cell has the percentage of responses that take <= the time in the header and max is the max response time in seconds. For max values in the top 25% of the range have a red background and in the bottom 25% of the range have a green background. The red background is not used when the min value is within 80% of the max value.
| dbms | 256us | 1ms | 4ms | 16ms | 64ms | 256ms | 1s | 4s | 16s | gt | max |
|---|---|---|---|---|---|---|---|---|---|---|---|
| my5651_rel_o2nofp.cz11a_c32r128 | 99.805 | 0.184 | 0.010 | nonzero | 0.010 | ||||||
| my5744_rel_o2nofp.cz11a_c32r128 | 99.435 | 0.560 | 0.005 | nonzero | 0.015 | ||||||
| my8039_rel_o2nofp.cz11a_c32r128 | 99.183 | 0.807 | 0.009 | nonzero | 0.012 | ||||||
| pg158_o2nofp.cx9a2a_c32r128 | 99.702 | 0.237 | 0.062 | nonzero | 0.012 | ||||||
| pg164_o2nofp.cx9a2a_c32r128 | 99.706 | 0.228 | 0.066 | nonzero | 0.007 | ||||||
| pg17beta3_o2nofp.cx9a2a_c32r128 | 99.717 | 0.220 | 0.062 | nonzero | 0.009 | ||||||
| pg17rc1_o2nofp.cx9a2a_c32r128 | 99.711 | 0.225 | 0.064 | nonzero | 0.008 |
Insert response time histogram: each cell has the percentage of responses that take <= the time in the header and max is the max response time in seconds. For max values in the top 25% of the range have a red background and in the bottom 25% of the range have a green background. The red background is not used when the min value is within 80% of the max value.
| dbms | 256us | 1ms | 4ms | 16ms | 64ms | 256ms | 1s | 4s | 16s | gt | max |
|---|---|---|---|---|---|---|---|---|---|---|---|
| my5651_rel_o2nofp.cz11a_c32r128 | 29.361 | 70.160 | 0.479 | 0.047 | |||||||
| my5744_rel_o2nofp.cz11a_c32r128 | 99.731 | 0.269 | 0.011 | ||||||||
| my8039_rel_o2nofp.cz11a_c32r128 | 99.008 | 0.992 | 0.012 | ||||||||
| pg158_o2nofp.cx9a2a_c32r128 | 99.492 | 0.508 | 0.013 | ||||||||
| pg164_o2nofp.cx9a2a_c32r128 | 99.656 | 0.344 | 0.009 | ||||||||
| pg17beta3_o2nofp.cx9a2a_c32r128 | 99.656 | 0.344 | 0.011 | ||||||||
| pg17rc1_o2nofp.cx9a2a_c32r128 | 99.643 | 0.357 | 0.009 |
Delete response time histogram: each cell has the percentage of responses that take <= the time in the header and max is the max response time in seconds. For max values in the top 25% of the range have a red background and in the bottom 25% of the range have a green background. The red background is not used when the min value is within 80% of the max value.
| dbms | 256us | 1ms | 4ms | 16ms | 64ms | 256ms | 1s | 4s | 16s | gt | max |
|---|---|---|---|---|---|---|---|---|---|---|---|
| my5651_rel_o2nofp.cz11a_c32r128 | 0.014 | 39.149 | 60.550 | 0.287 | 0.046 | ||||||
| my5744_rel_o2nofp.cz11a_c32r128 | 0.707 | 99.158 | 0.135 | 0.009 | |||||||
| my8039_rel_o2nofp.cz11a_c32r128 | 99.476 | 0.524 | 0.011 | ||||||||
| pg158_o2nofp.cx9a2a_c32r128 | 7.032 | 92.865 | 0.103 | 0.011 | |||||||
| pg164_o2nofp.cx9a2a_c32r128 | 1.781 | 98.133 | 0.086 | 0.009 | |||||||
| pg17beta3_o2nofp.cx9a2a_c32r128 | 21.272 | 78.643 | 0.085 | 0.010 | |||||||
| pg17rc1_o2nofp.cx9a2a_c32r128 | 1.146 | 98.768 | 0.086 | 0.009 |
Performance metrics for the DBMS listed above. Some are normalized by throughput, others are not. Legend for results is here.
ips	qps	rps	rmbps	wps	wmbps	rpq	rkbpq	wpi	wkbpi	csps	cpups	cspq	cpupq	dbgb1	dbgb2	rss	maxop	p50	p99	tag
1977	166449	52	0.2	30.6	2.2	0.000	0.001	0.015	1.144	650343	40.7	3.907	117	46.4	148.4	53.4	0.010	8423	7624	my5651_rel_o2nofp.cz11a_c32r128
1977	145365	0	0.0	237.9	7.7	0.000	0.000	0.120	4.007	555391	41.0	3.821	135	47.6	149.6	55.9	0.015	7336	6809	my5744_rel_o2nofp.cz11a_c32r128
1978	121020	3	0.3	299.9	9.9	0.000	0.002	0.152	5.140	477959	41.6	3.949	165	48.9	150.1	65.4	0.012	6139	5756	my8039_rel_o2nofp.cz11a_c32r128
1977	128510	0	0.0	358.0	18.0	0.000	0.000	0.181	9.324	515516	44.4	4.012	166	56.6	149.5	0.5	0.012	6521	6393	pg158_o2nofp.cx9a2a_c32r128
1977	128251	0	0.0	343.8	17.9	0.000	0.000	0.174	9.247	513863	44.6	4.007	167	56.2	149.1	2.4	0.007	6521	6378	pg164_o2nofp.cx9a2a_c32r128
1977	128510	1	0.0	343.4	17.9	0.000	0.000	0.174	9.250	515352	44.5	4.010	166	56.2	149.2	0.5	0.009	6548	6407	pg17beta3_o2nofp.cx9a2a_c32r128
1977	127752	0	0.0	342.1	17.8	0.000	0.000	0.173	9.243	511978	44.7	4.008	168	56.3	149.2	0.5	0.008	6475	6345	pg17rc1_o2nofp.cx9a2a_c32r128
qr500.L3
qr500.L3: range queries with 500 insert/s per client. Graphs for performance per 1-second interval are here.
Average throughput:
Query response time histogram: each cell has the percentage of responses that take <= the time in the header and max is the max response time in seconds. For max values in the top 25% of the range have a red background and in the bottom 25% of the range have a green background. The red background is not used when the min value is within 80% of the max value.
| dbms | 256us | 1ms | 4ms | 16ms | 64ms | 256ms | 1s | 4s | 16s | gt | max |
|---|---|---|---|---|---|---|---|---|---|---|---|
| my5651_rel_o2nofp.cz11a_c32r128 | 99.617 | 0.318 | 0.058 | 0.007 | nonzero | 0.017 | |||||
| my5744_rel_o2nofp.cz11a_c32r128 | 99.976 | 0.014 | 0.008 | 0.002 | nonzero | 0.026 | |||||
| my8039_rel_o2nofp.cz11a_c32r128 | 99.964 | 0.024 | 0.011 | 0.001 | nonzero | 0.032 | |||||
| pg158_o2nofp.cx9a2a_c32r128 | 99.987 | 0.006 | 0.007 | nonzero | nonzero | 0.060 | |||||
| pg164_o2nofp.cx9a2a_c32r128 | 99.987 | 0.006 | 0.007 | nonzero | nonzero | nonzero | 0.077 | ||||
| pg17beta3_o2nofp.cx9a2a_c32r128 | 99.987 | 0.006 | 0.007 | nonzero | nonzero | 0.026 | |||||
| pg17rc1_o2nofp.cx9a2a_c32r128 | 99.987 | 0.006 | 0.007 | nonzero | nonzero | nonzero | 0.084 |
Insert response time histogram: each cell has the percentage of responses that take <= the time in the header and max is the max response time in seconds. For max values in the top 25% of the range have a red background and in the bottom 25% of the range have a green background. The red background is not used when the min value is within 80% of the max value.
| dbms | 256us | 1ms | 4ms | 16ms | 64ms | 256ms | 1s | 4s | 16s | gt | max |
|---|---|---|---|---|---|---|---|---|---|---|---|
| my5651_rel_o2nofp.cz11a_c32r128 | 0.001 | 6.869 | 70.279 | 22.851 | 0.049 | ||||||
| my5744_rel_o2nofp.cz11a_c32r128 | nonzero | 74.985 | 24.509 | 0.505 | 0.040 | ||||||
| my8039_rel_o2nofp.cz11a_c32r128 | 75.498 | 24.081 | 0.420 | 0.035 | |||||||
| pg158_o2nofp.cx9a2a_c32r128 | 4.269 | 94.575 | 1.127 | 0.028 | 0.033 | ||||||
| pg164_o2nofp.cx9a2a_c32r128 | 4.631 | 94.353 | 0.975 | 0.041 | 0.038 | ||||||
| pg17beta3_o2nofp.cx9a2a_c32r128 | 10.606 | 88.368 | 0.985 | 0.041 | 0.036 | ||||||
| pg17rc1_o2nofp.cx9a2a_c32r128 | 8.110 | 90.932 | 0.930 | 0.028 | 0.037 |
Delete response time histogram: each cell has the percentage of responses that take <= the time in the header and max is the max response time in seconds. For max values in the top 25% of the range have a red background and in the bottom 25% of the range have a green background. The red background is not used when the min value is within 80% of the max value.
| dbms | 256us | 1ms | 4ms | 16ms | 64ms | 256ms | 1s | 4s | 16s | gt | max |
|---|---|---|---|---|---|---|---|---|---|---|---|
| my5651_rel_o2nofp.cz11a_c32r128 | 0.005 | 8.737 | 71.314 | 19.944 | 0.049 | ||||||
| my5744_rel_o2nofp.cz11a_c32r128 | 0.048 | 78.964 | 20.572 | 0.416 | 0.043 | ||||||
| my8039_rel_o2nofp.cz11a_c32r128 | 0.024 | 81.699 | 17.979 | 0.298 | 0.035 | ||||||
| pg158_o2nofp.cx9a2a_c32r128 | 49.923 | 49.333 | 0.736 | 0.009 | 0.032 | ||||||
| pg164_o2nofp.cx9a2a_c32r128 | 50.872 | 48.481 | 0.629 | 0.019 | 0.026 | ||||||
| pg17beta3_o2nofp.cx9a2a_c32r128 | 54.559 | 44.807 | 0.618 | 0.016 | 0.025 | ||||||
| pg17rc1_o2nofp.cx9a2a_c32r128 | 53.090 | 46.301 | 0.597 | 0.011 | 0.037 |
Performance metrics for the DBMS listed above. Some are normalized by throughput, others are not. Legend for results is here.
ips	qps	rps	rmbps	wps	wmbps	rpq	rkbpq	wpi	wkbpi	csps	cpups	cspq	cpupq	dbgb1	dbgb2	rss	maxop	p50	p99	tag
9885	233378	214	0.8	1171.1	40.1	0.001	0.004	0.118	4.153	901112	45.6	3.861	94	46.4	148.4	53.4	0.017	11747	9925	my5651_rel_o2nofp.cz11a_c32r128
9879	210753	0	0.0	1163.9	40.1	0.000	0.000	0.118	4.152	802403	46.2	3.807	105	47.6	149.6	55.9	0.026	10664	9973	my5744_rel_o2nofp.cz11a_c32r128
9885	184358	0	0.0	1325.4	46.7	0.000	0.000	0.134	4.840	710818	44.9	3.856	117	48.9	150.1	65.4	0.032	9337	9014	my8039_rel_o2nofp.cz11a_c32r128
9885	375186	0	0.0	518.7	27.5	0.000	0.000	0.052	2.852	1420911	43.4	3.787	56	56.7	142.9	40.2	0.060	19003	16430	pg158_o2nofp.cx9a2a_c32r128
9885	383376	0	0.0	511.6	27.4	0.000	0.000	0.052	2.842	1452434	43.3	3.789	54	56.3	142.4	33.7	0.077	19506	17309	pg164_o2nofp.cx9a2a_c32r128
9885	378062	0	0.0	509.8	27.4	0.000	0.000	0.052	2.836	1430822	43.2	3.785	55	56.3	142.6	39.0	0.026	19131	16878	pg17beta3_o2nofp.cx9a2a_c32r128
9885	374957	0	0.0	510.6	27.4	0.000	0.000	0.052	2.838	1419204	43.3	3.785	55	56.3	142.5	21.8	0.084	19035	16637	pg17rc1_o2nofp.cx9a2a_c32r128
qp500.L4
qp500.L4: point queries with 500 insert/s per client. Graphs for performance per 1-second interval are here.
Average throughput:
Query response time histogram: each cell has the percentage of responses that take <= the time in the header and max is the max response time in seconds. For max values in the top 25% of the range have a red background and in the bottom 25% of the range have a green background. The red background is not used when the min value is within 80% of the max value.
| dbms | 256us | 1ms | 4ms | 16ms | 64ms | 256ms | 1s | 4s | 16s | gt | max |
|---|---|---|---|---|---|---|---|---|---|---|---|
| my5651_rel_o2nofp.cz11a_c32r128 | 99.100 | 0.820 | 0.073 | 0.008 | nonzero | 0.020 | |||||
| my5744_rel_o2nofp.cz11a_c32r128 | 99.195 | 0.765 | 0.033 | 0.007 | nonzero | 0.025 | |||||
| my8039_rel_o2nofp.cz11a_c32r128 | 99.011 | 0.923 | 0.061 | 0.005 | nonzero | 0.034 | |||||
| pg158_o2nofp.cx9a2a_c32r128 | 99.631 | 0.282 | 0.086 | 0.001 | nonzero | nonzero | 0.067 | ||||
| pg164_o2nofp.cx9a2a_c32r128 | 99.628 | 0.279 | 0.092 | 0.001 | nonzero | nonzero | 0.067 | ||||
| pg17beta3_o2nofp.cx9a2a_c32r128 | 99.640 | 0.271 | 0.088 | 0.001 | nonzero | nonzero | 0.095 | ||||
| pg17rc1_o2nofp.cx9a2a_c32r128 | 99.639 | 0.273 | 0.088 | 0.001 | nonzero | nonzero | 0.070 |
Insert response time histogram: each cell has the percentage of responses that take <= the time in the header and max is the max response time in seconds. For max values in the top 25% of the range have a red background and in the bottom 25% of the range have a green background. The red background is not used when the min value is within 80% of the max value.
| dbms | 256us | 1ms | 4ms | 16ms | 64ms | 256ms | 1s | 4s | 16s | gt | max |
|---|---|---|---|---|---|---|---|---|---|---|---|
| my5651_rel_o2nofp.cz11a_c32r128 | 0.001 | 6.611 | 73.270 | 20.118 | 0.053 | ||||||
| my5744_rel_o2nofp.cz11a_c32r128 | 0.002 | 66.457 | 33.118 | 0.422 | 0.036 | ||||||
| my8039_rel_o2nofp.cz11a_c32r128 | 83.015 | 16.877 | 0.108 | 0.031 | |||||||
| pg158_o2nofp.cx9a2a_c32r128 | 0.987 | 98.097 | 0.893 | 0.024 | 0.038 | ||||||
| pg164_o2nofp.cx9a2a_c32r128 | 1.033 | 97.948 | 0.999 | 0.020 | 0.038 | ||||||
| pg17beta3_o2nofp.cx9a2a_c32r128 | 5.746 | 93.351 | 0.892 | 0.011 | 0.029 | ||||||
| pg17rc1_o2nofp.cx9a2a_c32r128 | 3.521 | 95.626 | 0.841 | 0.012 | 0.036 |
Delete response time histogram: each cell has the percentage of responses that take <= the time in the header and max is the max response time in seconds. For max values in the top 25% of the range have a red background and in the bottom 25% of the range have a green background. The red background is not used when the min value is within 80% of the max value.
| dbms | 256us | 1ms | 4ms | 16ms | 64ms | 256ms | 1s | 4s | 16s | gt | max |
|---|---|---|---|---|---|---|---|---|---|---|---|
| my5651_rel_o2nofp.cz11a_c32r128 | 0.010 | 8.719 | 74.267 | 17.004 | 0.053 | ||||||
| my5744_rel_o2nofp.cz11a_c32r128 | 0.079 | 71.949 | 27.621 | 0.352 | 0.038 | ||||||
| my8039_rel_o2nofp.cz11a_c32r128 | 0.006 | 87.864 | 12.053 | 0.077 | 0.023 | ||||||
| pg158_o2nofp.cx9a2a_c32r128 | 39.161 | 60.248 | 0.568 | 0.022 | 0.035 | ||||||
| pg164_o2nofp.cx9a2a_c32r128 | 39.716 | 59.617 | 0.649 | 0.017 | 0.038 | ||||||
| pg17beta3_o2nofp.cx9a2a_c32r128 | 45.576 | 53.773 | 0.642 | 0.009 | 0.025 | ||||||
| pg17rc1_o2nofp.cx9a2a_c32r128 | 43.856 | 55.607 | 0.526 | 0.012 | 0.034 |
Performance metrics for the DBMS listed above. Some are normalized by throughput, others are not. Legend for results is here.
ips	qps	rps	rmbps	wps	wmbps	rpq	rkbpq	wpi	wkbpi	csps	cpups	cspq	cpupq	dbgb1	dbgb2	rss	maxop	p50	p99	tag
9879	153295	216	0.8	1329.3	44.3	0.001	0.006	0.135	4.597	600337	44.0	3.916	138	46.4	148.4	53.5	0.020	7688	6959	my5651_rel_o2nofp.cz11a_c32r128
9885	142159	0	0.0	1187.4	40.8	0.000	0.000	0.120	4.227	543922	43.7	3.826	148	47.6	149.6	56.0	0.025	7192	6665	my5744_rel_o2nofp.cz11a_c32r128
9879	119707	0	0.0	1390.5	48.6	0.000	0.000	0.141	5.039	482446	43.4	4.030	174	48.9	150.1	65.4	0.034	6089	5754	my8039_rel_o2nofp.cz11a_c32r128
9885	127739	0	0.0	346.2	29.4	0.000	0.000	0.035	3.050	511683	45.2	4.006	170	56.7	138.8	29.8	0.067	6507	6297	pg158_o2nofp.cx9a2a_c32r128
9885	127213	0	0.0	344.5	29.2	0.000	0.000	0.035	3.024	511595	45.5	4.022	172	56.3	138.4	5.1	0.067	6456	6233	pg164_o2nofp.cx9a2a_c32r128
9885	127254	0	0.0	344.1	29.2	0.000	0.000	0.035	3.021	511268	45.5	4.018	172	56.4	138.5	36.1	0.095	6457	6249	pg17beta3_o2nofp.cx9a2a_c32r128
9885	126889	1	0.0	344.4	29.2	0.000	0.000	0.035	3.021	509594	45.5	4.016	172	56.4	138.5	33.3	0.070	6431	6233	pg17rc1_o2nofp.cx9a2a_c32r128
qr1000.L5
qr1000.L5: range queries with 1000 insert/s per client. Graphs for performance per 1-second interval are here.
Average throughput:
Query response time histogram: each cell has the percentage of responses that take <= the time in the header and max is the max response time in seconds. For max values in the top 25% of the range have a red background and in the bottom 25% of the range have a green background. The red background is not used when the min value is within 80% of the max value.
| dbms | 256us | 1ms | 4ms | 16ms | 64ms | 256ms | 1s | 4s | 16s | gt | max |
|---|---|---|---|---|---|---|---|---|---|---|---|
| my5651_rel_o2nofp.cz11a_c32r128 | 98.874 | 0.956 | 0.152 | 0.018 | nonzero | 0.038 | |||||
| my5744_rel_o2nofp.cz11a_c32r128 | 99.904 | 0.057 | 0.028 | 0.010 | nonzero | 0.026 | |||||
| my8039_rel_o2nofp.cz11a_c32r128 | 99.910 | 0.056 | 0.032 | 0.002 | nonzero | 0.032 | |||||
| pg158_o2nofp.cx9a2a_c32r128 | 99.977 | 0.011 | 0.012 | nonzero | nonzero | nonzero | 0.088 | ||||
| pg164_o2nofp.cx9a2a_c32r128 | 99.978 | 0.011 | 0.011 | nonzero | nonzero | nonzero | 0.095 | ||||
| pg17beta3_o2nofp.cx9a2a_c32r128 | 99.977 | 0.012 | 0.011 | nonzero | nonzero | nonzero | 0.086 | ||||
| pg17rc1_o2nofp.cx9a2a_c32r128 | 99.977 | 0.012 | 0.011 | nonzero | nonzero | nonzero | 0.080 |
Insert response time histogram: each cell has the percentage of responses that take <= the time in the header and max is the max response time in seconds. For max values in the top 25% of the range have a red background and in the bottom 25% of the range have a green background. The red background is not used when the min value is within 80% of the max value.
| dbms | 256us | 1ms | 4ms | 16ms | 64ms | 256ms | 1s | 4s | 16s | gt | max |
|---|---|---|---|---|---|---|---|---|---|---|---|
| my5651_rel_o2nofp.cz11a_c32r128 | 0.001 | 3.242 | 64.739 | 32.019 | 0.056 | ||||||
| my5744_rel_o2nofp.cz11a_c32r128 | 0.002 | 28.402 | 68.093 | 3.503 | 0.049 | ||||||
| my8039_rel_o2nofp.cz11a_c32r128 | 53.092 | 45.807 | 1.101 | 0.054 | |||||||
| pg158_o2nofp.cx9a2a_c32r128 | 19.989 | 79.266 | 0.736 | 0.008 | 0.031 | ||||||
| pg164_o2nofp.cx9a2a_c32r128 | 17.020 | 82.349 | 0.626 | 0.006 | 0.032 | ||||||
| pg17beta3_o2nofp.cx9a2a_c32r128 | 33.402 | 66.059 | 0.534 | 0.004 | 0.049 | ||||||
| pg17rc1_o2nofp.cx9a2a_c32r128 | 26.222 | 73.229 | 0.541 | 0.008 | 0.032 |
Delete response time histogram: each cell has the percentage of responses that take <= the time in the header and max is the max response time in seconds. For max values in the top 25% of the range have a red background and in the bottom 25% of the range have a green background. The red background is not used when the min value is within 80% of the max value.
| dbms | 256us | 1ms | 4ms | 16ms | 64ms | 256ms | 1s | 4s | 16s | gt | max |
|---|---|---|---|---|---|---|---|---|---|---|---|
| my5651_rel_o2nofp.cz11a_c32r128 | 0.005 | 3.607 | 67.316 | 29.072 | 0.058 | ||||||
| my5744_rel_o2nofp.cz11a_c32r128 | 0.053 | 31.827 | 64.526 | 3.594 | 0.051 | ||||||
| my8039_rel_o2nofp.cz11a_c32r128 | 0.016 | 60.393 | 38.761 | 0.831 | 0.057 | ||||||
| pg158_o2nofp.cx9a2a_c32r128 | 46.709 | 52.902 | 0.384 | 0.004 | 0.027 | ||||||
| pg164_o2nofp.cx9a2a_c32r128 | 48.999 | 50.674 | 0.326 | 0.002 | 0.030 | ||||||
| pg17beta3_o2nofp.cx9a2a_c32r128 | 55.202 | 44.494 | 0.302 | 0.002 | 0.027 | ||||||
| pg17rc1_o2nofp.cx9a2a_c32r128 | 53.693 | 45.996 | 0.308 | 0.003 | 0.031 |
Performance metrics for the DBMS listed above. Some are normalized by throughput, others are not. Legend for results is here.
ips	qps	rps	rmbps	wps	wmbps	rpq	rkbpq	wpi	wkbpi	csps	cpups	cspq	cpupq	dbgb1	dbgb2	rss	maxop	p50	p99	tag
19780	205653	412	1.6	2035.0	71.9	0.002	0.008	0.103	3.721	813121	49.9	3.954	116	46.4	148.4	53.6	0.038	10408	8807	my5651_rel_o2nofp.cz11a_c32r128
19769	200906	0	0.0	1864.1	67.7	0.000	0.000	0.094	3.507	749605	50.2	3.731	120	47.6	149.6	56.2	0.026	10101	9382	my5744_rel_o2nofp.cz11a_c32r128
19769	180044	0	0.0	2235.9	82.9	0.000	0.000	0.113	4.297	699161	46.8	3.883	125	48.9	150.1	65.4	0.032	9126	8759	my8039_rel_o2nofp.cz11a_c32r128
19758	370418	0	0.0	396.6	33.6	0.000	0.000	0.020	1.743	1399767	44.3	3.779	57	56.6	135.0	44.4	0.088	18959	16590	pg158_o2nofp.cx9a2a_c32r128
19758	377223	0	0.0	396.9	33.4	0.000	0.000	0.020	1.732	1426020	44.2	3.780	56	56.3	134.7	32.0	0.095	18875	16669	pg164_o2nofp.cx9a2a_c32r128
19758	375401	0	0.0	396.9	33.4	0.000	0.000	0.020	1.733	1418168	44.1	3.778	56	56.3	134.7	24.0	0.086	18731	16542	pg17beta3_o2nofp.cx9a2a_c32r128
19758	370957	0	0.0	396.3	33.4	0.000	0.000	0.020	1.729	1399962	44.2	3.774	57	56.4	134.8	39.4	0.080	18955	16462	pg17rc1_o2nofp.cx9a2a_c32r128
qp1000.L6
qp1000.L6: point queries with 1000 insert/s per client. Graphs for performance per 1-second interval are here.
Average throughput:
Query response time histogram: each cell has the percentage of responses that take <= the time in the header and max is the max response time in seconds. For max values in the top 25% of the range have a red background and in the bottom 25% of the range have a green background. The red background is not used when the min value is within 80% of the max value.
| dbms | 256us | 1ms | 4ms | 16ms | 64ms | 256ms | 1s | 4s | 16s | gt | max |
|---|---|---|---|---|---|---|---|---|---|---|---|
| my5651_rel_o2nofp.cz11a_c32r128 | 99.105 | 0.800 | 0.074 | 0.022 | nonzero | 0.040 | |||||
| my5744_rel_o2nofp.cz11a_c32r128 | 98.542 | 1.306 | 0.123 | 0.028 | nonzero | 0.036 | |||||
| my8039_rel_o2nofp.cz11a_c32r128 | 98.242 | 1.585 | 0.164 | 0.009 | nonzero | 0.028 | |||||
| pg158_o2nofp.cx9a2a_c32r128 | 99.493 | 0.380 | 0.125 | 0.002 | nonzero | nonzero | 0.090 | ||||
| pg164_o2nofp.cx9a2a_c32r128 | 99.499 | 0.371 | 0.128 | 0.002 | nonzero | nonzero | 0.091 | ||||
| pg17beta3_o2nofp.cx9a2a_c32r128 | 99.510 | 0.365 | 0.123 | 0.002 | nonzero | nonzero | 0.096 | ||||
| pg17rc1_o2nofp.cx9a2a_c32r128 | 99.505 | 0.368 | 0.124 | 0.002 | nonzero | nonzero | 0.101 |
Insert response time histogram: each cell has the percentage of responses that take <= the time in the header and max is the max response time in seconds. For max values in the top 25% of the range have a red background and in the bottom 25% of the range have a green background. The red background is not used when the min value is within 80% of the max value.
| dbms | 256us | 1ms | 4ms | 16ms | 64ms | 256ms | 1s | 4s | 16s | gt | max |
|---|---|---|---|---|---|---|---|---|---|---|---|
| my5651_rel_o2nofp.cz11a_c32r128 | nonzero | 3.439 | 66.589 | 29.970 | 0.001 | 0.080 | |||||
| my5744_rel_o2nofp.cz11a_c32r128 | 0.002 | 22.457 | 74.919 | 2.623 | 0.053 | ||||||
| my8039_rel_o2nofp.cz11a_c32r128 | 57.946 | 41.692 | 0.362 | 0.051 | |||||||
| pg158_o2nofp.cx9a2a_c32r128 | 2.919 | 95.627 | 1.406 | 0.049 | 0.055 | ||||||
| pg164_o2nofp.cx9a2a_c32r128 | 3.185 | 95.520 | 1.246 | 0.049 | 0.044 | ||||||
| pg17beta3_o2nofp.cx9a2a_c32r128 | 17.112 | 81.704 | 1.137 | 0.048 | 0.051 | ||||||
| pg17rc1_o2nofp.cx9a2a_c32r128 | 4.969 | 93.879 | 1.104 | 0.048 | 0.052 |
Delete response time histogram: each cell has the percentage of responses that take <= the time in the header and max is the max response time in seconds. For max values in the top 25% of the range have a red background and in the bottom 25% of the range have a green background. The red background is not used when the min value is within 80% of the max value.
| dbms | 256us | 1ms | 4ms | 16ms | 64ms | 256ms | 1s | 4s | 16s | gt | max |
|---|---|---|---|---|---|---|---|---|---|---|---|
| my5651_rel_o2nofp.cz11a_c32r128 | 0.004 | 3.702 | 69.113 | 27.179 | 0.002 | 0.081 | |||||
| my5744_rel_o2nofp.cz11a_c32r128 | 0.050 | 27.130 | 70.058 | 2.762 | 0.052 | ||||||
| my8039_rel_o2nofp.cz11a_c32r128 | 0.007 | 65.515 | 34.192 | 0.286 | nonzero | 0.069 | |||||
| pg158_o2nofp.cx9a2a_c32r128 | 47.162 | 51.858 | 0.955 | 0.026 | 0.037 | ||||||
| pg164_o2nofp.cx9a2a_c32r128 | 48.901 | 50.198 | 0.872 | 0.029 | 0.040 | ||||||
| pg17beta3_o2nofp.cx9a2a_c32r128 | 54.234 | 44.914 | 0.831 | 0.022 | 0.029 | ||||||
| pg17rc1_o2nofp.cx9a2a_c32r128 | 50.960 | 48.168 | 0.844 | 0.029 | 0.036 |
Performance metrics for the DBMS listed above. Some are normalized by throughput, others are not. Legend for results is here.
ips	qps	rps	rmbps	wps	wmbps	rpq	rkbpq	wpi	wkbpi	csps	cpups	cspq	cpupq	dbgb1	dbgb2	rss	maxop	p50	p99	tag
19769	145602	374	1.5	2143.9	74.9	0.003	0.010	0.108	3.881	535164	49.4	3.676	163	46.4	148.4	53.3	0.040	7320	6952	my5651_rel_o2nofp.cz11a_c32r128
19769	137255	0	0.0	1937.1	69.7	0.000	0.000	0.098	3.609	534168	48.2	3.892	169	47.6	149.6	56.3	0.036	6921	6361	my5744_rel_o2nofp.cz11a_c32r128
19769	115866	0	0.0	2275.2	84.2	0.000	0.000	0.115	4.361	476216	45.0	4.110	186	48.9	150.1	65.4	0.028	5850	5451	my8039_rel_o2nofp.cz11a_c32r128
19769	126017	0	0.0	410.8	36.0	0.000	0.000	0.021	1.864	507864	45.8	4.030	174	56.3	133.6	25.1	0.090	6379	6153	pg158_o2nofp.cx9a2a_c32r128
19769	125792	0	0.0	409.6	35.8	0.000	0.000	0.021	1.855	508430	46.2	4.042	176	56.1	133.4	25.1	0.091	6381	6137	pg164_o2nofp.cx9a2a_c32r128
19769	125869	0	0.0	409.2	35.8	0.000	0.000	0.021	1.854	508062	46.1	4.036	176	56.1	133.4	24.9	0.096	6409	6153	pg17beta3_o2nofp.cx9a2a_c32r128
19769	125252	0	0.0	411.6	35.8	0.000	0.000	0.021	1.854	504632	46.3	4.029	177	56.2	133.5	9.3	0.101	6380	6121	pg17rc1_o2nofp.cx9a2a_c32r128
l.i0
l.i0: load without secondary indexes
Performance metrics for all DBMS, not just the ones listed above. Some are normalized by throughput, others are not. Legend for results is here.
ips	qps	rps	rmbps	wps	wmbps	rpq	rkbpq	wpi	wkbpi	csps	cpups	cspq	cpupq	dbgb1	dbgb2	rss	maxop	p50	p99	tag
473934	0	0	0.0	1721.8	130.8	0.000	0.000	0.004	0.283	72579	40.8	0.153	41	13.3	113.8	20.0	0.174	23774	20078	my5651_rel_o2nofp.cz11a_c32r128
657895	0	0	0.0	2742.7	188.4	0.000	0.000	0.004	0.293	74331	42.3	0.113	31	13.3	113.8	21.2	0.170	34563	28869	my5744_rel_o2nofp.cz11a_c32r128
1234568	0	0	0.0	4726.6	360.8	0.000	0.000	0.004	0.299	244411	47.1	0.198	18	13.3	113.9	20.8	0.203	75619	62932	my8039_rel_o2nofp.cz11a_c32r128
1666667	0	1	0.0	6631.3	698.9	0.000	0.000	0.004	0.429	254940	46.0	0.153	13	19.1	51.7	1.9	0.648	110482	30967	pg158_o2nofp.cx9a2a_c32r128
1652892	0	2	0.0	6655.7	704.0	0.000	0.000	0.004	0.436	260915	45.6	0.158	13	19.1	51.7	1.9	0.741	111712	44751	pg164_o2nofp.cx9a2a_c32r128
1694915	0	3	0.0	6699.9	706.9	0.000	0.000	0.004	0.427	265066	45.3	0.156	13	19.1	51.7	1.4	0.489	112778	47449	pg17beta3_o2nofp.cx9a2a_c32r128
1709402	0	0	0.0	6770.0	718.3	0.000	0.000	0.004	0.430	274194	46.8	0.160	13	19.1	51.7	12.2	0.539	112979	49047	pg17rc1_o2nofp.cx9a2a_c32r128
l.x
l.x: create secondary indexes
Performance metrics for all DBMS, not just the ones listed above. Some are normalized by throughput, others are not. Legend for results is here.
ips	qps	rps	rmbps	wps	wmbps	rpq	rkbpq	wpi	wkbpi	csps	cpups	cspq	cpupq	dbgb1	dbgb2	rss	maxop	p50	p99	tag
386847	0	0	0.0	19971.2	671.7	0.000	0.000	0.052	1.778	85204	39.8	0.220	49	27.9	128.4	34.7	0.001	NA	NA	my5651_rel_o2nofp.cz11a_c32r128
2173914	0	1	0.0	35495.5	1830.2	0.000	0.000	0.016	0.862	194707	35.7	0.090	8	30.4	130.9	36.6	0.002	NA	NA	my5744_rel_o2nofp.cz11a_c32r128
2040817	0	14851	639.1	55978.1	2116.4	0.007	0.321	0.027	1.062	177713	70.0	0.087	16	30.3	130.9	29.2	0.010	NA	NA	my8039_rel_o2nofp.cz11a_c32r128
2597404	0	0	0.0	6280.5	724.0	0.000	0.000	0.002	0.285	105828	17.8	0.041	3	38.4	88.6	6.9	0.045	NA	NA	pg158_o2nofp.cx9a2a_c32r128
2597404	0	0	0.0	6171.7	713.0	0.000	0.000	0.002	0.281	105324	17.9	0.041	3	38.4	88.6	6.3	0.044	NA	NA	pg164_o2nofp.cx9a2a_c32r128
2739727	0	1	0.0	6884.0	797.9	0.000	0.000	0.003	0.298	40487	17.1	0.015	3	38.4	88.5	6.4	0.044	NA	NA	pg17beta3_o2nofp.cx9a2a_c32r128
2816903	0	0	0.0	7336.8	855.7	0.000	0.000	0.003	0.311	42161	17.9	0.015	3	38.4	88.5	6.4	0.036	NA	NA	pg17rc1_o2nofp.cx9a2a_c32r128
l.i1
l.i1: continue load after secondary indexes created with 50 inserts per transaction
Performance metrics for all DBMS, not just the ones listed above. Some are normalized by throughput, others are not. Legend for results is here.
ips	qps	rps	rmbps	wps	wmbps	rpq	rkbpq	wpi	wkbpi	csps	cpups	cspq	cpupq	dbgb1	dbgb2	rss	maxop	p50	p99	tag
49836	0	1046	4.1	3490.5	127.1	0.021	0.084	0.070	2.611	261389	65.8	5.245	634	46.4	148.4	52.8	0.485	2598	150	my5651_rel_o2nofp.cz11a_c32r128
80020	0	0	0.0	5275.3	195.3	0.000	0.000	0.066	2.499	86600	73.4	1.082	440	47.6	149.6	55.3	0.309	4895	150	my5744_rel_o2nofp.cz11a_c32r128
199253	0	601	9.4	11848.3	498.3	0.003	0.048	0.059	2.561	370334	49.2	1.859	119	48.9	151.4	65.3	0.321	11587	3296	my8039_rel_o2nofp.cz11a_c32r128
383234	0	932	5.5	6402.0	594.5	0.002	0.015	0.017	1.588	263431	54.8	0.687	69	56.4	152.4	42.5	0.457	22109	3946	pg158_o2nofp.cx9a2a_c32r128
384615	0	704	3.2	6213.6	589.1	0.002	0.009	0.016	1.568	270915	54.9	0.704	69	56.0	152.0	49.8	0.144	22076	3796	pg164_o2nofp.cx9a2a_c32r128
397022	0	644	2.9	6517.7	622.2	0.002	0.008	0.016	1.605	255362	53.6	0.643	65	56.0	152.0	38.7	0.435	22925	3246	pg17beta3_o2nofp.cx9a2a_c32r128
393120	0	631	2.9	6440.2	612.9	0.002	0.008	0.016	1.597	259091	53.0	0.659	65	56.1	152.1	8.7	0.696	22833	3346	pg17rc1_o2nofp.cx9a2a_c32r128
l.i2
l.i2: continue load after secondary indexes created with 5 inserts per transaction
Performance metrics for all DBMS, not just the ones listed above. Some are normalized by throughput, others are not. Legend for results is here.
ips	qps	rps	rmbps	wps	wmbps	rpq	rkbpq	wpi	wkbpi	csps	cpups	cspq	cpupq	dbgb1	dbgb2	rss	maxop	p50	p99	tag
33030	0	4148	16.2	3556.7	130.4	0.126	0.502	0.108	4.043	424241	52.8	12.844	767	46.4	148.4	53.3	0.092	1763	165	my5651_rel_o2nofp.cz11a_c32r128
62745	0	0	0.0	5998.2	229.3	0.000	0.000	0.096	3.742	305780	54.9	4.873	420	47.6	149.6	55.8	0.163	3401	180	my5744_rel_o2nofp.cz11a_c32r128
102564	0	0	0.0	9836.8	407.7	0.000	0.000	0.096	4.071	627582	52.1	6.119	244	48.9	150.1	65.4	0.194	5749	830	my8039_rel_o2nofp.cz11a_c32r128
94007	0	0	0.0	1418.9	135.4	0.000	0.000	0.015	1.475	383097	52.7	4.075	269	56.6	152.7	8.9	0.032	4001	3018	pg158_o2nofp.cx9a2a_c32r128
98280	0	0	0.0	1482.5	142.0	0.000	0.000	0.015	1.480	400824	54.4	4.078	266	56.2	152.3	6.3	0.072	4466	3311	pg164_o2nofp.cx9a2a_c32r128
101652	0	1	0.0	1496.9	143.1	0.000	0.000	0.015	1.442	385029	52.4	3.788	247	56.2	152.3	17.1	0.060	4800	3256	pg17beta3_o2nofp.cx9a2a_c32r128
104167	0	1	0.0	1559.2	147.9	0.000	0.000	0.015	1.454	392508	54.1	3.768	249	56.3	152.4	16.3	0.064	4483	3323	pg17rc1_o2nofp.cx9a2a_c32r128
qr100.L1
qr100.L1: range queries with 100 insert/s per client
Performance metrics for all DBMS, not just the ones listed above. Some are normalized by throughput, others are not. Legend for results is here.
ips	qps	rps	rmbps	wps	wmbps	rpq	rkbpq	wpi	wkbpi	csps	cpups	cspq	cpupq	dbgb1	dbgb2	rss	maxop	p50	p99	tag
1977	257731	56	0.2	1430.5	41.1	0.000	0.001	0.724	21.295	990903	42.6	3.845	79	46.4	148.4	53.3	0.021	13090	11827	my5651_rel_o2nofp.cz11a_c32r128
1977	216775	0	0.0	2689.8	75.7	0.000	0.000	1.361	39.213	835987	43.6	3.856	97	47.6	149.6	55.9	0.019	10932	10261	my5744_rel_o2nofp.cz11a_c32r128
1977	186950	0	0.0	2447.0	69.4	0.000	0.000	1.238	35.968	721662	43.1	3.860	111	48.9	150.1	65.4	0.016	9413	9017	my8039_rel_o2nofp.cz11a_c32r128
1977	390692	0	0.0	122.2	10.4	0.000	0.000	0.062	5.388	1484857	42.6	3.801	52	56.6	152.7	0.5	0.017	20065	18412	pg158_o2nofp.cx9a2a_c32r128
1977	392699	0	0.0	120.9	10.4	0.000	0.000	0.061	5.401	1492924	42.5	3.802	52	56.2	152.2	2.0	0.010	19659	18043	pg164_o2nofp.cx9a2a_c32r128
1978	392546	1	0.0	121.6	10.4	0.000	0.000	0.061	5.409	1490918	42.5	3.798	52	56.2	152.3	0.5	0.028	19818	18108	pg17beta3_o2nofp.cx9a2a_c32r128
1977	387796	0	0.0	129.2	10.5	0.000	0.000	0.065	5.421	1474076	42.6	3.801	53	56.3	152.4	0.5	0.012	19691	18147	pg17rc1_o2nofp.cx9a2a_c32r128
qp100.L2
qp100.L2: point queries with 100 insert/s per client
Performance metrics for all DBMS, not just the ones listed above. Some are normalized by throughput, others are not. Legend for results is here.
ips	qps	rps	rmbps	wps	wmbps	rpq	rkbpq	wpi	wkbpi	csps	cpups	cspq	cpupq	dbgb1	dbgb2	rss	maxop	p50	p99	tag
1977	166449	52	0.2	30.6	2.2	0.000	0.001	0.015	1.144	650343	40.7	3.907	117	46.4	148.4	53.4	0.010	8423	7624	my5651_rel_o2nofp.cz11a_c32r128
1977	145365	0	0.0	237.9	7.7	0.000	0.000	0.120	4.007	555391	41.0	3.821	135	47.6	149.6	55.9	0.015	7336	6809	my5744_rel_o2nofp.cz11a_c32r128
1978	121020	3	0.3	299.9	9.9	0.000	0.002	0.152	5.140	477959	41.6	3.949	165	48.9	150.1	65.4	0.012	6139	5756	my8039_rel_o2nofp.cz11a_c32r128
1977	128510	0	0.0	358.0	18.0	0.000	0.000	0.181	9.324	515516	44.4	4.012	166	56.6	149.5	0.5	0.012	6521	6393	pg158_o2nofp.cx9a2a_c32r128
1977	128251	0	0.0	343.8	17.9	0.000	0.000	0.174	9.247	513863	44.6	4.007	167	56.2	149.1	2.4	0.007	6521	6378	pg164_o2nofp.cx9a2a_c32r128
1977	128510	1	0.0	343.4	17.9	0.000	0.000	0.174	9.250	515352	44.5	4.010	166	56.2	149.2	0.5	0.009	6548	6407	pg17beta3_o2nofp.cx9a2a_c32r128
1977	127752	0	0.0	342.1	17.8	0.000	0.000	0.173	9.243	511978	44.7	4.008	168	56.3	149.2	0.5	0.008	6475	6345	pg17rc1_o2nofp.cx9a2a_c32r128
qr500.L3
qr500.L3: range queries with 500 insert/s per client
Performance metrics for all DBMS, not just the ones listed above. Some are normalized by throughput, others are not. Legend for results is here.
ips	qps	rps	rmbps	wps	wmbps	rpq	rkbpq	wpi	wkbpi	csps	cpups	cspq	cpupq	dbgb1	dbgb2	rss	maxop	p50	p99	tag
9885	233378	214	0.8	1171.1	40.1	0.001	0.004	0.118	4.153	901112	45.6	3.861	94	46.4	148.4	53.4	0.017	11747	9925	my5651_rel_o2nofp.cz11a_c32r128
9879	210753	0	0.0	1163.9	40.1	0.000	0.000	0.118	4.152	802403	46.2	3.807	105	47.6	149.6	55.9	0.026	10664	9973	my5744_rel_o2nofp.cz11a_c32r128
9885	184358	0	0.0	1325.4	46.7	0.000	0.000	0.134	4.840	710818	44.9	3.856	117	48.9	150.1	65.4	0.032	9337	9014	my8039_rel_o2nofp.cz11a_c32r128
9885	375186	0	0.0	518.7	27.5	0.000	0.000	0.052	2.852	1420911	43.4	3.787	56	56.7	142.9	40.2	0.060	19003	16430	pg158_o2nofp.cx9a2a_c32r128
9885	383376	0	0.0	511.6	27.4	0.000	0.000	0.052	2.842	1452434	43.3	3.789	54	56.3	142.4	33.7	0.077	19506	17309	pg164_o2nofp.cx9a2a_c32r128
9885	378062	0	0.0	509.8	27.4	0.000	0.000	0.052	2.836	1430822	43.2	3.785	55	56.3	142.6	39.0	0.026	19131	16878	pg17beta3_o2nofp.cx9a2a_c32r128
9885	374957	0	0.0	510.6	27.4	0.000	0.000	0.052	2.838	1419204	43.3	3.785	55	56.3	142.5	21.8	0.084	19035	16637	pg17rc1_o2nofp.cx9a2a_c32r128
qp500.L4
qp500.L4: point queries with 500 insert/s per client
Performance metrics for all DBMS, not just the ones listed above. Some are normalized by throughput, others are not. Legend for results is here.
ips	qps	rps	rmbps	wps	wmbps	rpq	rkbpq	wpi	wkbpi	csps	cpups	cspq	cpupq	dbgb1	dbgb2	rss	maxop	p50	p99	tag
9879	153295	216	0.8	1329.3	44.3	0.001	0.006	0.135	4.597	600337	44.0	3.916	138	46.4	148.4	53.5	0.020	7688	6959	my5651_rel_o2nofp.cz11a_c32r128
9885	142159	0	0.0	1187.4	40.8	0.000	0.000	0.120	4.227	543922	43.7	3.826	148	47.6	149.6	56.0	0.025	7192	6665	my5744_rel_o2nofp.cz11a_c32r128
9879	119707	0	0.0	1390.5	48.6	0.000	0.000	0.141	5.039	482446	43.4	4.030	174	48.9	150.1	65.4	0.034	6089	5754	my8039_rel_o2nofp.cz11a_c32r128
9885	127739	0	0.0	346.2	29.4	0.000	0.000	0.035	3.050	511683	45.2	4.006	170	56.7	138.8	29.8	0.067	6507	6297	pg158_o2nofp.cx9a2a_c32r128
9885	127213	0	0.0	344.5	29.2	0.000	0.000	0.035	3.024	511595	45.5	4.022	172	56.3	138.4	5.1	0.067	6456	6233	pg164_o2nofp.cx9a2a_c32r128
9885	127254	0	0.0	344.1	29.2	0.000	0.000	0.035	3.021	511268	45.5	4.018	172	56.4	138.5	36.1	0.095	6457	6249	pg17beta3_o2nofp.cx9a2a_c32r128
9885	126889	1	0.0	344.4	29.2	0.000	0.000	0.035	3.021	509594	45.5	4.016	172	56.4	138.5	33.3	0.070	6431	6233	pg17rc1_o2nofp.cx9a2a_c32r128
qr1000.L5
qr1000.L5: range queries with 1000 insert/s per client
Performance metrics for all DBMS, not just the ones listed above. Some are normalized by throughput, others are not. Legend for results is here.
ips	qps	rps	rmbps	wps	wmbps	rpq	rkbpq	wpi	wkbpi	csps	cpups	cspq	cpupq	dbgb1	dbgb2	rss	maxop	p50	p99	tag
19780	205653	412	1.6	2035.0	71.9	0.002	0.008	0.103	3.721	813121	49.9	3.954	116	46.4	148.4	53.6	0.038	10408	8807	my5651_rel_o2nofp.cz11a_c32r128
19769	200906	0	0.0	1864.1	67.7	0.000	0.000	0.094	3.507	749605	50.2	3.731	120	47.6	149.6	56.2	0.026	10101	9382	my5744_rel_o2nofp.cz11a_c32r128
19769	180044	0	0.0	2235.9	82.9	0.000	0.000	0.113	4.297	699161	46.8	3.883	125	48.9	150.1	65.4	0.032	9126	8759	my8039_rel_o2nofp.cz11a_c32r128
19758	370418	0	0.0	396.6	33.6	0.000	0.000	0.020	1.743	1399767	44.3	3.779	57	56.6	135.0	44.4	0.088	18959	16590	pg158_o2nofp.cx9a2a_c32r128
19758	377223	0	0.0	396.9	33.4	0.000	0.000	0.020	1.732	1426020	44.2	3.780	56	56.3	134.7	32.0	0.095	18875	16669	pg164_o2nofp.cx9a2a_c32r128
19758	375401	0	0.0	396.9	33.4	0.000	0.000	0.020	1.733	1418168	44.1	3.778	56	56.3	134.7	24.0	0.086	18731	16542	pg17beta3_o2nofp.cx9a2a_c32r128
19758	370957	0	0.0	396.3	33.4	0.000	0.000	0.020	1.729	1399962	44.2	3.774	57	56.4	134.8	39.4	0.080	18955	16462	pg17rc1_o2nofp.cx9a2a_c32r128
qp1000.L6
qp1000.L6: point queries with 1000 insert/s per client
Performance metrics for all DBMS, not just the ones listed above. Some are normalized by throughput, others are not. Legend for results is here.
ips	qps	rps	rmbps	wps	wmbps	rpq	rkbpq	wpi	wkbpi	csps	cpups	cspq	cpupq	dbgb1	dbgb2	rss	maxop	p50	p99	tag
19769	145602	374	1.5	2143.9	74.9	0.003	0.010	0.108	3.881	535164	49.4	3.676	163	46.4	148.4	53.3	0.040	7320	6952	my5651_rel_o2nofp.cz11a_c32r128
19769	137255	0	0.0	1937.1	69.7	0.000	0.000	0.098	3.609	534168	48.2	3.892	169	47.6	149.6	56.3	0.036	6921	6361	my5744_rel_o2nofp.cz11a_c32r128
19769	115866	0	0.0	2275.2	84.2	0.000	0.000	0.115	4.361	476216	45.0	4.110	186	48.9	150.1	65.4	0.028	5850	5451	my8039_rel_o2nofp.cz11a_c32r128
19769	126017	0	0.0	410.8	36.0	0.000	0.000	0.021	1.864	507864	45.8	4.030	174	56.3	133.6	25.1	0.090	6379	6153	pg158_o2nofp.cx9a2a_c32r128
19769	125792	0	0.0	409.6	35.8	0.000	0.000	0.021	1.855	508430	46.2	4.042	176	56.1	133.4	25.1	0.091	6381	6137	pg164_o2nofp.cx9a2a_c32r128
19769	125869	0	0.0	409.2	35.8	0.000	0.000	0.021	1.854	508062	46.1	4.036	176	56.1	133.4	24.9	0.096	6409	6153	pg17beta3_o2nofp.cx9a2a_c32r128
19769	125252	0	0.0	411.6	35.8	0.000	0.000	0.021	1.854	504632	46.3	4.029	177	56.2	133.5	9.3	0.101	6380	6121	pg17rc1_o2nofp.cx9a2a_c32r128
l.i0
- l.i0: load without secondary indexes
- Legend for results is here.
- Each entry lists the percentage of responses that fit in that bucket (slower than max time for previous bucket, faster than min time for next bucket).
Insert response time histogram
256us	1ms	4ms	16ms	64ms	256ms	1s	4s	16s	gt	max	tag
0.000	2.824	56.656	40.134	0.352	0.034	0.000	0.000	0.000	0.000	0.174	my5651_rel_o2nofp.cz11a_c32r128
0.000	2.431	97.366	0.160	0.009	0.034	0.000	0.000	0.000	0.000	0.170	my5744_rel_o2nofp.cz11a_c32r128
0.000	1.706	98.226	0.021	0.012	0.035	0.000	0.000	0.000	0.000	0.203	my8039_rel_o2nofp.cz11a_c32r128
0.000	92.282	7.675	0.021	0.004	0.010	0.007	0.000	0.000	0.000	0.648	pg158_o2nofp.cx9a2a_c32r128
0.000	92.427	7.527	0.027	0.004	0.007	0.008	0.000	0.000	0.000	0.741	pg164_o2nofp.cx9a2a_c32r128
0.000	92.966	6.986	0.025	0.006	0.008	0.009	0.000	0.000	0.000	0.489	pg17beta3_o2nofp.cx9a2a_c32r128
0.000	93.049	6.901	0.030	0.007	0.010	0.004	0.000	0.000	0.000	0.539	pg17rc1_o2nofp.cx9a2a_c32r128
l.x
- l.x: create secondary indexes
- Legend for results is here.
- Each entry lists the percentage of responses that fit in that bucket (slower than max time for previous bucket, faster than min time for next bucket).
TODO - determine whether there is data for create index response time
l.i1
- l.i1: continue load after secondary indexes created with 50 inserts per transaction
- Legend for results is here.
- Each entry lists the percentage of responses that fit in that bucket (slower than max time for previous bucket, faster than min time for next bucket).
Insert response time histogram
256us	1ms	4ms	16ms	64ms	256ms	1s	4s	16s	gt	max	tag
0.000	0.002	0.318	24.045	74.833	0.118	0.684	0.000	0.000	0.000	0.485	my5651_rel_o2nofp.cz11a_c32r128
0.000	0.000	0.151	98.134	0.718	0.308	0.688	0.000	0.000	0.000	0.309	my5744_rel_o2nofp.cz11a_c32r128
0.000	0.000	65.028	34.609	0.305	0.057	nonzero	0.000	0.000	0.000	0.321	my8039_rel_o2nofp.cz11a_c32r128
0.000	1.481	91.183	6.776	0.554	0.006	nonzero	0.000	0.000	0.000	0.457	pg158_o2nofp.cx9a2a_c32r128
0.000	1.463	90.793	7.211	0.526	0.007	0.000	0.000	0.000	0.000	0.144	pg164_o2nofp.cx9a2a_c32r128
0.000	1.512	90.550	7.418	0.516	0.004	0.001	0.000	0.000	0.000	0.435	pg17beta3_o2nofp.cx9a2a_c32r128
0.000	1.711	90.375	7.379	0.530	0.005	0.001	0.000	0.000	0.000	0.696	pg17rc1_o2nofp.cx9a2a_c32r128
Delete response time histogram
256us	1ms	4ms	16ms	64ms	256ms	1s	4s	16s	gt	max	tag
0.000	0.005	0.552	35.507	63.141	0.112	0.683	0.000	0.000	0.000	0.461	my5651_rel_o2nofp.cz11a_c32r128
0.000	0.001	0.350	97.725	0.931	0.395	0.598	0.000	0.000	0.000	0.309	my5744_rel_o2nofp.cz11a_c32r128
0.000	nonzero	67.917	31.686	0.317	0.080	nonzero	0.000	0.000	0.000	0.311	my8039_rel_o2nofp.cz11a_c32r128
0.000	17.343	79.280	3.103	0.270	0.004	0.000	0.000	0.000	0.000	0.236	pg158_o2nofp.cx9a2a_c32r128
0.000	17.560	79.204	3.000	0.233	0.003	0.000	0.000	0.000	0.000	0.145	pg164_o2nofp.cx9a2a_c32r128
0.000	22.012	74.851	2.899	0.235	0.003	nonzero	0.000	0.000	0.000	0.432	pg17beta3_o2nofp.cx9a2a_c32r128
0.000	21.586	75.302	2.879	0.229	0.003	nonzero	0.000	0.000	0.000	0.692	pg17rc1_o2nofp.cx9a2a_c32r128
l.i2
- l.i2: continue load after secondary indexes created with 5 inserts per transaction
- Legend for results is here.
- Each entry lists the percentage of responses that fit in that bucket (slower than max time for previous bucket, faster than min time for next bucket).
Insert response time histogram
256us	1ms	4ms	16ms	64ms	256ms	1s	4s	16s	gt	max	tag
0.014	2.069	86.750	10.239	0.927	0.001	0.000	0.000	0.000	0.000	0.092	my5651_rel_o2nofp.cz11a_c32r128
0.049	42.110	55.760	1.629	0.446	0.007	0.000	0.000	0.000	0.000	0.163	my5744_rel_o2nofp.cz11a_c32r128
0.064	78.666	19.292	1.966	0.003	0.008	0.000	0.000	0.000	0.000	0.194	my8039_rel_o2nofp.cz11a_c32r128
86.515	12.707	0.759	0.018	nonzero	0.000	0.000	0.000	0.000	0.000	0.032	pg158_o2nofp.cx9a2a_c32r128
86.882	12.298	0.800	0.019	nonzero	nonzero	0.000	0.000	0.000	0.000	0.072	pg164_o2nofp.cx9a2a_c32r128
89.994	9.644	0.345	0.017	nonzero	0.000	0.000	0.000	0.000	0.000	0.060	pg17beta3_o2nofp.cx9a2a_c32r128
90.301	9.346	0.340	0.013	nonzero	nonzero	0.000	0.000	0.000	0.000	0.064	pg17rc1_o2nofp.cx9a2a_c32r128
Delete response time histogram
256us	1ms	4ms	16ms	64ms	256ms	1s	4s	16s	gt	max	tag
0.016	2.462	86.728	9.868	0.925	0.001	0.000	0.000	0.000	0.000	0.093	my5651_rel_o2nofp.cz11a_c32r128
0.044	25.552	71.722	2.229	0.446	0.007	0.000	0.000	0.000	0.000	0.162	my5744_rel_o2nofp.cz11a_c32r128
0.057	78.865	19.118	1.948	0.003	0.008	0.000	0.000	0.000	0.000	0.185	my8039_rel_o2nofp.cz11a_c32r128
2.689	47.820	49.470	0.021	nonzero	0.000	0.000	0.000	0.000	0.000	0.026	pg158_o2nofp.cx9a2a_c32r128
2.912	47.843	49.218	0.026	0.001	nonzero	0.000	0.000	0.000	0.000	0.073	pg164_o2nofp.cx9a2a_c32r128
3.694	58.911	37.332	0.063	0.001	0.000	0.000	0.000	0.000	0.000	0.061	pg17beta3_o2nofp.cx9a2a_c32r128
3.545	57.307	39.092	0.055	0.001	nonzero	0.000	0.000	0.000	0.000	0.064	pg17rc1_o2nofp.cx9a2a_c32r128
qr100.L1
- qr100.L1: range queries with 100 insert/s per client
- Legend for results is here.
- Each entry lists the percentage of responses that fit in that bucket (slower than max time for previous bucket, faster than min time for next bucket).
Query response time histogram
256us	1ms	4ms	16ms	64ms	256ms	1s	4s	16s	gt	max	tag
99.957	0.037	0.005	nonzero	nonzero	0.000	0.000	0.000	0.000	0.000	0.021	my5651_rel_o2nofp.cz11a_c32r128
99.991	0.007	0.002	nonzero	nonzero	0.000	0.000	0.000	0.000	0.000	0.019	my5744_rel_o2nofp.cz11a_c32r128
99.983	0.015	0.002	nonzero	0.000	0.000	0.000	0.000	0.000	0.000	0.016	my8039_rel_o2nofp.cz11a_c32r128
99.997	0.002	0.001	nonzero	nonzero	0.000	0.000	0.000	0.000	0.000	0.017	pg158_o2nofp.cx9a2a_c32r128
99.997	0.002	0.001	nonzero	0.000	0.000	0.000	0.000	0.000	0.000	0.010	pg164_o2nofp.cx9a2a_c32r128
99.997	0.002	0.001	nonzero	nonzero	0.000	0.000	0.000	0.000	0.000	0.028	pg17beta3_o2nofp.cx9a2a_c32r128
99.996	0.002	0.001	nonzero	0.000	0.000	0.000	0.000	0.000	0.000	0.012	pg17rc1_o2nofp.cx9a2a_c32r128
Insert response time histogram
256us	1ms	4ms	16ms	64ms	256ms	1s	4s	16s	gt	max	tag
0.000	0.000	42.160	56.356	1.485	0.000	0.000	0.000	0.000	0.000	0.032	my5651_rel_o2nofp.cz11a_c32r128
0.000	0.000	98.861	1.139	0.000	0.000	0.000	0.000	0.000	0.000	0.012	my5744_rel_o2nofp.cz11a_c32r128
0.000	0.000	96.807	3.181	0.013	0.000	0.000	0.000	0.000	0.000	0.017	my8039_rel_o2nofp.cz11a_c32r128
0.000	0.000	99.612	0.383	0.004	0.000	0.000	0.000	0.000	0.000	0.023	pg158_o2nofp.cx9a2a_c32r128
0.000	0.001	99.672	0.326	0.000	0.000	0.000	0.000	0.000	0.000	0.011	pg164_o2nofp.cx9a2a_c32r128
0.000	0.001	99.688	0.307	0.004	0.000	0.000	0.000	0.000	0.000	0.029	pg17beta3_o2nofp.cx9a2a_c32r128
0.000	0.004	99.722	0.268	0.006	0.000	0.000	0.000	0.000	0.000	0.023	pg17rc1_o2nofp.cx9a2a_c32r128
Delete response time histogram
256us	1ms	4ms	16ms	64ms	256ms	1s	4s	16s	gt	max	tag
0.000	0.019	54.632	44.474	0.875	0.000	0.000	0.000	0.000	0.000	0.036	my5651_rel_o2nofp.cz11a_c32r128
0.000	0.082	99.336	0.582	0.000	0.000	0.000	0.000	0.000	0.000	0.012	my5744_rel_o2nofp.cz11a_c32r128
0.000	0.013	97.826	2.150	0.011	0.000	0.000	0.000	0.000	0.000	0.019	my8039_rel_o2nofp.cz11a_c32r128
0.000	66.736	33.233	0.029	0.001	0.000	0.000	0.000	0.000	0.000	0.023	pg158_o2nofp.cx9a2a_c32r128
0.000	69.793	30.185	0.022	0.000	0.000	0.000	0.000	0.000	0.000	0.006	pg164_o2nofp.cx9a2a_c32r128
0.000	68.083	31.897	0.017	0.003	0.000	0.000	0.000	0.000	0.000	0.029	pg17beta3_o2nofp.cx9a2a_c32r128
0.000	67.436	32.539	0.021	0.004	0.000	0.000	0.000	0.000	0.000	0.025	pg17rc1_o2nofp.cx9a2a_c32r128
qp100.L2
- qp100.L2: point queries with 100 insert/s per client
- Legend for results is here.
- Each entry lists the percentage of responses that fit in that bucket (slower than max time for previous bucket, faster than min time for next bucket).
Query response time histogram
256us	1ms	4ms	16ms	64ms	256ms	1s	4s	16s	gt	max	tag
99.805	0.184	0.010	nonzero	0.000	0.000	0.000	0.000	0.000	0.000	0.010	my5651_rel_o2nofp.cz11a_c32r128
99.435	0.560	0.005	nonzero	0.000	0.000	0.000	0.000	0.000	0.000	0.015	my5744_rel_o2nofp.cz11a_c32r128
99.183	0.807	0.009	nonzero	0.000	0.000	0.000	0.000	0.000	0.000	0.012	my8039_rel_o2nofp.cz11a_c32r128
99.702	0.237	0.062	nonzero	0.000	0.000	0.000	0.000	0.000	0.000	0.012	pg158_o2nofp.cx9a2a_c32r128
99.706	0.228	0.066	nonzero	0.000	0.000	0.000	0.000	0.000	0.000	0.007	pg164_o2nofp.cx9a2a_c32r128
99.717	0.220	0.062	nonzero	0.000	0.000	0.000	0.000	0.000	0.000	0.009	pg17beta3_o2nofp.cx9a2a_c32r128
99.711	0.225	0.064	nonzero	0.000	0.000	0.000	0.000	0.000	0.000	0.008	pg17rc1_o2nofp.cx9a2a_c32r128
Insert response time histogram
256us	1ms	4ms	16ms	64ms	256ms	1s	4s	16s	gt	max	tag
0.000	0.000	29.361	70.160	0.479	0.000	0.000	0.000	0.000	0.000	0.047	my5651_rel_o2nofp.cz11a_c32r128
0.000	0.000	99.731	0.269	0.000	0.000	0.000	0.000	0.000	0.000	0.011	my5744_rel_o2nofp.cz11a_c32r128
0.000	0.000	99.008	0.992	0.000	0.000	0.000	0.000	0.000	0.000	0.012	my8039_rel_o2nofp.cz11a_c32r128
0.000	0.000	99.492	0.508	0.000	0.000	0.000	0.000	0.000	0.000	0.013	pg158_o2nofp.cx9a2a_c32r128
0.000	0.000	99.656	0.344	0.000	0.000	0.000	0.000	0.000	0.000	0.009	pg164_o2nofp.cx9a2a_c32r128
0.000	0.000	99.656	0.344	0.000	0.000	0.000	0.000	0.000	0.000	0.011	pg17beta3_o2nofp.cx9a2a_c32r128
0.000	0.000	99.643	0.357	0.000	0.000	0.000	0.000	0.000	0.000	0.009	pg17rc1_o2nofp.cx9a2a_c32r128
Delete response time histogram
256us	1ms	4ms	16ms	64ms	256ms	1s	4s	16s	gt	max	tag
0.000	0.014	39.149	60.550	0.287	0.000	0.000	0.000	0.000	0.000	0.046	my5651_rel_o2nofp.cz11a_c32r128
0.000	0.707	99.158	0.135	0.000	0.000	0.000	0.000	0.000	0.000	0.009	my5744_rel_o2nofp.cz11a_c32r128
0.000	0.000	99.476	0.524	0.000	0.000	0.000	0.000	0.000	0.000	0.011	my8039_rel_o2nofp.cz11a_c32r128
0.000	7.032	92.865	0.103	0.000	0.000	0.000	0.000	0.000	0.000	0.011	pg158_o2nofp.cx9a2a_c32r128
0.000	1.781	98.133	0.086	0.000	0.000	0.000	0.000	0.000	0.000	0.009	pg164_o2nofp.cx9a2a_c32r128
0.000	21.272	78.643	0.085	0.000	0.000	0.000	0.000	0.000	0.000	0.010	pg17beta3_o2nofp.cx9a2a_c32r128
0.000	1.146	98.768	0.086	0.000	0.000	0.000	0.000	0.000	0.000	0.009	pg17rc1_o2nofp.cx9a2a_c32r128
qr500.L3
- qr500.L3: range queries with 500 insert/s per client
- Legend for results is here.
- Each entry lists the percentage of responses that fit in that bucket (slower than max time for previous bucket, faster than min time for next bucket).
Query response time histogram
256us	1ms	4ms	16ms	64ms	256ms	1s	4s	16s	gt	max	tag
99.617	0.318	0.058	0.007	nonzero	0.000	0.000	0.000	0.000	0.000	0.017	my5651_rel_o2nofp.cz11a_c32r128
99.976	0.014	0.008	0.002	nonzero	0.000	0.000	0.000	0.000	0.000	0.026	my5744_rel_o2nofp.cz11a_c32r128
99.964	0.024	0.011	0.001	nonzero	0.000	0.000	0.000	0.000	0.000	0.032	my8039_rel_o2nofp.cz11a_c32r128
99.987	0.006	0.007	nonzero	nonzero	0.000	0.000	0.000	0.000	0.000	0.060	pg158_o2nofp.cx9a2a_c32r128
99.987	0.006	0.007	nonzero	nonzero	nonzero	0.000	0.000	0.000	0.000	0.077	pg164_o2nofp.cx9a2a_c32r128
99.987	0.006	0.007	nonzero	nonzero	0.000	0.000	0.000	0.000	0.000	0.026	pg17beta3_o2nofp.cx9a2a_c32r128
99.987	0.006	0.007	nonzero	nonzero	nonzero	0.000	0.000	0.000	0.000	0.084	pg17rc1_o2nofp.cx9a2a_c32r128
Insert response time histogram
256us	1ms	4ms	16ms	64ms	256ms	1s	4s	16s	gt	max	tag
0.000	0.001	6.869	70.279	22.851	0.000	0.000	0.000	0.000	0.000	0.049	my5651_rel_o2nofp.cz11a_c32r128
0.000	nonzero	74.985	24.509	0.505	0.000	0.000	0.000	0.000	0.000	0.040	my5744_rel_o2nofp.cz11a_c32r128
0.000	0.000	75.498	24.081	0.420	0.000	0.000	0.000	0.000	0.000	0.035	my8039_rel_o2nofp.cz11a_c32r128
0.000	4.269	94.575	1.127	0.028	0.000	0.000	0.000	0.000	0.000	0.033	pg158_o2nofp.cx9a2a_c32r128
0.000	4.631	94.353	0.975	0.041	0.000	0.000	0.000	0.000	0.000	0.038	pg164_o2nofp.cx9a2a_c32r128
0.000	10.606	88.368	0.985	0.041	0.000	0.000	0.000	0.000	0.000	0.036	pg17beta3_o2nofp.cx9a2a_c32r128
0.000	8.110	90.932	0.930	0.028	0.000	0.000	0.000	0.000	0.000	0.037	pg17rc1_o2nofp.cx9a2a_c32r128
Delete response time histogram
256us	1ms	4ms	16ms	64ms	256ms	1s	4s	16s	gt	max	tag
0.000	0.005	8.737	71.314	19.944	0.000	0.000	0.000	0.000	0.000	0.049	my5651_rel_o2nofp.cz11a_c32r128
0.000	0.048	78.964	20.572	0.416	0.000	0.000	0.000	0.000	0.000	0.043	my5744_rel_o2nofp.cz11a_c32r128
0.000	0.024	81.699	17.979	0.298	0.000	0.000	0.000	0.000	0.000	0.035	my8039_rel_o2nofp.cz11a_c32r128
0.000	49.923	49.333	0.736	0.009	0.000	0.000	0.000	0.000	0.000	0.032	pg158_o2nofp.cx9a2a_c32r128
0.000	50.872	48.481	0.629	0.019	0.000	0.000	0.000	0.000	0.000	0.026	pg164_o2nofp.cx9a2a_c32r128
0.000	54.559	44.807	0.618	0.016	0.000	0.000	0.000	0.000	0.000	0.025	pg17beta3_o2nofp.cx9a2a_c32r128
0.000	53.090	46.301	0.597	0.011	0.000	0.000	0.000	0.000	0.000	0.037	pg17rc1_o2nofp.cx9a2a_c32r128
qp500.L4
- qp500.L4: point queries with 500 insert/s per client
- Legend for results is here.
- Each entry lists the percentage of responses that fit in that bucket (slower than max time for previous bucket, faster than min time for next bucket).
Query response time histogram
256us	1ms	4ms	16ms	64ms	256ms	1s	4s	16s	gt	max	tag
99.100	0.820	0.073	0.008	nonzero	0.000	0.000	0.000	0.000	0.000	0.020	my5651_rel_o2nofp.cz11a_c32r128
99.195	0.765	0.033	0.007	nonzero	0.000	0.000	0.000	0.000	0.000	0.025	my5744_rel_o2nofp.cz11a_c32r128
99.011	0.923	0.061	0.005	nonzero	0.000	0.000	0.000	0.000	0.000	0.034	my8039_rel_o2nofp.cz11a_c32r128
99.631	0.282	0.086	0.001	nonzero	nonzero	0.000	0.000	0.000	0.000	0.067	pg158_o2nofp.cx9a2a_c32r128
99.628	0.279	0.092	0.001	nonzero	nonzero	0.000	0.000	0.000	0.000	0.067	pg164_o2nofp.cx9a2a_c32r128
99.640	0.271	0.088	0.001	nonzero	nonzero	0.000	0.000	0.000	0.000	0.095	pg17beta3_o2nofp.cx9a2a_c32r128
99.639	0.273	0.088	0.001	nonzero	nonzero	0.000	0.000	0.000	0.000	0.070	pg17rc1_o2nofp.cx9a2a_c32r128
Insert response time histogram
256us	1ms	4ms	16ms	64ms	256ms	1s	4s	16s	gt	max	tag
0.000	0.001	6.611	73.270	20.118	0.000	0.000	0.000	0.000	0.000	0.053	my5651_rel_o2nofp.cz11a_c32r128
0.000	0.002	66.457	33.118	0.422	0.000	0.000	0.000	0.000	0.000	0.036	my5744_rel_o2nofp.cz11a_c32r128
0.000	0.000	83.015	16.877	0.108	0.000	0.000	0.000	0.000	0.000	0.031	my8039_rel_o2nofp.cz11a_c32r128
0.000	0.987	98.097	0.893	0.024	0.000	0.000	0.000	0.000	0.000	0.038	pg158_o2nofp.cx9a2a_c32r128
0.000	1.033	97.948	0.999	0.020	0.000	0.000	0.000	0.000	0.000	0.038	pg164_o2nofp.cx9a2a_c32r128
0.000	5.746	93.351	0.892	0.011	0.000	0.000	0.000	0.000	0.000	0.029	pg17beta3_o2nofp.cx9a2a_c32r128
0.000	3.521	95.626	0.841	0.012	0.000	0.000	0.000	0.000	0.000	0.036	pg17rc1_o2nofp.cx9a2a_c32r128
Delete response time histogram
256us	1ms	4ms	16ms	64ms	256ms	1s	4s	16s	gt	max	tag
0.000	0.010	8.719	74.267	17.004	0.000	0.000	0.000	0.000	0.000	0.053	my5651_rel_o2nofp.cz11a_c32r128
0.000	0.079	71.949	27.621	0.352	0.000	0.000	0.000	0.000	0.000	0.038	my5744_rel_o2nofp.cz11a_c32r128
0.000	0.006	87.864	12.053	0.077	0.000	0.000	0.000	0.000	0.000	0.023	my8039_rel_o2nofp.cz11a_c32r128
0.000	39.161	60.248	0.568	0.022	0.000	0.000	0.000	0.000	0.000	0.035	pg158_o2nofp.cx9a2a_c32r128
0.000	39.716	59.617	0.649	0.017	0.000	0.000	0.000	0.000	0.000	0.038	pg164_o2nofp.cx9a2a_c32r128
0.000	45.576	53.773	0.642	0.009	0.000	0.000	0.000	0.000	0.000	0.025	pg17beta3_o2nofp.cx9a2a_c32r128
0.000	43.856	55.607	0.526	0.012	0.000	0.000	0.000	0.000	0.000	0.034	pg17rc1_o2nofp.cx9a2a_c32r128
qr1000.L5
- qr1000.L5: range queries with 1000 insert/s per client
- Legend for results is here.
- Each entry lists the percentage of responses that fit in that bucket (slower than max time for previous bucket, faster than min time for next bucket).
Query response time histogram
256us	1ms	4ms	16ms	64ms	256ms	1s	4s	16s	gt	max	tag
98.874	0.956	0.152	0.018	nonzero	0.000	0.000	0.000	0.000	0.000	0.038	my5651_rel_o2nofp.cz11a_c32r128
99.904	0.057	0.028	0.010	nonzero	0.000	0.000	0.000	0.000	0.000	0.026	my5744_rel_o2nofp.cz11a_c32r128
99.910	0.056	0.032	0.002	nonzero	0.000	0.000	0.000	0.000	0.000	0.032	my8039_rel_o2nofp.cz11a_c32r128
99.977	0.011	0.012	nonzero	nonzero	nonzero	0.000	0.000	0.000	0.000	0.088	pg158_o2nofp.cx9a2a_c32r128
99.978	0.011	0.011	nonzero	nonzero	nonzero	0.000	0.000	0.000	0.000	0.095	pg164_o2nofp.cx9a2a_c32r128
99.977	0.012	0.011	nonzero	nonzero	nonzero	0.000	0.000	0.000	0.000	0.086	pg17beta3_o2nofp.cx9a2a_c32r128
99.977	0.012	0.011	nonzero	nonzero	nonzero	0.000	0.000	0.000	0.000	0.080	pg17rc1_o2nofp.cx9a2a_c32r128
Insert response time histogram
256us	1ms	4ms	16ms	64ms	256ms	1s	4s	16s	gt	max	tag
0.000	0.001	3.242	64.739	32.019	0.000	0.000	0.000	0.000	0.000	0.056	my5651_rel_o2nofp.cz11a_c32r128
0.000	0.002	28.402	68.093	3.503	0.000	0.000	0.000	0.000	0.000	0.049	my5744_rel_o2nofp.cz11a_c32r128
0.000	0.000	53.092	45.807	1.101	0.000	0.000	0.000	0.000	0.000	0.054	my8039_rel_o2nofp.cz11a_c32r128
0.000	19.989	79.266	0.736	0.008	0.000	0.000	0.000	0.000	0.000	0.031	pg158_o2nofp.cx9a2a_c32r128
0.000	17.020	82.349	0.626	0.006	0.000	0.000	0.000	0.000	0.000	0.032	pg164_o2nofp.cx9a2a_c32r128
0.000	33.402	66.059	0.534	0.004	0.000	0.000	0.000	0.000	0.000	0.049	pg17beta3_o2nofp.cx9a2a_c32r128
0.000	26.222	73.229	0.541	0.008	0.000	0.000	0.000	0.000	0.000	0.032	pg17rc1_o2nofp.cx9a2a_c32r128
Delete response time histogram
256us	1ms	4ms	16ms	64ms	256ms	1s	4s	16s	gt	max	tag
0.000	0.005	3.607	67.316	29.072	0.000	0.000	0.000	0.000	0.000	0.058	my5651_rel_o2nofp.cz11a_c32r128
0.000	0.053	31.827	64.526	3.594	0.000	0.000	0.000	0.000	0.000	0.051	my5744_rel_o2nofp.cz11a_c32r128
0.000	0.016	60.393	38.761	0.831	0.000	0.000	0.000	0.000	0.000	0.057	my8039_rel_o2nofp.cz11a_c32r128
0.000	46.709	52.902	0.384	0.004	0.000	0.000	0.000	0.000	0.000	0.027	pg158_o2nofp.cx9a2a_c32r128
0.000	48.999	50.674	0.326	0.002	0.000	0.000	0.000	0.000	0.000	0.030	pg164_o2nofp.cx9a2a_c32r128
0.000	55.202	44.494	0.302	0.002	0.000	0.000	0.000	0.000	0.000	0.027	pg17beta3_o2nofp.cx9a2a_c32r128
0.000	53.693	45.996	0.308	0.003	0.000	0.000	0.000	0.000	0.000	0.031	pg17rc1_o2nofp.cx9a2a_c32r128
qp1000.L6
- qp1000.L6: point queries with 1000 insert/s per client
- Legend for results is here.
- Each entry lists the percentage of responses that fit in that bucket (slower than max time for previous bucket, faster than min time for next bucket).
Query response time histogram
256us	1ms	4ms	16ms	64ms	256ms	1s	4s	16s	gt	max	tag
99.105	0.800	0.074	0.022	nonzero	0.000	0.000	0.000	0.000	0.000	0.040	my5651_rel_o2nofp.cz11a_c32r128
98.542	1.306	0.123	0.028	nonzero	0.000	0.000	0.000	0.000	0.000	0.036	my5744_rel_o2nofp.cz11a_c32r128
98.242	1.585	0.164	0.009	nonzero	0.000	0.000	0.000	0.000	0.000	0.028	my8039_rel_o2nofp.cz11a_c32r128
99.493	0.380	0.125	0.002	nonzero	nonzero	0.000	0.000	0.000	0.000	0.090	pg158_o2nofp.cx9a2a_c32r128
99.499	0.371	0.128	0.002	nonzero	nonzero	0.000	0.000	0.000	0.000	0.091	pg164_o2nofp.cx9a2a_c32r128
99.510	0.365	0.123	0.002	nonzero	nonzero	0.000	0.000	0.000	0.000	0.096	pg17beta3_o2nofp.cx9a2a_c32r128
99.505	0.368	0.124	0.002	nonzero	nonzero	0.000	0.000	0.000	0.000	0.101	pg17rc1_o2nofp.cx9a2a_c32r128
Insert response time histogram
256us	1ms	4ms	16ms	64ms	256ms	1s	4s	16s	gt	max	tag
0.000	nonzero	3.439	66.589	29.970	0.001	0.000	0.000	0.000	0.000	0.080	my5651_rel_o2nofp.cz11a_c32r128
0.000	0.002	22.457	74.919	2.623	0.000	0.000	0.000	0.000	0.000	0.053	my5744_rel_o2nofp.cz11a_c32r128
0.000	0.000	57.946	41.692	0.362	0.000	0.000	0.000	0.000	0.000	0.051	my8039_rel_o2nofp.cz11a_c32r128
0.000	2.919	95.627	1.406	0.049	0.000	0.000	0.000	0.000	0.000	0.055	pg158_o2nofp.cx9a2a_c32r128
0.000	3.185	95.520	1.246	0.049	0.000	0.000	0.000	0.000	0.000	0.044	pg164_o2nofp.cx9a2a_c32r128
0.000	17.112	81.704	1.137	0.048	0.000	0.000	0.000	0.000	0.000	0.051	pg17beta3_o2nofp.cx9a2a_c32r128
0.000	4.969	93.879	1.104	0.048	0.000	0.000	0.000	0.000	0.000	0.052	pg17rc1_o2nofp.cx9a2a_c32r128
Delete response time histogram
256us	1ms	4ms	16ms	64ms	256ms	1s	4s	16s	gt	max	tag
0.000	0.004	3.702	69.113	27.179	0.002	0.000	0.000	0.000	0.000	0.081	my5651_rel_o2nofp.cz11a_c32r128
0.000	0.050	27.130	70.058	2.762	0.000	0.000	0.000	0.000	0.000	0.052	my5744_rel_o2nofp.cz11a_c32r128
0.000	0.007	65.515	34.192	0.286	nonzero	0.000	0.000	0.000	0.000	0.069	my8039_rel_o2nofp.cz11a_c32r128
0.000	47.162	51.858	0.955	0.026	0.000	0.000	0.000	0.000	0.000	0.037	pg158_o2nofp.cx9a2a_c32r128
0.000	48.901	50.198	0.872	0.029	0.000	0.000	0.000	0.000	0.000	0.040	pg164_o2nofp.cx9a2a_c32r128
0.000	54.234	44.914	0.831	0.022	0.000	0.000	0.000	0.000	0.000	0.029	pg17beta3_o2nofp.cx9a2a_c32r128
0.000	50.960	48.168	0.844	0.029	0.000	0.000	0.000	0.000	0.000	0.036	pg17rc1_o2nofp.cx9a2a_c32r128