Introduction
This is a report for the insert benchmark with 1280M docs and 20 client(s). It is generated by scripts (bash, awk, sed) and Tufte might not be impressed. An overview of the insert benchmark is here and a short update is here. Below, by DBMS, I mean DBMS+version.config. An example is my8020.c10b40 where my means MySQL, 8020 is version 8.0.20 and c10b40 is the name for the configuration file.
The test server is an ax162-s from Hetzner (see here) with 48 cores, AMD SMT disabled, 128G RAM and ext4 using 2 NVMe devices with SW RAID 1. The benchmark was run with 20 clients and there were 1 or 3 connections per client (1 for queries or inserts without rate limits, 1+1 for rate limited inserts+deletes). It uses 8 tables with a table per client. It loads 64M rows per table without secondary indexes, creates 3 secondary indexes per table, then inserts 4m+1m rows per table with a delete per insert to avoid growing the table. It then does 6 read+write tests for 1800s each that do queries as fast as possible with 100,100,500,500,1000,1000 inserts/s and the same for deletes/s per client concurrent with the queries. The database is larger than memory. Clients and the DBMS share one server.
The tested DBMS are:
- my5651_rel_o2nofp.cz11a_c32r128 - MySQL 5.6.51 compilred with CMAKE_BUILD_TYPE=Release, -O2 and frame pointers using the z11a_c32r128 config
- my5744_rel_o2nofp.cz11a_c32r128 - MySQL 5.7.44 compilred with CMAKE_BUILD_TYPE=Release, -O2 and frame pointers using the z11a_c32r128 config
- my8039_rel_o2nofp.cz11a_c32r128 - MySQL 8.0.39 compilred with CMAKE_BUILD_TYPE=Release, -O2 and frame pointers using the z11a_c32r128 config
- pg158_o2nofp.cx9a2a_c32r128 - Postgres 15.8 compiled with -O2 and frame pointers using the x9a2a_c32r128 config
- pg164_o2nofp.cx9a2a_c32r128 - Postgres 16.4 compiled with -O2 and frame pointers using the x9a2a_c32r128 config
- pg17beta3_o2nofp.cx9a2a_c32r128 - Postgres 17 beta3 compiled with -O2 and frame pointers using the x9a2a_c32r128 config
- pg17rc1_o2nofp.cx9a2a_c32r128 - Postgres 17 rc1 compiled with -O2 and frame pointers using the x9a2a_c32r128 config
Contents
- Summary
- l.i0: load without secondary indexes
- l.x: create secondary indexes
- l.i1: continue load after secondary indexes created with 50 inserts per transaction
- l.i2: continue load after secondary indexes created with 5 inserts per transaction
- qr100.L1: range queries with 100 insert/s per client
- qp100.L2: point queries with 100 insert/s per client
- qr500.L3: range queries with 500 insert/s per client
- qp500.L4: point queries with 500 insert/s per client
- qr1000.L5: range queries with 1000 insert/s per client
- qp1000.L6: point queries with 1000 insert/s per client
Summary
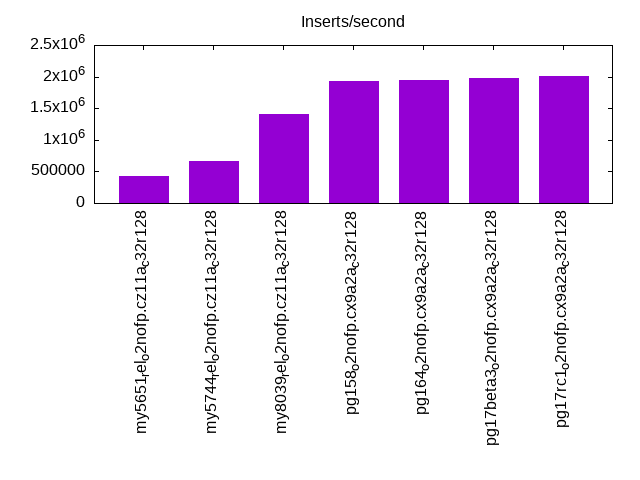
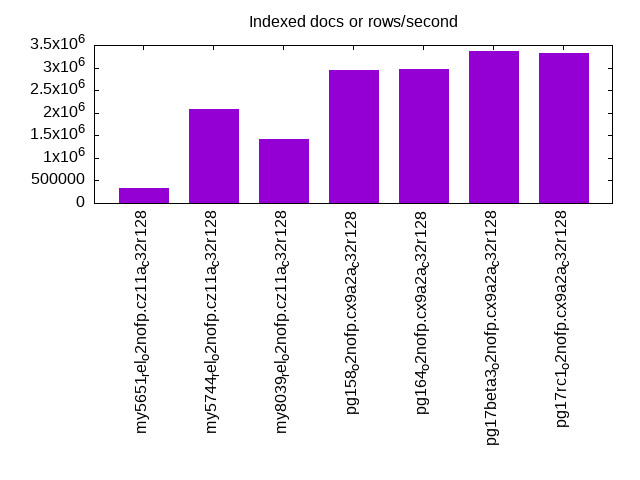
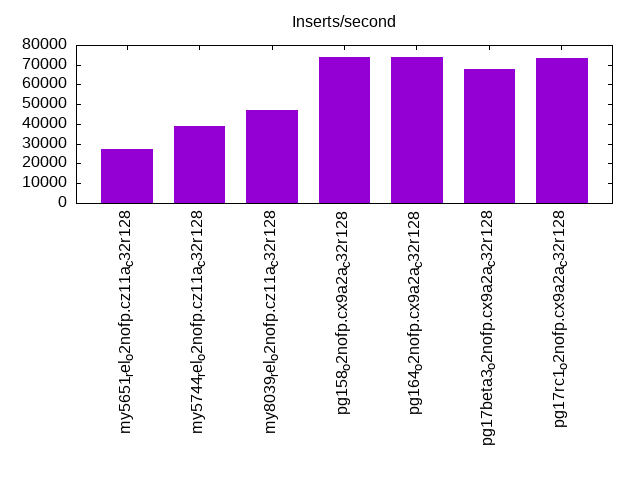
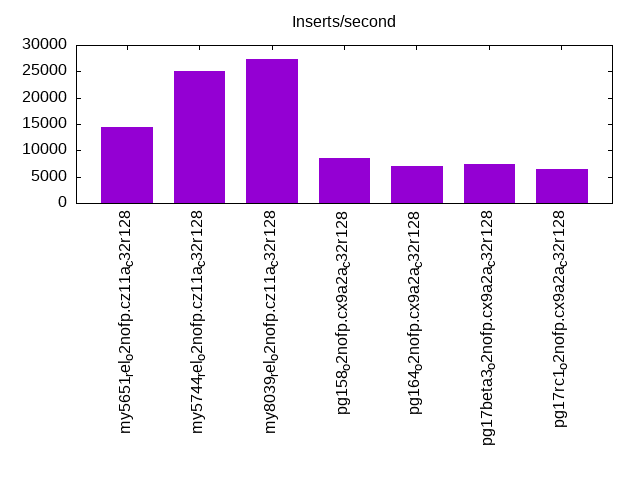
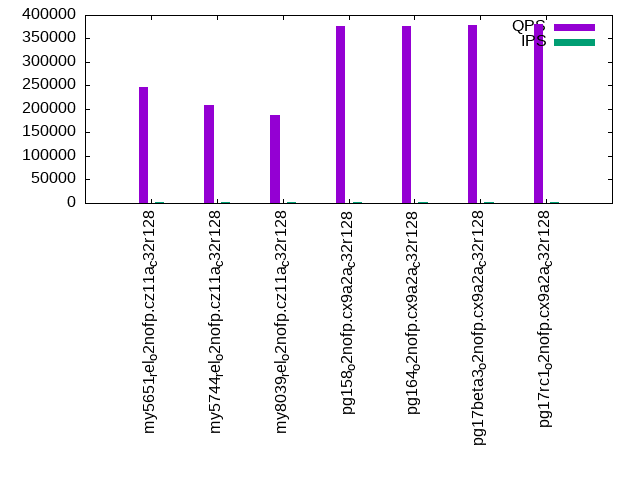
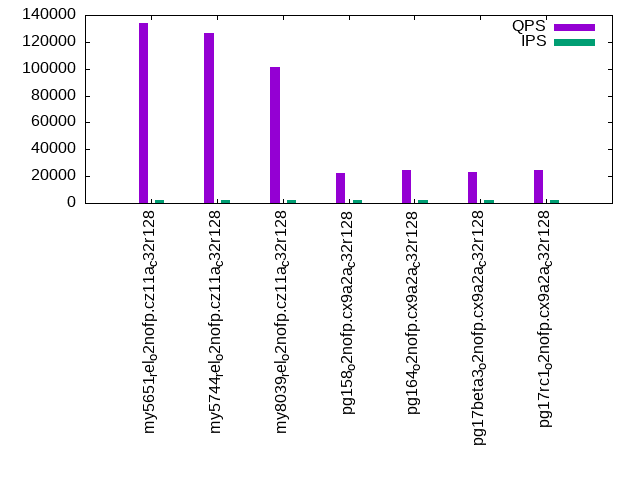
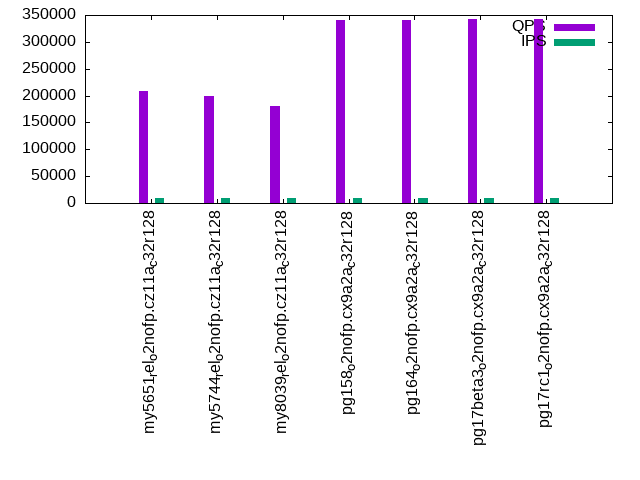
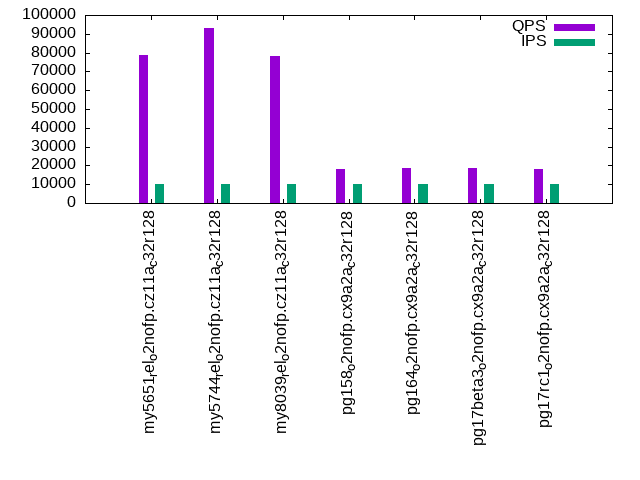
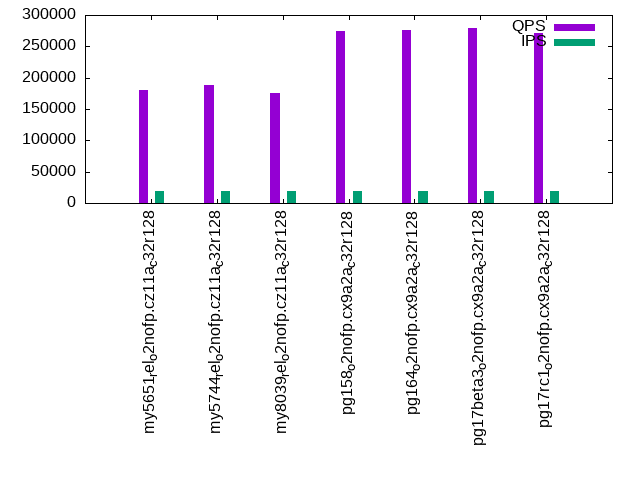
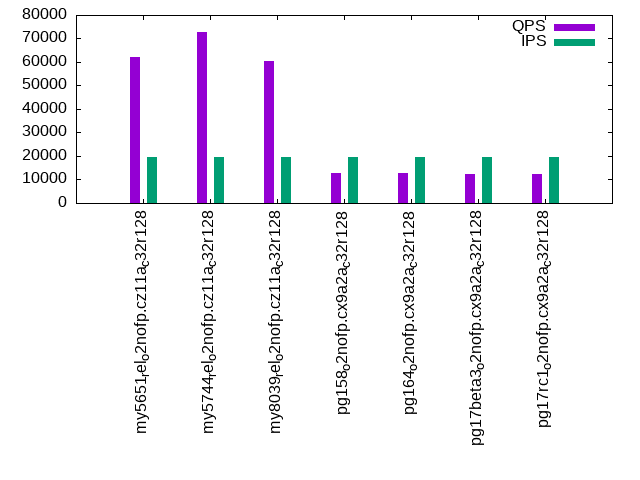
The numbers are inserts/s for l.i0, l.i1 and l.i2, indexed docs (or rows) /s for l.x and queries/s for qr100, qp100 thru qr1000, qp1000" The values are the average rate over the entire test for inserts (IPS) and queries (QPS). The range of values for IPS and QPS is split into 3 parts: bottom 25%, middle 50%, top 25%. Values in the bottom 25% have a red background, values in the top 25% have a green background and values in the middle have no color. A gray background is used for values that can be ignored because the DBMS did not sustain the target insert rate. Red backgrounds are not used when the minimum value is within 80% of the max value.
| dbms | l.i0 | l.x | l.i1 | l.i2 | qr100 | qp100 | qr500 | qp500 | qr1000 | qp1000 |
|---|---|---|---|---|---|---|---|---|---|---|
| my5651_rel_o2nofp.cz11a_c32r128 | 429386 | 330493 | 27586 | 14347 | 246113 | 133990 | 209293 | 78923 | 180610 | 62268 |
| my5744_rel_o2nofp.cz11a_c32r128 | 663556 | 2074554 | 39062 | 25000 | 208125 | 126652 | 198302 | 93297 | 188379 | 72669 |
| my8039_rel_o2nofp.cz11a_c32r128 | 1409692 | 1426979 | 46838 | 27397 | 187093 | 101646 | 181244 | 78424 | 175950 | 60585 |
| pg158_o2nofp.cx9a2a_c32r128 | 1936460 | 2942529 | 73937 | 8532 | 376934 | 22038 | 341294 | 18255 | 274450 | 12827 |
| pg164_o2nofp.cx9a2a_c32r128 | 1951220 | 2976744 | 73801 | 7015 | 376412 | 24387 | 340022 | 18439 | 275278 | 12643 |
| pg17beta3_o2nofp.cx9a2a_c32r128 | 1972265 | 3368421 | 67969 | 7323 | 378857 | 22963 | 343246 | 18539 | 278876 | 12324 |
| pg17rc1_o2nofp.cx9a2a_c32r128 | 2006270 | 3316062 | 73529 | 6500 | 380459 | 24369 | 342689 | 18177 | 270542 | 12472 |
This table has relative throughput, throughput for the DBMS relative to the DBMS in the first line, using the absolute throughput from the previous table. Values less than 0.95 have a yellow background. Values greater than 1.05 have a blue background.
| dbms | l.i0 | l.x | l.i1 | l.i2 | qr100 | qp100 | qr500 | qp500 | qr1000 | qp1000 |
|---|---|---|---|---|---|---|---|---|---|---|
| my5651_rel_o2nofp.cz11a_c32r128 | 1.00 | 1.00 | 1.00 | 1.00 | 1.00 | 1.00 | 1.00 | 1.00 | 1.00 | 1.00 |
| my5744_rel_o2nofp.cz11a_c32r128 | 1.55 | 6.28 | 1.42 | 1.74 | 0.85 | 0.95 | 0.95 | 1.18 | 1.04 | 1.17 |
| my8039_rel_o2nofp.cz11a_c32r128 | 3.28 | 4.32 | 1.70 | 1.91 | 0.76 | 0.76 | 0.87 | 0.99 | 0.97 | 0.97 |
| pg158_o2nofp.cx9a2a_c32r128 | 4.51 | 8.90 | 2.68 | 0.59 | 1.53 | 0.16 | 1.63 | 0.23 | 1.52 | 0.21 |
| pg164_o2nofp.cx9a2a_c32r128 | 4.54 | 9.01 | 2.68 | 0.49 | 1.53 | 0.18 | 1.62 | 0.23 | 1.52 | 0.20 |
| pg17beta3_o2nofp.cx9a2a_c32r128 | 4.59 | 10.19 | 2.46 | 0.51 | 1.54 | 0.17 | 1.64 | 0.23 | 1.54 | 0.20 |
| pg17rc1_o2nofp.cx9a2a_c32r128 | 4.67 | 10.03 | 2.67 | 0.45 | 1.55 | 0.18 | 1.64 | 0.23 | 1.50 | 0.20 |
This lists the average rate of inserts/s for the tests that do inserts concurrent with queries. For such tests the query rate is listed in the table above. The read+write tests are setup so that the insert rate should match the target rate every second. Cells that are not at least 95% of the target have a red background to indicate a failure to satisfy the target.
| dbms | qr100.L1 | qp100.L2 | qr500.L3 | qp500.L4 | qr1000.L5 | qp1000.L6 |
|---|---|---|---|---|---|---|
| my5651_rel_o2nofp.cz11a_c32r128 | 1977 | 1976 | 9879 | 9885 | 19769 | 19769 |
| my5744_rel_o2nofp.cz11a_c32r128 | 1977 | 1976 | 9879 | 9885 | 19769 | 19769 |
| my8039_rel_o2nofp.cz11a_c32r128 | 1977 | 1977 | 9885 | 9885 | 19769 | 19769 |
| pg158_o2nofp.cx9a2a_c32r128 | 1977 | 1977 | 9868 | 9879 | 19672 | 19694 |
| pg164_o2nofp.cx9a2a_c32r128 | 1977 | 1977 | 9847 | 9868 | 19715 | 19651 |
| pg17beta3_o2nofp.cx9a2a_c32r128 | 1977 | 1976 | 9863 | 9879 | 19704 | 19715 |
| pg17rc1_o2nofp.cx9a2a_c32r128 | 1977 | 1977 | 9852 | 9879 | 19640 | 19661 |
| target | 2000 | 2000 | 10000 | 10000 | 20000 | 20000 |
l.i0
l.i0: load without secondary indexes. Graphs for performance per 1-second interval are here.
Average throughput:
Insert response time histogram: each cell has the percentage of responses that take <= the time in the header and max is the max response time in seconds. For the max column values in the top 25% of the range have a red background and in the bottom 25% of the range have a green background. The red background is not used when the min value is within 80% of the max value.
| dbms | 256us | 1ms | 4ms | 16ms | 64ms | 256ms | 1s | 4s | 16s | gt | max |
|---|---|---|---|---|---|---|---|---|---|---|---|
| my5651_rel_o2nofp.cz11a_c32r128 | 0.406 | 33.195 | 65.946 | 0.417 | 0.037 | 0.190 | |||||
| my5744_rel_o2nofp.cz11a_c32r128 | 0.400 | 99.363 | 0.190 | 0.010 | 0.037 | 0.178 | |||||
| my8039_rel_o2nofp.cz11a_c32r128 | 0.240 | 99.670 | 0.038 | 0.012 | 0.039 | 0.234 | |||||
| pg158_o2nofp.cx9a2a_c32r128 | 89.099 | 10.747 | 0.084 | 0.055 | 0.008 | 0.006 | 0.001 | 2.275 | |||
| pg164_o2nofp.cx9a2a_c32r128 | 87.870 | 11.971 | 0.086 | 0.059 | 0.008 | 0.006 | nonzero | 1.449 | |||
| pg17beta3_o2nofp.cx9a2a_c32r128 | 89.346 | 10.463 | 0.125 | 0.049 | 0.010 | 0.006 | nonzero | 1.245 | |||
| pg17rc1_o2nofp.cx9a2a_c32r128 | 90.440 | 9.379 | 0.115 | 0.049 | 0.010 | 0.007 | nonzero | 1.286 |
Performance metrics for the DBMS listed above. Some are normalized by throughput, others are not. Legend for results is here.
ips	qps	rps	rmbps	wps	wmbps	rpq	rkbpq	wpi	wkbpi	csps	cpups	cspq	cpupq	dbgb1	dbgb2	rss	maxop	p50	p99	tag
429386	0	989	3.9	2637.0	148.2	0.002	0.009	0.006	0.353	104379	40.3	0.243	45	84.4	184.9	89.9	0.190	23375	15583	my5651_rel_o2nofp.cz11a_c32r128
663556	0	0	0.0	4190.1	230.7	0.000	0.000	0.006	0.356	80348	45.5	0.121	33	84.4	184.9	91.2	0.178	33963	28469	my5744_rel_o2nofp.cz11a_c32r128
1409692	0	1	0.0	8763.5	503.7	0.000	0.000	0.006	0.366	291532	53.7	0.207	18	84.1	184.6	91.3	0.234	75219	60934	my8039_rel_o2nofp.cz11a_c32r128
1936460	0	265	2.8	8870.5	832.3	0.000	0.002	0.005	0.440	307077	56.1	0.159	14	122.5	218.5	17.5	2.275	107415	4795	pg158_o2nofp.cx9a2a_c32r128
1951220	0	229	1.8	8916.3	838.4	0.000	0.001	0.005	0.440	361847	55.7	0.185	14	122.5	218.5	10.1	1.449	108683	9140	pg164_o2nofp.cx9a2a_c32r128
1972265	0	241	2.0	9001.4	848.2	0.000	0.001	0.005	0.440	351303	55.2	0.178	13	122.5	218.5	25.2	1.245	110282	9290	pg17beta3_o2nofp.cx9a2a_c32r128
2006270	0	217	1.8	9140.8	859.6	0.000	0.001	0.005	0.439	349082	55.8	0.174	13	122.5	218.5	95.9	1.286	110856	17681	pg17rc1_o2nofp.cx9a2a_c32r128
l.x
l.x: create secondary indexes.
Average throughput:
Performance metrics for the DBMS listed above. Some are normalized by throughput, others are not. Legend for results is here.
ips	qps	rps	rmbps	wps	wmbps	rpq	rkbpq	wpi	wkbpi	csps	cpups	cspq	cpupq	dbgb1	dbgb2	rss	maxop	p50	p99	tag
330493	0	1509	47.7	17799.3	637.1	0.005	0.148	0.054	1.974	117330	36.1	0.355	52	178.4	278.9	107.2	0.003	NA	NA	my5651_rel_o2nofp.cz11a_c32r128
2074554	0	7346	913.5	33307.6	2072.8	0.004	0.451	0.016	1.023	216112	27.2	0.104	6	193.9	294.4	109.0	0.001	NA	NA	my5744_rel_o2nofp.cz11a_c32r128
1426979	0	12142	628.7	42868.5	1711.3	0.009	0.451	0.030	1.228	244963	69.6	0.172	23	193.3	293.9	108.0	0.008	NA	NA	my8039_rel_o2nofp.cz11a_c32r128
2942529	0	9077	556.6	8407.6	871.6	0.003	0.194	0.003	0.303	141800	22.8	0.048	4	245.9	342.0	18.0	0.002	NA	NA	pg158_o2nofp.cx9a2a_c32r128
2976744	0	9310	553.9	8567.3	882.1	0.003	0.191	0.003	0.303	152447	22.1	0.051	4	245.9	342.0	19.5	0.074	NA	NA	pg164_o2nofp.cx9a2a_c32r128
3368421	0	10370	637.2	9383.1	991.5	0.003	0.194	0.003	0.301	84592	23.8	0.025	3	245.9	341.9	17.1	0.002	NA	NA	pg17beta3_o2nofp.cx9a2a_c32r128
3316062	0	10364	647.9	9302.1	980.2	0.003	0.200	0.003	0.303	82090	24.0	0.025	3	245.9	341.9	18.0	0.002	NA	NA	pg17rc1_o2nofp.cx9a2a_c32r128
l.i1
l.i1: continue load after secondary indexes created with 50 inserts per transaction. Graphs for performance per 1-second interval are here.
Average throughput:
Insert response time histogram: each cell has the percentage of responses that take <= the time in the header and max is the max response time in seconds. For the max column values in the top 25% of the range have a red background and in the bottom 25% of the range have a green background. The red background is not used when the min value is within 80% of the max value.
| dbms | 256us | 1ms | 4ms | 16ms | 64ms | 256ms | 1s | 4s | 16s | gt | max |
|---|---|---|---|---|---|---|---|---|---|---|---|
| my5651_rel_o2nofp.cz11a_c32r128 | 1.161 | 28.206 | 63.883 | 0.665 | 6.086 | 0.511 | |||||
| my5744_rel_o2nofp.cz11a_c32r128 | 6.661 | 82.076 | 5.334 | 0.515 | 5.414 | 0.465 | |||||
| my8039_rel_o2nofp.cz11a_c32r128 | 16.810 | 31.385 | 50.462 | 1.229 | 0.114 | 0.626 | |||||
| pg158_o2nofp.cx9a2a_c32r128 | 0.582 | 75.621 | 11.599 | 12.059 | 0.118 | 0.021 | 0.001 | 1.507 | |||
| pg164_o2nofp.cx9a2a_c32r128 | 0.356 | 75.606 | 12.336 | 11.605 | 0.074 | 0.021 | 0.003 | 1.802 | |||
| pg17beta3_o2nofp.cx9a2a_c32r128 | 0.743 | 75.187 | 11.551 | 12.379 | 0.122 | 0.016 | 0.002 | 1.659 | |||
| pg17rc1_o2nofp.cx9a2a_c32r128 | 1.220 | 74.438 | 11.768 | 12.454 | 0.101 | 0.017 | 0.002 | 1.452 |
Delete response time histogram: each cell has the percentage of responses that take <= the time in the header and max is the max response time in seconds. For the max column values in the top 25% of the range have a red background and in the bottom 25% of the range have a green background. The red background is not used when the min value is within 80% of the max value.
| dbms | 256us | 1ms | 4ms | 16ms | 64ms | 256ms | 1s | 4s | 16s | gt | max |
|---|---|---|---|---|---|---|---|---|---|---|---|
| my5651_rel_o2nofp.cz11a_c32r128 | 0.284 | 26.322 | 66.681 | 0.609 | 6.105 | 0.600 | |||||
| my5744_rel_o2nofp.cz11a_c32r128 | nonzero | 7.681 | 83.969 | 2.440 | 0.483 | 5.426 | 0.465 | ||||
| my8039_rel_o2nofp.cz11a_c32r128 | 17.414 | 32.209 | 49.252 | 1.024 | 0.100 | 0.625 | |||||
| pg158_o2nofp.cx9a2a_c32r128 | 7.662 | 29.932 | 45.957 | 16.358 | 0.086 | 0.004 | nonzero | 1.010 | |||
| pg164_o2nofp.cx9a2a_c32r128 | 7.330 | 27.116 | 48.767 | 16.731 | 0.054 | 0.001 | 0.001 | 1.702 | |||
| pg17beta3_o2nofp.cx9a2a_c32r128 | 8.228 | 26.491 | 43.985 | 21.198 | 0.094 | 0.003 | nonzero | 1.282 | |||
| pg17rc1_o2nofp.cx9a2a_c32r128 | 8.343 | 29.902 | 44.096 | 17.566 | 0.089 | 0.004 | nonzero | 1.225 |
Performance metrics for the DBMS listed above. Some are normalized by throughput, others are not. Legend for results is here.
ips	qps	rps	rmbps	wps	wmbps	rpq	rkbpq	wpi	wkbpi	csps	cpups	cspq	cpupq	dbgb1	dbgb2	rss	maxop	p50	p99	tag
27586	0	15552	233.2	30480.8	736.5	0.564	8.657	1.105	27.340	256912	35.7	9.313	621	268.1	373.3	104.8	0.511	1648	150	my5651_rel_o2nofp.cz11a_c32r128
39062	0	19974	312.1	34859.2	1003.3	0.511	8.182	0.892	26.302	206562	35.7	5.288	439	268.5	374.2	107.0	0.465	200	150	my5744_rel_o2nofp.cz11a_c32r128
46838	0	22406	350.1	39630.4	1247.4	0.478	7.654	0.846	27.271	362196	28.6	7.733	293	267.4	375.0	108.2	0.626	1649	899	my8039_rel_o2nofp.cz11a_c32r128
73937	0	11447	162.0	18132.8	868.8	0.155	2.243	0.245	12.032	67266	32.9	0.910	214	257.5	353.5	37.2	1.507	3996	849	pg158_o2nofp.cx9a2a_c32r128
73801	0	11680	163.3	17855.1	871.0	0.158	2.266	0.242	12.086	67237	33.9	0.911	220	257.6	353.6	52.7	1.802	3098	999	pg164_o2nofp.cx9a2a_c32r128
67969	0	10594	149.1	17486.3	826.0	0.156	2.247	0.257	12.444	60819	32.7	0.895	231	257.6	353.6	0.8	1.659	3697	1099	pg17beta3_o2nofp.cx9a2a_c32r128
73529	0	11488	163.3	17636.0	837.5	0.156	2.274	0.240	11.663	65344	32.2	0.889	210	256.7	373.6	94.0	1.452	3248	1099	pg17rc1_o2nofp.cx9a2a_c32r128
l.i2
l.i2: continue load after secondary indexes created with 5 inserts per transaction. Graphs for performance per 1-second interval are here.
Average throughput:
Insert response time histogram: each cell has the percentage of responses that take <= the time in the header and max is the max response time in seconds. For the max column values in the top 25% of the range have a red background and in the bottom 25% of the range have a green background. The red background is not used when the min value is within 80% of the max value.
| dbms | 256us | 1ms | 4ms | 16ms | 64ms | 256ms | 1s | 4s | 16s | gt | max |
|---|---|---|---|---|---|---|---|---|---|---|---|
| my5651_rel_o2nofp.cz11a_c32r128 | 0.006 | 0.787 | 46.170 | 42.368 | 10.662 | 0.007 | 0.149 | ||||
| my5744_rel_o2nofp.cz11a_c32r128 | 0.043 | 24.135 | 65.994 | 0.963 | 8.844 | 0.021 | 0.253 | ||||
| my8039_rel_o2nofp.cz11a_c32r128 | 0.003 | 33.510 | 49.812 | 8.068 | 8.594 | 0.013 | nonzero | 0.416 | |||
| pg158_o2nofp.cx9a2a_c32r128 | 9.100 | 90.877 | 0.019 | 0.002 | nonzero | 0.001 | nonzero | 0.766 | |||
| pg164_o2nofp.cx9a2a_c32r128 | 7.251 | 92.708 | 0.037 | 0.001 | 0.001 | 0.001 | 0.001 | 0.720 | |||
| pg17beta3_o2nofp.cx9a2a_c32r128 | 15.558 | 84.379 | 0.053 | 0.008 | 0.001 | 0.001 | nonzero | 0.535 | |||
| pg17rc1_o2nofp.cx9a2a_c32r128 | 10.046 | 89.913 | 0.036 | 0.003 | 0.001 | 0.001 | 0.001 | 0.563 |
Delete response time histogram: each cell has the percentage of responses that take <= the time in the header and max is the max response time in seconds. For the max column values in the top 25% of the range have a red background and in the bottom 25% of the range have a green background. The red background is not used when the min value is within 80% of the max value.
| dbms | 256us | 1ms | 4ms | 16ms | 64ms | 256ms | 1s | 4s | 16s | gt | max |
|---|---|---|---|---|---|---|---|---|---|---|---|
| my5651_rel_o2nofp.cz11a_c32r128 | 0.001 | 0.912 | 49.662 | 38.756 | 10.663 | 0.006 | 0.154 | ||||
| my5744_rel_o2nofp.cz11a_c32r128 | 0.071 | 24.253 | 66.002 | 0.820 | 8.844 | 0.011 | 0.253 | ||||
| my8039_rel_o2nofp.cz11a_c32r128 | 0.002 | 37.047 | 46.683 | 7.932 | 8.324 | 0.011 | 0.183 | ||||
| pg158_o2nofp.cx9a2a_c32r128 | 0.260 | 2.547 | 20.683 | 75.152 | 1.357 | nonzero | 0.112 | ||||
| pg164_o2nofp.cx9a2a_c32r128 | 23.701 | 72.703 | 3.596 | nonzero | 0.087 | ||||||
| pg17beta3_o2nofp.cx9a2a_c32r128 | 0.440 | 4.699 | 38.177 | 51.243 | 5.441 | nonzero | nonzero | 0.279 | |||
| pg17rc1_o2nofp.cx9a2a_c32r128 | 0.515 | 2.439 | 18.707 | 71.610 | 6.728 | 0.001 | 0.112 |
Performance metrics for the DBMS listed above. Some are normalized by throughput, others are not. Legend for results is here.
ips	qps	rps	rmbps	wps	wmbps	rpq	rkbpq	wpi	wkbpi	csps	cpups	cspq	cpupq	dbgb1	dbgb2	rss	maxop	p50	p99	tag
14347	0	10817	141.8	22677.1	589.3	0.754	10.122	1.581	42.062	367777	33.6	25.634	1124	268.1	373.3	104.3	0.149	874	150	my5651_rel_o2nofp.cz11a_c32r128
25000	0	13762	215.0	32892.7	964.3	0.550	8.808	1.316	39.496	266986	31.2	10.679	599	268.5	374.2	107.0	0.253	180	160	my5744_rel_o2nofp.cz11a_c32r128
27397	0	17898	279.7	38124.1	1191.6	0.653	10.453	1.392	44.539	411618	28.5	15.024	499	267.4	372.2	106.1	0.416	340	245	my8039_rel_o2nofp.cz11a_c32r128
8532	0	119	4.8	3757.9	127.4	0.014	0.572	0.440	15.285	42559	26.2	4.988	1474	258.1	354.2	36.5	0.766	400	260	pg158_o2nofp.cx9a2a_c32r128
7015	0	135	2.8	3132.7	111.2	0.019	0.405	0.447	16.239	35069	21.4	4.999	1464	258.0	354.1	36.5	0.720	585	340	pg164_o2nofp.cx9a2a_c32r128
7323	0	178	7.0	3193.2	108.8	0.024	0.978	0.436	15.213	32591	20.1	4.450	1317	258.3	354.3	5.2	0.535	795	509	pg17beta3_o2nofp.cx9a2a_c32r128
6500	0	128	5.4	2705.5	96.7	0.020	0.844	0.416	15.239	28973	23.1	4.457	1706	257.8	353.9	94.0	0.563	1364	685	pg17rc1_o2nofp.cx9a2a_c32r128
qr100.L1
qr100.L1: range queries with 100 insert/s per client. Graphs for performance per 1-second interval are here.
Average throughput:
Query response time histogram: each cell has the percentage of responses that take <= the time in the header and max is the max response time in seconds. For max values in the top 25% of the range have a red background and in the bottom 25% of the range have a green background. The red background is not used when the min value is within 80% of the max value.
| dbms | 256us | 1ms | 4ms | 16ms | 64ms | 256ms | 1s | 4s | 16s | gt | max |
|---|---|---|---|---|---|---|---|---|---|---|---|
| my5651_rel_o2nofp.cz11a_c32r128 | 99.915 | 0.068 | 0.016 | 0.001 | 0.015 | ||||||
| my5744_rel_o2nofp.cz11a_c32r128 | 99.980 | 0.015 | 0.005 | nonzero | 0.016 | ||||||
| my8039_rel_o2nofp.cz11a_c32r128 | 99.975 | 0.022 | 0.003 | nonzero | 0.014 | ||||||
| pg158_o2nofp.cx9a2a_c32r128 | 99.995 | 0.003 | 0.002 | nonzero | nonzero | 0.016 | |||||
| pg164_o2nofp.cx9a2a_c32r128 | 99.994 | 0.004 | 0.002 | nonzero | nonzero | 0.016 | |||||
| pg17beta3_o2nofp.cx9a2a_c32r128 | 99.995 | 0.003 | 0.002 | nonzero | nonzero | 0.017 | |||||
| pg17rc1_o2nofp.cx9a2a_c32r128 | 99.995 | 0.003 | 0.002 | nonzero | nonzero | 0.016 |
Insert response time histogram: each cell has the percentage of responses that take <= the time in the header and max is the max response time in seconds. For max values in the top 25% of the range have a red background and in the bottom 25% of the range have a green background. The red background is not used when the min value is within 80% of the max value.
| dbms | 256us | 1ms | 4ms | 16ms | 64ms | 256ms | 1s | 4s | 16s | gt | max |
|---|---|---|---|---|---|---|---|---|---|---|---|
| my5651_rel_o2nofp.cz11a_c32r128 | 16.951 | 76.499 | 6.550 | 0.036 | |||||||
| my5744_rel_o2nofp.cz11a_c32r128 | 96.383 | 3.611 | 0.006 | 0.025 | |||||||
| my8039_rel_o2nofp.cz11a_c32r128 | 94.701 | 5.299 | 0.013 | ||||||||
| pg158_o2nofp.cx9a2a_c32r128 | 98.368 | 1.632 | 0.015 | ||||||||
| pg164_o2nofp.cx9a2a_c32r128 | 98.653 | 1.331 | 0.017 | 0.036 | |||||||
| pg17beta3_o2nofp.cx9a2a_c32r128 | 98.254 | 1.731 | 0.015 | 0.018 | |||||||
| pg17rc1_o2nofp.cx9a2a_c32r128 | 98.343 | 1.639 | 0.018 | 0.019 |
Delete response time histogram: each cell has the percentage of responses that take <= the time in the header and max is the max response time in seconds. For max values in the top 25% of the range have a red background and in the bottom 25% of the range have a green background. The red background is not used when the min value is within 80% of the max value.
| dbms | 256us | 1ms | 4ms | 16ms | 64ms | 256ms | 1s | 4s | 16s | gt | max |
|---|---|---|---|---|---|---|---|---|---|---|---|
| my5651_rel_o2nofp.cz11a_c32r128 | 30.142 | 66.133 | 3.725 | 0.033 | |||||||
| my5744_rel_o2nofp.cz11a_c32r128 | 0.001 | 98.111 | 1.885 | 0.003 | 0.020 | ||||||
| my8039_rel_o2nofp.cz11a_c32r128 | 97.653 | 2.347 | 0.011 | ||||||||
| pg158_o2nofp.cx9a2a_c32r128 | 44.742 | 55.056 | 0.203 | 0.012 | |||||||
| pg164_o2nofp.cx9a2a_c32r128 | 46.999 | 52.792 | 0.182 | 0.028 | 0.034 | ||||||
| pg17beta3_o2nofp.cx9a2a_c32r128 | 49.183 | 50.600 | 0.217 | 0.014 | |||||||
| pg17rc1_o2nofp.cx9a2a_c32r128 | 47.503 | 52.293 | 0.204 | 0.015 |
Performance metrics for the DBMS listed above. Some are normalized by throughput, others are not. Legend for results is here.
ips	qps	rps	rmbps	wps	wmbps	rpq	rkbpq	wpi	wkbpi	csps	cpups	cspq	cpupq	dbgb1	dbgb2	rss	maxop	p50	p99	tag
1977	246113	262	3.5	1720.5	51.0	0.001	0.014	0.870	26.400	949688	42.9	3.859	84	268.1	373.3	104.0	0.015	12623	11172	my5651_rel_o2nofp.cz11a_c32r128
1977	208125	189	3.0	3493.4	100.0	0.001	0.015	1.767	51.803	806237	43.4	3.874	100	268.5	374.2	107.0	0.016	10552	9974	my5744_rel_o2nofp.cz11a_c32r128
1977	187093	117	1.8	3743.5	108.9	0.001	0.010	1.894	56.396	727325	43.1	3.888	111	267.4	372.2	106.1	0.014	9510	8998	my8039_rel_o2nofp.cz11a_c32r128
1977	376934	21	0.8	958.7	32.3	0.000	0.002	0.485	16.720	1431543	42.7	3.798	54	258.1	354.2	96.4	0.016	19275	17837	pg158_o2nofp.cx9a2a_c32r128
1977	376412	32	1.0	906.4	32.3	0.000	0.003	0.458	16.730	1429376	42.7	3.797	54	258.0	354.1	96.2	0.016	18924	17405	pg164_o2nofp.cx9a2a_c32r128
1977	378857	28	0.9	920.8	32.3	0.000	0.002	0.466	16.752	1438152	42.7	3.796	54	258.3	354.3	0.7	0.017	19314	17539	pg17beta3_o2nofp.cx9a2a_c32r128
1977	380459	27	0.8	950.1	32.2	0.000	0.002	0.481	16.675	1444480	42.7	3.797	54	257.9	353.9	95.8	0.016	19387	17821	pg17rc1_o2nofp.cx9a2a_c32r128
qp100.L2
qp100.L2: point queries with 100 insert/s per client. Graphs for performance per 1-second interval are here.
Average throughput:
Query response time histogram: each cell has the percentage of responses that take <= the time in the header and max is the max response time in seconds. For max values in the top 25% of the range have a red background and in the bottom 25% of the range have a green background. The red background is not used when the min value is within 80% of the max value.
| dbms | 256us | 1ms | 4ms | 16ms | 64ms | 256ms | 1s | 4s | 16s | gt | max |
|---|---|---|---|---|---|---|---|---|---|---|---|
| my5651_rel_o2nofp.cz11a_c32r128 | 98.481 | 1.056 | 0.423 | 0.039 | nonzero | 0.037 | |||||
| my5744_rel_o2nofp.cz11a_c32r128 | 97.909 | 1.723 | 0.360 | 0.008 | nonzero | 0.049 | |||||
| my8039_rel_o2nofp.cz11a_c32r128 | 96.622 | 3.013 | 0.348 | 0.017 | 0.014 | ||||||
| pg158_o2nofp.cx9a2a_c32r128 | 13.026 | 83.449 | 2.805 | 0.144 | 0.575 | nonzero | nonzero | nonzero | 1.986 | ||
| pg164_o2nofp.cx9a2a_c32r128 | 13.197 | 83.283 | 2.760 | 0.114 | 0.645 | nonzero | nonzero | 0.950 | |||
| pg17beta3_o2nofp.cx9a2a_c32r128 | 12.298 | 84.094 | 2.911 | 0.105 | 0.591 | nonzero | nonzero | nonzero | 3.020 | ||
| pg17rc1_o2nofp.cx9a2a_c32r128 | 12.051 | 84.550 | 2.650 | 0.098 | 0.650 | nonzero | nonzero | nonzero | 2.336 |
Insert response time histogram: each cell has the percentage of responses that take <= the time in the header and max is the max response time in seconds. For max values in the top 25% of the range have a red background and in the bottom 25% of the range have a green background. The red background is not used when the min value is within 80% of the max value.
| dbms | 256us | 1ms | 4ms | 16ms | 64ms | 256ms | 1s | 4s | 16s | gt | max |
|---|---|---|---|---|---|---|---|---|---|---|---|
| my5651_rel_o2nofp.cz11a_c32r128 | 0.067 | 21.771 | 78.017 | 0.146 | 0.095 | ||||||
| my5744_rel_o2nofp.cz11a_c32r128 | 0.214 | 86.607 | 12.986 | 0.193 | 0.143 | ||||||
| my8039_rel_o2nofp.cz11a_c32r128 | 0.714 | 96.471 | 2.815 | 0.034 | |||||||
| pg158_o2nofp.cx9a2a_c32r128 | 0.183 | 67.256 | 32.146 | 0.279 | 0.081 | 0.056 | 1.131 | ||||
| pg164_o2nofp.cx9a2a_c32r128 | 0.415 | 64.981 | 34.485 | 0.061 | 0.058 | 0.819 | |||||
| pg17beta3_o2nofp.cx9a2a_c32r128 | 0.365 | 66.408 | 32.867 | 0.172 | 0.129 | 0.058 | 2.658 | ||||
| pg17rc1_o2nofp.cx9a2a_c32r128 | 0.331 | 69.633 | 29.837 | 0.171 | 0.001 | 0.026 | 2.132 |
Delete response time histogram: each cell has the percentage of responses that take <= the time in the header and max is the max response time in seconds. For max values in the top 25% of the range have a red background and in the bottom 25% of the range have a green background. The red background is not used when the min value is within 80% of the max value.
| dbms | 256us | 1ms | 4ms | 16ms | 64ms | 256ms | 1s | 4s | 16s | gt | max |
|---|---|---|---|---|---|---|---|---|---|---|---|
| my5651_rel_o2nofp.cz11a_c32r128 | 8.037 | 79.421 | 12.539 | 0.003 | 0.069 | ||||||
| my5744_rel_o2nofp.cz11a_c32r128 | 77.976 | 21.931 | 0.088 | 0.006 | 0.091 | ||||||
| my8039_rel_o2nofp.cz11a_c32r128 | 92.306 | 7.694 | 0.013 | ||||||||
| pg158_o2nofp.cx9a2a_c32r128 | 91.024 | 4.197 | 4.775 | 0.001 | 0.001 | 0.001 | 1.035 | ||||
| pg164_o2nofp.cx9a2a_c32r128 | 97.057 | 0.378 | 2.558 | 0.007 | 0.798 | ||||||
| pg17beta3_o2nofp.cx9a2a_c32r128 | 94.640 | 2.769 | 2.540 | 0.003 | 0.044 | 0.003 | 2.459 | ||||
| pg17rc1_o2nofp.cx9a2a_c32r128 | 93.318 | 3.949 | 2.718 | 0.015 | 0.121 |
Performance metrics for the DBMS listed above. Some are normalized by throughput, others are not. Legend for results is here.
ips	qps	rps	rmbps	wps	wmbps	rpq	rkbpq	wpi	wkbpi	csps	cpups	cspq	cpupq	dbgb1	dbgb2	rss	maxop	p50	p99	tag
1976	133990	13539	210.8	15774.8	360.8	0.101	1.611	7.984	186.968	558092	40.8	4.165	146	268.1	373.3	104.0	0.037	7288	527	my5651_rel_o2nofp.cz11a_c32r128
1976	126652	13496	210.9	14482.7	366.1	0.107	1.705	7.330	189.718	551525	41.5	4.355	157	268.5	374.2	107.0	0.049	6697	655	my5744_rel_o2nofp.cz11a_c32r128
1977	101646	13399	209.4	13144.7	370.0	0.132	2.110	6.649	191.644	442375	41.6	4.352	196	267.4	372.2	106.1	0.014	5407	751	my8039_rel_o2nofp.cz11a_c32r128
1977	22038	74676	611.7	6343.5	69.7	3.389	28.423	3.209	36.122	240928	26.0	10.932	566	258.1	354.2	96.0	1.986	1231	511	pg158_o2nofp.cx9a2a_c32r128
1977	24387	81267	665.7	6299.9	69.6	3.332	27.953	3.187	36.072	264365	29.1	10.840	573	258.0	354.1	96.1	0.950	1518	528	pg164_o2nofp.cx9a2a_c32r128
1976	22963	77666	636.1	6307.8	69.6	3.382	28.367	3.193	36.058	252175	27.3	10.982	571	258.3	354.3	0.9	3.020	1359	495	pg17beta3_o2nofp.cx9a2a_c32r128
1977	24369	81806	670.1	6336.1	69.7	3.357	28.159	3.205	36.105	265279	29.3	10.886	577	257.9	353.9	95.2	2.336	1295	543	pg17rc1_o2nofp.cx9a2a_c32r128
qr500.L3
qr500.L3: range queries with 500 insert/s per client. Graphs for performance per 1-second interval are here.
Average throughput:
Query response time histogram: each cell has the percentage of responses that take <= the time in the header and max is the max response time in seconds. For max values in the top 25% of the range have a red background and in the bottom 25% of the range have a green background. The red background is not used when the min value is within 80% of the max value.
| dbms | 256us | 1ms | 4ms | 16ms | 64ms | 256ms | 1s | 4s | 16s | gt | max |
|---|---|---|---|---|---|---|---|---|---|---|---|
| my5651_rel_o2nofp.cz11a_c32r128 | 99.126 | 0.682 | 0.160 | 0.032 | nonzero | nonzero | 0.098 | ||||
| my5744_rel_o2nofp.cz11a_c32r128 | 99.839 | 0.086 | 0.071 | 0.004 | nonzero | 0.028 | |||||
| my8039_rel_o2nofp.cz11a_c32r128 | 99.858 | 0.119 | 0.022 | 0.001 | nonzero | 0.029 | |||||
| pg158_o2nofp.cx9a2a_c32r128 | 99.971 | 0.025 | 0.004 | nonzero | nonzero | nonzero | nonzero | nonzero | 2.245 | ||
| pg164_o2nofp.cx9a2a_c32r128 | 99.966 | 0.029 | 0.004 | 0.001 | nonzero | nonzero | nonzero | nonzero | 2.780 | ||
| pg17beta3_o2nofp.cx9a2a_c32r128 | 99.972 | 0.023 | 0.005 | nonzero | nonzero | nonzero | nonzero | nonzero | 2.856 | ||
| pg17rc1_o2nofp.cx9a2a_c32r128 | 99.972 | 0.023 | 0.005 | 0.001 | nonzero | nonzero | nonzero | nonzero | 1.805 |
Insert response time histogram: each cell has the percentage of responses that take <= the time in the header and max is the max response time in seconds. For max values in the top 25% of the range have a red background and in the bottom 25% of the range have a green background. The red background is not used when the min value is within 80% of the max value.
| dbms | 256us | 1ms | 4ms | 16ms | 64ms | 256ms | 1s | 4s | 16s | gt | max |
|---|---|---|---|---|---|---|---|---|---|---|---|
| my5651_rel_o2nofp.cz11a_c32r128 | 3.724 | 55.114 | 40.793 | 0.369 | nonzero | 0.262 | |||||
| my5744_rel_o2nofp.cz11a_c32r128 | 50.497 | 46.773 | 2.726 | 0.004 | 0.095 | ||||||
| my8039_rel_o2nofp.cz11a_c32r128 | 40.036 | 58.009 | 1.954 | 0.052 | |||||||
| pg158_o2nofp.cx9a2a_c32r128 | 49.161 | 47.788 | 2.636 | 0.146 | 0.197 | 0.072 | 3.318 | ||||
| pg164_o2nofp.cx9a2a_c32r128 | 46.541 | 51.200 | 1.964 | 0.089 | 0.135 | 0.072 | 3.308 | ||||
| pg17beta3_o2nofp.cx9a2a_c32r128 | 52.125 | 45.525 | 2.053 | 0.097 | 0.140 | 0.060 | 3.487 | ||||
| pg17rc1_o2nofp.cx9a2a_c32r128 | 51.771 | 45.785 | 2.152 | 0.085 | 0.140 | 0.066 | 0.001 | 4.779 |
Delete response time histogram: each cell has the percentage of responses that take <= the time in the header and max is the max response time in seconds. For max values in the top 25% of the range have a red background and in the bottom 25% of the range have a green background. The red background is not used when the min value is within 80% of the max value.
| dbms | 256us | 1ms | 4ms | 16ms | 64ms | 256ms | 1s | 4s | 16s | gt | max |
|---|---|---|---|---|---|---|---|---|---|---|---|
| my5651_rel_o2nofp.cz11a_c32r128 | 0.001 | 6.030 | 62.216 | 31.752 | 0.001 | 0.091 | |||||
| my5744_rel_o2nofp.cz11a_c32r128 | 0.003 | 60.449 | 38.899 | 0.649 | 0.042 | ||||||
| my8039_rel_o2nofp.cz11a_c32r128 | 57.102 | 42.688 | 0.210 | 0.047 | |||||||
| pg158_o2nofp.cx9a2a_c32r128 | 81.164 | 18.612 | 0.207 | 0.003 | 0.009 | 0.004 | 2.262 | ||||
| pg164_o2nofp.cx9a2a_c32r128 | 76.658 | 23.199 | 0.138 | 0.001 | 0.001 | 0.002 | 2.002 | ||||
| pg17beta3_o2nofp.cx9a2a_c32r128 | 82.697 | 17.156 | 0.141 | 0.001 | 0.003 | 0.001 | 2.238 | ||||
| pg17rc1_o2nofp.cx9a2a_c32r128 | 74.422 | 25.429 | 0.141 | 0.003 | 0.004 | 0.001 | 3.538 |
Performance metrics for the DBMS listed above. Some are normalized by throughput, others are not. Legend for results is here.
ips	qps	rps	rmbps	wps	wmbps	rpq	rkbpq	wpi	wkbpi	csps	cpups	cspq	cpupq	dbgb1	dbgb2	rss	maxop	p50	p99	tag
9879	209293	4202	62.9	9428.2	266.6	0.020	0.308	0.954	27.634	858908	46.2	4.104	106	268.1	373.3	104.2	0.098	10964	1375	my5651_rel_o2nofp.cz11a_c32r128
9879	198302	3840	60.0	8838.9	254.7	0.019	0.310	0.895	26.401	786952	47.2	3.968	114	268.5	374.2	107.0	0.028	10165	4123	my5744_rel_o2nofp.cz11a_c32r128
9885	181244	4148	64.8	9992.3	300.1	0.023	0.366	1.011	31.087	734486	46.6	4.052	123	267.4	372.2	106.1	0.029	9238	8266	my8039_rel_o2nofp.cz11a_c32r128
9868	341294	6173	53.6	7235.0	163.4	0.018	0.161	0.733	16.960	1292858	46.3	3.788	65	258.4	354.4	86.6	2.245	17389	14800	pg158_o2nofp.cx9a2a_c32r128
9847	340022	6209	53.7	7229.2	163.8	0.018	0.162	0.734	17.030	1287051	45.7	3.785	65	258.2	354.3	88.7	2.780	17405	14998	pg164_o2nofp.cx9a2a_c32r128
9863	343246	6185	53.7	7231.3	163.7	0.018	0.160	0.733	16.992	1298423	46.2	3.783	65	258.4	354.5	84.0	2.856	17565	15503	pg17beta3_o2nofp.cx9a2a_c32r128
9852	342689	6171	53.7	7240.0	163.7	0.018	0.160	0.735	17.012	1297163	46.2	3.785	65	258.2	354.3	84.7	1.805	17453	15296	pg17rc1_o2nofp.cx9a2a_c32r128
qp500.L4
qp500.L4: point queries with 500 insert/s per client. Graphs for performance per 1-second interval are here.
Average throughput:
Query response time histogram: each cell has the percentage of responses that take <= the time in the header and max is the max response time in seconds. For max values in the top 25% of the range have a red background and in the bottom 25% of the range have a green background. The red background is not used when the min value is within 80% of the max value.
| dbms | 256us | 1ms | 4ms | 16ms | 64ms | 256ms | 1s | 4s | 16s | gt | max |
|---|---|---|---|---|---|---|---|---|---|---|---|
| my5651_rel_o2nofp.cz11a_c32r128 | 86.401 | 10.090 | 3.186 | 0.322 | nonzero | 0.037 | |||||
| my5744_rel_o2nofp.cz11a_c32r128 | 89.861 | 8.448 | 1.649 | 0.043 | nonzero | 0.021 | |||||
| my8039_rel_o2nofp.cz11a_c32r128 | 85.134 | 13.129 | 1.698 | 0.039 | nonzero | 0.019 | |||||
| pg158_o2nofp.cx9a2a_c32r128 | 3.198 | 86.614 | 8.888 | 0.114 | 1.180 | 0.003 | 0.003 | nonzero | 1.015 | ||
| pg164_o2nofp.cx9a2a_c32r128 | 3.184 | 86.722 | 8.835 | 0.036 | 1.220 | 0.001 | 0.002 | nonzero | 2.913 | ||
| pg17beta3_o2nofp.cx9a2a_c32r128 | 3.142 | 86.366 | 9.216 | 0.044 | 1.229 | 0.001 | 0.001 | 0.964 | |||
| pg17rc1_o2nofp.cx9a2a_c32r128 | 3.138 | 86.333 | 9.290 | 0.046 | 1.189 | 0.002 | 0.002 | nonzero | 1.599 |
Insert response time histogram: each cell has the percentage of responses that take <= the time in the header and max is the max response time in seconds. For max values in the top 25% of the range have a red background and in the bottom 25% of the range have a green background. The red background is not used when the min value is within 80% of the max value.
| dbms | 256us | 1ms | 4ms | 16ms | 64ms | 256ms | 1s | 4s | 16s | gt | max |
|---|---|---|---|---|---|---|---|---|---|---|---|
| my5651_rel_o2nofp.cz11a_c32r128 | 0.047 | 1.591 | 88.833 | 9.528 | 0.152 | ||||||
| my5744_rel_o2nofp.cz11a_c32r128 | 0.201 | 6.754 | 92.932 | 0.112 | 0.096 | ||||||
| my8039_rel_o2nofp.cz11a_c32r128 | 0.707 | 23.426 | 75.867 | 0.057 | |||||||
| pg158_o2nofp.cx9a2a_c32r128 | 0.089 | 63.384 | 35.992 | 0.289 | 0.234 | 0.013 | 1.654 | ||||
| pg164_o2nofp.cx9a2a_c32r128 | 0.103 | 69.971 | 29.637 | 0.115 | 0.157 | 0.016 | 2.515 | ||||
| pg17beta3_o2nofp.cx9a2a_c32r128 | 0.113 | 65.192 | 34.458 | 0.120 | 0.114 | 0.003 | 1.276 | ||||
| pg17rc1_o2nofp.cx9a2a_c32r128 | 0.105 | 66.761 | 32.803 | 0.150 | 0.175 | 0.007 | 1.526 |
Delete response time histogram: each cell has the percentage of responses that take <= the time in the header and max is the max response time in seconds. For max values in the top 25% of the range have a red background and in the bottom 25% of the range have a green background. The red background is not used when the min value is within 80% of the max value.
| dbms | 256us | 1ms | 4ms | 16ms | 64ms | 256ms | 1s | 4s | 16s | gt | max |
|---|---|---|---|---|---|---|---|---|---|---|---|
| my5651_rel_o2nofp.cz11a_c32r128 | 0.708 | 61.969 | 37.316 | 0.007 | 0.101 | ||||||
| my5744_rel_o2nofp.cz11a_c32r128 | 10.992 | 84.257 | 4.751 | 0.050 | |||||||
| my8039_rel_o2nofp.cz11a_c32r128 | 51.619 | 48.107 | 0.274 | 0.045 | |||||||
| pg158_o2nofp.cx9a2a_c32r128 | 1.232 | 93.355 | 5.222 | 0.107 | 0.084 | 0.001 | 1.023 | ||||
| pg164_o2nofp.cx9a2a_c32r128 | 2.301 | 94.334 | 3.240 | 0.058 | 0.066 | 0.001 | 2.395 | ||||
| pg17beta3_o2nofp.cx9a2a_c32r128 | 2.474 | 93.966 | 3.454 | 0.051 | 0.055 | 0.676 | |||||
| pg17rc1_o2nofp.cx9a2a_c32r128 | 2.123 | 94.390 | 3.346 | 0.071 | 0.070 | 0.976 |
Performance metrics for the DBMS listed above. Some are normalized by throughput, others are not. Legend for results is here.
ips	qps	rps	rmbps	wps	wmbps	rpq	rkbpq	wpi	wkbpi	csps	cpups	cspq	cpupq	dbgb1	dbgb2	rss	maxop	p50	p99	tag
9885	78923	42241	656.2	56373.9	924.7	0.535	8.514	5.703	95.795	660394	47.6	8.368	289	268.1	373.3	105.0	0.037	5914	368	my5651_rel_o2nofp.cz11a_c32r128
9885	93297	50552	789.9	60533.4	1302.5	0.542	8.669	6.124	134.935	640147	48.9	6.861	252	268.5	374.2	107.0	0.021	5420	479	my5744_rel_o2nofp.cz11a_c32r128
9885	78424	53470	835.5	47677.8	1310.5	0.682	10.909	4.823	135.763	548505	45.2	6.994	277	267.4	372.2	106.1	0.019	4524	575	my8039_rel_o2nofp.cz11a_c32r128
9879	18255	90692	723.7	22073.7	266.3	4.968	40.597	2.234	27.603	258913	36.8	14.183	968	259.7	355.7	82.8	1.015	1007	368	pg158_o2nofp.cx9a2a_c32r128
9868	18439	91127	726.3	22077.6	265.4	4.942	40.334	2.237	27.538	261871	37.6	14.202	979	259.7	355.7	86.5	2.913	991	384	pg164_o2nofp.cx9a2a_c32r128
9879	18539	91634	730.4	21986.3	264.9	4.943	40.343	2.226	27.456	261012	38.3	14.079	992	259.7	355.7	84.0	0.964	991	431	pg17beta3_o2nofp.cx9a2a_c32r128
9879	18177	90430	720.9	22048.6	266.2	4.975	40.609	2.232	27.590	257422	37.5	14.162	990	259.5	355.6	84.7	1.599	975	415	pg17rc1_o2nofp.cx9a2a_c32r128
qr1000.L5
qr1000.L5: range queries with 1000 insert/s per client. Graphs for performance per 1-second interval are here.
Average throughput:
Query response time histogram: each cell has the percentage of responses that take <= the time in the header and max is the max response time in seconds. For max values in the top 25% of the range have a red background and in the bottom 25% of the range have a green background. The red background is not used when the min value is within 80% of the max value.
| dbms | 256us | 1ms | 4ms | 16ms | 64ms | 256ms | 1s | 4s | 16s | gt | max |
|---|---|---|---|---|---|---|---|---|---|---|---|
| my5651_rel_o2nofp.cz11a_c32r128 | 97.973 | 1.659 | 0.300 | 0.068 | nonzero | nonzero | 0.067 | ||||
| my5744_rel_o2nofp.cz11a_c32r128 | 99.716 | 0.173 | 0.099 | 0.012 | nonzero | 0.032 | |||||
| my8039_rel_o2nofp.cz11a_c32r128 | 99.782 | 0.171 | 0.044 | 0.003 | nonzero | 0.026 | |||||
| pg158_o2nofp.cx9a2a_c32r128 | 99.811 | 0.154 | 0.019 | 0.010 | 0.007 | nonzero | nonzero | nonzero | 3.735 | ||
| pg164_o2nofp.cx9a2a_c32r128 | 99.828 | 0.141 | 0.017 | 0.009 | 0.005 | nonzero | nonzero | nonzero | 1.990 | ||
| pg17beta3_o2nofp.cx9a2a_c32r128 | 99.837 | 0.133 | 0.017 | 0.008 | 0.005 | nonzero | nonzero | nonzero | 3.412 | ||
| pg17rc1_o2nofp.cx9a2a_c32r128 | 99.813 | 0.149 | 0.019 | 0.011 | 0.007 | nonzero | nonzero | nonzero | 3.889 |
Insert response time histogram: each cell has the percentage of responses that take <= the time in the header and max is the max response time in seconds. For max values in the top 25% of the range have a red background and in the bottom 25% of the range have a green background. The red background is not used when the min value is within 80% of the max value.
| dbms | 256us | 1ms | 4ms | 16ms | 64ms | 256ms | 1s | 4s | 16s | gt | max |
|---|---|---|---|---|---|---|---|---|---|---|---|
| my5651_rel_o2nofp.cz11a_c32r128 | 2.586 | 51.566 | 45.673 | 0.175 | 0.181 | ||||||
| my5744_rel_o2nofp.cz11a_c32r128 | 21.283 | 74.238 | 4.479 | 0.059 | |||||||
| my8039_rel_o2nofp.cz11a_c32r128 | 34.257 | 64.085 | 1.659 | 0.055 | |||||||
| pg158_o2nofp.cx9a2a_c32r128 | 51.576 | 34.815 | 12.723 | 0.772 | 0.087 | 0.028 | nonzero | 4.251 | |||
| pg164_o2nofp.cx9a2a_c32r128 | 54.289 | 33.640 | 11.507 | 0.483 | 0.063 | 0.018 | nonzero | 4.675 | |||
| pg17beta3_o2nofp.cx9a2a_c32r128 | 54.197 | 34.015 | 11.336 | 0.389 | 0.052 | 0.011 | 0.001 | 5.129 | |||
| pg17rc1_o2nofp.cx9a2a_c32r128 | 51.511 | 33.755 | 13.585 | 1.075 | 0.057 | 0.015 | 0.002 | 4.875 |
Delete response time histogram: each cell has the percentage of responses that take <= the time in the header and max is the max response time in seconds. For max values in the top 25% of the range have a red background and in the bottom 25% of the range have a green background. The red background is not used when the min value is within 80% of the max value.
| dbms | 256us | 1ms | 4ms | 16ms | 64ms | 256ms | 1s | 4s | 16s | gt | max |
|---|---|---|---|---|---|---|---|---|---|---|---|
| my5651_rel_o2nofp.cz11a_c32r128 | 0.001 | 3.378 | 58.275 | 38.343 | 0.003 | 0.078 | |||||
| my5744_rel_o2nofp.cz11a_c32r128 | 0.003 | 27.866 | 69.114 | 3.017 | 0.051 | ||||||
| my8039_rel_o2nofp.cz11a_c32r128 | 47.130 | 52.266 | 0.604 | nonzero | 0.070 | ||||||
| pg158_o2nofp.cx9a2a_c32r128 | 4.603 | 24.946 | 51.781 | 18.320 | 0.336 | 0.012 | 0.002 | 3.759 | |||
| pg164_o2nofp.cx9a2a_c32r128 | 4.723 | 24.120 | 54.570 | 16.377 | 0.205 | 0.005 | 0.001 | 2.352 | |||
| pg17beta3_o2nofp.cx9a2a_c32r128 | 5.162 | 26.366 | 49.319 | 18.986 | 0.161 | 0.005 | nonzero | 3.957 | |||
| pg17rc1_o2nofp.cx9a2a_c32r128 | 4.185 | 23.800 | 50.293 | 21.297 | 0.418 | 0.006 | 0.001 | nonzero | 4.276 |
Performance metrics for the DBMS listed above. Some are normalized by throughput, others are not. Legend for results is here.
ips	qps	rps	rmbps	wps	wmbps	rpq	rkbpq	wpi	wkbpi	csps	cpups	cspq	cpupq	dbgb1	dbgb2	rss	maxop	p50	p99	tag
19769	180610	4156	59.7	10856.3	321.8	0.023	0.338	0.549	16.668	775134	50.4	4.292	134	268.1	373.3	105.0	0.067	9446	1103	my5651_rel_o2nofp.cz11a_c32r128
19769	188379	3929	61.4	13563.2	400.8	0.021	0.334	0.686	20.760	749200	52.0	3.977	132	268.5	374.2	107.0	0.032	9685	4875	my5744_rel_o2nofp.cz11a_c32r128
19769	175950	3880	60.6	13727.0	422.3	0.022	0.353	0.694	21.875	727868	49.3	4.137	134	267.4	372.2	106.1	0.026	8950	7850	my8039_rel_o2nofp.cz11a_c32r128
19672	274450	8289	114.0	14837.7	417.3	0.030	0.425	0.754	21.721	977416	55.8	3.561	98	263.5	359.6	52.9	3.735	13873	9478	pg158_o2nofp.cx9a2a_c32r128
19715	275278	8355	115.0	15320.5	423.0	0.030	0.428	0.777	21.972	980254	56.4	3.561	98	263.5	359.6	56.8	1.990	13878	9247	pg164_o2nofp.cx9a2a_c32r128
19704	278876	8363	114.9	15193.3	421.4	0.030	0.422	0.771	21.902	992902	56.6	3.560	97	263.3	359.4	92.2	3.412	14001	9989	pg17beta3_o2nofp.cx9a2a_c32r128
19640	270542	8314	114.5	15215.7	420.8	0.031	0.433	0.775	21.940	962296	56.0	3.557	99	263.5	359.5	91.9	3.889	13658	8423	pg17rc1_o2nofp.cx9a2a_c32r128
qp1000.L6
qp1000.L6: point queries with 1000 insert/s per client. Graphs for performance per 1-second interval are here.
Average throughput:
Query response time histogram: each cell has the percentage of responses that take <= the time in the header and max is the max response time in seconds. For max values in the top 25% of the range have a red background and in the bottom 25% of the range have a green background. The red background is not used when the min value is within 80% of the max value.
| dbms | 256us | 1ms | 4ms | 16ms | 64ms | 256ms | 1s | 4s | 16s | gt | max |
|---|---|---|---|---|---|---|---|---|---|---|---|
| my5651_rel_o2nofp.cz11a_c32r128 | 80.824 | 12.764 | 5.980 | 0.431 | 0.001 | 0.041 | |||||
| my5744_rel_o2nofp.cz11a_c32r128 | 84.643 | 10.379 | 4.886 | 0.092 | 0.001 | 0.043 | |||||
| my8039_rel_o2nofp.cz11a_c32r128 | 75.557 | 19.937 | 4.399 | 0.107 | nonzero | 0.029 | |||||
| pg158_o2nofp.cx9a2a_c32r128 | 0.427 | 65.808 | 31.491 | 0.396 | 1.868 | 0.005 | 0.005 | nonzero | 1.539 | ||
| pg164_o2nofp.cx9a2a_c32r128 | 0.437 | 64.744 | 32.703 | 0.290 | 1.817 | 0.003 | 0.005 | nonzero | nonzero | 5.200 | |
| pg17beta3_o2nofp.cx9a2a_c32r128 | 0.353 | 62.481 | 34.883 | 0.298 | 1.976 | 0.004 | 0.004 | nonzero | 1.443 | ||
| pg17rc1_o2nofp.cx9a2a_c32r128 | 0.387 | 63.429 | 34.014 | 0.282 | 1.881 | 0.003 | 0.004 | nonzero | nonzero | 4.045 |
Insert response time histogram: each cell has the percentage of responses that take <= the time in the header and max is the max response time in seconds. For max values in the top 25% of the range have a red background and in the bottom 25% of the range have a green background. The red background is not used when the min value is within 80% of the max value.
| dbms | 256us | 1ms | 4ms | 16ms | 64ms | 256ms | 1s | 4s | 16s | gt | max |
|---|---|---|---|---|---|---|---|---|---|---|---|
| my5651_rel_o2nofp.cz11a_c32r128 | 0.050 | 10.944 | 86.310 | 2.696 | 0.243 | ||||||
| my5744_rel_o2nofp.cz11a_c32r128 | 0.193 | 41.661 | 58.069 | 0.077 | 0.099 | ||||||
| my8039_rel_o2nofp.cz11a_c32r128 | 0.921 | 53.790 | 45.232 | 0.057 | 0.109 | ||||||
| pg158_o2nofp.cx9a2a_c32r128 | 0.388 | 58.457 | 40.701 | 0.281 | 0.155 | 0.018 | 1.548 | ||||
| pg164_o2nofp.cx9a2a_c32r128 | 0.392 | 57.575 | 41.677 | 0.188 | 0.159 | 0.006 | 0.002 | 5.135 | |||
| pg17beta3_o2nofp.cx9a2a_c32r128 | 0.370 | 57.125 | 42.122 | 0.236 | 0.138 | 0.009 | 1.578 | ||||
| pg17rc1_o2nofp.cx9a2a_c32r128 | 0.403 | 58.136 | 41.035 | 0.292 | 0.117 | 0.017 | 0.001 | 4.015 |
Delete response time histogram: each cell has the percentage of responses that take <= the time in the header and max is the max response time in seconds. For max values in the top 25% of the range have a red background and in the bottom 25% of the range have a green background. The red background is not used when the min value is within 80% of the max value.
| dbms | 256us | 1ms | 4ms | 16ms | 64ms | 256ms | 1s | 4s | 16s | gt | max |
|---|---|---|---|---|---|---|---|---|---|---|---|
| my5651_rel_o2nofp.cz11a_c32r128 | nonzero | 0.190 | 26.557 | 72.845 | 0.408 | 0.203 | |||||
| my5744_rel_o2nofp.cz11a_c32r128 | nonzero | 11.111 | 85.369 | 3.519 | 0.001 | 0.078 | |||||
| my8039_rel_o2nofp.cz11a_c32r128 | nonzero | 22.368 | 71.783 | 5.844 | 0.005 | 0.092 | |||||
| pg158_o2nofp.cx9a2a_c32r128 | 15.328 | 78.871 | 5.638 | 0.074 | 0.082 | 0.008 | 1.541 | ||||
| pg164_o2nofp.cx9a2a_c32r128 | 9.462 | 86.353 | 4.063 | 0.046 | 0.072 | 0.004 | 1.425 | ||||
| pg17beta3_o2nofp.cx9a2a_c32r128 | 13.438 | 82.121 | 4.328 | 0.044 | 0.066 | 0.003 | 1.390 | ||||
| pg17rc1_o2nofp.cx9a2a_c32r128 | 11.808 | 83.662 | 4.427 | 0.037 | 0.059 | 0.007 | 3.293 |
Performance metrics for the DBMS listed above. Some are normalized by throughput, others are not. Legend for results is here.
ips	qps	rps	rmbps	wps	wmbps	rpq	rkbpq	wpi	wkbpi	csps	cpups	cspq	cpupq	dbgb1	dbgb2	rss	maxop	p50	p99	tag
19769	62268	43736	676.1	47234.0	798.0	0.702	11.118	2.389	41.333	572078	52.5	9.187	405	268.1	378.3	105.0	0.041	5738	336	my5651_rel_o2nofp.cz11a_c32r128
19769	72669	68050	1063.3	59109.1	1306.5	0.936	14.983	2.990	67.676	589315	47.8	8.110	316	268.5	374.2	107.0	0.043	6105	448	my5744_rel_o2nofp.cz11a_c32r128
19769	60585	65182	1018.5	43655.5	1249.3	1.076	17.214	2.208	64.713	523099	47.0	8.634	372	267.4	373.2	106.1	0.029	4587	495	my8039_rel_o2nofp.cz11a_c32r128
19694	12827	95103	755.4	35291.8	468.9	7.414	60.303	1.792	24.380	249349	43.6	19.439	1632	264.5	360.5	89.3	1.539	671	192	pg158_o2nofp.cx9a2a_c32r128
19651	12643	94256	748.7	34953.8	464.7	7.455	60.639	1.779	24.217	246802	44.4	19.521	1686	264.5	360.5	56.5	5.200	671	223	pg164_o2nofp.cx9a2a_c32r128
19715	12324	93129	739.8	34984.8	465.0	7.557	61.470	1.775	24.150	243843	45.1	19.787	1757	264.4	360.4	86.4	1.443	655	224	pg17beta3_o2nofp.cx9a2a_c32r128
19661	12472	93538	742.9	34892.1	465.4	7.500	61.001	1.775	24.237	244953	44.3	19.641	1705	264.4	360.4	78.1	4.045	655	192	pg17rc1_o2nofp.cx9a2a_c32r128
l.i0
l.i0: load without secondary indexes
Performance metrics for all DBMS, not just the ones listed above. Some are normalized by throughput, others are not. Legend for results is here.
ips	qps	rps	rmbps	wps	wmbps	rpq	rkbpq	wpi	wkbpi	csps	cpups	cspq	cpupq	dbgb1	dbgb2	rss	maxop	p50	p99	tag
429386	0	989	3.9	2637.0	148.2	0.002	0.009	0.006	0.353	104379	40.3	0.243	45	84.4	184.9	89.9	0.190	23375	15583	my5651_rel_o2nofp.cz11a_c32r128
663556	0	0	0.0	4190.1	230.7	0.000	0.000	0.006	0.356	80348	45.5	0.121	33	84.4	184.9	91.2	0.178	33963	28469	my5744_rel_o2nofp.cz11a_c32r128
1409692	0	1	0.0	8763.5	503.7	0.000	0.000	0.006	0.366	291532	53.7	0.207	18	84.1	184.6	91.3	0.234	75219	60934	my8039_rel_o2nofp.cz11a_c32r128
1936460	0	265	2.8	8870.5	832.3	0.000	0.002	0.005	0.440	307077	56.1	0.159	14	122.5	218.5	17.5	2.275	107415	4795	pg158_o2nofp.cx9a2a_c32r128
1951220	0	229	1.8	8916.3	838.4	0.000	0.001	0.005	0.440	361847	55.7	0.185	14	122.5	218.5	10.1	1.449	108683	9140	pg164_o2nofp.cx9a2a_c32r128
1972265	0	241	2.0	9001.4	848.2	0.000	0.001	0.005	0.440	351303	55.2	0.178	13	122.5	218.5	25.2	1.245	110282	9290	pg17beta3_o2nofp.cx9a2a_c32r128
2006270	0	217	1.8	9140.8	859.6	0.000	0.001	0.005	0.439	349082	55.8	0.174	13	122.5	218.5	95.9	1.286	110856	17681	pg17rc1_o2nofp.cx9a2a_c32r128
l.x
l.x: create secondary indexes
Performance metrics for all DBMS, not just the ones listed above. Some are normalized by throughput, others are not. Legend for results is here.
ips	qps	rps	rmbps	wps	wmbps	rpq	rkbpq	wpi	wkbpi	csps	cpups	cspq	cpupq	dbgb1	dbgb2	rss	maxop	p50	p99	tag
330493	0	1509	47.7	17799.3	637.1	0.005	0.148	0.054	1.974	117330	36.1	0.355	52	178.4	278.9	107.2	0.003	NA	NA	my5651_rel_o2nofp.cz11a_c32r128
2074554	0	7346	913.5	33307.6	2072.8	0.004	0.451	0.016	1.023	216112	27.2	0.104	6	193.9	294.4	109.0	0.001	NA	NA	my5744_rel_o2nofp.cz11a_c32r128
1426979	0	12142	628.7	42868.5	1711.3	0.009	0.451	0.030	1.228	244963	69.6	0.172	23	193.3	293.9	108.0	0.008	NA	NA	my8039_rel_o2nofp.cz11a_c32r128
2942529	0	9077	556.6	8407.6	871.6	0.003	0.194	0.003	0.303	141800	22.8	0.048	4	245.9	342.0	18.0	0.002	NA	NA	pg158_o2nofp.cx9a2a_c32r128
2976744	0	9310	553.9	8567.3	882.1	0.003	0.191	0.003	0.303	152447	22.1	0.051	4	245.9	342.0	19.5	0.074	NA	NA	pg164_o2nofp.cx9a2a_c32r128
3368421	0	10370	637.2	9383.1	991.5	0.003	0.194	0.003	0.301	84592	23.8	0.025	3	245.9	341.9	17.1	0.002	NA	NA	pg17beta3_o2nofp.cx9a2a_c32r128
3316062	0	10364	647.9	9302.1	980.2	0.003	0.200	0.003	0.303	82090	24.0	0.025	3	245.9	341.9	18.0	0.002	NA	NA	pg17rc1_o2nofp.cx9a2a_c32r128
l.i1
l.i1: continue load after secondary indexes created with 50 inserts per transaction
Performance metrics for all DBMS, not just the ones listed above. Some are normalized by throughput, others are not. Legend for results is here.
ips	qps	rps	rmbps	wps	wmbps	rpq	rkbpq	wpi	wkbpi	csps	cpups	cspq	cpupq	dbgb1	dbgb2	rss	maxop	p50	p99	tag
27586	0	15552	233.2	30480.8	736.5	0.564	8.657	1.105	27.340	256912	35.7	9.313	621	268.1	373.3	104.8	0.511	1648	150	my5651_rel_o2nofp.cz11a_c32r128
39062	0	19974	312.1	34859.2	1003.3	0.511	8.182	0.892	26.302	206562	35.7	5.288	439	268.5	374.2	107.0	0.465	200	150	my5744_rel_o2nofp.cz11a_c32r128
46838	0	22406	350.1	39630.4	1247.4	0.478	7.654	0.846	27.271	362196	28.6	7.733	293	267.4	375.0	108.2	0.626	1649	899	my8039_rel_o2nofp.cz11a_c32r128
73937	0	11447	162.0	18132.8	868.8	0.155	2.243	0.245	12.032	67266	32.9	0.910	214	257.5	353.5	37.2	1.507	3996	849	pg158_o2nofp.cx9a2a_c32r128
73801	0	11680	163.3	17855.1	871.0	0.158	2.266	0.242	12.086	67237	33.9	0.911	220	257.6	353.6	52.7	1.802	3098	999	pg164_o2nofp.cx9a2a_c32r128
67969	0	10594	149.1	17486.3	826.0	0.156	2.247	0.257	12.444	60819	32.7	0.895	231	257.6	353.6	0.8	1.659	3697	1099	pg17beta3_o2nofp.cx9a2a_c32r128
73529	0	11488	163.3	17636.0	837.5	0.156	2.274	0.240	11.663	65344	32.2	0.889	210	256.7	373.6	94.0	1.452	3248	1099	pg17rc1_o2nofp.cx9a2a_c32r128
l.i2
l.i2: continue load after secondary indexes created with 5 inserts per transaction
Performance metrics for all DBMS, not just the ones listed above. Some are normalized by throughput, others are not. Legend for results is here.
ips	qps	rps	rmbps	wps	wmbps	rpq	rkbpq	wpi	wkbpi	csps	cpups	cspq	cpupq	dbgb1	dbgb2	rss	maxop	p50	p99	tag
14347	0	10817	141.8	22677.1	589.3	0.754	10.122	1.581	42.062	367777	33.6	25.634	1124	268.1	373.3	104.3	0.149	874	150	my5651_rel_o2nofp.cz11a_c32r128
25000	0	13762	215.0	32892.7	964.3	0.550	8.808	1.316	39.496	266986	31.2	10.679	599	268.5	374.2	107.0	0.253	180	160	my5744_rel_o2nofp.cz11a_c32r128
27397	0	17898	279.7	38124.1	1191.6	0.653	10.453	1.392	44.539	411618	28.5	15.024	499	267.4	372.2	106.1	0.416	340	245	my8039_rel_o2nofp.cz11a_c32r128
8532	0	119	4.8	3757.9	127.4	0.014	0.572	0.440	15.285	42559	26.2	4.988	1474	258.1	354.2	36.5	0.766	400	260	pg158_o2nofp.cx9a2a_c32r128
7015	0	135	2.8	3132.7	111.2	0.019	0.405	0.447	16.239	35069	21.4	4.999	1464	258.0	354.1	36.5	0.720	585	340	pg164_o2nofp.cx9a2a_c32r128
7323	0	178	7.0	3193.2	108.8	0.024	0.978	0.436	15.213	32591	20.1	4.450	1317	258.3	354.3	5.2	0.535	795	509	pg17beta3_o2nofp.cx9a2a_c32r128
6500	0	128	5.4	2705.5	96.7	0.020	0.844	0.416	15.239	28973	23.1	4.457	1706	257.8	353.9	94.0	0.563	1364	685	pg17rc1_o2nofp.cx9a2a_c32r128
qr100.L1
qr100.L1: range queries with 100 insert/s per client
Performance metrics for all DBMS, not just the ones listed above. Some are normalized by throughput, others are not. Legend for results is here.
ips	qps	rps	rmbps	wps	wmbps	rpq	rkbpq	wpi	wkbpi	csps	cpups	cspq	cpupq	dbgb1	dbgb2	rss	maxop	p50	p99	tag
1977	246113	262	3.5	1720.5	51.0	0.001	0.014	0.870	26.400	949688	42.9	3.859	84	268.1	373.3	104.0	0.015	12623	11172	my5651_rel_o2nofp.cz11a_c32r128
1977	208125	189	3.0	3493.4	100.0	0.001	0.015	1.767	51.803	806237	43.4	3.874	100	268.5	374.2	107.0	0.016	10552	9974	my5744_rel_o2nofp.cz11a_c32r128
1977	187093	117	1.8	3743.5	108.9	0.001	0.010	1.894	56.396	727325	43.1	3.888	111	267.4	372.2	106.1	0.014	9510	8998	my8039_rel_o2nofp.cz11a_c32r128
1977	376934	21	0.8	958.7	32.3	0.000	0.002	0.485	16.720	1431543	42.7	3.798	54	258.1	354.2	96.4	0.016	19275	17837	pg158_o2nofp.cx9a2a_c32r128
1977	376412	32	1.0	906.4	32.3	0.000	0.003	0.458	16.730	1429376	42.7	3.797	54	258.0	354.1	96.2	0.016	18924	17405	pg164_o2nofp.cx9a2a_c32r128
1977	378857	28	0.9	920.8	32.3	0.000	0.002	0.466	16.752	1438152	42.7	3.796	54	258.3	354.3	0.7	0.017	19314	17539	pg17beta3_o2nofp.cx9a2a_c32r128
1977	380459	27	0.8	950.1	32.2	0.000	0.002	0.481	16.675	1444480	42.7	3.797	54	257.9	353.9	95.8	0.016	19387	17821	pg17rc1_o2nofp.cx9a2a_c32r128
qp100.L2
qp100.L2: point queries with 100 insert/s per client
Performance metrics for all DBMS, not just the ones listed above. Some are normalized by throughput, others are not. Legend for results is here.
ips	qps	rps	rmbps	wps	wmbps	rpq	rkbpq	wpi	wkbpi	csps	cpups	cspq	cpupq	dbgb1	dbgb2	rss	maxop	p50	p99	tag
1976	133990	13539	210.8	15774.8	360.8	0.101	1.611	7.984	186.968	558092	40.8	4.165	146	268.1	373.3	104.0	0.037	7288	527	my5651_rel_o2nofp.cz11a_c32r128
1976	126652	13496	210.9	14482.7	366.1	0.107	1.705	7.330	189.718	551525	41.5	4.355	157	268.5	374.2	107.0	0.049	6697	655	my5744_rel_o2nofp.cz11a_c32r128
1977	101646	13399	209.4	13144.7	370.0	0.132	2.110	6.649	191.644	442375	41.6	4.352	196	267.4	372.2	106.1	0.014	5407	751	my8039_rel_o2nofp.cz11a_c32r128
1977	22038	74676	611.7	6343.5	69.7	3.389	28.423	3.209	36.122	240928	26.0	10.932	566	258.1	354.2	96.0	1.986	1231	511	pg158_o2nofp.cx9a2a_c32r128
1977	24387	81267	665.7	6299.9	69.6	3.332	27.953	3.187	36.072	264365	29.1	10.840	573	258.0	354.1	96.1	0.950	1518	528	pg164_o2nofp.cx9a2a_c32r128
1976	22963	77666	636.1	6307.8	69.6	3.382	28.367	3.193	36.058	252175	27.3	10.982	571	258.3	354.3	0.9	3.020	1359	495	pg17beta3_o2nofp.cx9a2a_c32r128
1977	24369	81806	670.1	6336.1	69.7	3.357	28.159	3.205	36.105	265279	29.3	10.886	577	257.9	353.9	95.2	2.336	1295	543	pg17rc1_o2nofp.cx9a2a_c32r128
qr500.L3
qr500.L3: range queries with 500 insert/s per client
Performance metrics for all DBMS, not just the ones listed above. Some are normalized by throughput, others are not. Legend for results is here.
ips	qps	rps	rmbps	wps	wmbps	rpq	rkbpq	wpi	wkbpi	csps	cpups	cspq	cpupq	dbgb1	dbgb2	rss	maxop	p50	p99	tag
9879	209293	4202	62.9	9428.2	266.6	0.020	0.308	0.954	27.634	858908	46.2	4.104	106	268.1	373.3	104.2	0.098	10964	1375	my5651_rel_o2nofp.cz11a_c32r128
9879	198302	3840	60.0	8838.9	254.7	0.019	0.310	0.895	26.401	786952	47.2	3.968	114	268.5	374.2	107.0	0.028	10165	4123	my5744_rel_o2nofp.cz11a_c32r128
9885	181244	4148	64.8	9992.3	300.1	0.023	0.366	1.011	31.087	734486	46.6	4.052	123	267.4	372.2	106.1	0.029	9238	8266	my8039_rel_o2nofp.cz11a_c32r128
9868	341294	6173	53.6	7235.0	163.4	0.018	0.161	0.733	16.960	1292858	46.3	3.788	65	258.4	354.4	86.6	2.245	17389	14800	pg158_o2nofp.cx9a2a_c32r128
9847	340022	6209	53.7	7229.2	163.8	0.018	0.162	0.734	17.030	1287051	45.7	3.785	65	258.2	354.3	88.7	2.780	17405	14998	pg164_o2nofp.cx9a2a_c32r128
9863	343246	6185	53.7	7231.3	163.7	0.018	0.160	0.733	16.992	1298423	46.2	3.783	65	258.4	354.5	84.0	2.856	17565	15503	pg17beta3_o2nofp.cx9a2a_c32r128
9852	342689	6171	53.7	7240.0	163.7	0.018	0.160	0.735	17.012	1297163	46.2	3.785	65	258.2	354.3	84.7	1.805	17453	15296	pg17rc1_o2nofp.cx9a2a_c32r128
qp500.L4
qp500.L4: point queries with 500 insert/s per client
Performance metrics for all DBMS, not just the ones listed above. Some are normalized by throughput, others are not. Legend for results is here.
ips	qps	rps	rmbps	wps	wmbps	rpq	rkbpq	wpi	wkbpi	csps	cpups	cspq	cpupq	dbgb1	dbgb2	rss	maxop	p50	p99	tag
9885	78923	42241	656.2	56373.9	924.7	0.535	8.514	5.703	95.795	660394	47.6	8.368	289	268.1	373.3	105.0	0.037	5914	368	my5651_rel_o2nofp.cz11a_c32r128
9885	93297	50552	789.9	60533.4	1302.5	0.542	8.669	6.124	134.935	640147	48.9	6.861	252	268.5	374.2	107.0	0.021	5420	479	my5744_rel_o2nofp.cz11a_c32r128
9885	78424	53470	835.5	47677.8	1310.5	0.682	10.909	4.823	135.763	548505	45.2	6.994	277	267.4	372.2	106.1	0.019	4524	575	my8039_rel_o2nofp.cz11a_c32r128
9879	18255	90692	723.7	22073.7	266.3	4.968	40.597	2.234	27.603	258913	36.8	14.183	968	259.7	355.7	82.8	1.015	1007	368	pg158_o2nofp.cx9a2a_c32r128
9868	18439	91127	726.3	22077.6	265.4	4.942	40.334	2.237	27.538	261871	37.6	14.202	979	259.7	355.7	86.5	2.913	991	384	pg164_o2nofp.cx9a2a_c32r128
9879	18539	91634	730.4	21986.3	264.9	4.943	40.343	2.226	27.456	261012	38.3	14.079	992	259.7	355.7	84.0	0.964	991	431	pg17beta3_o2nofp.cx9a2a_c32r128
9879	18177	90430	720.9	22048.6	266.2	4.975	40.609	2.232	27.590	257422	37.5	14.162	990	259.5	355.6	84.7	1.599	975	415	pg17rc1_o2nofp.cx9a2a_c32r128
qr1000.L5
qr1000.L5: range queries with 1000 insert/s per client
Performance metrics for all DBMS, not just the ones listed above. Some are normalized by throughput, others are not. Legend for results is here.
ips	qps	rps	rmbps	wps	wmbps	rpq	rkbpq	wpi	wkbpi	csps	cpups	cspq	cpupq	dbgb1	dbgb2	rss	maxop	p50	p99	tag
19769	180610	4156	59.7	10856.3	321.8	0.023	0.338	0.549	16.668	775134	50.4	4.292	134	268.1	373.3	105.0	0.067	9446	1103	my5651_rel_o2nofp.cz11a_c32r128
19769	188379	3929	61.4	13563.2	400.8	0.021	0.334	0.686	20.760	749200	52.0	3.977	132	268.5	374.2	107.0	0.032	9685	4875	my5744_rel_o2nofp.cz11a_c32r128
19769	175950	3880	60.6	13727.0	422.3	0.022	0.353	0.694	21.875	727868	49.3	4.137	134	267.4	372.2	106.1	0.026	8950	7850	my8039_rel_o2nofp.cz11a_c32r128
19672	274450	8289	114.0	14837.7	417.3	0.030	0.425	0.754	21.721	977416	55.8	3.561	98	263.5	359.6	52.9	3.735	13873	9478	pg158_o2nofp.cx9a2a_c32r128
19715	275278	8355	115.0	15320.5	423.0	0.030	0.428	0.777	21.972	980254	56.4	3.561	98	263.5	359.6	56.8	1.990	13878	9247	pg164_o2nofp.cx9a2a_c32r128
19704	278876	8363	114.9	15193.3	421.4	0.030	0.422	0.771	21.902	992902	56.6	3.560	97	263.3	359.4	92.2	3.412	14001	9989	pg17beta3_o2nofp.cx9a2a_c32r128
19640	270542	8314	114.5	15215.7	420.8	0.031	0.433	0.775	21.940	962296	56.0	3.557	99	263.5	359.5	91.9	3.889	13658	8423	pg17rc1_o2nofp.cx9a2a_c32r128
qp1000.L6
qp1000.L6: point queries with 1000 insert/s per client
Performance metrics for all DBMS, not just the ones listed above. Some are normalized by throughput, others are not. Legend for results is here.
ips	qps	rps	rmbps	wps	wmbps	rpq	rkbpq	wpi	wkbpi	csps	cpups	cspq	cpupq	dbgb1	dbgb2	rss	maxop	p50	p99	tag
19769	62268	43736	676.1	47234.0	798.0	0.702	11.118	2.389	41.333	572078	52.5	9.187	405	268.1	378.3	105.0	0.041	5738	336	my5651_rel_o2nofp.cz11a_c32r128
19769	72669	68050	1063.3	59109.1	1306.5	0.936	14.983	2.990	67.676	589315	47.8	8.110	316	268.5	374.2	107.0	0.043	6105	448	my5744_rel_o2nofp.cz11a_c32r128
19769	60585	65182	1018.5	43655.5	1249.3	1.076	17.214	2.208	64.713	523099	47.0	8.634	372	267.4	373.2	106.1	0.029	4587	495	my8039_rel_o2nofp.cz11a_c32r128
19694	12827	95103	755.4	35291.8	468.9	7.414	60.303	1.792	24.380	249349	43.6	19.439	1632	264.5	360.5	89.3	1.539	671	192	pg158_o2nofp.cx9a2a_c32r128
19651	12643	94256	748.7	34953.8	464.7	7.455	60.639	1.779	24.217	246802	44.4	19.521	1686	264.5	360.5	56.5	5.200	671	223	pg164_o2nofp.cx9a2a_c32r128
19715	12324	93129	739.8	34984.8	465.0	7.557	61.470	1.775	24.150	243843	45.1	19.787	1757	264.4	360.4	86.4	1.443	655	224	pg17beta3_o2nofp.cx9a2a_c32r128
19661	12472	93538	742.9	34892.1	465.4	7.500	61.001	1.775	24.237	244953	44.3	19.641	1705	264.4	360.4	78.1	4.045	655	192	pg17rc1_o2nofp.cx9a2a_c32r128
l.i0
- l.i0: load without secondary indexes
- Legend for results is here.
- Each entry lists the percentage of responses that fit in that bucket (slower than max time for previous bucket, faster than min time for next bucket).
Insert response time histogram
256us	1ms	4ms	16ms	64ms	256ms	1s	4s	16s	gt	max	tag
0.000	0.406	33.195	65.946	0.417	0.037	0.000	0.000	0.000	0.000	0.190	my5651_rel_o2nofp.cz11a_c32r128
0.000	0.400	99.363	0.190	0.010	0.037	0.000	0.000	0.000	0.000	0.178	my5744_rel_o2nofp.cz11a_c32r128
0.000	0.240	99.670	0.038	0.012	0.039	0.000	0.000	0.000	0.000	0.234	my8039_rel_o2nofp.cz11a_c32r128
0.000	89.099	10.747	0.084	0.055	0.008	0.006	0.001	0.000	0.000	2.275	pg158_o2nofp.cx9a2a_c32r128
0.000	87.870	11.971	0.086	0.059	0.008	0.006	nonzero	0.000	0.000	1.449	pg164_o2nofp.cx9a2a_c32r128
0.000	89.346	10.463	0.125	0.049	0.010	0.006	nonzero	0.000	0.000	1.245	pg17beta3_o2nofp.cx9a2a_c32r128
0.000	90.440	9.379	0.115	0.049	0.010	0.007	nonzero	0.000	0.000	1.286	pg17rc1_o2nofp.cx9a2a_c32r128
l.x
- l.x: create secondary indexes
- Legend for results is here.
- Each entry lists the percentage of responses that fit in that bucket (slower than max time for previous bucket, faster than min time for next bucket).
TODO - determine whether there is data for create index response time
l.i1
- l.i1: continue load after secondary indexes created with 50 inserts per transaction
- Legend for results is here.
- Each entry lists the percentage of responses that fit in that bucket (slower than max time for previous bucket, faster than min time for next bucket).
Insert response time histogram
256us	1ms	4ms	16ms	64ms	256ms	1s	4s	16s	gt	max	tag
0.000	0.000	1.161	28.206	63.883	0.665	6.086	0.000	0.000	0.000	0.511	my5651_rel_o2nofp.cz11a_c32r128
0.000	0.000	6.661	82.076	5.334	0.515	5.414	0.000	0.000	0.000	0.465	my5744_rel_o2nofp.cz11a_c32r128
0.000	0.000	16.810	31.385	50.462	1.229	0.114	0.000	0.000	0.000	0.626	my8039_rel_o2nofp.cz11a_c32r128
0.000	0.582	75.621	11.599	12.059	0.118	0.021	0.001	0.000	0.000	1.507	pg158_o2nofp.cx9a2a_c32r128
0.000	0.356	75.606	12.336	11.605	0.074	0.021	0.003	0.000	0.000	1.802	pg164_o2nofp.cx9a2a_c32r128
0.000	0.743	75.187	11.551	12.379	0.122	0.016	0.002	0.000	0.000	1.659	pg17beta3_o2nofp.cx9a2a_c32r128
0.000	1.220	74.438	11.768	12.454	0.101	0.017	0.002	0.000	0.000	1.452	pg17rc1_o2nofp.cx9a2a_c32r128
Delete response time histogram
256us	1ms	4ms	16ms	64ms	256ms	1s	4s	16s	gt	max	tag
0.000	0.000	0.284	26.322	66.681	0.609	6.105	0.000	0.000	0.000	0.600	my5651_rel_o2nofp.cz11a_c32r128
0.000	nonzero	7.681	83.969	2.440	0.483	5.426	0.000	0.000	0.000	0.465	my5744_rel_o2nofp.cz11a_c32r128
0.000	0.000	17.414	32.209	49.252	1.024	0.100	0.000	0.000	0.000	0.625	my8039_rel_o2nofp.cz11a_c32r128
0.000	7.662	29.932	45.957	16.358	0.086	0.004	nonzero	0.000	0.000	1.010	pg158_o2nofp.cx9a2a_c32r128
0.000	7.330	27.116	48.767	16.731	0.054	0.001	0.001	0.000	0.000	1.702	pg164_o2nofp.cx9a2a_c32r128
0.000	8.228	26.491	43.985	21.198	0.094	0.003	nonzero	0.000	0.000	1.282	pg17beta3_o2nofp.cx9a2a_c32r128
0.000	8.343	29.902	44.096	17.566	0.089	0.004	nonzero	0.000	0.000	1.225	pg17rc1_o2nofp.cx9a2a_c32r128
l.i2
- l.i2: continue load after secondary indexes created with 5 inserts per transaction
- Legend for results is here.
- Each entry lists the percentage of responses that fit in that bucket (slower than max time for previous bucket, faster than min time for next bucket).
Insert response time histogram
256us	1ms	4ms	16ms	64ms	256ms	1s	4s	16s	gt	max	tag
0.006	0.787	46.170	42.368	10.662	0.007	0.000	0.000	0.000	0.000	0.149	my5651_rel_o2nofp.cz11a_c32r128
0.043	24.135	65.994	0.963	8.844	0.021	0.000	0.000	0.000	0.000	0.253	my5744_rel_o2nofp.cz11a_c32r128
0.003	33.510	49.812	8.068	8.594	0.013	nonzero	0.000	0.000	0.000	0.416	my8039_rel_o2nofp.cz11a_c32r128
9.100	90.877	0.019	0.002	nonzero	0.001	nonzero	0.000	0.000	0.000	0.766	pg158_o2nofp.cx9a2a_c32r128
7.251	92.708	0.037	0.001	0.001	0.001	0.001	0.000	0.000	0.000	0.720	pg164_o2nofp.cx9a2a_c32r128
15.558	84.379	0.053	0.008	0.001	0.001	nonzero	0.000	0.000	0.000	0.535	pg17beta3_o2nofp.cx9a2a_c32r128
10.046	89.913	0.036	0.003	0.001	0.001	0.001	0.000	0.000	0.000	0.563	pg17rc1_o2nofp.cx9a2a_c32r128
Delete response time histogram
256us	1ms	4ms	16ms	64ms	256ms	1s	4s	16s	gt	max	tag
0.001	0.912	49.662	38.756	10.663	0.006	0.000	0.000	0.000	0.000	0.154	my5651_rel_o2nofp.cz11a_c32r128
0.071	24.253	66.002	0.820	8.844	0.011	0.000	0.000	0.000	0.000	0.253	my5744_rel_o2nofp.cz11a_c32r128
0.002	37.047	46.683	7.932	8.324	0.011	0.000	0.000	0.000	0.000	0.183	my8039_rel_o2nofp.cz11a_c32r128
0.260	2.547	20.683	75.152	1.357	nonzero	0.000	0.000	0.000	0.000	0.112	pg158_o2nofp.cx9a2a_c32r128
0.000	0.000	23.701	72.703	3.596	nonzero	0.000	0.000	0.000	0.000	0.087	pg164_o2nofp.cx9a2a_c32r128
0.440	4.699	38.177	51.243	5.441	nonzero	nonzero	0.000	0.000	0.000	0.279	pg17beta3_o2nofp.cx9a2a_c32r128
0.515	2.439	18.707	71.610	6.728	0.001	0.000	0.000	0.000	0.000	0.112	pg17rc1_o2nofp.cx9a2a_c32r128
qr100.L1
- qr100.L1: range queries with 100 insert/s per client
- Legend for results is here.
- Each entry lists the percentage of responses that fit in that bucket (slower than max time for previous bucket, faster than min time for next bucket).
Query response time histogram
256us	1ms	4ms	16ms	64ms	256ms	1s	4s	16s	gt	max	tag
99.915	0.068	0.016	0.001	0.000	0.000	0.000	0.000	0.000	0.000	0.015	my5651_rel_o2nofp.cz11a_c32r128
99.980	0.015	0.005	nonzero	0.000	0.000	0.000	0.000	0.000	0.000	0.016	my5744_rel_o2nofp.cz11a_c32r128
99.975	0.022	0.003	nonzero	0.000	0.000	0.000	0.000	0.000	0.000	0.014	my8039_rel_o2nofp.cz11a_c32r128
99.995	0.003	0.002	nonzero	nonzero	0.000	0.000	0.000	0.000	0.000	0.016	pg158_o2nofp.cx9a2a_c32r128
99.994	0.004	0.002	nonzero	nonzero	0.000	0.000	0.000	0.000	0.000	0.016	pg164_o2nofp.cx9a2a_c32r128
99.995	0.003	0.002	nonzero	nonzero	0.000	0.000	0.000	0.000	0.000	0.017	pg17beta3_o2nofp.cx9a2a_c32r128
99.995	0.003	0.002	nonzero	nonzero	0.000	0.000	0.000	0.000	0.000	0.016	pg17rc1_o2nofp.cx9a2a_c32r128
Insert response time histogram
256us	1ms	4ms	16ms	64ms	256ms	1s	4s	16s	gt	max	tag
0.000	0.000	16.951	76.499	6.550	0.000	0.000	0.000	0.000	0.000	0.036	my5651_rel_o2nofp.cz11a_c32r128
0.000	0.000	96.383	3.611	0.006	0.000	0.000	0.000	0.000	0.000	0.025	my5744_rel_o2nofp.cz11a_c32r128
0.000	0.000	94.701	5.299	0.000	0.000	0.000	0.000	0.000	0.000	0.013	my8039_rel_o2nofp.cz11a_c32r128
0.000	0.000	98.368	1.632	0.000	0.000	0.000	0.000	0.000	0.000	0.015	pg158_o2nofp.cx9a2a_c32r128
0.000	0.000	98.653	1.331	0.017	0.000	0.000	0.000	0.000	0.000	0.036	pg164_o2nofp.cx9a2a_c32r128
0.000	0.000	98.254	1.731	0.015	0.000	0.000	0.000	0.000	0.000	0.018	pg17beta3_o2nofp.cx9a2a_c32r128
0.000	0.000	98.343	1.639	0.018	0.000	0.000	0.000	0.000	0.000	0.019	pg17rc1_o2nofp.cx9a2a_c32r128
Delete response time histogram
256us	1ms	4ms	16ms	64ms	256ms	1s	4s	16s	gt	max	tag
0.000	0.000	30.142	66.133	3.725	0.000	0.000	0.000	0.000	0.000	0.033	my5651_rel_o2nofp.cz11a_c32r128
0.000	0.001	98.111	1.885	0.003	0.000	0.000	0.000	0.000	0.000	0.020	my5744_rel_o2nofp.cz11a_c32r128
0.000	0.000	97.653	2.347	0.000	0.000	0.000	0.000	0.000	0.000	0.011	my8039_rel_o2nofp.cz11a_c32r128
0.000	44.742	55.056	0.203	0.000	0.000	0.000	0.000	0.000	0.000	0.012	pg158_o2nofp.cx9a2a_c32r128
0.000	46.999	52.792	0.182	0.028	0.000	0.000	0.000	0.000	0.000	0.034	pg164_o2nofp.cx9a2a_c32r128
0.000	49.183	50.600	0.217	0.000	0.000	0.000	0.000	0.000	0.000	0.014	pg17beta3_o2nofp.cx9a2a_c32r128
0.000	47.503	52.293	0.204	0.000	0.000	0.000	0.000	0.000	0.000	0.015	pg17rc1_o2nofp.cx9a2a_c32r128
qp100.L2
- qp100.L2: point queries with 100 insert/s per client
- Legend for results is here.
- Each entry lists the percentage of responses that fit in that bucket (slower than max time for previous bucket, faster than min time for next bucket).
Query response time histogram
256us	1ms	4ms	16ms	64ms	256ms	1s	4s	16s	gt	max	tag
98.481	1.056	0.423	0.039	nonzero	0.000	0.000	0.000	0.000	0.000	0.037	my5651_rel_o2nofp.cz11a_c32r128
97.909	1.723	0.360	0.008	nonzero	0.000	0.000	0.000	0.000	0.000	0.049	my5744_rel_o2nofp.cz11a_c32r128
96.622	3.013	0.348	0.017	0.000	0.000	0.000	0.000	0.000	0.000	0.014	my8039_rel_o2nofp.cz11a_c32r128
13.026	83.449	2.805	0.144	0.575	nonzero	nonzero	nonzero	0.000	0.000	1.986	pg158_o2nofp.cx9a2a_c32r128
13.197	83.283	2.760	0.114	0.645	nonzero	nonzero	0.000	0.000	0.000	0.950	pg164_o2nofp.cx9a2a_c32r128
12.298	84.094	2.911	0.105	0.591	nonzero	nonzero	nonzero	0.000	0.000	3.020	pg17beta3_o2nofp.cx9a2a_c32r128
12.051	84.550	2.650	0.098	0.650	nonzero	nonzero	nonzero	0.000	0.000	2.336	pg17rc1_o2nofp.cx9a2a_c32r128
Insert response time histogram
256us	1ms	4ms	16ms	64ms	256ms	1s	4s	16s	gt	max	tag
0.000	0.000	0.067	21.771	78.017	0.146	0.000	0.000	0.000	0.000	0.095	my5651_rel_o2nofp.cz11a_c32r128
0.000	0.000	0.214	86.607	12.986	0.193	0.000	0.000	0.000	0.000	0.143	my5744_rel_o2nofp.cz11a_c32r128
0.000	0.000	0.714	96.471	2.815	0.000	0.000	0.000	0.000	0.000	0.034	my8039_rel_o2nofp.cz11a_c32r128
0.000	0.000	0.183	67.256	32.146	0.279	0.081	0.056	0.000	0.000	1.131	pg158_o2nofp.cx9a2a_c32r128
0.000	0.000	0.415	64.981	34.485	0.061	0.058	0.000	0.000	0.000	0.819	pg164_o2nofp.cx9a2a_c32r128
0.000	0.000	0.365	66.408	32.867	0.172	0.129	0.058	0.000	0.000	2.658	pg17beta3_o2nofp.cx9a2a_c32r128
0.000	0.000	0.331	69.633	29.837	0.171	0.001	0.026	0.000	0.000	2.132	pg17rc1_o2nofp.cx9a2a_c32r128
Delete response time histogram
256us	1ms	4ms	16ms	64ms	256ms	1s	4s	16s	gt	max	tag
0.000	0.000	8.037	79.421	12.539	0.003	0.000	0.000	0.000	0.000	0.069	my5651_rel_o2nofp.cz11a_c32r128
0.000	0.000	77.976	21.931	0.088	0.006	0.000	0.000	0.000	0.000	0.091	my5744_rel_o2nofp.cz11a_c32r128
0.000	0.000	92.306	7.694	0.000	0.000	0.000	0.000	0.000	0.000	0.013	my8039_rel_o2nofp.cz11a_c32r128
0.000	0.000	91.024	4.197	4.775	0.001	0.001	0.001	0.000	0.000	1.035	pg158_o2nofp.cx9a2a_c32r128
0.000	0.000	97.057	0.378	2.558	0.000	0.007	0.000	0.000	0.000	0.798	pg164_o2nofp.cx9a2a_c32r128
0.000	0.000	94.640	2.769	2.540	0.003	0.044	0.003	0.000	0.000	2.459	pg17beta3_o2nofp.cx9a2a_c32r128
0.000	0.000	93.318	3.949	2.718	0.015	0.000	0.000	0.000	0.000	0.121	pg17rc1_o2nofp.cx9a2a_c32r128
qr500.L3
- qr500.L3: range queries with 500 insert/s per client
- Legend for results is here.
- Each entry lists the percentage of responses that fit in that bucket (slower than max time for previous bucket, faster than min time for next bucket).
Query response time histogram
256us	1ms	4ms	16ms	64ms	256ms	1s	4s	16s	gt	max	tag
99.126	0.682	0.160	0.032	nonzero	nonzero	0.000	0.000	0.000	0.000	0.098	my5651_rel_o2nofp.cz11a_c32r128
99.839	0.086	0.071	0.004	nonzero	0.000	0.000	0.000	0.000	0.000	0.028	my5744_rel_o2nofp.cz11a_c32r128
99.858	0.119	0.022	0.001	nonzero	0.000	0.000	0.000	0.000	0.000	0.029	my8039_rel_o2nofp.cz11a_c32r128
99.971	0.025	0.004	nonzero	nonzero	nonzero	nonzero	nonzero	0.000	0.000	2.245	pg158_o2nofp.cx9a2a_c32r128
99.966	0.029	0.004	0.001	nonzero	nonzero	nonzero	nonzero	0.000	0.000	2.780	pg164_o2nofp.cx9a2a_c32r128
99.972	0.023	0.005	nonzero	nonzero	nonzero	nonzero	nonzero	0.000	0.000	2.856	pg17beta3_o2nofp.cx9a2a_c32r128
99.972	0.023	0.005	0.001	nonzero	nonzero	nonzero	nonzero	0.000	0.000	1.805	pg17rc1_o2nofp.cx9a2a_c32r128
Insert response time histogram
256us	1ms	4ms	16ms	64ms	256ms	1s	4s	16s	gt	max	tag
0.000	0.000	3.724	55.114	40.793	0.369	nonzero	0.000	0.000	0.000	0.262	my5651_rel_o2nofp.cz11a_c32r128
0.000	0.000	50.497	46.773	2.726	0.004	0.000	0.000	0.000	0.000	0.095	my5744_rel_o2nofp.cz11a_c32r128
0.000	0.000	40.036	58.009	1.954	0.000	0.000	0.000	0.000	0.000	0.052	my8039_rel_o2nofp.cz11a_c32r128
0.000	0.000	49.161	47.788	2.636	0.146	0.197	0.072	0.000	0.000	3.318	pg158_o2nofp.cx9a2a_c32r128
0.000	0.000	46.541	51.200	1.964	0.089	0.135	0.072	0.000	0.000	3.308	pg164_o2nofp.cx9a2a_c32r128
0.000	0.000	52.125	45.525	2.053	0.097	0.140	0.060	0.000	0.000	3.487	pg17beta3_o2nofp.cx9a2a_c32r128
0.000	0.000	51.771	45.785	2.152	0.085	0.140	0.066	0.001	0.000	4.779	pg17rc1_o2nofp.cx9a2a_c32r128
Delete response time histogram
256us	1ms	4ms	16ms	64ms	256ms	1s	4s	16s	gt	max	tag
0.000	0.001	6.030	62.216	31.752	0.001	0.000	0.000	0.000	0.000	0.091	my5651_rel_o2nofp.cz11a_c32r128
0.000	0.003	60.449	38.899	0.649	0.000	0.000	0.000	0.000	0.000	0.042	my5744_rel_o2nofp.cz11a_c32r128
0.000	0.000	57.102	42.688	0.210	0.000	0.000	0.000	0.000	0.000	0.047	my8039_rel_o2nofp.cz11a_c32r128
0.000	0.000	81.164	18.612	0.207	0.003	0.009	0.004	0.000	0.000	2.262	pg158_o2nofp.cx9a2a_c32r128
0.000	0.000	76.658	23.199	0.138	0.001	0.001	0.002	0.000	0.000	2.002	pg164_o2nofp.cx9a2a_c32r128
0.000	0.000	82.697	17.156	0.141	0.001	0.003	0.001	0.000	0.000	2.238	pg17beta3_o2nofp.cx9a2a_c32r128
0.000	0.000	74.422	25.429	0.141	0.003	0.004	0.001	0.000	0.000	3.538	pg17rc1_o2nofp.cx9a2a_c32r128
qp500.L4
- qp500.L4: point queries with 500 insert/s per client
- Legend for results is here.
- Each entry lists the percentage of responses that fit in that bucket (slower than max time for previous bucket, faster than min time for next bucket).
Query response time histogram
256us	1ms	4ms	16ms	64ms	256ms	1s	4s	16s	gt	max	tag
86.401	10.090	3.186	0.322	nonzero	0.000	0.000	0.000	0.000	0.000	0.037	my5651_rel_o2nofp.cz11a_c32r128
89.861	8.448	1.649	0.043	nonzero	0.000	0.000	0.000	0.000	0.000	0.021	my5744_rel_o2nofp.cz11a_c32r128
85.134	13.129	1.698	0.039	nonzero	0.000	0.000	0.000	0.000	0.000	0.019	my8039_rel_o2nofp.cz11a_c32r128
3.198	86.614	8.888	0.114	1.180	0.003	0.003	nonzero	0.000	0.000	1.015	pg158_o2nofp.cx9a2a_c32r128
3.184	86.722	8.835	0.036	1.220	0.001	0.002	nonzero	0.000	0.000	2.913	pg164_o2nofp.cx9a2a_c32r128
3.142	86.366	9.216	0.044	1.229	0.001	0.001	0.000	0.000	0.000	0.964	pg17beta3_o2nofp.cx9a2a_c32r128
3.138	86.333	9.290	0.046	1.189	0.002	0.002	nonzero	0.000	0.000	1.599	pg17rc1_o2nofp.cx9a2a_c32r128
Insert response time histogram
256us	1ms	4ms	16ms	64ms	256ms	1s	4s	16s	gt	max	tag
0.000	0.000	0.047	1.591	88.833	9.528	0.000	0.000	0.000	0.000	0.152	my5651_rel_o2nofp.cz11a_c32r128
0.000	0.000	0.201	6.754	92.932	0.112	0.000	0.000	0.000	0.000	0.096	my5744_rel_o2nofp.cz11a_c32r128
0.000	0.000	0.707	23.426	75.867	0.000	0.000	0.000	0.000	0.000	0.057	my8039_rel_o2nofp.cz11a_c32r128
0.000	0.000	0.089	63.384	35.992	0.289	0.234	0.013	0.000	0.000	1.654	pg158_o2nofp.cx9a2a_c32r128
0.000	0.000	0.103	69.971	29.637	0.115	0.157	0.016	0.000	0.000	2.515	pg164_o2nofp.cx9a2a_c32r128
0.000	0.000	0.113	65.192	34.458	0.120	0.114	0.003	0.000	0.000	1.276	pg17beta3_o2nofp.cx9a2a_c32r128
0.000	0.000	0.105	66.761	32.803	0.150	0.175	0.007	0.000	0.000	1.526	pg17rc1_o2nofp.cx9a2a_c32r128
Delete response time histogram
256us	1ms	4ms	16ms	64ms	256ms	1s	4s	16s	gt	max	tag
0.000	0.000	0.708	61.969	37.316	0.007	0.000	0.000	0.000	0.000	0.101	my5651_rel_o2nofp.cz11a_c32r128
0.000	0.000	10.992	84.257	4.751	0.000	0.000	0.000	0.000	0.000	0.050	my5744_rel_o2nofp.cz11a_c32r128
0.000	0.000	51.619	48.107	0.274	0.000	0.000	0.000	0.000	0.000	0.045	my8039_rel_o2nofp.cz11a_c32r128
0.000	0.000	1.232	93.355	5.222	0.107	0.084	0.001	0.000	0.000	1.023	pg158_o2nofp.cx9a2a_c32r128
0.000	0.000	2.301	94.334	3.240	0.058	0.066	0.001	0.000	0.000	2.395	pg164_o2nofp.cx9a2a_c32r128
0.000	0.000	2.474	93.966	3.454	0.051	0.055	0.000	0.000	0.000	0.676	pg17beta3_o2nofp.cx9a2a_c32r128
0.000	0.000	2.123	94.390	3.346	0.071	0.070	0.000	0.000	0.000	0.976	pg17rc1_o2nofp.cx9a2a_c32r128
qr1000.L5
- qr1000.L5: range queries with 1000 insert/s per client
- Legend for results is here.
- Each entry lists the percentage of responses that fit in that bucket (slower than max time for previous bucket, faster than min time for next bucket).
Query response time histogram
256us	1ms	4ms	16ms	64ms	256ms	1s	4s	16s	gt	max	tag
97.973	1.659	0.300	0.068	nonzero	nonzero	0.000	0.000	0.000	0.000	0.067	my5651_rel_o2nofp.cz11a_c32r128
99.716	0.173	0.099	0.012	nonzero	0.000	0.000	0.000	0.000	0.000	0.032	my5744_rel_o2nofp.cz11a_c32r128
99.782	0.171	0.044	0.003	nonzero	0.000	0.000	0.000	0.000	0.000	0.026	my8039_rel_o2nofp.cz11a_c32r128
99.811	0.154	0.019	0.010	0.007	nonzero	nonzero	nonzero	0.000	0.000	3.735	pg158_o2nofp.cx9a2a_c32r128
99.828	0.141	0.017	0.009	0.005	nonzero	nonzero	nonzero	0.000	0.000	1.990	pg164_o2nofp.cx9a2a_c32r128
99.837	0.133	0.017	0.008	0.005	nonzero	nonzero	nonzero	0.000	0.000	3.412	pg17beta3_o2nofp.cx9a2a_c32r128
99.813	0.149	0.019	0.011	0.007	nonzero	nonzero	nonzero	0.000	0.000	3.889	pg17rc1_o2nofp.cx9a2a_c32r128
Insert response time histogram
256us	1ms	4ms	16ms	64ms	256ms	1s	4s	16s	gt	max	tag
0.000	0.000	2.586	51.566	45.673	0.175	0.000	0.000	0.000	0.000	0.181	my5651_rel_o2nofp.cz11a_c32r128
0.000	0.000	21.283	74.238	4.479	0.000	0.000	0.000	0.000	0.000	0.059	my5744_rel_o2nofp.cz11a_c32r128
0.000	0.000	34.257	64.085	1.659	0.000	0.000	0.000	0.000	0.000	0.055	my8039_rel_o2nofp.cz11a_c32r128
0.000	0.000	51.576	34.815	12.723	0.772	0.087	0.028	nonzero	0.000	4.251	pg158_o2nofp.cx9a2a_c32r128
0.000	0.000	54.289	33.640	11.507	0.483	0.063	0.018	nonzero	0.000	4.675	pg164_o2nofp.cx9a2a_c32r128
0.000	0.000	54.197	34.015	11.336	0.389	0.052	0.011	0.001	0.000	5.129	pg17beta3_o2nofp.cx9a2a_c32r128
0.000	0.000	51.511	33.755	13.585	1.075	0.057	0.015	0.002	0.000	4.875	pg17rc1_o2nofp.cx9a2a_c32r128
Delete response time histogram
256us	1ms	4ms	16ms	64ms	256ms	1s	4s	16s	gt	max	tag
0.000	0.001	3.378	58.275	38.343	0.003	0.000	0.000	0.000	0.000	0.078	my5651_rel_o2nofp.cz11a_c32r128
0.000	0.003	27.866	69.114	3.017	0.000	0.000	0.000	0.000	0.000	0.051	my5744_rel_o2nofp.cz11a_c32r128
0.000	0.000	47.130	52.266	0.604	nonzero	0.000	0.000	0.000	0.000	0.070	my8039_rel_o2nofp.cz11a_c32r128
0.000	4.603	24.946	51.781	18.320	0.336	0.012	0.002	0.000	0.000	3.759	pg158_o2nofp.cx9a2a_c32r128
0.000	4.723	24.120	54.570	16.377	0.205	0.005	0.001	0.000	0.000	2.352	pg164_o2nofp.cx9a2a_c32r128
0.000	5.162	26.366	49.319	18.986	0.161	0.005	nonzero	0.000	0.000	3.957	pg17beta3_o2nofp.cx9a2a_c32r128
0.000	4.185	23.800	50.293	21.297	0.418	0.006	0.001	nonzero	0.000	4.276	pg17rc1_o2nofp.cx9a2a_c32r128
qp1000.L6
- qp1000.L6: point queries with 1000 insert/s per client
- Legend for results is here.
- Each entry lists the percentage of responses that fit in that bucket (slower than max time for previous bucket, faster than min time for next bucket).
Query response time histogram
256us	1ms	4ms	16ms	64ms	256ms	1s	4s	16s	gt	max	tag
80.824	12.764	5.980	0.431	0.001	0.000	0.000	0.000	0.000	0.000	0.041	my5651_rel_o2nofp.cz11a_c32r128
84.643	10.379	4.886	0.092	0.001	0.000	0.000	0.000	0.000	0.000	0.043	my5744_rel_o2nofp.cz11a_c32r128
75.557	19.937	4.399	0.107	nonzero	0.000	0.000	0.000	0.000	0.000	0.029	my8039_rel_o2nofp.cz11a_c32r128
0.427	65.808	31.491	0.396	1.868	0.005	0.005	nonzero	0.000	0.000	1.539	pg158_o2nofp.cx9a2a_c32r128
0.437	64.744	32.703	0.290	1.817	0.003	0.005	nonzero	nonzero	0.000	5.200	pg164_o2nofp.cx9a2a_c32r128
0.353	62.481	34.883	0.298	1.976	0.004	0.004	nonzero	0.000	0.000	1.443	pg17beta3_o2nofp.cx9a2a_c32r128
0.387	63.429	34.014	0.282	1.881	0.003	0.004	nonzero	nonzero	0.000	4.045	pg17rc1_o2nofp.cx9a2a_c32r128
Insert response time histogram
256us	1ms	4ms	16ms	64ms	256ms	1s	4s	16s	gt	max	tag
0.000	0.000	0.050	10.944	86.310	2.696	0.000	0.000	0.000	0.000	0.243	my5651_rel_o2nofp.cz11a_c32r128
0.000	0.000	0.193	41.661	58.069	0.077	0.000	0.000	0.000	0.000	0.099	my5744_rel_o2nofp.cz11a_c32r128
0.000	0.000	0.921	53.790	45.232	0.057	0.000	0.000	0.000	0.000	0.109	my8039_rel_o2nofp.cz11a_c32r128
0.000	0.000	0.388	58.457	40.701	0.281	0.155	0.018	0.000	0.000	1.548	pg158_o2nofp.cx9a2a_c32r128
0.000	0.000	0.392	57.575	41.677	0.188	0.159	0.006	0.002	0.000	5.135	pg164_o2nofp.cx9a2a_c32r128
0.000	0.000	0.370	57.125	42.122	0.236	0.138	0.009	0.000	0.000	1.578	pg17beta3_o2nofp.cx9a2a_c32r128
0.000	0.000	0.403	58.136	41.035	0.292	0.117	0.017	0.001	0.000	4.015	pg17rc1_o2nofp.cx9a2a_c32r128
Delete response time histogram
256us	1ms	4ms	16ms	64ms	256ms	1s	4s	16s	gt	max	tag
0.000	nonzero	0.190	26.557	72.845	0.408	0.000	0.000	0.000	0.000	0.203	my5651_rel_o2nofp.cz11a_c32r128
0.000	nonzero	11.111	85.369	3.519	0.001	0.000	0.000	0.000	0.000	0.078	my5744_rel_o2nofp.cz11a_c32r128
0.000	nonzero	22.368	71.783	5.844	0.005	0.000	0.000	0.000	0.000	0.092	my8039_rel_o2nofp.cz11a_c32r128
0.000	0.000	15.328	78.871	5.638	0.074	0.082	0.008	0.000	0.000	1.541	pg158_o2nofp.cx9a2a_c32r128
0.000	0.000	9.462	86.353	4.063	0.046	0.072	0.004	0.000	0.000	1.425	pg164_o2nofp.cx9a2a_c32r128
0.000	0.000	13.438	82.121	4.328	0.044	0.066	0.003	0.000	0.000	1.390	pg17beta3_o2nofp.cx9a2a_c32r128
0.000	0.000	11.808	83.662	4.427	0.037	0.059	0.007	0.000	0.000	3.293	pg17rc1_o2nofp.cx9a2a_c32r128