Introduction
This is a report for the insert benchmark with 4000M docs and 20 client(s). It is generated by scripts (bash, awk, sed) and Tufte might not be impressed. An overview of the insert benchmark is here and a short update is here. Below, by DBMS, I mean DBMS+version.config. An example is my8020.c10b40 where my means MySQL, 8020 is version 8.0.20 and c10b40 is the name for the configuration file.
The test server is an ax162-s from Hetzner (see here) with 48 cores, AMD SMT disabled, 128G RAM and ext4 using 2 NVMe devices with SW RAID 1. The benchmark was run with 20 clients and there were 1 or 3 connections per client (1 for queries or inserts without rate limits, 1+1 for rate limited inserts+deletes). It uses 8 tables with a table per client. It loads 200M rows per table without secondary indexes, creates 3 secondary indexes per table, then inserts 4m+1m rows per table with a delete per insert to avoid growing the table. It then does 6 read+write tests for 1800s each that do queries as fast as possible with 100,100,500,500,1000,1000 inserts/s and the same for deletes/s per client concurrent with the queries. The database is larger than memory. Clients and the DBMS share one server.
The tested DBMS are:
- my5651_rel_o2nofp.cz11a_c32r128 - MySQL 5.6.51 compilred with CMAKE_BUILD_TYPE=Release, -O2 and frame pointers using the z11a_c32r128 config
- my5744_rel_o2nofp.cz11a_c32r128 - MySQL 5.7.44 compilred with CMAKE_BUILD_TYPE=Release, -O2 and frame pointers using the z11a_c32r128 config
- my8039_rel_o2nofp.cz11a_c32r128 - MySQL 8.0.39 compilred with CMAKE_BUILD_TYPE=Release, -O2 and frame pointers using the z11a_c32r128 config
- pg158_o2nofp.cx9a2a_c32r128 - Postgres 15.8 compiled with -O2 and frame pointers using the x9a2a_c32r128 config
- pg164_o2nofp.cx9a2a_c32r128 - Postgres 16.4 compiled with -O2 and frame pointers using the x9a2a_c32r128 config
- pg17beta3_o2nofp.cx9a2a_c32r128 - Postgres 17 beta3 compiled with -O2 and frame pointers using the x9a2a_c32r128 config
- pg17rc1_o2nofp.cx9a2a_c32r128 - Postgres 17 rc1 compiled with -O2 and frame pointers using the x9a2a_c32r128 config
Contents
- Summary
- l.i0: load without secondary indexes
- l.x: create secondary indexes
- l.i1: continue load after secondary indexes created with 50 inserts per transaction
- l.i2: continue load after secondary indexes created with 5 inserts per transaction
- qr100.L1: range queries with 100 insert/s per client
- qp100.L2: point queries with 100 insert/s per client
- qr500.L3: range queries with 500 insert/s per client
- qp500.L4: point queries with 500 insert/s per client
- qr1000.L5: range queries with 1000 insert/s per client
- qp1000.L6: point queries with 1000 insert/s per client
Summary
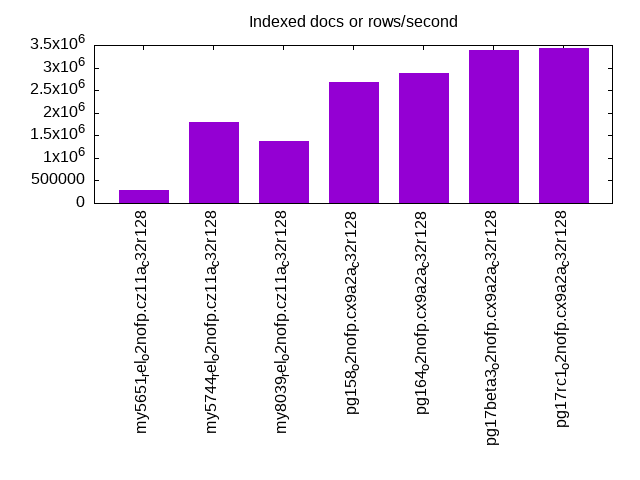
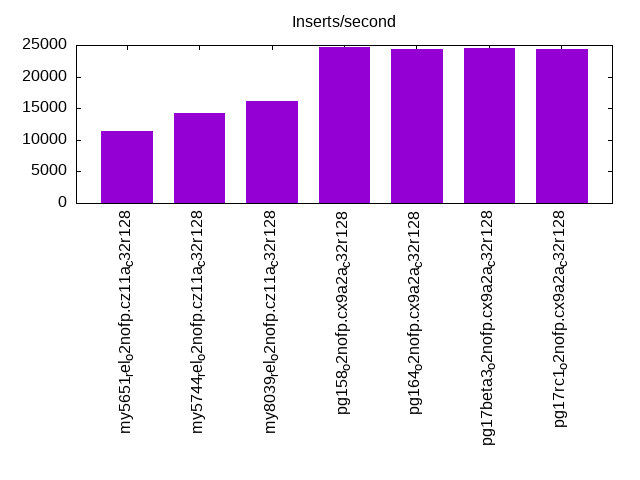
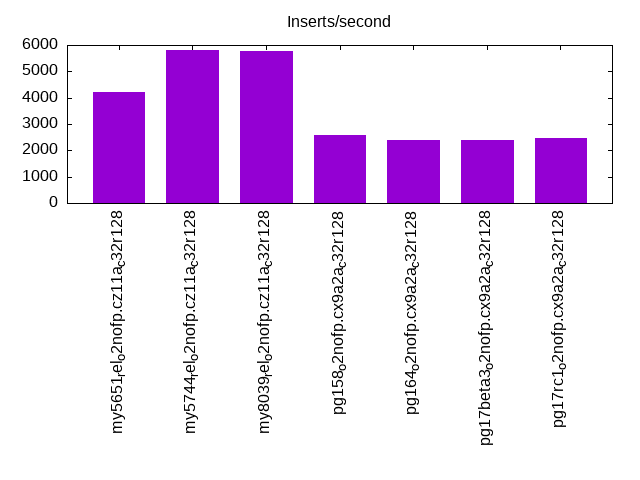
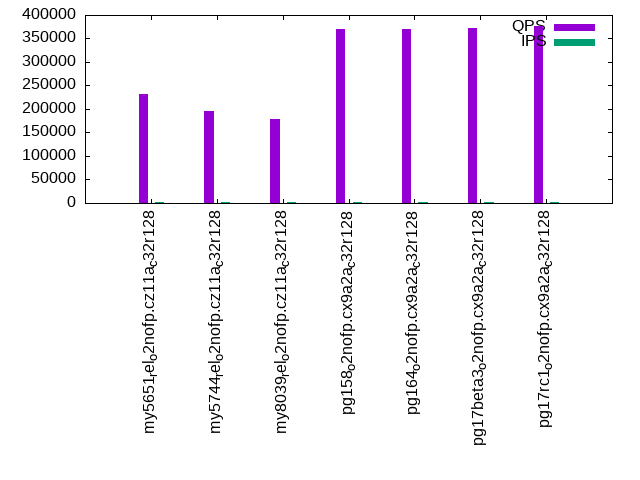
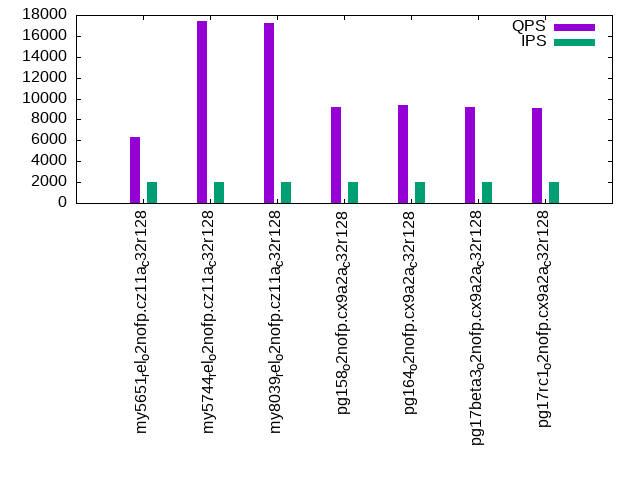
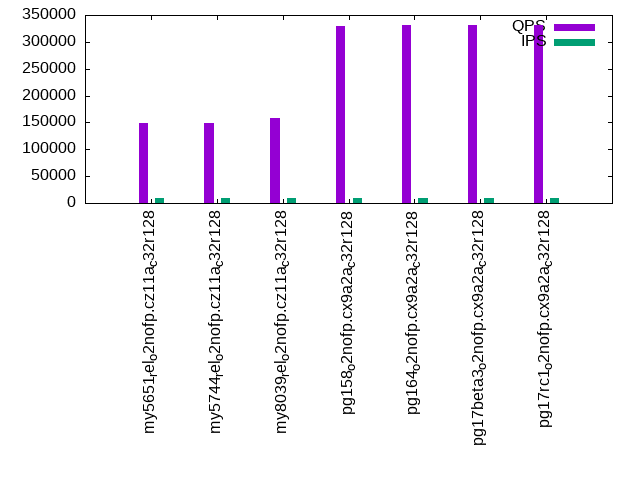
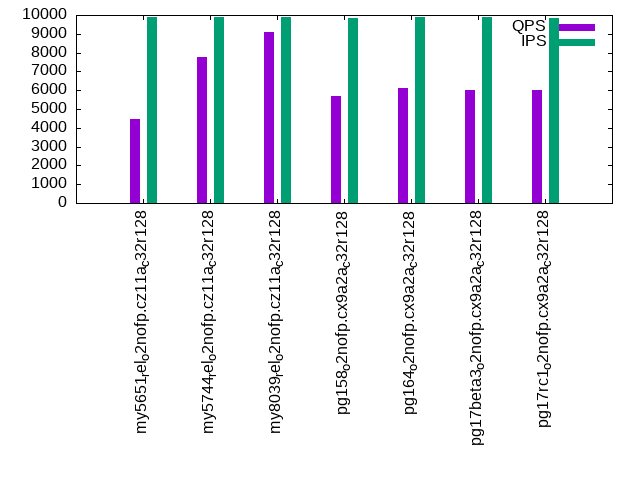
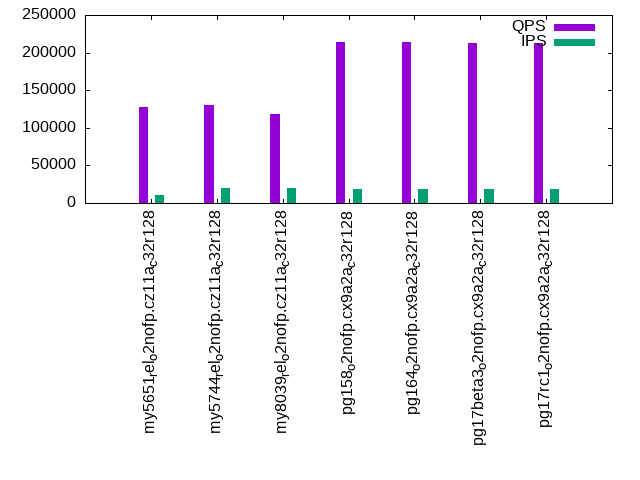
The numbers are inserts/s for l.i0, l.i1 and l.i2, indexed docs (or rows) /s for l.x and queries/s for qr100, qp100 thru qr1000, qp1000" The values are the average rate over the entire test for inserts (IPS) and queries (QPS). The range of values for IPS and QPS is split into 3 parts: bottom 25%, middle 50%, top 25%. Values in the bottom 25% have a red background, values in the top 25% have a green background and values in the middle have no color. A gray background is used for values that can be ignored because the DBMS did not sustain the target insert rate. Red backgrounds are not used when the minimum value is within 80% of the max value.
| dbms | l.i0 | l.x | l.i1 | l.i2 | qr100 | qp100 | qr500 | qp500 | qr1000 | qp1000 |
|---|---|---|---|---|---|---|---|---|---|---|
| my5651_rel_o2nofp.cz11a_c32r128 | 371264 | 298352 | 11325 | 4215 | 232061 | 6318 | 148810 | 4456 | 128256 | 5839 |
| my5744_rel_o2nofp.cz11a_c32r128 | 672043 | 1793722 | 14164 | 5800 | 194689 | 17422 | 149680 | 7750 | 130415 | 10282 |
| my8039_rel_o2nofp.cz11a_c32r128 | 1429082 | 1367521 | 16129 | 5790 | 179440 | 17190 | 158454 | 9095 | 118613 | 8682 |
| pg158_o2nofp.cx9a2a_c32r128 | 1989060 | 2673797 | 24661 | 2599 | 370777 | 9161 | 329629 | 5712 | 213552 | 3273 |
| pg164_o2nofp.cx9a2a_c32r128 | 2004008 | 2875629 | 24331 | 2389 | 371220 | 9376 | 331352 | 6119 | 213497 | 3580 |
| pg17beta3_o2nofp.cx9a2a_c32r128 | 2026342 | 3392706 | 24525 | 2404 | 372839 | 9191 | 331037 | 6013 | 213136 | 3481 |
| pg17rc1_o2nofp.cx9a2a_c32r128 | 2039776 | 3436426 | 24316 | 2453 | 376989 | 9060 | 331207 | 5994 | 212570 | 3463 |
This table has relative throughput, throughput for the DBMS relative to the DBMS in the first line, using the absolute throughput from the previous table. Values less than 0.95 have a yellow background. Values greater than 1.05 have a blue background.
| dbms | l.i0 | l.x | l.i1 | l.i2 | qr100 | qp100 | qr500 | qp500 | qr1000 | qp1000 |
|---|---|---|---|---|---|---|---|---|---|---|
| my5651_rel_o2nofp.cz11a_c32r128 | 1.00 | 1.00 | 1.00 | 1.00 | 1.00 | 1.00 | 1.00 | 1.00 | 1.00 | 1.00 |
| my5744_rel_o2nofp.cz11a_c32r128 | 1.81 | 6.01 | 1.25 | 1.38 | 0.84 | 2.76 | 1.01 | 1.74 | 1.02 | 1.76 |
| my8039_rel_o2nofp.cz11a_c32r128 | 3.85 | 4.58 | 1.42 | 1.37 | 0.77 | 2.72 | 1.06 | 2.04 | 0.92 | 1.49 |
| pg158_o2nofp.cx9a2a_c32r128 | 5.36 | 8.96 | 2.18 | 0.62 | 1.60 | 1.45 | 2.22 | 1.28 | 1.67 | 0.56 |
| pg164_o2nofp.cx9a2a_c32r128 | 5.40 | 9.64 | 2.15 | 0.57 | 1.60 | 1.48 | 2.23 | 1.37 | 1.66 | 0.61 |
| pg17beta3_o2nofp.cx9a2a_c32r128 | 5.46 | 11.37 | 2.17 | 0.57 | 1.61 | 1.45 | 2.22 | 1.35 | 1.66 | 0.60 |
| pg17rc1_o2nofp.cx9a2a_c32r128 | 5.49 | 11.52 | 2.15 | 0.58 | 1.62 | 1.43 | 2.23 | 1.35 | 1.66 | 0.59 |
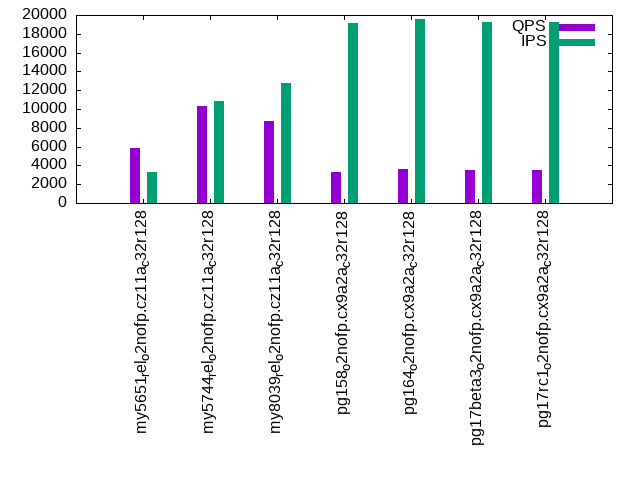
This lists the average rate of inserts/s for the tests that do inserts concurrent with queries. For such tests the query rate is listed in the table above. The read+write tests are setup so that the insert rate should match the target rate every second. Cells that are not at least 95% of the target have a red background to indicate a failure to satisfy the target.
| dbms | qr100.L1 | qp100.L2 | qr500.L3 | qp500.L4 | qr1000.L5 | qp1000.L6 |
|---|---|---|---|---|---|---|
| my5651_rel_o2nofp.cz11a_c32r128 | 1977 | 1977 | 9885 | 9885 | 11125 | 3306 |
| my5744_rel_o2nofp.cz11a_c32r128 | 1977 | 1977 | 9885 | 9885 | 19748 | 10870 |
| my8039_rel_o2nofp.cz11a_c32r128 | 1977 | 1977 | 9885 | 9885 | 19769 | 12798 |
| pg158_o2nofp.cx9a2a_c32r128 | 1977 | 1977 | 9804 | 9863 | 19058 | 19180 |
| pg164_o2nofp.cx9a2a_c32r128 | 1977 | 1977 | 9868 | 9874 | 18711 | 19544 |
| pg17beta3_o2nofp.cx9a2a_c32r128 | 1976 | 1976 | 9847 | 9879 | 18692 | 19231 |
| pg17rc1_o2nofp.cx9a2a_c32r128 | 1977 | 1977 | 9836 | 9841 | 18740 | 19210 |
| target | 2000 | 2000 | 10000 | 10000 | 20000 | 20000 |
l.i0
l.i0: load without secondary indexes. Graphs for performance per 1-second interval are here.
Average throughput:

Insert response time histogram: each cell has the percentage of responses that take <= the time in the header and max is the max response time in seconds. For the max column values in the top 25% of the range have a red background and in the bottom 25% of the range have a green background. The red background is not used when the min value is within 80% of the max value.
| dbms | 256us | 1ms | 4ms | 16ms | 64ms | 256ms | 1s | 4s | 16s | gt | max |
|---|---|---|---|---|---|---|---|---|---|---|---|
| my5651_rel_o2nofp.cz11a_c32r128 | 0.164 | 10.763 | 88.563 | 0.473 | 0.037 | 0.173 | |||||
| my5744_rel_o2nofp.cz11a_c32r128 | 0.153 | 99.593 | 0.206 | 0.011 | 0.037 | 0.177 | |||||
| my8039_rel_o2nofp.cz11a_c32r128 | 0.099 | 99.788 | 0.060 | 0.014 | 0.039 | 0.245 | |||||
| pg158_o2nofp.cx9a2a_c32r128 | 87.809 | 11.979 | 0.105 | 0.089 | 0.012 | 0.005 | nonzero | 1.421 | |||
| pg164_o2nofp.cx9a2a_c32r128 | 88.492 | 11.270 | 0.127 | 0.094 | 0.012 | 0.005 | nonzero | 2.357 | |||
| pg17beta3_o2nofp.cx9a2a_c32r128 | 89.344 | 10.390 | 0.150 | 0.097 | 0.013 | 0.005 | nonzero | 1.931 | |||
| pg17rc1_o2nofp.cx9a2a_c32r128 | 89.987 | 9.754 | 0.139 | 0.098 | 0.016 | 0.006 | nonzero | 1.330 |
Performance metrics for the DBMS listed above. Some are normalized by throughput, others are not. Legend for results is here.
ips	qps	rps	rmbps	wps	wmbps	rpq	rkbpq	wpi	wkbpi	csps	cpups	cspq	cpupq	dbgb1	dbgb2	rss	maxop	p50	p99	tag
371264	0	2185	8.5	2467.7	132.8	0.006	0.024	0.007	0.366	139954	37.7	0.377	49	263.2	363.7	107.1	0.173	17586	15184	my5651_rel_o2nofp.cz11a_c32r128
672043	0	2	0.0	4526.7	240.6	0.000	0.000	0.007	0.367	82544	46.0	0.123	33	263.2	363.7	108.1	0.177	34063	29169	my5744_rel_o2nofp.cz11a_c32r128
1429082	0	5	0.1	9725.7	531.2	0.000	0.000	0.007	0.381	297221	54.8	0.208	18	262.3	362.8	108.4	0.245	73820	61733	my8039_rel_o2nofp.cz11a_c32r128
1989060	0	1724	13.5	8354.0	796.4	0.001	0.007	0.004	0.410	363377	57.4	0.183	14	382.7	478.8	6.9	1.421	107058	34962	pg158_o2nofp.cx9a2a_c32r128
2004008	0	1712	13.4	8441.4	806.0	0.001	0.007	0.004	0.412	370269	57.4	0.185	14	382.7	478.8	11.7	2.357	108383	35561	pg164_o2nofp.cx9a2a_c32r128
2026342	0	1701	13.7	8542.2	813.8	0.001	0.007	0.004	0.411	369422	57.0	0.182	14	382.7	478.8	95.4	1.931	109848	27470	pg17beta3_o2nofp.cx9a2a_c32r128
2039776	0	1732	13.9	8560.9	819.2	0.001	0.007	0.004	0.411	362999	57.3	0.178	13	382.7	478.8	97.2	1.330	110081	39857	pg17rc1_o2nofp.cx9a2a_c32r128
l.x
l.x: create secondary indexes.
Average throughput:
Performance metrics for the DBMS listed above. Some are normalized by throughput, others are not. Legend for results is here.
ips	qps	rps	rmbps	wps	wmbps	rpq	rkbpq	wpi	wkbpi	csps	cpups	cspq	cpupq	dbgb1	dbgb2	rss	maxop	p50	p99	tag
298352	0	3998	264.7	16624.5	606.4	0.013	0.909	0.056	2.081	119028	35.8	0.399	58	557.3	657.8	107.8	0.003	NA	NA	my5651_rel_o2nofp.cz11a_c32r128
1793722	0	17853	1554.2	29637.8	1923.1	0.010	0.887	0.017	1.098	206052	25.9	0.115	7	605.8	706.3	105.4	0.002	NA	NA	my5744_rel_o2nofp.cz11a_c32r128
1367521	0	34508	1991.3	40701.9	1795.0	0.025	1.491	0.030	1.344	192617	57.8	0.141	20	603.6	704.2	104.9	0.007	NA	NA	my8039_rel_o2nofp.cz11a_c32r128
2673797	0	14849	943.0	7784.5	858.6	0.006	0.361	0.003	0.329	150424	20.6	0.056	4	768.4	864.5	52.1	0.013	NA	NA	pg158_o2nofp.cx9a2a_c32r128
2875629	0	14480	915.2	7489.3	821.6	0.005	0.326	0.003	0.293	156963	21.3	0.055	4	768.4	864.5	30.9	0.437	NA	NA	pg164_o2nofp.cx9a2a_c32r128
3392706	0	11078	1077.5	8622.4	964.1	0.003	0.325	0.003	0.291	89452	23.8	0.026	3	768.4	863.7	31.2	0.071	NA	NA	pg17beta3_o2nofp.cx9a2a_c32r128
3436426	0	11401	1091.1	8913.6	983.6	0.003	0.325	0.003	0.293	89973	23.7	0.026	3	768.4	863.7	39.3	0.003	NA	NA	pg17rc1_o2nofp.cx9a2a_c32r128
l.i1
l.i1: continue load after secondary indexes created with 50 inserts per transaction. Graphs for performance per 1-second interval are here.
Average throughput:
Insert response time histogram: each cell has the percentage of responses that take <= the time in the header and max is the max response time in seconds. For the max column values in the top 25% of the range have a red background and in the bottom 25% of the range have a green background. The red background is not used when the min value is within 80% of the max value.
| dbms | 256us | 1ms | 4ms | 16ms | 64ms | 256ms | 1s | 4s | 16s | gt | max |
|---|---|---|---|---|---|---|---|---|---|---|---|
| my5651_rel_o2nofp.cz11a_c32r128 | 0.001 | 4.124 | 64.166 | 11.736 | 19.972 | nonzero | 1.626 | ||||
| my5744_rel_o2nofp.cz11a_c32r128 | 0.023 | 30.572 | 42.689 | 11.900 | 14.815 | 0.373 | |||||
| my8039_rel_o2nofp.cz11a_c32r128 | 0.124 | 14.794 | 38.441 | 46.315 | 0.325 | 0.475 | |||||
| pg158_o2nofp.cx9a2a_c32r128 | 21.007 | 70.392 | 8.352 | 0.126 | 0.122 | 3.352 | |||||
| pg164_o2nofp.cx9a2a_c32r128 | 21.845 | 70.089 | 7.871 | 0.086 | 0.109 | 2.887 | |||||
| pg17beta3_o2nofp.cx9a2a_c32r128 | 19.950 | 70.859 | 8.979 | 0.104 | 0.108 | nonzero | 4.374 | ||||
| pg17rc1_o2nofp.cx9a2a_c32r128 | 21.126 | 69.898 | 8.770 | 0.094 | 0.112 | 3.943 |
Delete response time histogram: each cell has the percentage of responses that take <= the time in the header and max is the max response time in seconds. For the max column values in the top 25% of the range have a red background and in the bottom 25% of the range have a green background. The red background is not used when the min value is within 80% of the max value.
| dbms | 256us | 1ms | 4ms | 16ms | 64ms | 256ms | 1s | 4s | 16s | gt | max |
|---|---|---|---|---|---|---|---|---|---|---|---|
| my5651_rel_o2nofp.cz11a_c32r128 | 1.760 | 35.847 | 42.238 | 0.185 | 19.970 | nonzero | 1.140 | ||||
| my5744_rel_o2nofp.cz11a_c32r128 | 17.859 | 64.695 | 2.547 | 0.097 | 14.802 | 0.366 | |||||
| my8039_rel_o2nofp.cz11a_c32r128 | 18.416 | 20.612 | 29.232 | 31.741 | 0.199 | ||||||
| pg158_o2nofp.cx9a2a_c32r128 | 2.328 | 9.162 | 26.837 | 60.259 | 1.309 | 0.043 | 0.061 | 3.118 | |||
| pg164_o2nofp.cx9a2a_c32r128 | 2.384 | 8.225 | 19.987 | 66.830 | 2.478 | 0.034 | 0.062 | 2.801 | |||
| pg17beta3_o2nofp.cx9a2a_c32r128 | 2.530 | 8.786 | 23.509 | 62.699 | 2.360 | 0.054 | 0.061 | 3.033 | |||
| pg17rc1_o2nofp.cx9a2a_c32r128 | 2.565 | 8.861 | 21.650 | 64.039 | 2.778 | 0.049 | 0.059 | 3.310 |
Performance metrics for the DBMS listed above. Some are normalized by throughput, others are not. Legend for results is here.
ips	qps	rps	rmbps	wps	wmbps	rpq	rkbpq	wpi	wkbpi	csps	cpups	cspq	cpupq	dbgb1	dbgb2	rss	maxop	p50	p99	tag
11325	0	28421	439.6	55822.6	1148.5	2.510	39.751	4.929	103.847	264139	16.0	23.324	678	819.8	933.2	105.4	1.626	200	150	my5651_rel_o2nofp.cz11a_c32r128
14164	0	34684	541.9	59410.6	1386.1	2.449	39.179	4.194	100.204	321279	20.9	22.682	708	820.2	934.0	107.8	0.373	200	150	my5744_rel_o2nofp.cz11a_c32r128
16129	0	36470	569.9	53356.1	1517.7	2.261	36.179	3.308	96.355	334131	20.7	20.716	616	819.2	935.6	107.5	0.475	699	300	my8039_rel_o2nofp.cz11a_c32r128
24661	0	31064	247.5	36812.6	807.2	1.260	10.279	1.493	33.516	90983	29.5	3.689	574	781.5	916.0	1.8	3.352	1299	0	pg158_o2nofp.cx9a2a_c32r128
24331	0	30718	244.9	36189.2	799.0	1.263	10.307	1.487	33.626	85551	30.6	3.516	604	781.5	877.6	2.0	2.887	1249	0	pg164_o2nofp.cx9a2a_c32r128
24525	0	31028	247.3	36654.9	801.5	1.265	10.324	1.495	33.465	85903	29.9	3.503	585	781.5	877.6	85.0	4.374	1199	0	pg17beta3_o2nofp.cx9a2a_c32r128
24316	0	30740	245.9	36359.7	797.3	1.264	10.355	1.495	33.577	85245	30.4	3.506	600	781.5	877.6	87.0	3.943	1249	0	pg17rc1_o2nofp.cx9a2a_c32r128
l.i2
l.i2: continue load after secondary indexes created with 5 inserts per transaction. Graphs for performance per 1-second interval are here.
Average throughput:
Insert response time histogram: each cell has the percentage of responses that take <= the time in the header and max is the max response time in seconds. For the max column values in the top 25% of the range have a red background and in the bottom 25% of the range have a green background. The red background is not used when the min value is within 80% of the max value.
| dbms | 256us | 1ms | 4ms | 16ms | 64ms | 256ms | 1s | 4s | 16s | gt | max |
|---|---|---|---|---|---|---|---|---|---|---|---|
| my5651_rel_o2nofp.cz11a_c32r128 | 0.001 | 0.092 | 8.215 | 45.109 | 37.733 | 8.850 | 0.122 | ||||
| my5744_rel_o2nofp.cz11a_c32r128 | nonzero | 4.866 | 37.914 | 18.258 | 38.855 | 0.107 | 0.091 | ||||
| my8039_rel_o2nofp.cz11a_c32r128 | 0.403 | 72.701 | 26.833 | 0.063 | 0.145 | ||||||
| pg158_o2nofp.cx9a2a_c32r128 | nonzero | 37.786 | 61.878 | 0.235 | 0.040 | 0.030 | 0.027 | 0.004 | 2.449 | ||
| pg164_o2nofp.cx9a2a_c32r128 | 0.100 | 34.705 | 64.849 | 0.151 | 0.152 | 0.018 | 0.020 | 0.006 | nonzero | 4.228 | |
| pg17beta3_o2nofp.cx9a2a_c32r128 | nonzero | 42.802 | 57.096 | 0.033 | 0.029 | 0.016 | 0.020 | 0.004 | 3.570 | ||
| pg17rc1_o2nofp.cx9a2a_c32r128 | 0.040 | 40.582 | 59.136 | 0.082 | 0.110 | 0.022 | 0.022 | 0.006 | 3.845 |
Delete response time histogram: each cell has the percentage of responses that take <= the time in the header and max is the max response time in seconds. For the max column values in the top 25% of the range have a red background and in the bottom 25% of the range have a green background. The red background is not used when the min value is within 80% of the max value.
| dbms | 256us | 1ms | 4ms | 16ms | 64ms | 256ms | 1s | 4s | 16s | gt | max |
|---|---|---|---|---|---|---|---|---|---|---|---|
| my5651_rel_o2nofp.cz11a_c32r128 | 0.001 | 0.616 | 26.399 | 26.535 | 38.200 | 8.249 | 0.112 | ||||
| my5744_rel_o2nofp.cz11a_c32r128 | 0.002 | 52.887 | 8.248 | 0.139 | 38.711 | 0.013 | 0.089 | ||||
| my8039_rel_o2nofp.cz11a_c32r128 | 0.662 | 73.380 | 25.937 | 0.021 | 0.124 | ||||||
| pg158_o2nofp.cx9a2a_c32r128 | 0.043 | 0.090 | nonzero | 0.080 | 99.785 | 0.001 | 0.001 | nonzero | 1.053 | ||
| pg164_o2nofp.cx9a2a_c32r128 | 0.227 | 2.776 | 1.892 | 0.137 | 94.965 | 0.002 | 0.001 | nonzero | 1.605 | ||
| pg17beta3_o2nofp.cx9a2a_c32r128 | 0.066 | 99.933 | 0.001 | nonzero | 0.673 | ||||||
| pg17rc1_o2nofp.cx9a2a_c32r128 | 0.097 | 1.562 | 0.323 | 0.056 | 97.961 | 0.001 | 0.001 | nonzero | 1.920 |
Performance metrics for the DBMS listed above. Some are normalized by throughput, others are not. Legend for results is here.
ips	qps	rps	rmbps	wps	wmbps	rpq	rkbpq	wpi	wkbpi	csps	cpups	cspq	cpupq	dbgb1	dbgb2	rss	maxop	p50	p99	tag
4215	0	28835	438.8	52533.2	1038.2	6.841	106.607	12.464	252.227	256167	13.6	60.777	1549	819.8	933.2	105.0	0.122	115	65	my5651_rel_o2nofp.cz11a_c32r128
5800	0	36879	576.2	58906.5	1345.6	6.358	101.727	10.156	237.554	297041	16.6	51.210	1374	820.2	934.0	107.6	0.091	130	80	my5744_rel_o2nofp.cz11a_c32r128
5790	0	39308	614.2	50752.8	1457.6	6.789	108.619	8.765	257.774	341275	17.5	58.939	1451	819.2	932.8	105.9	0.145	145	85	my8039_rel_o2nofp.cz11a_c32r128
2599	0	3236	28.4	4787.0	75.4	1.245	11.171	1.842	29.724	21387	30.3	8.229	5596	784.9	880.9	21.1	2.449	225	170	pg158_o2nofp.cx9a2a_c32r128
2389	0	3109	31.9	4693.4	74.9	1.302	13.655	1.965	32.130	19720	24.8	8.256	4984	784.8	880.9	3.6	4.228	215	180	pg164_o2nofp.cx9a2a_c32r128
2404	0	2925	23.3	4476.8	70.5	1.217	9.933	1.862	30.037	17975	30.6	7.477	6110	784.9	880.9	83.6	3.570	215	180	pg17beta3_o2nofp.cx9a2a_c32r128
2453	0	3078	26.8	4751.3	75.3	1.255	11.201	1.937	31.423	18439	26.8	7.516	5244	784.8	880.9	85.1	3.845	120	105	pg17rc1_o2nofp.cx9a2a_c32r128
qr100.L1
qr100.L1: range queries with 100 insert/s per client. Graphs for performance per 1-second interval are here.
Average throughput:
Query response time histogram: each cell has the percentage of responses that take <= the time in the header and max is the max response time in seconds. For max values in the top 25% of the range have a red background and in the bottom 25% of the range have a green background. The red background is not used when the min value is within 80% of the max value.
| dbms | 256us | 1ms | 4ms | 16ms | 64ms | 256ms | 1s | 4s | 16s | gt | max |
|---|---|---|---|---|---|---|---|---|---|---|---|
| my5651_rel_o2nofp.cz11a_c32r128 | 99.548 | 0.396 | 0.045 | 0.010 | nonzero | 0.022 | |||||
| my5744_rel_o2nofp.cz11a_c32r128 | 99.830 | 0.139 | 0.030 | nonzero | nonzero | 0.027 | |||||
| my8039_rel_o2nofp.cz11a_c32r128 | 99.882 | 0.114 | 0.004 | nonzero | 0.014 | ||||||
| pg158_o2nofp.cx9a2a_c32r128 | 99.992 | 0.007 | 0.001 | nonzero | nonzero | 0.017 | |||||
| pg164_o2nofp.cx9a2a_c32r128 | 99.993 | 0.006 | 0.001 | nonzero | nonzero | nonzero | 0.084 | ||||
| pg17beta3_o2nofp.cx9a2a_c32r128 | 99.992 | 0.007 | 0.001 | nonzero | nonzero | nonzero | 0.074 | ||||
| pg17rc1_o2nofp.cx9a2a_c32r128 | 99.993 | 0.006 | 0.001 | nonzero | nonzero | 0.043 |
Insert response time histogram: each cell has the percentage of responses that take <= the time in the header and max is the max response time in seconds. For max values in the top 25% of the range have a red background and in the bottom 25% of the range have a green background. The red background is not used when the min value is within 80% of the max value.
| dbms | 256us | 1ms | 4ms | 16ms | 64ms | 256ms | 1s | 4s | 16s | gt | max |
|---|---|---|---|---|---|---|---|---|---|---|---|
| my5651_rel_o2nofp.cz11a_c32r128 | 20.406 | 79.589 | 0.006 | 0.080 | |||||||
| my5744_rel_o2nofp.cz11a_c32r128 | 88.731 | 11.269 | 0.054 | ||||||||
| my8039_rel_o2nofp.cz11a_c32r128 | 93.482 | 6.518 | 0.031 | ||||||||
| pg158_o2nofp.cx9a2a_c32r128 | 96.879 | 3.090 | 0.031 | 0.212 | |||||||
| pg164_o2nofp.cx9a2a_c32r128 | 98.188 | 1.744 | 0.067 | 0.001 | 0.299 | ||||||
| pg17beta3_o2nofp.cx9a2a_c32r128 | 98.775 | 1.218 | 0.007 | 0.104 | |||||||
| pg17rc1_o2nofp.cx9a2a_c32r128 | 98.771 | 1.121 | 0.094 | 0.014 | 0.769 |
Delete response time histogram: each cell has the percentage of responses that take <= the time in the header and max is the max response time in seconds. For max values in the top 25% of the range have a red background and in the bottom 25% of the range have a green background. The red background is not used when the min value is within 80% of the max value.
| dbms | 256us | 1ms | 4ms | 16ms | 64ms | 256ms | 1s | 4s | 16s | gt | max |
|---|---|---|---|---|---|---|---|---|---|---|---|
| my5651_rel_o2nofp.cz11a_c32r128 | 9.621 | 78.699 | 11.681 | 0.047 | |||||||
| my5744_rel_o2nofp.cz11a_c32r128 | 85.693 | 14.154 | 0.153 | 0.038 | |||||||
| my8039_rel_o2nofp.cz11a_c32r128 | 87.174 | 12.821 | 0.006 | 0.021 | |||||||
| pg158_o2nofp.cx9a2a_c32r128 | 42.203 | 57.710 | 0.075 | 0.013 | 0.019 | ||||||
| pg164_o2nofp.cx9a2a_c32r128 | 44.325 | 55.428 | 0.082 | 0.164 | 0.001 | 0.080 | |||||
| pg17beta3_o2nofp.cx9a2a_c32r128 | 44.775 | 55.129 | 0.054 | 0.042 | 0.030 | ||||||
| pg17rc1_o2nofp.cx9a2a_c32r128 | 48.046 | 51.742 | 0.085 | 0.126 | 0.001 | 0.105 |
Performance metrics for the DBMS listed above. Some are normalized by throughput, others are not. Legend for results is here.
ips	qps	rps	rmbps	wps	wmbps	rpq	rkbpq	wpi	wkbpi	csps	cpups	cspq	cpupq	dbgb1	dbgb2	rss	maxop	p50	p99	tag
1977	232061	9338	145.1	8562.3	241.2	0.040	0.640	4.331	124.944	940200	43.4	4.052	90	819.8	933.2	105.0	0.022	11891	10213	my5651_rel_o2nofp.cz11a_c32r128
1977	194689	9264	144.7	9189.5	258.6	0.048	0.761	4.648	133.954	789529	44.8	4.055	110	820.2	934.0	107.6	0.027	9880	8135	my5744_rel_o2nofp.cz11a_c32r128
1977	179440	8285	129.5	9268.4	266.9	0.046	0.739	4.688	138.242	730948	45.0	4.074	120	819.2	932.8	105.9	0.014	9046	8458	my8039_rel_o2nofp.cz11a_c32r128
1977	370777	2634	21.2	1370.6	37.3	0.007	0.059	0.693	19.322	1410562	43.1	3.804	56	785.0	881.0	96.3	0.017	18930	17038	pg158_o2nofp.cx9a2a_c32r128
1977	371220	2714	21.9	1263.6	36.3	0.007	0.060	0.639	18.811	1412498	42.9	3.805	55	784.9	881.0	94.5	0.084	18652	17086	pg164_o2nofp.cx9a2a_c32r128
1976	372839	2723	22.1	1211.3	35.8	0.007	0.061	0.613	18.542	1419178	43.0	3.806	55	785.0	881.0	94.5	0.074	19147	17277	pg17beta3_o2nofp.cx9a2a_c32r128
1977	376989	2718	21.9	1261.4	36.3	0.007	0.059	0.638	18.827	1434874	42.8	3.806	54	785.0	881.0	96.0	0.043	19147	17405	pg17rc1_o2nofp.cx9a2a_c32r128
qp100.L2
qp100.L2: point queries with 100 insert/s per client. Graphs for performance per 1-second interval are here.
Average throughput:
Query response time histogram: each cell has the percentage of responses that take <= the time in the header and max is the max response time in seconds. For max values in the top 25% of the range have a red background and in the bottom 25% of the range have a green background. The red background is not used when the min value is within 80% of the max value.
| dbms | 256us | 1ms | 4ms | 16ms | 64ms | 256ms | 1s | 4s | 16s | gt | max |
|---|---|---|---|---|---|---|---|---|---|---|---|
| my5651_rel_o2nofp.cz11a_c32r128 | 0.002 | 14.600 | 61.709 | 23.008 | 0.682 | nonzero | 0.071 | ||||
| my5744_rel_o2nofp.cz11a_c32r128 | 0.006 | 44.769 | 54.929 | 0.295 | nonzero | 0.026 | |||||
| my8039_rel_o2nofp.cz11a_c32r128 | 0.002 | 50.707 | 48.462 | 0.829 | 0.014 | ||||||
| pg158_o2nofp.cx9a2a_c32r128 | nonzero | 3.019 | 93.920 | 0.674 | 2.381 | 0.003 | 0.002 | 0.002 | 3.858 | ||
| pg164_o2nofp.cx9a2a_c32r128 | nonzero | 2.951 | 94.294 | 0.373 | 2.379 | 0.001 | 0.001 | 0.001 | 3.464 | ||
| pg17beta3_o2nofp.cx9a2a_c32r128 | nonzero | 3.015 | 94.234 | 0.319 | 2.424 | 0.005 | 0.001 | 0.001 | nonzero | 4.227 | |
| pg17rc1_o2nofp.cx9a2a_c32r128 | nonzero | 3.008 | 94.232 | 0.353 | 2.396 | 0.005 | 0.002 | 0.003 | nonzero | 4.902 |
Insert response time histogram: each cell has the percentage of responses that take <= the time in the header and max is the max response time in seconds. For max values in the top 25% of the range have a red background and in the bottom 25% of the range have a green background. The red background is not used when the min value is within 80% of the max value.
| dbms | 256us | 1ms | 4ms | 16ms | 64ms | 256ms | 1s | 4s | 16s | gt | max |
|---|---|---|---|---|---|---|---|---|---|---|---|
| my5651_rel_o2nofp.cz11a_c32r128 | 1.701 | 57.760 | 40.531 | 0.008 | 0.284 | ||||||
| my5744_rel_o2nofp.cz11a_c32r128 | 37.832 | 60.837 | 1.331 | 0.149 | |||||||
| my8039_rel_o2nofp.cz11a_c32r128 | 42.778 | 57.221 | 0.001 | 0.067 | |||||||
| pg158_o2nofp.cx9a2a_c32r128 | 63.615 | 35.526 | 0.282 | 0.306 | 0.271 | 3.653 | |||||
| pg164_o2nofp.cx9a2a_c32r128 | 61.718 | 37.722 | 0.167 | 0.219 | 0.174 | 2.600 | |||||
| pg17beta3_o2nofp.cx9a2a_c32r128 | 64.808 | 34.531 | 0.214 | 0.163 | 0.272 | 0.013 | 4.061 | ||||
| pg17rc1_o2nofp.cx9a2a_c32r128 | 65.578 | 33.178 | 0.379 | 0.418 | 0.415 | 0.032 | 4.781 |
Delete response time histogram: each cell has the percentage of responses that take <= the time in the header and max is the max response time in seconds. For max values in the top 25% of the range have a red background and in the bottom 25% of the range have a green background. The red background is not used when the min value is within 80% of the max value.
| dbms | 256us | 1ms | 4ms | 16ms | 64ms | 256ms | 1s | 4s | 16s | gt | max |
|---|---|---|---|---|---|---|---|---|---|---|---|
| my5651_rel_o2nofp.cz11a_c32r128 | 2.576 | 73.019 | 23.754 | 0.650 | 0.157 | ||||||
| my5744_rel_o2nofp.cz11a_c32r128 | 36.368 | 63.131 | 0.501 | 0.034 | |||||||
| my8039_rel_o2nofp.cz11a_c32r128 | 85.842 | 14.140 | 0.018 | 0.029 | |||||||
| pg158_o2nofp.cx9a2a_c32r128 | 92.969 | 3.343 | 3.635 | 0.007 | 0.028 | 0.018 | 2.653 | ||||
| pg164_o2nofp.cx9a2a_c32r128 | 94.350 | 2.307 | 3.233 | 0.106 | 0.004 | 1.948 | |||||
| pg17beta3_o2nofp.cx9a2a_c32r128 | 93.264 | 3.033 | 3.636 | 0.006 | 0.036 | 0.025 | 1.840 | ||||
| pg17rc1_o2nofp.cx9a2a_c32r128 | 93.369 | 3.221 | 3.263 | 0.040 | 0.057 | 0.047 | 0.003 | 4.676 |
Performance metrics for the DBMS listed above. Some are normalized by throughput, others are not. Legend for results is here.
ips	qps	rps	rmbps	wps	wmbps	rpq	rkbpq	wpi	wkbpi	csps	cpups	cspq	cpupq	dbgb1	dbgb2	rss	maxop	p50	p99	tag
1977	6318	57264	894.0	26301.5	448.7	9.064	144.893	13.304	232.437	348709	27.5	55.195	2089	819.8	933.2	105.0	0.071	320	224	my5651_rel_o2nofp.cz11a_c32r128
1977	17422	128177	2002.8	22004.4	481.9	7.357	117.717	11.131	249.609	413569	16.9	23.739	466	820.2	934.0	107.6	0.026	927	240	my5744_rel_o2nofp.cz11a_c32r128
1977	17190	126334	1974.0	17461.7	490.0	7.349	117.591	8.833	253.792	373985	16.7	21.757	466	819.2	932.8	106.0	0.014	911	352	my8039_rel_o2nofp.cz11a_c32r128
1977	9161	127620	1002.0	6634.6	76.4	13.930	112.003	3.356	39.589	288312	22.7	31.471	1189	785.1	881.2	91.7	3.858	480	32	pg158_o2nofp.cx9a2a_c32r128
1977	9376	130459	1024.4	6731.4	77.2	13.914	111.876	3.405	39.987	294200	23.2	31.377	1188	785.0	881.0	43.6	3.464	480	160	pg164_o2nofp.cx9a2a_c32r128
1976	9191	128073	1005.7	6833.4	77.8	13.934	112.045	3.459	40.316	288923	23.5	31.435	1227	785.1	881.1	90.9	4.227	479	i_qps	pg17beta3_o2nofp.cx9a2a_c32r128
1977	9060	126266	991.5	6753.3	77.2	13.937	112.063	3.416	40.010	285487	22.8	31.511	1208	785.1	881.1	92.2	4.902	479	0	pg17rc1_o2nofp.cx9a2a_c32r128
qr500.L3
qr500.L3: range queries with 500 insert/s per client. Graphs for performance per 1-second interval are here.
Average throughput:
Query response time histogram: each cell has the percentage of responses that take <= the time in the header and max is the max response time in seconds. For max values in the top 25% of the range have a red background and in the bottom 25% of the range have a green background. The red background is not used when the min value is within 80% of the max value.
| dbms | 256us | 1ms | 4ms | 16ms | 64ms | 256ms | 1s | 4s | 16s | gt | max |
|---|---|---|---|---|---|---|---|---|---|---|---|
| my5651_rel_o2nofp.cz11a_c32r128 | 95.302 | 3.741 | 0.857 | 0.099 | 0.001 | nonzero | 0.068 | ||||
| my5744_rel_o2nofp.cz11a_c32r128 | 97.799 | 1.914 | 0.277 | 0.009 | 0.001 | 0.047 | |||||
| my8039_rel_o2nofp.cz11a_c32r128 | 99.270 | 0.702 | 0.025 | 0.002 | nonzero | 0.029 | |||||
| pg158_o2nofp.cx9a2a_c32r128 | 99.954 | 0.036 | 0.007 | 0.002 | 0.001 | nonzero | nonzero | nonzero | nonzero | 4.152 | |
| pg164_o2nofp.cx9a2a_c32r128 | 99.965 | 0.028 | 0.005 | 0.001 | 0.001 | nonzero | nonzero | nonzero | 1.517 | ||
| pg17beta3_o2nofp.cx9a2a_c32r128 | 99.963 | 0.029 | 0.006 | 0.002 | 0.001 | nonzero | nonzero | nonzero | 2.765 | ||
| pg17rc1_o2nofp.cx9a2a_c32r128 | 99.964 | 0.028 | 0.006 | 0.001 | 0.001 | nonzero | nonzero | nonzero | 1.642 |
Insert response time histogram: each cell has the percentage of responses that take <= the time in the header and max is the max response time in seconds. For max values in the top 25% of the range have a red background and in the bottom 25% of the range have a green background. The red background is not used when the min value is within 80% of the max value.
| dbms | 256us | 1ms | 4ms | 16ms | 64ms | 256ms | 1s | 4s | 16s | gt | max |
|---|---|---|---|---|---|---|---|---|---|---|---|
| my5651_rel_o2nofp.cz11a_c32r128 | 0.519 | 95.517 | 3.964 | 0.236 | |||||||
| my5744_rel_o2nofp.cz11a_c32r128 | 1.921 | 89.637 | 8.442 | 0.181 | |||||||
| my8039_rel_o2nofp.cz11a_c32r128 | 20.188 | 79.411 | 0.402 | 0.103 | |||||||
| pg158_o2nofp.cx9a2a_c32r128 | 73.568 | 25.291 | 0.520 | 0.450 | 0.166 | 0.005 | 4.628 | ||||
| pg164_o2nofp.cx9a2a_c32r128 | 86.592 | 12.662 | 0.344 | 0.331 | 0.072 | 2.536 | |||||
| pg17beta3_o2nofp.cx9a2a_c32r128 | 84.968 | 14.101 | 0.427 | 0.383 | 0.118 | 0.004 | 4.394 | ||||
| pg17rc1_o2nofp.cx9a2a_c32r128 | 83.947 | 15.207 | 0.352 | 0.363 | 0.131 | 3.832 |
Delete response time histogram: each cell has the percentage of responses that take <= the time in the header and max is the max response time in seconds. For max values in the top 25% of the range have a red background and in the bottom 25% of the range have a green background. The red background is not used when the min value is within 80% of the max value.
| dbms | 256us | 1ms | 4ms | 16ms | 64ms | 256ms | 1s | 4s | 16s | gt | max |
|---|---|---|---|---|---|---|---|---|---|---|---|
| my5651_rel_o2nofp.cz11a_c32r128 | nonzero | 1.527 | 63.252 | 35.217 | 0.004 | 0.088 | |||||
| my5744_rel_o2nofp.cz11a_c32r128 | 12.344 | 79.076 | 8.579 | nonzero | 0.066 | ||||||
| my8039_rel_o2nofp.cz11a_c32r128 | 53.027 | 46.692 | 0.281 | 0.040 | |||||||
| pg158_o2nofp.cx9a2a_c32r128 | 29.986 | 68.006 | 1.929 | 0.026 | 0.031 | 0.021 | 0.001 | 4.199 | |||
| pg164_o2nofp.cx9a2a_c32r128 | 34.301 | 64.564 | 1.117 | 0.005 | 0.009 | 0.004 | 1.875 | ||||
| pg17beta3_o2nofp.cx9a2a_c32r128 | 34.182 | 64.334 | 1.465 | 0.008 | 0.009 | 0.002 | nonzero | 4.341 | |||
| pg17rc1_o2nofp.cx9a2a_c32r128 | 39.722 | 58.993 | 1.264 | 0.006 | 0.012 | 0.003 | 3.566 |
Performance metrics for the DBMS listed above. Some are normalized by throughput, others are not. Legend for results is here.
ips	qps	rps	rmbps	wps	wmbps	rpq	rkbpq	wpi	wkbpi	csps	cpups	cspq	cpupq	dbgb1	dbgb2	rss	maxop	p50	p99	tag
9885	148810	31583	489.7	56498.8	1091.0	0.212	3.370	5.716	113.018	823807	48.6	5.536	157	819.8	933.2	105.0	0.068	7786	1295	my5651_rel_o2nofp.cz11a_c32r128
9885	149680	38017	594.0	58567.9	1285.8	0.254	4.064	5.925	133.205	831031	58.0	5.552	186	820.2	934.0	107.6	0.047	7656	5961	my5744_rel_o2nofp.cz11a_c32r128
9885	158454	37426	585.0	45321.2	1272.5	0.236	3.780	4.585	131.826	805284	54.6	5.082	165	819.2	932.8	105.9	0.029	8007	7032	my8039_rel_o2nofp.cz11a_c32r128
9804	329629	13733	110.7	14315.1	240.4	0.042	0.344	1.460	25.114	1241708	48.8	3.767	71	785.7	881.8	89.4	4.152	16686	14129	pg158_o2nofp.cx9a2a_c32r128
9868	331352	13813	111.5	14416.8	242.1	0.042	0.345	1.461	25.119	1247923	48.8	3.766	71	785.4	881.4	85.8	1.517	16942	14400	pg164_o2nofp.cx9a2a_c32r128
9847	331037	13777	111.3	14431.6	242.1	0.042	0.344	1.466	25.181	1245582	49.0	3.763	71	785.5	881.5	85.6	2.765	16958	14304	pg17beta3_o2nofp.cx9a2a_c32r128
9836	331207	13775	111.1	14361.1	241.4	0.042	0.344	1.460	25.132	1248427	48.7	3.769	71	785.5	881.6	86.4	1.642	16979	14480	pg17rc1_o2nofp.cx9a2a_c32r128
qp500.L4
qp500.L4: point queries with 500 insert/s per client. Graphs for performance per 1-second interval are here.
Average throughput:
Query response time histogram: each cell has the percentage of responses that take <= the time in the header and max is the max response time in seconds. For max values in the top 25% of the range have a red background and in the bottom 25% of the range have a green background. The red background is not used when the min value is within 80% of the max value.
| dbms | 256us | 1ms | 4ms | 16ms | 64ms | 256ms | 1s | 4s | 16s | gt | max |
|---|---|---|---|---|---|---|---|---|---|---|---|
| my5651_rel_o2nofp.cz11a_c32r128 | 0.584 | 56.586 | 41.815 | 1.016 | 0.054 | ||||||
| my5744_rel_o2nofp.cz11a_c32r128 | 0.419 | 90.611 | 8.942 | 0.029 | 0.036 | ||||||
| my8039_rel_o2nofp.cz11a_c32r128 | nonzero | 7.374 | 83.661 | 8.952 | 0.013 | 0.035 | |||||
| pg158_o2nofp.cx9a2a_c32r128 | 0.256 | 93.460 | 1.974 | 4.284 | 0.014 | 0.011 | 0.001 | 2.426 | |||
| pg164_o2nofp.cx9a2a_c32r128 | 0.300 | 94.611 | 0.982 | 4.085 | 0.010 | 0.011 | nonzero | 1.429 | |||
| pg17beta3_o2nofp.cx9a2a_c32r128 | 0.284 | 94.356 | 1.134 | 4.207 | 0.011 | 0.007 | 0.001 | 2.506 | |||
| pg17rc1_o2nofp.cx9a2a_c32r128 | 0.302 | 94.383 | 1.143 | 4.144 | 0.016 | 0.011 | 0.002 | 3.977 |
Insert response time histogram: each cell has the percentage of responses that take <= the time in the header and max is the max response time in seconds. For max values in the top 25% of the range have a red background and in the bottom 25% of the range have a green background. The red background is not used when the min value is within 80% of the max value.
| dbms | 256us | 1ms | 4ms | 16ms | 64ms | 256ms | 1s | 4s | 16s | gt | max |
|---|---|---|---|---|---|---|---|---|---|---|---|
| my5651_rel_o2nofp.cz11a_c32r128 | 0.356 | 72.075 | 27.566 | 0.003 | 0.309 | ||||||
| my5744_rel_o2nofp.cz11a_c32r128 | 2.338 | 95.620 | 2.042 | 0.238 | |||||||
| my8039_rel_o2nofp.cz11a_c32r128 | 11.010 | 88.875 | 0.116 | 0.135 | |||||||
| pg158_o2nofp.cx9a2a_c32r128 | 49.773 | 49.423 | 0.466 | 0.296 | 0.042 | 2.198 | |||||
| pg164_o2nofp.cx9a2a_c32r128 | 48.949 | 50.421 | 0.305 | 0.308 | 0.017 | 1.562 | |||||
| pg17beta3_o2nofp.cx9a2a_c32r128 | 47.623 | 51.841 | 0.289 | 0.227 | 0.020 | 2.215 | |||||
| pg17rc1_o2nofp.cx9a2a_c32r128 | 44.616 | 54.555 | 0.454 | 0.328 | 0.046 | 0.001 | 4.110 |
Delete response time histogram: each cell has the percentage of responses that take <= the time in the header and max is the max response time in seconds. For max values in the top 25% of the range have a red background and in the bottom 25% of the range have a green background. The red background is not used when the min value is within 80% of the max value.
| dbms | 256us | 1ms | 4ms | 16ms | 64ms | 256ms | 1s | 4s | 16s | gt | max |
|---|---|---|---|---|---|---|---|---|---|---|---|
| my5651_rel_o2nofp.cz11a_c32r128 | 0.206 | 16.374 | 77.017 | 6.404 | 0.243 | ||||||
| my5744_rel_o2nofp.cz11a_c32r128 | 5.112 | 92.263 | 2.625 | nonzero | 0.080 | ||||||
| my8039_rel_o2nofp.cz11a_c32r128 | 30.789 | 68.220 | 0.990 | 0.058 | |||||||
| pg158_o2nofp.cx9a2a_c32r128 | 77.171 | 22.478 | 0.152 | 0.179 | 0.019 | 2.059 | |||||
| pg164_o2nofp.cx9a2a_c32r128 | 71.763 | 27.855 | 0.194 | 0.183 | 0.004 | 1.549 | |||||
| pg17beta3_o2nofp.cx9a2a_c32r128 | 72.867 | 26.898 | 0.080 | 0.150 | 0.005 | 1.287 | |||||
| pg17rc1_o2nofp.cx9a2a_c32r128 | 75.161 | 24.473 | 0.150 | 0.207 | 0.009 | 3.613 |
Performance metrics for the DBMS listed above. Some are normalized by throughput, others are not. Legend for results is here.
ips	qps	rps	rmbps	wps	wmbps	rpq	rkbpq	wpi	wkbpi	csps	cpups	cspq	cpupq	dbgb1	dbgb2	rss	maxop	p50	p99	tag
9885	4456	56140	873.5	39405.0	695.7	12.599	200.731	3.987	72.071	487061	38.8	109.305	4180	819.8	933.2	105.0	0.054	224	144	my5651_rel_o2nofp.cz11a_c32r128
9885	7750	106025	1656.6	67661.7	1403.5	13.680	218.879	6.845	145.393	502552	26.7	64.842	1654	820.2	934.0	107.6	0.036	400	144	my5744_rel_o2nofp.cz11a_c32r128
9885	9095	109080	1704.4	48233.1	1336.8	11.994	191.905	4.880	138.488	430060	22.6	47.287	1193	819.2	932.8	106.0	0.035	464	240	my8039_rel_o2nofp.cz11a_c32r128
9863	5712	100880	792.0	22402.2	301.5	17.660	141.982	2.271	31.304	234702	35.5	41.086	2983	786.5	882.6	36.9	2.426	304	80	pg158_o2nofp.cx9a2a_c32r128
9874	6119	106649	837.7	22506.0	302.7	17.429	140.187	2.279	31.394	246124	36.1	40.223	2832	785.9	881.9	23.8	1.429	320	96	pg164_o2nofp.cx9a2a_c32r128
9879	6013	105182	826.2	22426.2	301.7	17.492	140.702	2.270	31.275	242100	36.6	40.262	2922	785.9	882.0	24.8	2.506	304	96	pg17beta3_o2nofp.cx9a2a_c32r128
9841	5994	104656	822.1	22339.4	300.3	17.459	140.437	2.270	31.249	241320	35.7	40.257	2859	786.0	882.1	26.4	3.977	320	47	pg17rc1_o2nofp.cx9a2a_c32r128
qr1000.L5
qr1000.L5: range queries with 1000 insert/s per client. Graphs for performance per 1-second interval are here.
Average throughput:
Query response time histogram: each cell has the percentage of responses that take <= the time in the header and max is the max response time in seconds. For max values in the top 25% of the range have a red background and in the bottom 25% of the range have a green background. The red background is not used when the min value is within 80% of the max value.
| dbms | 256us | 1ms | 4ms | 16ms | 64ms | 256ms | 1s | 4s | 16s | gt | max |
|---|---|---|---|---|---|---|---|---|---|---|---|
| my5651_rel_o2nofp.cz11a_c32r128 | 94.790 | 3.939 | 1.227 | 0.044 | 0.001 | nonzero | nonzero | 0.388 | |||
| my5744_rel_o2nofp.cz11a_c32r128 | 96.794 | 2.572 | 0.608 | 0.026 | nonzero | 0.047 | |||||
| my8039_rel_o2nofp.cz11a_c32r128 | 95.959 | 3.146 | 0.883 | 0.013 | nonzero | 0.041 | |||||
| pg158_o2nofp.cx9a2a_c32r128 | 99.557 | 0.341 | 0.047 | 0.038 | 0.016 | nonzero | nonzero | nonzero | 2.567 | ||
| pg164_o2nofp.cx9a2a_c32r128 | 99.607 | 0.299 | 0.037 | 0.038 | 0.019 | nonzero | nonzero | nonzero | 2.733 | ||
| pg17beta3_o2nofp.cx9a2a_c32r128 | 99.601 | 0.305 | 0.038 | 0.038 | 0.018 | nonzero | nonzero | nonzero | 3.785 | ||
| pg17rc1_o2nofp.cx9a2a_c32r128 | 99.592 | 0.312 | 0.038 | 0.039 | 0.019 | nonzero | nonzero | nonzero | nonzero | 4.278 |
Insert response time histogram: each cell has the percentage of responses that take <= the time in the header and max is the max response time in seconds. For max values in the top 25% of the range have a red background and in the bottom 25% of the range have a green background. The red background is not used when the min value is within 80% of the max value.
| dbms | 256us | 1ms | 4ms | 16ms | 64ms | 256ms | 1s | 4s | 16s | gt | max |
|---|---|---|---|---|---|---|---|---|---|---|---|
| my5651_rel_o2nofp.cz11a_c32r128 | nonzero | 24.653 | 57.586 | 0.630 | 17.131 | 0.318 | |||||
| my5744_rel_o2nofp.cz11a_c32r128 | nonzero | 50.616 | 49.172 | 0.212 | 0.137 | ||||||
| my8039_rel_o2nofp.cz11a_c32r128 | 0.001 | 35.885 | 64.083 | 0.032 | 0.110 | ||||||
| pg158_o2nofp.cx9a2a_c32r128 | 42.825 | 47.852 | 9.137 | 0.092 | 0.093 | 2.682 | |||||
| pg164_o2nofp.cx9a2a_c32r128 | 42.614 | 45.912 | 11.268 | 0.092 | 0.112 | 0.002 | 4.800 | ||||
| pg17beta3_o2nofp.cx9a2a_c32r128 | 41.988 | 47.333 | 10.492 | 0.075 | 0.110 | 0.002 | 4.371 | ||||
| pg17rc1_o2nofp.cx9a2a_c32r128 | 41.656 | 47.175 | 11.004 | 0.068 | 0.089 | 0.008 | 5.394 |
Delete response time histogram: each cell has the percentage of responses that take <= the time in the header and max is the max response time in seconds. For max values in the top 25% of the range have a red background and in the bottom 25% of the range have a green background. The red background is not used when the min value is within 80% of the max value.
| dbms | 256us | 1ms | 4ms | 16ms | 64ms | 256ms | 1s | 4s | 16s | gt | max |
|---|---|---|---|---|---|---|---|---|---|---|---|
| my5651_rel_o2nofp.cz11a_c32r128 | 24.955 | 51.414 | 6.239 | 0.077 | 17.314 | 0.308 | |||||
| my5744_rel_o2nofp.cz11a_c32r128 | 78.267 | 21.554 | 0.180 | 0.058 | |||||||
| my8039_rel_o2nofp.cz11a_c32r128 | 28.722 | 68.530 | 2.748 | 0.048 | |||||||
| pg158_o2nofp.cx9a2a_c32r128 | 42.260 | 56.035 | 1.614 | 0.034 | 0.057 | 2.617 | |||||
| pg164_o2nofp.cx9a2a_c32r128 | 39.885 | 57.554 | 2.468 | 0.044 | 0.048 | 3.443 | |||||
| pg17beta3_o2nofp.cx9a2a_c32r128 | 37.443 | 60.042 | 2.436 | 0.036 | 0.044 | 3.954 | |||||
| pg17rc1_o2nofp.cx9a2a_c32r128 | 36.808 | 60.427 | 2.699 | 0.026 | 0.040 | nonzero | 4.269 |
Performance metrics for the DBMS listed above. Some are normalized by throughput, others are not. Legend for results is here.
ips	qps	rps	rmbps	wps	wmbps	rpq	rkbpq	wpi	wkbpi	csps	cpups	cspq	cpupq	dbgb1	dbgb2	rss	maxop	p50	p99	tag
11125	128256	27668	427.9	52543.7	1036.5	0.216	3.416	4.723	95.407	711073	48.8	5.544	183	819.8	933.2	105.0	0.388	6665	943	my5651_rel_o2nofp.cz11a_c32r128
19748	130415	38913	608.0	65920.4	1455.5	0.298	4.774	3.338	75.473	748802	58.8	5.742	216	820.2	934.0	107.6	0.047	6856	2894	my5744_rel_o2nofp.cz11a_c32r128
19769	118613	37092	579.6	48481.6	1394.8	0.313	5.004	2.452	72.246	675233	59.2	5.693	240	819.2	933.7	106.0	0.041	5930	5162	my8039_rel_o2nofp.cz11a_c32r128
19058	213552	25378	204.4	27097.7	573.0	0.119	0.980	1.422	30.786	721669	63.3	3.379	142	789.4	885.4	81.4	2.567	11428	448	pg158_o2nofp.cx9a2a_c32r128
18711	213497	24913	200.7	26872.2	568.7	0.117	0.963	1.436	31.121	713162	63.4	3.340	143	788.6	935.6	81.1	2.733	11379	1135	pg164_o2nofp.cx9a2a_c32r128
18692	213136	24939	200.8	26846.5	560.6	0.117	0.965	1.436	30.713	709000	63.4	3.327	143	788.8	884.8	79.4	3.785	11257	1550	pg17beta3_o2nofp.cx9a2a_c32r128
18740	212570	24984	201.3	26861.6	563.8	0.118	0.970	1.433	30.807	706415	63.6	3.323	144	788.6	884.7	77.9	4.278	11168	1071	pg17rc1_o2nofp.cx9a2a_c32r128
qp1000.L6
qp1000.L6: point queries with 1000 insert/s per client. Graphs for performance per 1-second interval are here.
Average throughput:
Query response time histogram: each cell has the percentage of responses that take <= the time in the header and max is the max response time in seconds. For max values in the top 25% of the range have a red background and in the bottom 25% of the range have a green background. The red background is not used when the min value is within 80% of the max value.
| dbms | 256us | 1ms | 4ms | 16ms | 64ms | 256ms | 1s | 4s | 16s | gt | max |
|---|---|---|---|---|---|---|---|---|---|---|---|
| my5651_rel_o2nofp.cz11a_c32r128 | nonzero | 7.699 | 67.594 | 23.687 | 1.020 | nonzero | 0.084 | ||||
| my5744_rel_o2nofp.cz11a_c32r128 | nonzero | 2.294 | 96.357 | 1.329 | 0.021 | 0.050 | |||||
| my8039_rel_o2nofp.cz11a_c32r128 | nonzero | 4.874 | 85.562 | 9.546 | 0.017 | 0.052 | |||||
| pg158_o2nofp.cx9a2a_c32r128 | 0.003 | 74.197 | 18.470 | 7.235 | 0.058 | 0.029 | 0.007 | 0.001 | 4.481 | ||
| pg164_o2nofp.cx9a2a_c32r128 | 0.003 | 78.152 | 14.908 | 6.868 | 0.040 | 0.025 | 0.004 | 2.820 | |||
| pg17beta3_o2nofp.cx9a2a_c32r128 | 0.004 | 77.511 | 15.386 | 7.021 | 0.049 | 0.024 | 0.005 | nonzero | 5.414 | ||
| pg17rc1_o2nofp.cx9a2a_c32r128 | 0.004 | 76.952 | 15.911 | 7.056 | 0.048 | 0.024 | 0.005 | 0.001 | 6.066 |
Insert response time histogram: each cell has the percentage of responses that take <= the time in the header and max is the max response time in seconds. For max values in the top 25% of the range have a red background and in the bottom 25% of the range have a green background. The red background is not used when the min value is within 80% of the max value.
| dbms | 256us | 1ms | 4ms | 16ms | 64ms | 256ms | 1s | 4s | 16s | gt | max |
|---|---|---|---|---|---|---|---|---|---|---|---|
| my5651_rel_o2nofp.cz11a_c32r128 | 0.082 | 9.848 | 6.371 | 83.699 | 0.708 | ||||||
| my5744_rel_o2nofp.cz11a_c32r128 | 42.274 | 38.294 | 0.777 | 18.654 | 0.343 | ||||||
| my8039_rel_o2nofp.cz11a_c32r128 | 7.346 | 31.335 | 61.320 | 0.217 | |||||||
| pg158_o2nofp.cx9a2a_c32r128 | 11.433 | 82.338 | 5.912 | 0.241 | 0.070 | 0.006 | 4.510 | ||||
| pg164_o2nofp.cx9a2a_c32r128 | 14.736 | 81.071 | 3.919 | 0.237 | 0.036 | 2.874 | |||||
| pg17beta3_o2nofp.cx9a2a_c32r128 | 14.973 | 79.118 | 5.653 | 0.199 | 0.054 | 0.003 | 5.445 | ||||
| pg17rc1_o2nofp.cx9a2a_c32r128 | 14.126 | 79.847 | 5.755 | 0.210 | 0.057 | 0.006 | 6.937 |
Delete response time histogram: each cell has the percentage of responses that take <= the time in the header and max is the max response time in seconds. For max values in the top 25% of the range have a red background and in the bottom 25% of the range have a green background. The red background is not used when the min value is within 80% of the max value.
| dbms | 256us | 1ms | 4ms | 16ms | 64ms | 256ms | 1s | 4s | 16s | gt | max |
|---|---|---|---|---|---|---|---|---|---|---|---|
| my5651_rel_o2nofp.cz11a_c32r128 | 0.589 | 9.011 | 6.464 | 0.307 | 83.627 | 0.688 | |||||
| my5744_rel_o2nofp.cz11a_c32r128 | 25.136 | 54.198 | 1.712 | 0.062 | 18.892 | 0.335 | |||||
| my8039_rel_o2nofp.cz11a_c32r128 | 2.691 | 20.284 | 22.352 | 54.673 | 0.207 | ||||||
| pg158_o2nofp.cx9a2a_c32r128 | 0.027 | 99.031 | 0.709 | 0.196 | 0.035 | 0.001 | 4.291 | ||||
| pg164_o2nofp.cx9a2a_c32r128 | 0.020 | 99.019 | 0.744 | 0.193 | 0.024 | 2.747 | |||||
| pg17beta3_o2nofp.cx9a2a_c32r128 | 0.008 | 98.765 | 1.033 | 0.158 | 0.033 | 0.003 | 5.403 | ||||
| pg17rc1_o2nofp.cx9a2a_c32r128 | 0.012 | 98.797 | 1.001 | 0.163 | 0.028 | nonzero | 5.230 |
Performance metrics for the DBMS listed above. Some are normalized by throughput, others are not. Legend for results is here.
ips	qps	rps	rmbps	wps	wmbps	rpq	rkbpq	wpi	wkbpi	csps	cpups	cspq	cpupq	dbgb1	dbgb2	rss	maxop	p50	p99	tag
3306	5839	58466	912.2	29916.9	511.6	10.013	159.979	9.048	158.458	408250	31.5	69.919	2590	819.8	933.2	105.0	0.084	288	208	my5651_rel_o2nofp.cz11a_c32r128
10870	10282	117767	1840.1	54627.2	1255.6	11.453	183.252	5.026	118.289	460013	26.9	44.738	1256	820.2	934.0	107.6	0.050	543	224	my5744_rel_o2nofp.cz11a_c32r128
12798	8682	107354	1677.5	47684.2	1352.1	12.365	197.852	3.726	108.191	469240	27.3	54.047	1509	819.2	935.3	106.0	0.052	448	272	my8039_rel_o2nofp.cz11a_c32r128
19180	3273	84472	663.5	39473.1	582.2	25.809	207.586	2.058	31.085	214641	57.2	65.581	8389	793.7	889.7	62.8	4.481	176	0	pg158_o2nofp.cx9a2a_c32r128
19544	3580	89856	705.6	40087.5	587.5	25.102	201.848	2.051	30.783	217084	59.6	60.645	7992	792.9	889.0	59.2	2.820	192	48	pg164_o2nofp.cx9a2a_c32r128
19231	3481	87773	689.2	40013.1	587.3	25.215	202.754	2.081	31.274	211410	59.5	60.733	8205	793.1	889.2	59.9	5.414	176	16	pg17beta3_o2nofp.cx9a2a_c32r128
19210	3463	87323	685.7	39761.2	584.5	25.217	202.770	2.070	31.158	210401	59.1	60.760	8192	792.9	889.0	59.1	6.066	176	i_qps	pg17rc1_o2nofp.cx9a2a_c32r128
l.i0
l.i0: load without secondary indexes
Performance metrics for all DBMS, not just the ones listed above. Some are normalized by throughput, others are not. Legend for results is here.
ips	qps	rps	rmbps	wps	wmbps	rpq	rkbpq	wpi	wkbpi	csps	cpups	cspq	cpupq	dbgb1	dbgb2	rss	maxop	p50	p99	tag
371264	0	2185	8.5	2467.7	132.8	0.006	0.024	0.007	0.366	139954	37.7	0.377	49	263.2	363.7	107.1	0.173	17586	15184	my5651_rel_o2nofp.cz11a_c32r128
672043	0	2	0.0	4526.7	240.6	0.000	0.000	0.007	0.367	82544	46.0	0.123	33	263.2	363.7	108.1	0.177	34063	29169	my5744_rel_o2nofp.cz11a_c32r128
1429082	0	5	0.1	9725.7	531.2	0.000	0.000	0.007	0.381	297221	54.8	0.208	18	262.3	362.8	108.4	0.245	73820	61733	my8039_rel_o2nofp.cz11a_c32r128
1989060	0	1724	13.5	8354.0	796.4	0.001	0.007	0.004	0.410	363377	57.4	0.183	14	382.7	478.8	6.9	1.421	107058	34962	pg158_o2nofp.cx9a2a_c32r128
2004008	0	1712	13.4	8441.4	806.0	0.001	0.007	0.004	0.412	370269	57.4	0.185	14	382.7	478.8	11.7	2.357	108383	35561	pg164_o2nofp.cx9a2a_c32r128
2026342	0	1701	13.7	8542.2	813.8	0.001	0.007	0.004	0.411	369422	57.0	0.182	14	382.7	478.8	95.4	1.931	109848	27470	pg17beta3_o2nofp.cx9a2a_c32r128
2039776	0	1732	13.9	8560.9	819.2	0.001	0.007	0.004	0.411	362999	57.3	0.178	13	382.7	478.8	97.2	1.330	110081	39857	pg17rc1_o2nofp.cx9a2a_c32r128
l.x
l.x: create secondary indexes
Performance metrics for all DBMS, not just the ones listed above. Some are normalized by throughput, others are not. Legend for results is here.
ips	qps	rps	rmbps	wps	wmbps	rpq	rkbpq	wpi	wkbpi	csps	cpups	cspq	cpupq	dbgb1	dbgb2	rss	maxop	p50	p99	tag
298352	0	3998	264.7	16624.5	606.4	0.013	0.909	0.056	2.081	119028	35.8	0.399	58	557.3	657.8	107.8	0.003	NA	NA	my5651_rel_o2nofp.cz11a_c32r128
1793722	0	17853	1554.2	29637.8	1923.1	0.010	0.887	0.017	1.098	206052	25.9	0.115	7	605.8	706.3	105.4	0.002	NA	NA	my5744_rel_o2nofp.cz11a_c32r128
1367521	0	34508	1991.3	40701.9	1795.0	0.025	1.491	0.030	1.344	192617	57.8	0.141	20	603.6	704.2	104.9	0.007	NA	NA	my8039_rel_o2nofp.cz11a_c32r128
2673797	0	14849	943.0	7784.5	858.6	0.006	0.361	0.003	0.329	150424	20.6	0.056	4	768.4	864.5	52.1	0.013	NA	NA	pg158_o2nofp.cx9a2a_c32r128
2875629	0	14480	915.2	7489.3	821.6	0.005	0.326	0.003	0.293	156963	21.3	0.055	4	768.4	864.5	30.9	0.437	NA	NA	pg164_o2nofp.cx9a2a_c32r128
3392706	0	11078	1077.5	8622.4	964.1	0.003	0.325	0.003	0.291	89452	23.8	0.026	3	768.4	863.7	31.2	0.071	NA	NA	pg17beta3_o2nofp.cx9a2a_c32r128
3436426	0	11401	1091.1	8913.6	983.6	0.003	0.325	0.003	0.293	89973	23.7	0.026	3	768.4	863.7	39.3	0.003	NA	NA	pg17rc1_o2nofp.cx9a2a_c32r128
l.i1
l.i1: continue load after secondary indexes created with 50 inserts per transaction
Performance metrics for all DBMS, not just the ones listed above. Some are normalized by throughput, others are not. Legend for results is here.
ips	qps	rps	rmbps	wps	wmbps	rpq	rkbpq	wpi	wkbpi	csps	cpups	cspq	cpupq	dbgb1	dbgb2	rss	maxop	p50	p99	tag
11325	0	28421	439.6	55822.6	1148.5	2.510	39.751	4.929	103.847	264139	16.0	23.324	678	819.8	933.2	105.4	1.626	200	150	my5651_rel_o2nofp.cz11a_c32r128
14164	0	34684	541.9	59410.6	1386.1	2.449	39.179	4.194	100.204	321279	20.9	22.682	708	820.2	934.0	107.8	0.373	200	150	my5744_rel_o2nofp.cz11a_c32r128
16129	0	36470	569.9	53356.1	1517.7	2.261	36.179	3.308	96.355	334131	20.7	20.716	616	819.2	935.6	107.5	0.475	699	300	my8039_rel_o2nofp.cz11a_c32r128
24661	0	31064	247.5	36812.6	807.2	1.260	10.279	1.493	33.516	90983	29.5	3.689	574	781.5	916.0	1.8	3.352	1299	0	pg158_o2nofp.cx9a2a_c32r128
24331	0	30718	244.9	36189.2	799.0	1.263	10.307	1.487	33.626	85551	30.6	3.516	604	781.5	877.6	2.0	2.887	1249	0	pg164_o2nofp.cx9a2a_c32r128
24525	0	31028	247.3	36654.9	801.5	1.265	10.324	1.495	33.465	85903	29.9	3.503	585	781.5	877.6	85.0	4.374	1199	0	pg17beta3_o2nofp.cx9a2a_c32r128
24316	0	30740	245.9	36359.7	797.3	1.264	10.355	1.495	33.577	85245	30.4	3.506	600	781.5	877.6	87.0	3.943	1249	0	pg17rc1_o2nofp.cx9a2a_c32r128
l.i2
l.i2: continue load after secondary indexes created with 5 inserts per transaction
Performance metrics for all DBMS, not just the ones listed above. Some are normalized by throughput, others are not. Legend for results is here.
ips	qps	rps	rmbps	wps	wmbps	rpq	rkbpq	wpi	wkbpi	csps	cpups	cspq	cpupq	dbgb1	dbgb2	rss	maxop	p50	p99	tag
4215	0	28835	438.8	52533.2	1038.2	6.841	106.607	12.464	252.227	256167	13.6	60.777	1549	819.8	933.2	105.0	0.122	115	65	my5651_rel_o2nofp.cz11a_c32r128
5800	0	36879	576.2	58906.5	1345.6	6.358	101.727	10.156	237.554	297041	16.6	51.210	1374	820.2	934.0	107.6	0.091	130	80	my5744_rel_o2nofp.cz11a_c32r128
5790	0	39308	614.2	50752.8	1457.6	6.789	108.619	8.765	257.774	341275	17.5	58.939	1451	819.2	932.8	105.9	0.145	145	85	my8039_rel_o2nofp.cz11a_c32r128
2599	0	3236	28.4	4787.0	75.4	1.245	11.171	1.842	29.724	21387	30.3	8.229	5596	784.9	880.9	21.1	2.449	225	170	pg158_o2nofp.cx9a2a_c32r128
2389	0	3109	31.9	4693.4	74.9	1.302	13.655	1.965	32.130	19720	24.8	8.256	4984	784.8	880.9	3.6	4.228	215	180	pg164_o2nofp.cx9a2a_c32r128
2404	0	2925	23.3	4476.8	70.5	1.217	9.933	1.862	30.037	17975	30.6	7.477	6110	784.9	880.9	83.6	3.570	215	180	pg17beta3_o2nofp.cx9a2a_c32r128
2453	0	3078	26.8	4751.3	75.3	1.255	11.201	1.937	31.423	18439	26.8	7.516	5244	784.8	880.9	85.1	3.845	120	105	pg17rc1_o2nofp.cx9a2a_c32r128
qr100.L1
qr100.L1: range queries with 100 insert/s per client
Performance metrics for all DBMS, not just the ones listed above. Some are normalized by throughput, others are not. Legend for results is here.
ips	qps	rps	rmbps	wps	wmbps	rpq	rkbpq	wpi	wkbpi	csps	cpups	cspq	cpupq	dbgb1	dbgb2	rss	maxop	p50	p99	tag
1977	232061	9338	145.1	8562.3	241.2	0.040	0.640	4.331	124.944	940200	43.4	4.052	90	819.8	933.2	105.0	0.022	11891	10213	my5651_rel_o2nofp.cz11a_c32r128
1977	194689	9264	144.7	9189.5	258.6	0.048	0.761	4.648	133.954	789529	44.8	4.055	110	820.2	934.0	107.6	0.027	9880	8135	my5744_rel_o2nofp.cz11a_c32r128
1977	179440	8285	129.5	9268.4	266.9	0.046	0.739	4.688	138.242	730948	45.0	4.074	120	819.2	932.8	105.9	0.014	9046	8458	my8039_rel_o2nofp.cz11a_c32r128
1977	370777	2634	21.2	1370.6	37.3	0.007	0.059	0.693	19.322	1410562	43.1	3.804	56	785.0	881.0	96.3	0.017	18930	17038	pg158_o2nofp.cx9a2a_c32r128
1977	371220	2714	21.9	1263.6	36.3	0.007	0.060	0.639	18.811	1412498	42.9	3.805	55	784.9	881.0	94.5	0.084	18652	17086	pg164_o2nofp.cx9a2a_c32r128
1976	372839	2723	22.1	1211.3	35.8	0.007	0.061	0.613	18.542	1419178	43.0	3.806	55	785.0	881.0	94.5	0.074	19147	17277	pg17beta3_o2nofp.cx9a2a_c32r128
1977	376989	2718	21.9	1261.4	36.3	0.007	0.059	0.638	18.827	1434874	42.8	3.806	54	785.0	881.0	96.0	0.043	19147	17405	pg17rc1_o2nofp.cx9a2a_c32r128
qp100.L2
qp100.L2: point queries with 100 insert/s per client
Performance metrics for all DBMS, not just the ones listed above. Some are normalized by throughput, others are not. Legend for results is here.
ips	qps	rps	rmbps	wps	wmbps	rpq	rkbpq	wpi	wkbpi	csps	cpups	cspq	cpupq	dbgb1	dbgb2	rss	maxop	p50	p99	tag
1977	6318	57264	894.0	26301.5	448.7	9.064	144.893	13.304	232.437	348709	27.5	55.195	2089	819.8	933.2	105.0	0.071	320	224	my5651_rel_o2nofp.cz11a_c32r128
1977	17422	128177	2002.8	22004.4	481.9	7.357	117.717	11.131	249.609	413569	16.9	23.739	466	820.2	934.0	107.6	0.026	927	240	my5744_rel_o2nofp.cz11a_c32r128
1977	17190	126334	1974.0	17461.7	490.0	7.349	117.591	8.833	253.792	373985	16.7	21.757	466	819.2	932.8	106.0	0.014	911	352	my8039_rel_o2nofp.cz11a_c32r128
1977	9161	127620	1002.0	6634.6	76.4	13.930	112.003	3.356	39.589	288312	22.7	31.471	1189	785.1	881.2	91.7	3.858	480	32	pg158_o2nofp.cx9a2a_c32r128
1977	9376	130459	1024.4	6731.4	77.2	13.914	111.876	3.405	39.987	294200	23.2	31.377	1188	785.0	881.0	43.6	3.464	480	160	pg164_o2nofp.cx9a2a_c32r128
1976	9191	128073	1005.7	6833.4	77.8	13.934	112.045	3.459	40.316	288923	23.5	31.435	1227	785.1	881.1	90.9	4.227	479	i_qps	pg17beta3_o2nofp.cx9a2a_c32r128
1977	9060	126266	991.5	6753.3	77.2	13.937	112.063	3.416	40.010	285487	22.8	31.511	1208	785.1	881.1	92.2	4.902	479	0	pg17rc1_o2nofp.cx9a2a_c32r128
qr500.L3
qr500.L3: range queries with 500 insert/s per client
Performance metrics for all DBMS, not just the ones listed above. Some are normalized by throughput, others are not. Legend for results is here.
ips	qps	rps	rmbps	wps	wmbps	rpq	rkbpq	wpi	wkbpi	csps	cpups	cspq	cpupq	dbgb1	dbgb2	rss	maxop	p50	p99	tag
9885	148810	31583	489.7	56498.8	1091.0	0.212	3.370	5.716	113.018	823807	48.6	5.536	157	819.8	933.2	105.0	0.068	7786	1295	my5651_rel_o2nofp.cz11a_c32r128
9885	149680	38017	594.0	58567.9	1285.8	0.254	4.064	5.925	133.205	831031	58.0	5.552	186	820.2	934.0	107.6	0.047	7656	5961	my5744_rel_o2nofp.cz11a_c32r128
9885	158454	37426	585.0	45321.2	1272.5	0.236	3.780	4.585	131.826	805284	54.6	5.082	165	819.2	932.8	105.9	0.029	8007	7032	my8039_rel_o2nofp.cz11a_c32r128
9804	329629	13733	110.7	14315.1	240.4	0.042	0.344	1.460	25.114	1241708	48.8	3.767	71	785.7	881.8	89.4	4.152	16686	14129	pg158_o2nofp.cx9a2a_c32r128
9868	331352	13813	111.5	14416.8	242.1	0.042	0.345	1.461	25.119	1247923	48.8	3.766	71	785.4	881.4	85.8	1.517	16942	14400	pg164_o2nofp.cx9a2a_c32r128
9847	331037	13777	111.3	14431.6	242.1	0.042	0.344	1.466	25.181	1245582	49.0	3.763	71	785.5	881.5	85.6	2.765	16958	14304	pg17beta3_o2nofp.cx9a2a_c32r128
9836	331207	13775	111.1	14361.1	241.4	0.042	0.344	1.460	25.132	1248427	48.7	3.769	71	785.5	881.6	86.4	1.642	16979	14480	pg17rc1_o2nofp.cx9a2a_c32r128
qp500.L4
qp500.L4: point queries with 500 insert/s per client
Performance metrics for all DBMS, not just the ones listed above. Some are normalized by throughput, others are not. Legend for results is here.
ips	qps	rps	rmbps	wps	wmbps	rpq	rkbpq	wpi	wkbpi	csps	cpups	cspq	cpupq	dbgb1	dbgb2	rss	maxop	p50	p99	tag
9885	4456	56140	873.5	39405.0	695.7	12.599	200.731	3.987	72.071	487061	38.8	109.305	4180	819.8	933.2	105.0	0.054	224	144	my5651_rel_o2nofp.cz11a_c32r128
9885	7750	106025	1656.6	67661.7	1403.5	13.680	218.879	6.845	145.393	502552	26.7	64.842	1654	820.2	934.0	107.6	0.036	400	144	my5744_rel_o2nofp.cz11a_c32r128
9885	9095	109080	1704.4	48233.1	1336.8	11.994	191.905	4.880	138.488	430060	22.6	47.287	1193	819.2	932.8	106.0	0.035	464	240	my8039_rel_o2nofp.cz11a_c32r128
9863	5712	100880	792.0	22402.2	301.5	17.660	141.982	2.271	31.304	234702	35.5	41.086	2983	786.5	882.6	36.9	2.426	304	80	pg158_o2nofp.cx9a2a_c32r128
9874	6119	106649	837.7	22506.0	302.7	17.429	140.187	2.279	31.394	246124	36.1	40.223	2832	785.9	881.9	23.8	1.429	320	96	pg164_o2nofp.cx9a2a_c32r128
9879	6013	105182	826.2	22426.2	301.7	17.492	140.702	2.270	31.275	242100	36.6	40.262	2922	785.9	882.0	24.8	2.506	304	96	pg17beta3_o2nofp.cx9a2a_c32r128
9841	5994	104656	822.1	22339.4	300.3	17.459	140.437	2.270	31.249	241320	35.7	40.257	2859	786.0	882.1	26.4	3.977	320	47	pg17rc1_o2nofp.cx9a2a_c32r128
qr1000.L5
qr1000.L5: range queries with 1000 insert/s per client
Performance metrics for all DBMS, not just the ones listed above. Some are normalized by throughput, others are not. Legend for results is here.
ips	qps	rps	rmbps	wps	wmbps	rpq	rkbpq	wpi	wkbpi	csps	cpups	cspq	cpupq	dbgb1	dbgb2	rss	maxop	p50	p99	tag
11125	128256	27668	427.9	52543.7	1036.5	0.216	3.416	4.723	95.407	711073	48.8	5.544	183	819.8	933.2	105.0	0.388	6665	943	my5651_rel_o2nofp.cz11a_c32r128
19748	130415	38913	608.0	65920.4	1455.5	0.298	4.774	3.338	75.473	748802	58.8	5.742	216	820.2	934.0	107.6	0.047	6856	2894	my5744_rel_o2nofp.cz11a_c32r128
19769	118613	37092	579.6	48481.6	1394.8	0.313	5.004	2.452	72.246	675233	59.2	5.693	240	819.2	933.7	106.0	0.041	5930	5162	my8039_rel_o2nofp.cz11a_c32r128
19058	213552	25378	204.4	27097.7	573.0	0.119	0.980	1.422	30.786	721669	63.3	3.379	142	789.4	885.4	81.4	2.567	11428	448	pg158_o2nofp.cx9a2a_c32r128
18711	213497	24913	200.7	26872.2	568.7	0.117	0.963	1.436	31.121	713162	63.4	3.340	143	788.6	935.6	81.1	2.733	11379	1135	pg164_o2nofp.cx9a2a_c32r128
18692	213136	24939	200.8	26846.5	560.6	0.117	0.965	1.436	30.713	709000	63.4	3.327	143	788.8	884.8	79.4	3.785	11257	1550	pg17beta3_o2nofp.cx9a2a_c32r128
18740	212570	24984	201.3	26861.6	563.8	0.118	0.970	1.433	30.807	706415	63.6	3.323	144	788.6	884.7	77.9	4.278	11168	1071	pg17rc1_o2nofp.cx9a2a_c32r128
qp1000.L6
qp1000.L6: point queries with 1000 insert/s per client
Performance metrics for all DBMS, not just the ones listed above. Some are normalized by throughput, others are not. Legend for results is here.
ips	qps	rps	rmbps	wps	wmbps	rpq	rkbpq	wpi	wkbpi	csps	cpups	cspq	cpupq	dbgb1	dbgb2	rss	maxop	p50	p99	tag
3306	5839	58466	912.2	29916.9	511.6	10.013	159.979	9.048	158.458	408250	31.5	69.919	2590	819.8	933.2	105.0	0.084	288	208	my5651_rel_o2nofp.cz11a_c32r128
10870	10282	117767	1840.1	54627.2	1255.6	11.453	183.252	5.026	118.289	460013	26.9	44.738	1256	820.2	934.0	107.6	0.050	543	224	my5744_rel_o2nofp.cz11a_c32r128
12798	8682	107354	1677.5	47684.2	1352.1	12.365	197.852	3.726	108.191	469240	27.3	54.047	1509	819.2	935.3	106.0	0.052	448	272	my8039_rel_o2nofp.cz11a_c32r128
19180	3273	84472	663.5	39473.1	582.2	25.809	207.586	2.058	31.085	214641	57.2	65.581	8389	793.7	889.7	62.8	4.481	176	0	pg158_o2nofp.cx9a2a_c32r128
19544	3580	89856	705.6	40087.5	587.5	25.102	201.848	2.051	30.783	217084	59.6	60.645	7992	792.9	889.0	59.2	2.820	192	48	pg164_o2nofp.cx9a2a_c32r128
19231	3481	87773	689.2	40013.1	587.3	25.215	202.754	2.081	31.274	211410	59.5	60.733	8205	793.1	889.2	59.9	5.414	176	16	pg17beta3_o2nofp.cx9a2a_c32r128
19210	3463	87323	685.7	39761.2	584.5	25.217	202.770	2.070	31.158	210401	59.1	60.760	8192	792.9	889.0	59.1	6.066	176	i_qps	pg17rc1_o2nofp.cx9a2a_c32r128
l.i0
- l.i0: load without secondary indexes
- Legend for results is here.
- Each entry lists the percentage of responses that fit in that bucket (slower than max time for previous bucket, faster than min time for next bucket).
Insert response time histogram
256us	1ms	4ms	16ms	64ms	256ms	1s	4s	16s	gt	max	tag
0.000	0.164	10.763	88.563	0.473	0.037	0.000	0.000	0.000	0.000	0.173	my5651_rel_o2nofp.cz11a_c32r128
0.000	0.153	99.593	0.206	0.011	0.037	0.000	0.000	0.000	0.000	0.177	my5744_rel_o2nofp.cz11a_c32r128
0.000	0.099	99.788	0.060	0.014	0.039	0.000	0.000	0.000	0.000	0.245	my8039_rel_o2nofp.cz11a_c32r128
0.000	87.809	11.979	0.105	0.089	0.012	0.005	nonzero	0.000	0.000	1.421	pg158_o2nofp.cx9a2a_c32r128
0.000	88.492	11.270	0.127	0.094	0.012	0.005	nonzero	0.000	0.000	2.357	pg164_o2nofp.cx9a2a_c32r128
0.000	89.344	10.390	0.150	0.097	0.013	0.005	nonzero	0.000	0.000	1.931	pg17beta3_o2nofp.cx9a2a_c32r128
0.000	89.987	9.754	0.139	0.098	0.016	0.006	nonzero	0.000	0.000	1.330	pg17rc1_o2nofp.cx9a2a_c32r128
l.x
- l.x: create secondary indexes
- Legend for results is here.
- Each entry lists the percentage of responses that fit in that bucket (slower than max time for previous bucket, faster than min time for next bucket).
TODO - determine whether there is data for create index response time
l.i1
- l.i1: continue load after secondary indexes created with 50 inserts per transaction
- Legend for results is here.
- Each entry lists the percentage of responses that fit in that bucket (slower than max time for previous bucket, faster than min time for next bucket).
Insert response time histogram
256us	1ms	4ms	16ms	64ms	256ms	1s	4s	16s	gt	max	tag
0.000	0.000	0.001	4.124	64.166	11.736	19.972	nonzero	0.000	0.000	1.626	my5651_rel_o2nofp.cz11a_c32r128
0.000	0.000	0.023	30.572	42.689	11.900	14.815	0.000	0.000	0.000	0.373	my5744_rel_o2nofp.cz11a_c32r128
0.000	0.000	0.124	14.794	38.441	46.315	0.325	0.000	0.000	0.000	0.475	my8039_rel_o2nofp.cz11a_c32r128
0.000	0.000	0.000	21.007	70.392	8.352	0.126	0.122	0.000	0.000	3.352	pg158_o2nofp.cx9a2a_c32r128
0.000	0.000	0.000	21.845	70.089	7.871	0.086	0.109	0.000	0.000	2.887	pg164_o2nofp.cx9a2a_c32r128
0.000	0.000	0.000	19.950	70.859	8.979	0.104	0.108	nonzero	0.000	4.374	pg17beta3_o2nofp.cx9a2a_c32r128
0.000	0.000	0.000	21.126	69.898	8.770	0.094	0.112	0.000	0.000	3.943	pg17rc1_o2nofp.cx9a2a_c32r128
Delete response time histogram
256us	1ms	4ms	16ms	64ms	256ms	1s	4s	16s	gt	max	tag
0.000	0.000	1.760	35.847	42.238	0.185	19.970	nonzero	0.000	0.000	1.140	my5651_rel_o2nofp.cz11a_c32r128
0.000	0.000	17.859	64.695	2.547	0.097	14.802	0.000	0.000	0.000	0.366	my5744_rel_o2nofp.cz11a_c32r128
0.000	0.000	18.416	20.612	29.232	31.741	0.000	0.000	0.000	0.000	0.199	my8039_rel_o2nofp.cz11a_c32r128
0.000	2.328	9.162	26.837	60.259	1.309	0.043	0.061	0.000	0.000	3.118	pg158_o2nofp.cx9a2a_c32r128
0.000	2.384	8.225	19.987	66.830	2.478	0.034	0.062	0.000	0.000	2.801	pg164_o2nofp.cx9a2a_c32r128
0.000	2.530	8.786	23.509	62.699	2.360	0.054	0.061	0.000	0.000	3.033	pg17beta3_o2nofp.cx9a2a_c32r128
0.000	2.565	8.861	21.650	64.039	2.778	0.049	0.059	0.000	0.000	3.310	pg17rc1_o2nofp.cx9a2a_c32r128
l.i2
- l.i2: continue load after secondary indexes created with 5 inserts per transaction
- Legend for results is here.
- Each entry lists the percentage of responses that fit in that bucket (slower than max time for previous bucket, faster than min time for next bucket).
Insert response time histogram
256us	1ms	4ms	16ms	64ms	256ms	1s	4s	16s	gt	max	tag
0.001	0.092	8.215	45.109	37.733	8.850	0.000	0.000	0.000	0.000	0.122	my5651_rel_o2nofp.cz11a_c32r128
nonzero	4.866	37.914	18.258	38.855	0.107	0.000	0.000	0.000	0.000	0.091	my5744_rel_o2nofp.cz11a_c32r128
0.000	0.000	0.403	72.701	26.833	0.063	0.000	0.000	0.000	0.000	0.145	my8039_rel_o2nofp.cz11a_c32r128
nonzero	37.786	61.878	0.235	0.040	0.030	0.027	0.004	0.000	0.000	2.449	pg158_o2nofp.cx9a2a_c32r128
0.100	34.705	64.849	0.151	0.152	0.018	0.020	0.006	nonzero	0.000	4.228	pg164_o2nofp.cx9a2a_c32r128
nonzero	42.802	57.096	0.033	0.029	0.016	0.020	0.004	0.000	0.000	3.570	pg17beta3_o2nofp.cx9a2a_c32r128
0.040	40.582	59.136	0.082	0.110	0.022	0.022	0.006	0.000	0.000	3.845	pg17rc1_o2nofp.cx9a2a_c32r128
Delete response time histogram
256us	1ms	4ms	16ms	64ms	256ms	1s	4s	16s	gt	max	tag
0.001	0.616	26.399	26.535	38.200	8.249	0.000	0.000	0.000	0.000	0.112	my5651_rel_o2nofp.cz11a_c32r128
0.002	52.887	8.248	0.139	38.711	0.013	0.000	0.000	0.000	0.000	0.089	my5744_rel_o2nofp.cz11a_c32r128
0.000	0.000	0.662	73.380	25.937	0.021	0.000	0.000	0.000	0.000	0.124	my8039_rel_o2nofp.cz11a_c32r128
0.043	0.090	nonzero	0.080	99.785	0.001	0.001	nonzero	0.000	0.000	1.053	pg158_o2nofp.cx9a2a_c32r128
0.227	2.776	1.892	0.137	94.965	0.002	0.001	nonzero	0.000	0.000	1.605	pg164_o2nofp.cx9a2a_c32r128
0.000	0.000	0.000	0.066	99.933	0.001	nonzero	0.000	0.000	0.000	0.673	pg17beta3_o2nofp.cx9a2a_c32r128
0.097	1.562	0.323	0.056	97.961	0.001	0.001	nonzero	0.000	0.000	1.920	pg17rc1_o2nofp.cx9a2a_c32r128
qr100.L1
- qr100.L1: range queries with 100 insert/s per client
- Legend for results is here.
- Each entry lists the percentage of responses that fit in that bucket (slower than max time for previous bucket, faster than min time for next bucket).
Query response time histogram
256us	1ms	4ms	16ms	64ms	256ms	1s	4s	16s	gt	max	tag
99.548	0.396	0.045	0.010	nonzero	0.000	0.000	0.000	0.000	0.000	0.022	my5651_rel_o2nofp.cz11a_c32r128
99.830	0.139	0.030	nonzero	nonzero	0.000	0.000	0.000	0.000	0.000	0.027	my5744_rel_o2nofp.cz11a_c32r128
99.882	0.114	0.004	nonzero	0.000	0.000	0.000	0.000	0.000	0.000	0.014	my8039_rel_o2nofp.cz11a_c32r128
99.992	0.007	0.001	nonzero	nonzero	0.000	0.000	0.000	0.000	0.000	0.017	pg158_o2nofp.cx9a2a_c32r128
99.993	0.006	0.001	nonzero	nonzero	nonzero	0.000	0.000	0.000	0.000	0.084	pg164_o2nofp.cx9a2a_c32r128
99.992	0.007	0.001	nonzero	nonzero	nonzero	0.000	0.000	0.000	0.000	0.074	pg17beta3_o2nofp.cx9a2a_c32r128
99.993	0.006	0.001	nonzero	nonzero	0.000	0.000	0.000	0.000	0.000	0.043	pg17rc1_o2nofp.cx9a2a_c32r128
Insert response time histogram
256us	1ms	4ms	16ms	64ms	256ms	1s	4s	16s	gt	max	tag
0.000	0.000	0.000	20.406	79.589	0.006	0.000	0.000	0.000	0.000	0.080	my5651_rel_o2nofp.cz11a_c32r128
0.000	0.000	0.000	88.731	11.269	0.000	0.000	0.000	0.000	0.000	0.054	my5744_rel_o2nofp.cz11a_c32r128
0.000	0.000	0.000	93.482	6.518	0.000	0.000	0.000	0.000	0.000	0.031	my8039_rel_o2nofp.cz11a_c32r128
0.000	0.000	0.000	96.879	3.090	0.031	0.000	0.000	0.000	0.000	0.212	pg158_o2nofp.cx9a2a_c32r128
0.000	0.000	0.000	98.188	1.744	0.067	0.001	0.000	0.000	0.000	0.299	pg164_o2nofp.cx9a2a_c32r128
0.000	0.000	0.000	98.775	1.218	0.007	0.000	0.000	0.000	0.000	0.104	pg17beta3_o2nofp.cx9a2a_c32r128
0.000	0.000	0.000	98.771	1.121	0.094	0.014	0.000	0.000	0.000	0.769	pg17rc1_o2nofp.cx9a2a_c32r128
Delete response time histogram
256us	1ms	4ms	16ms	64ms	256ms	1s	4s	16s	gt	max	tag
0.000	0.000	9.621	78.699	11.681	0.000	0.000	0.000	0.000	0.000	0.047	my5651_rel_o2nofp.cz11a_c32r128
0.000	0.000	85.693	14.154	0.153	0.000	0.000	0.000	0.000	0.000	0.038	my5744_rel_o2nofp.cz11a_c32r128
0.000	0.000	87.174	12.821	0.006	0.000	0.000	0.000	0.000	0.000	0.021	my8039_rel_o2nofp.cz11a_c32r128
0.000	42.203	57.710	0.075	0.013	0.000	0.000	0.000	0.000	0.000	0.019	pg158_o2nofp.cx9a2a_c32r128
0.000	44.325	55.428	0.082	0.164	0.001	0.000	0.000	0.000	0.000	0.080	pg164_o2nofp.cx9a2a_c32r128
0.000	44.775	55.129	0.054	0.042	0.000	0.000	0.000	0.000	0.000	0.030	pg17beta3_o2nofp.cx9a2a_c32r128
0.000	48.046	51.742	0.085	0.126	0.001	0.000	0.000	0.000	0.000	0.105	pg17rc1_o2nofp.cx9a2a_c32r128
qp100.L2
- qp100.L2: point queries with 100 insert/s per client
- Legend for results is here.
- Each entry lists the percentage of responses that fit in that bucket (slower than max time for previous bucket, faster than min time for next bucket).
Query response time histogram
256us	1ms	4ms	16ms	64ms	256ms	1s	4s	16s	gt	max	tag
0.002	14.600	61.709	23.008	0.682	nonzero	0.000	0.000	0.000	0.000	0.071	my5651_rel_o2nofp.cz11a_c32r128
0.006	44.769	54.929	0.295	nonzero	0.000	0.000	0.000	0.000	0.000	0.026	my5744_rel_o2nofp.cz11a_c32r128
0.002	50.707	48.462	0.829	0.000	0.000	0.000	0.000	0.000	0.000	0.014	my8039_rel_o2nofp.cz11a_c32r128
nonzero	3.019	93.920	0.674	2.381	0.003	0.002	0.002	0.000	0.000	3.858	pg158_o2nofp.cx9a2a_c32r128
nonzero	2.951	94.294	0.373	2.379	0.001	0.001	0.001	0.000	0.000	3.464	pg164_o2nofp.cx9a2a_c32r128
nonzero	3.015	94.234	0.319	2.424	0.005	0.001	0.001	nonzero	0.000	4.227	pg17beta3_o2nofp.cx9a2a_c32r128
nonzero	3.008	94.232	0.353	2.396	0.005	0.002	0.003	nonzero	0.000	4.902	pg17rc1_o2nofp.cx9a2a_c32r128
Insert response time histogram
256us	1ms	4ms	16ms	64ms	256ms	1s	4s	16s	gt	max	tag
0.000	0.000	0.000	1.701	57.760	40.531	0.008	0.000	0.000	0.000	0.284	my5651_rel_o2nofp.cz11a_c32r128
0.000	0.000	0.000	37.832	60.837	1.331	0.000	0.000	0.000	0.000	0.149	my5744_rel_o2nofp.cz11a_c32r128
0.000	0.000	0.000	42.778	57.221	0.001	0.000	0.000	0.000	0.000	0.067	my8039_rel_o2nofp.cz11a_c32r128
0.000	0.000	0.000	63.615	35.526	0.282	0.306	0.271	0.000	0.000	3.653	pg158_o2nofp.cx9a2a_c32r128
0.000	0.000	0.000	61.718	37.722	0.167	0.219	0.174	0.000	0.000	2.600	pg164_o2nofp.cx9a2a_c32r128
0.000	0.000	0.000	64.808	34.531	0.214	0.163	0.272	0.013	0.000	4.061	pg17beta3_o2nofp.cx9a2a_c32r128
0.000	0.000	0.000	65.578	33.178	0.379	0.418	0.415	0.032	0.000	4.781	pg17rc1_o2nofp.cx9a2a_c32r128
Delete response time histogram
256us	1ms	4ms	16ms	64ms	256ms	1s	4s	16s	gt	max	tag
0.000	0.000	2.576	73.019	23.754	0.650	0.000	0.000	0.000	0.000	0.157	my5651_rel_o2nofp.cz11a_c32r128
0.000	0.000	36.368	63.131	0.501	0.000	0.000	0.000	0.000	0.000	0.034	my5744_rel_o2nofp.cz11a_c32r128
0.000	0.000	85.842	14.140	0.018	0.000	0.000	0.000	0.000	0.000	0.029	my8039_rel_o2nofp.cz11a_c32r128
0.000	0.000	92.969	3.343	3.635	0.007	0.028	0.018	0.000	0.000	2.653	pg158_o2nofp.cx9a2a_c32r128
0.000	0.000	94.350	2.307	3.233	0.000	0.106	0.004	0.000	0.000	1.948	pg164_o2nofp.cx9a2a_c32r128
0.000	0.000	93.264	3.033	3.636	0.006	0.036	0.025	0.000	0.000	1.840	pg17beta3_o2nofp.cx9a2a_c32r128
0.000	0.000	93.369	3.221	3.263	0.040	0.057	0.047	0.003	0.000	4.676	pg17rc1_o2nofp.cx9a2a_c32r128
qr500.L3
- qr500.L3: range queries with 500 insert/s per client
- Legend for results is here.
- Each entry lists the percentage of responses that fit in that bucket (slower than max time for previous bucket, faster than min time for next bucket).
Query response time histogram
256us	1ms	4ms	16ms	64ms	256ms	1s	4s	16s	gt	max	tag
95.302	3.741	0.857	0.099	0.001	nonzero	0.000	0.000	0.000	0.000	0.068	my5651_rel_o2nofp.cz11a_c32r128
97.799	1.914	0.277	0.009	0.001	0.000	0.000	0.000	0.000	0.000	0.047	my5744_rel_o2nofp.cz11a_c32r128
99.270	0.702	0.025	0.002	nonzero	0.000	0.000	0.000	0.000	0.000	0.029	my8039_rel_o2nofp.cz11a_c32r128
99.954	0.036	0.007	0.002	0.001	nonzero	nonzero	nonzero	nonzero	0.000	4.152	pg158_o2nofp.cx9a2a_c32r128
99.965	0.028	0.005	0.001	0.001	nonzero	nonzero	nonzero	0.000	0.000	1.517	pg164_o2nofp.cx9a2a_c32r128
99.963	0.029	0.006	0.002	0.001	nonzero	nonzero	nonzero	0.000	0.000	2.765	pg17beta3_o2nofp.cx9a2a_c32r128
99.964	0.028	0.006	0.001	0.001	nonzero	nonzero	nonzero	0.000	0.000	1.642	pg17rc1_o2nofp.cx9a2a_c32r128
Insert response time histogram
256us	1ms	4ms	16ms	64ms	256ms	1s	4s	16s	gt	max	tag
0.000	0.000	0.000	0.519	95.517	3.964	0.000	0.000	0.000	0.000	0.236	my5651_rel_o2nofp.cz11a_c32r128
0.000	0.000	0.000	1.921	89.637	8.442	0.000	0.000	0.000	0.000	0.181	my5744_rel_o2nofp.cz11a_c32r128
0.000	0.000	0.000	20.188	79.411	0.402	0.000	0.000	0.000	0.000	0.103	my8039_rel_o2nofp.cz11a_c32r128
0.000	0.000	0.000	73.568	25.291	0.520	0.450	0.166	0.005	0.000	4.628	pg158_o2nofp.cx9a2a_c32r128
0.000	0.000	0.000	86.592	12.662	0.344	0.331	0.072	0.000	0.000	2.536	pg164_o2nofp.cx9a2a_c32r128
0.000	0.000	0.000	84.968	14.101	0.427	0.383	0.118	0.004	0.000	4.394	pg17beta3_o2nofp.cx9a2a_c32r128
0.000	0.000	0.000	83.947	15.207	0.352	0.363	0.131	0.000	0.000	3.832	pg17rc1_o2nofp.cx9a2a_c32r128
Delete response time histogram
256us	1ms	4ms	16ms	64ms	256ms	1s	4s	16s	gt	max	tag
0.000	nonzero	1.527	63.252	35.217	0.004	0.000	0.000	0.000	0.000	0.088	my5651_rel_o2nofp.cz11a_c32r128
0.000	0.000	12.344	79.076	8.579	nonzero	0.000	0.000	0.000	0.000	0.066	my5744_rel_o2nofp.cz11a_c32r128
0.000	0.000	53.027	46.692	0.281	0.000	0.000	0.000	0.000	0.000	0.040	my8039_rel_o2nofp.cz11a_c32r128
0.000	0.000	29.986	68.006	1.929	0.026	0.031	0.021	0.001	0.000	4.199	pg158_o2nofp.cx9a2a_c32r128
0.000	0.000	34.301	64.564	1.117	0.005	0.009	0.004	0.000	0.000	1.875	pg164_o2nofp.cx9a2a_c32r128
0.000	0.000	34.182	64.334	1.465	0.008	0.009	0.002	nonzero	0.000	4.341	pg17beta3_o2nofp.cx9a2a_c32r128
0.000	0.000	39.722	58.993	1.264	0.006	0.012	0.003	0.000	0.000	3.566	pg17rc1_o2nofp.cx9a2a_c32r128
qp500.L4
- qp500.L4: point queries with 500 insert/s per client
- Legend for results is here.
- Each entry lists the percentage of responses that fit in that bucket (slower than max time for previous bucket, faster than min time for next bucket).
Query response time histogram
256us	1ms	4ms	16ms	64ms	256ms	1s	4s	16s	gt	max	tag
0.000	0.584	56.586	41.815	1.016	0.000	0.000	0.000	0.000	0.000	0.054	my5651_rel_o2nofp.cz11a_c32r128
0.000	0.419	90.611	8.942	0.029	0.000	0.000	0.000	0.000	0.000	0.036	my5744_rel_o2nofp.cz11a_c32r128
nonzero	7.374	83.661	8.952	0.013	0.000	0.000	0.000	0.000	0.000	0.035	my8039_rel_o2nofp.cz11a_c32r128
0.000	0.256	93.460	1.974	4.284	0.014	0.011	0.001	0.000	0.000	2.426	pg158_o2nofp.cx9a2a_c32r128
0.000	0.300	94.611	0.982	4.085	0.010	0.011	nonzero	0.000	0.000	1.429	pg164_o2nofp.cx9a2a_c32r128
0.000	0.284	94.356	1.134	4.207	0.011	0.007	0.001	0.000	0.000	2.506	pg17beta3_o2nofp.cx9a2a_c32r128
0.000	0.302	94.383	1.143	4.144	0.016	0.011	0.002	0.000	0.000	3.977	pg17rc1_o2nofp.cx9a2a_c32r128
Insert response time histogram
256us	1ms	4ms	16ms	64ms	256ms	1s	4s	16s	gt	max	tag
0.000	0.000	0.000	0.356	72.075	27.566	0.003	0.000	0.000	0.000	0.309	my5651_rel_o2nofp.cz11a_c32r128
0.000	0.000	0.000	2.338	95.620	2.042	0.000	0.000	0.000	0.000	0.238	my5744_rel_o2nofp.cz11a_c32r128
0.000	0.000	0.000	11.010	88.875	0.116	0.000	0.000	0.000	0.000	0.135	my8039_rel_o2nofp.cz11a_c32r128
0.000	0.000	0.000	49.773	49.423	0.466	0.296	0.042	0.000	0.000	2.198	pg158_o2nofp.cx9a2a_c32r128
0.000	0.000	0.000	48.949	50.421	0.305	0.308	0.017	0.000	0.000	1.562	pg164_o2nofp.cx9a2a_c32r128
0.000	0.000	0.000	47.623	51.841	0.289	0.227	0.020	0.000	0.000	2.215	pg17beta3_o2nofp.cx9a2a_c32r128
0.000	0.000	0.000	44.616	54.555	0.454	0.328	0.046	0.001	0.000	4.110	pg17rc1_o2nofp.cx9a2a_c32r128
Delete response time histogram
256us	1ms	4ms	16ms	64ms	256ms	1s	4s	16s	gt	max	tag
0.000	0.000	0.206	16.374	77.017	6.404	0.000	0.000	0.000	0.000	0.243	my5651_rel_o2nofp.cz11a_c32r128
0.000	0.000	5.112	92.263	2.625	nonzero	0.000	0.000	0.000	0.000	0.080	my5744_rel_o2nofp.cz11a_c32r128
0.000	0.000	30.789	68.220	0.990	0.000	0.000	0.000	0.000	0.000	0.058	my8039_rel_o2nofp.cz11a_c32r128
0.000	0.000	0.000	77.171	22.478	0.152	0.179	0.019	0.000	0.000	2.059	pg158_o2nofp.cx9a2a_c32r128
0.000	0.000	0.000	71.763	27.855	0.194	0.183	0.004	0.000	0.000	1.549	pg164_o2nofp.cx9a2a_c32r128
0.000	0.000	0.000	72.867	26.898	0.080	0.150	0.005	0.000	0.000	1.287	pg17beta3_o2nofp.cx9a2a_c32r128
0.000	0.000	0.000	75.161	24.473	0.150	0.207	0.009	0.000	0.000	3.613	pg17rc1_o2nofp.cx9a2a_c32r128
qr1000.L5
- qr1000.L5: range queries with 1000 insert/s per client
- Legend for results is here.
- Each entry lists the percentage of responses that fit in that bucket (slower than max time for previous bucket, faster than min time for next bucket).
Query response time histogram
256us	1ms	4ms	16ms	64ms	256ms	1s	4s	16s	gt	max	tag
94.790	3.939	1.227	0.044	0.001	nonzero	nonzero	0.000	0.000	0.000	0.388	my5651_rel_o2nofp.cz11a_c32r128
96.794	2.572	0.608	0.026	nonzero	0.000	0.000	0.000	0.000	0.000	0.047	my5744_rel_o2nofp.cz11a_c32r128
95.959	3.146	0.883	0.013	nonzero	0.000	0.000	0.000	0.000	0.000	0.041	my8039_rel_o2nofp.cz11a_c32r128
99.557	0.341	0.047	0.038	0.016	nonzero	nonzero	nonzero	0.000	0.000	2.567	pg158_o2nofp.cx9a2a_c32r128
99.607	0.299	0.037	0.038	0.019	nonzero	nonzero	nonzero	0.000	0.000	2.733	pg164_o2nofp.cx9a2a_c32r128
99.601	0.305	0.038	0.038	0.018	nonzero	nonzero	nonzero	0.000	0.000	3.785	pg17beta3_o2nofp.cx9a2a_c32r128
99.592	0.312	0.038	0.039	0.019	nonzero	nonzero	nonzero	nonzero	0.000	4.278	pg17rc1_o2nofp.cx9a2a_c32r128
Insert response time histogram
256us	1ms	4ms	16ms	64ms	256ms	1s	4s	16s	gt	max	tag
0.000	0.000	nonzero	24.653	57.586	0.630	17.131	0.000	0.000	0.000	0.318	my5651_rel_o2nofp.cz11a_c32r128
0.000	0.000	nonzero	50.616	49.172	0.212	0.000	0.000	0.000	0.000	0.137	my5744_rel_o2nofp.cz11a_c32r128
0.000	0.000	0.001	35.885	64.083	0.032	0.000	0.000	0.000	0.000	0.110	my8039_rel_o2nofp.cz11a_c32r128
0.000	0.000	0.000	42.825	47.852	9.137	0.092	0.093	0.000	0.000	2.682	pg158_o2nofp.cx9a2a_c32r128
0.000	0.000	0.000	42.614	45.912	11.268	0.092	0.112	0.002	0.000	4.800	pg164_o2nofp.cx9a2a_c32r128
0.000	0.000	0.000	41.988	47.333	10.492	0.075	0.110	0.002	0.000	4.371	pg17beta3_o2nofp.cx9a2a_c32r128
0.000	0.000	0.000	41.656	47.175	11.004	0.068	0.089	0.008	0.000	5.394	pg17rc1_o2nofp.cx9a2a_c32r128
Delete response time histogram
256us	1ms	4ms	16ms	64ms	256ms	1s	4s	16s	gt	max	tag
0.000	0.000	24.955	51.414	6.239	0.077	17.314	0.000	0.000	0.000	0.308	my5651_rel_o2nofp.cz11a_c32r128
0.000	0.000	78.267	21.554	0.180	0.000	0.000	0.000	0.000	0.000	0.058	my5744_rel_o2nofp.cz11a_c32r128
0.000	0.000	28.722	68.530	2.748	0.000	0.000	0.000	0.000	0.000	0.048	my8039_rel_o2nofp.cz11a_c32r128
0.000	0.000	0.000	42.260	56.035	1.614	0.034	0.057	0.000	0.000	2.617	pg158_o2nofp.cx9a2a_c32r128
0.000	0.000	0.000	39.885	57.554	2.468	0.044	0.048	0.000	0.000	3.443	pg164_o2nofp.cx9a2a_c32r128
0.000	0.000	0.000	37.443	60.042	2.436	0.036	0.044	0.000	0.000	3.954	pg17beta3_o2nofp.cx9a2a_c32r128
0.000	0.000	0.000	36.808	60.427	2.699	0.026	0.040	nonzero	0.000	4.269	pg17rc1_o2nofp.cx9a2a_c32r128
qp1000.L6
- qp1000.L6: point queries with 1000 insert/s per client
- Legend for results is here.
- Each entry lists the percentage of responses that fit in that bucket (slower than max time for previous bucket, faster than min time for next bucket).
Query response time histogram
256us	1ms	4ms	16ms	64ms	256ms	1s	4s	16s	gt	max	tag
nonzero	7.699	67.594	23.687	1.020	nonzero	0.000	0.000	0.000	0.000	0.084	my5651_rel_o2nofp.cz11a_c32r128
nonzero	2.294	96.357	1.329	0.021	0.000	0.000	0.000	0.000	0.000	0.050	my5744_rel_o2nofp.cz11a_c32r128
nonzero	4.874	85.562	9.546	0.017	0.000	0.000	0.000	0.000	0.000	0.052	my8039_rel_o2nofp.cz11a_c32r128
0.000	0.003	74.197	18.470	7.235	0.058	0.029	0.007	0.001	0.000	4.481	pg158_o2nofp.cx9a2a_c32r128
0.000	0.003	78.152	14.908	6.868	0.040	0.025	0.004	0.000	0.000	2.820	pg164_o2nofp.cx9a2a_c32r128
0.000	0.004	77.511	15.386	7.021	0.049	0.024	0.005	nonzero	0.000	5.414	pg17beta3_o2nofp.cx9a2a_c32r128
0.000	0.004	76.952	15.911	7.056	0.048	0.024	0.005	0.001	0.000	6.066	pg17rc1_o2nofp.cx9a2a_c32r128
Insert response time histogram
256us	1ms	4ms	16ms	64ms	256ms	1s	4s	16s	gt	max	tag
0.000	0.000	0.000	0.082	9.848	6.371	83.699	0.000	0.000	0.000	0.708	my5651_rel_o2nofp.cz11a_c32r128
0.000	0.000	0.000	42.274	38.294	0.777	18.654	0.000	0.000	0.000	0.343	my5744_rel_o2nofp.cz11a_c32r128
0.000	0.000	0.000	7.346	31.335	61.320	0.000	0.000	0.000	0.000	0.217	my8039_rel_o2nofp.cz11a_c32r128
0.000	0.000	0.000	11.433	82.338	5.912	0.241	0.070	0.006	0.000	4.510	pg158_o2nofp.cx9a2a_c32r128
0.000	0.000	0.000	14.736	81.071	3.919	0.237	0.036	0.000	0.000	2.874	pg164_o2nofp.cx9a2a_c32r128
0.000	0.000	0.000	14.973	79.118	5.653	0.199	0.054	0.003	0.000	5.445	pg17beta3_o2nofp.cx9a2a_c32r128
0.000	0.000	0.000	14.126	79.847	5.755	0.210	0.057	0.006	0.000	6.937	pg17rc1_o2nofp.cx9a2a_c32r128
Delete response time histogram
256us	1ms	4ms	16ms	64ms	256ms	1s	4s	16s	gt	max	tag
0.000	0.000	0.589	9.011	6.464	0.307	83.627	0.000	0.000	0.000	0.688	my5651_rel_o2nofp.cz11a_c32r128
0.000	0.000	25.136	54.198	1.712	0.062	18.892	0.000	0.000	0.000	0.335	my5744_rel_o2nofp.cz11a_c32r128
0.000	0.000	2.691	20.284	22.352	54.673	0.000	0.000	0.000	0.000	0.207	my8039_rel_o2nofp.cz11a_c32r128
0.000	0.000	0.000	0.027	99.031	0.709	0.196	0.035	0.001	0.000	4.291	pg158_o2nofp.cx9a2a_c32r128
0.000	0.000	0.000	0.020	99.019	0.744	0.193	0.024	0.000	0.000	2.747	pg164_o2nofp.cx9a2a_c32r128
0.000	0.000	0.000	0.008	98.765	1.033	0.158	0.033	0.003	0.000	5.403	pg17beta3_o2nofp.cx9a2a_c32r128
0.000	0.000	0.000	0.012	98.797	1.001	0.163	0.028	nonzero	0.000	5.230	pg17rc1_o2nofp.cx9a2a_c32r128