Introduction
This is a report for the insert benchmark with 4000M docs and 20 client(s). It is generated by scripts (bash, awk, sed) and Tufte might not be impressed. An overview of the insert benchmark is here and a short update is here. Below, by DBMS, I mean DBMS+version.config. An example is my8020.c10b40 where my means MySQL, 8020 is version 8.0.20 and c10b40 is the name for the configuration file.
The test server is an ax162-s from Hetzner (see here) with 48 cores, AMD SMT disabled, 128G RAM and ext4 using 2 NVMe devices with SW RAID 1. The benchmark was run with 20 clients and there were 1 or 3 connections per client (1 for queries or inserts without rate limits, 1+1 for rate limited inserts+deletes). It uses 8 tables with a table per client. It loads 200M rows per table without secondary indexes, creates 3 secondary indexes per table, then inserts 4m+1m rows per table with a delete per insert to avoid growing the table. It then does 6 read+write tests for 1800s each that do queries as fast as possible with 100,100,500,500,1000,1000 inserts/s and the same for deletes/s per client concurrent with the queries. The database is larger than memory. Clients and the DBMS share one server.
The tested DBMS are:
- my5651_rel_o2nofp.cz11a_c32r128 - MySQL 5.6.51 compilred with CMAKE_BUILD_TYPE=Release, -O2 and frame pointers using the z11a_c32r128 config
- my5744_rel_o2nofp.cz11a_c32r128 - MySQL 5.7.44 compilred with CMAKE_BUILD_TYPE=Release, -O2 and frame pointers using the z11a_c32r128 config
- my8039_rel_o2nofp.cz11a_c32r128 - MySQL 8.0.39 compilred with CMAKE_BUILD_TYPE=Release, -O2 and frame pointers using the z11a_c32r128 config
Contents
- Summary
- l.i0: load without secondary indexes
- l.x: create secondary indexes
- l.i1: continue load after secondary indexes created with 50 inserts per transaction
- l.i2: continue load after secondary indexes created with 5 inserts per transaction
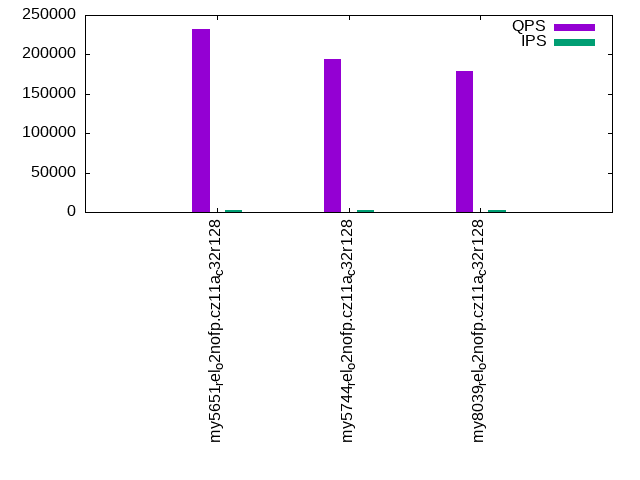
- qr100.L1: range queries with 100 insert/s per client
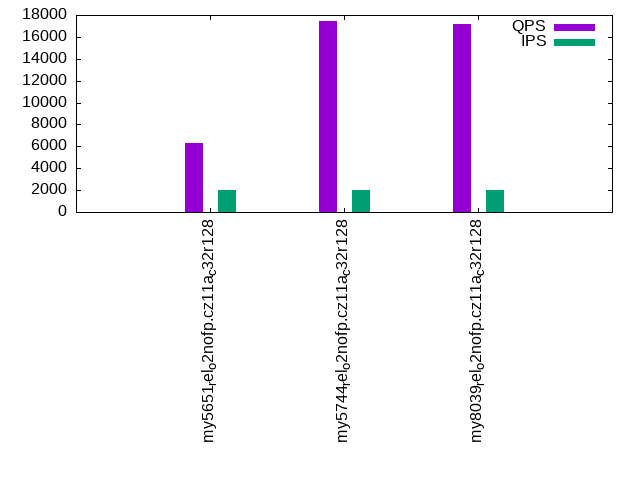
- qp100.L2: point queries with 100 insert/s per client
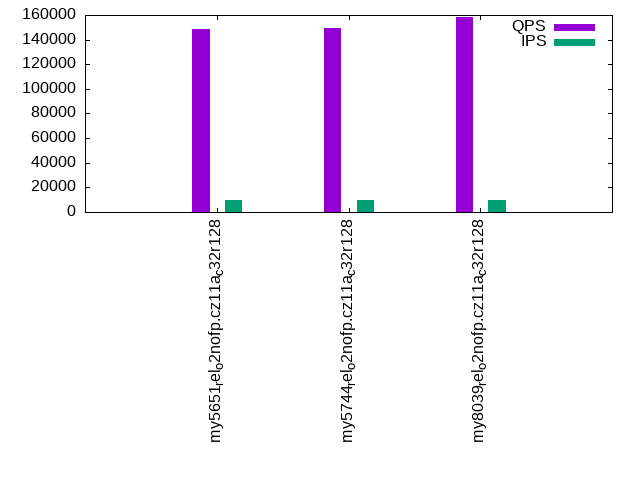
- qr500.L3: range queries with 500 insert/s per client
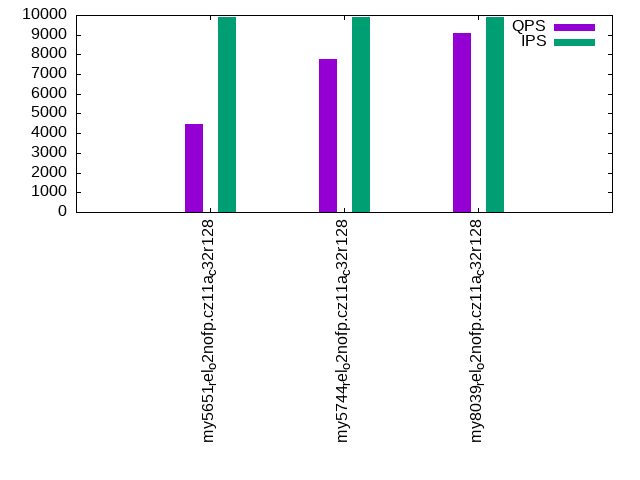
- qp500.L4: point queries with 500 insert/s per client
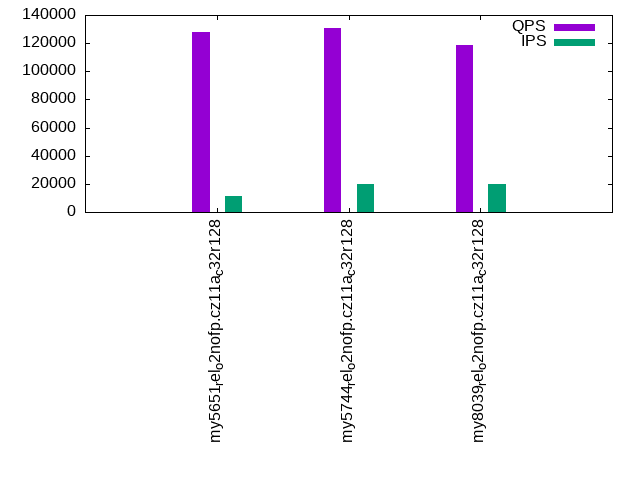
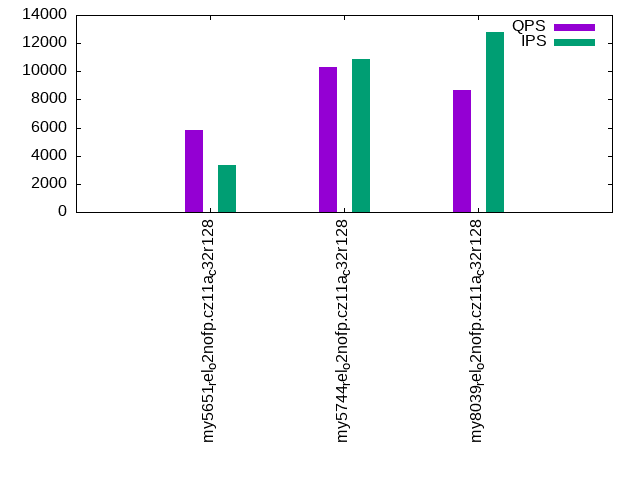
- qr1000.L5: range queries with 1000 insert/s per client
- qp1000.L6: point queries with 1000 insert/s per client
Summary
The numbers are inserts/s for l.i0, l.i1 and l.i2, indexed docs (or rows) /s for l.x and queries/s for qr100, qp100 thru qr1000, qp1000" The values are the average rate over the entire test for inserts (IPS) and queries (QPS). The range of values for IPS and QPS is split into 3 parts: bottom 25%, middle 50%, top 25%. Values in the bottom 25% have a red background, values in the top 25% have a green background and values in the middle have no color. A gray background is used for values that can be ignored because the DBMS did not sustain the target insert rate. Red backgrounds are not used when the minimum value is within 80% of the max value.
| dbms | l.i0 | l.x | l.i1 | l.i2 | qr100 | qp100 | qr500 | qp500 | qr1000 | qp1000 |
|---|---|---|---|---|---|---|---|---|---|---|
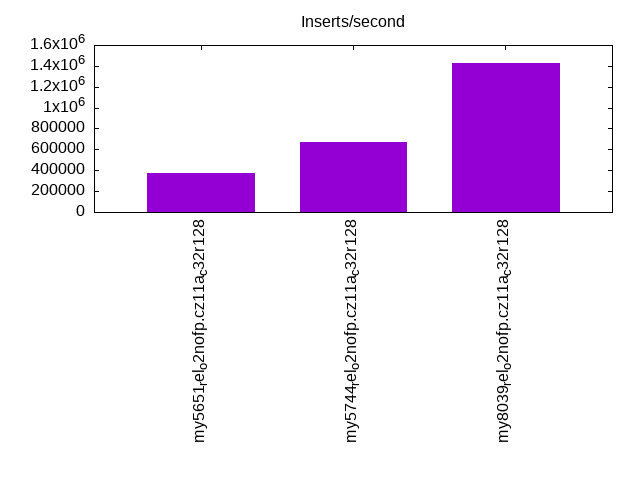
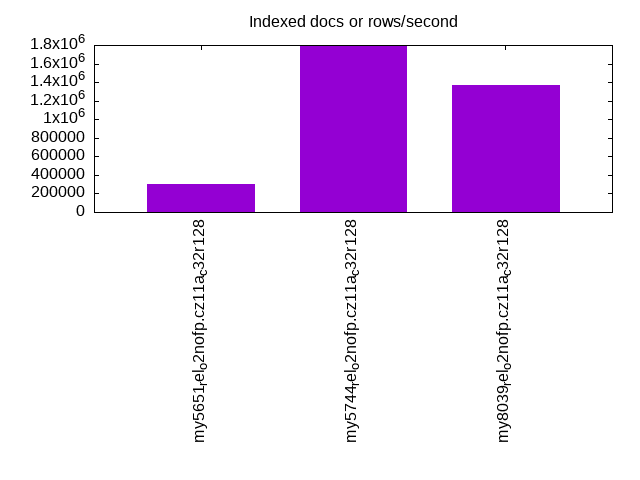
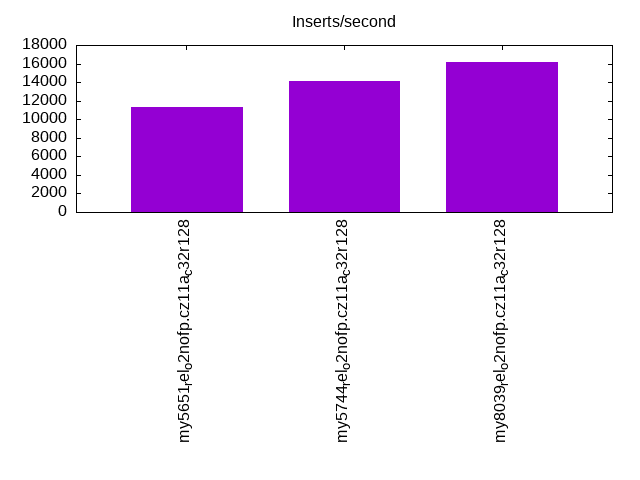
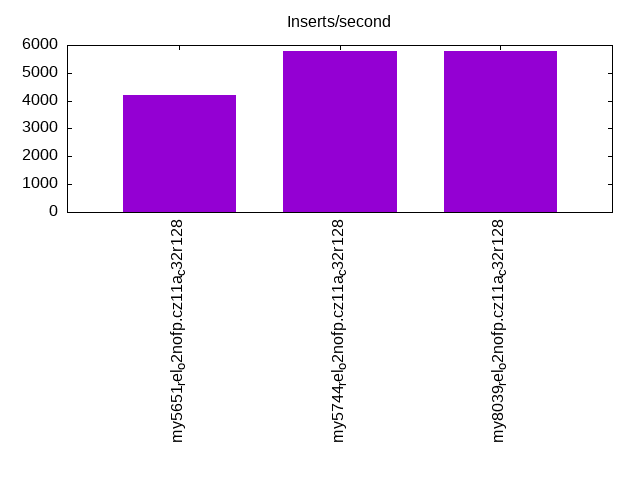
| my5651_rel_o2nofp.cz11a_c32r128 | 371264 | 298352 | 11325 | 4215 | 232061 | 6318 | 148810 | 4456 | 128256 | 5839 |
| my5744_rel_o2nofp.cz11a_c32r128 | 672043 | 1793722 | 14164 | 5800 | 194689 | 17422 | 149680 | 7750 | 130415 | 10282 |
| my8039_rel_o2nofp.cz11a_c32r128 | 1429082 | 1367521 | 16129 | 5790 | 179440 | 17190 | 158454 | 9095 | 118613 | 8682 |
This table has relative throughput, throughput for the DBMS relative to the DBMS in the first line, using the absolute throughput from the previous table. Values less than 0.95 have a yellow background. Values greater than 1.05 have a blue background.
| dbms | l.i0 | l.x | l.i1 | l.i2 | qr100 | qp100 | qr500 | qp500 | qr1000 | qp1000 |
|---|---|---|---|---|---|---|---|---|---|---|
| my5651_rel_o2nofp.cz11a_c32r128 | 1.00 | 1.00 | 1.00 | 1.00 | 1.00 | 1.00 | 1.00 | 1.00 | 1.00 | 1.00 |
| my5744_rel_o2nofp.cz11a_c32r128 | 1.81 | 6.01 | 1.25 | 1.38 | 0.84 | 2.76 | 1.01 | 1.74 | 1.02 | 1.76 |
| my8039_rel_o2nofp.cz11a_c32r128 | 3.85 | 4.58 | 1.42 | 1.37 | 0.77 | 2.72 | 1.06 | 2.04 | 0.92 | 1.49 |
This lists the average rate of inserts/s for the tests that do inserts concurrent with queries. For such tests the query rate is listed in the table above. The read+write tests are setup so that the insert rate should match the target rate every second. Cells that are not at least 95% of the target have a red background to indicate a failure to satisfy the target.
| dbms | qr100.L1 | qp100.L2 | qr500.L3 | qp500.L4 | qr1000.L5 | qp1000.L6 |
|---|---|---|---|---|---|---|
| my5651_rel_o2nofp.cz11a_c32r128 | 1977 | 1977 | 9885 | 9885 | 11125 | 3306 |
| my5744_rel_o2nofp.cz11a_c32r128 | 1977 | 1977 | 9885 | 9885 | 19748 | 10870 |
| my8039_rel_o2nofp.cz11a_c32r128 | 1977 | 1977 | 9885 | 9885 | 19769 | 12798 |
| target | 2000 | 2000 | 10000 | 10000 | 20000 | 20000 |
l.i0
l.i0: load without secondary indexes. Graphs for performance per 1-second interval are here.
Average throughput:
Insert response time histogram: each cell has the percentage of responses that take <= the time in the header and max is the max response time in seconds. For the max column values in the top 25% of the range have a red background and in the bottom 25% of the range have a green background. The red background is not used when the min value is within 80% of the max value.
| dbms | 256us | 1ms | 4ms | 16ms | 64ms | 256ms | 1s | 4s | 16s | gt | max |
|---|---|---|---|---|---|---|---|---|---|---|---|
| my5651_rel_o2nofp.cz11a_c32r128 | 0.164 | 10.763 | 88.563 | 0.473 | 0.037 | 0.173 | |||||
| my5744_rel_o2nofp.cz11a_c32r128 | 0.153 | 99.593 | 0.206 | 0.011 | 0.037 | 0.177 | |||||
| my8039_rel_o2nofp.cz11a_c32r128 | 0.099 | 99.788 | 0.060 | 0.014 | 0.039 | 0.245 |
Performance metrics for the DBMS listed above. Some are normalized by throughput, others are not. Legend for results is here.
ips	qps	rps	rmbps	wps	wmbps	rpq	rkbpq	wpi	wkbpi	csps	cpups	cspq	cpupq	dbgb1	dbgb2	rss	maxop	p50	p99	tag
371264	0	2185	8.5	2467.7	132.8	0.006	0.024	0.007	0.366	139954	37.7	0.377	49	263.2	363.7	107.1	0.173	17586	15184	my5651_rel_o2nofp.cz11a_c32r128
672043	0	2	0.0	4526.7	240.6	0.000	0.000	0.007	0.367	82544	46.0	0.123	33	263.2	363.7	108.1	0.177	34063	29169	my5744_rel_o2nofp.cz11a_c32r128
1429082	0	5	0.1	9725.7	531.2	0.000	0.000	0.007	0.381	297221	54.8	0.208	18	262.3	362.8	108.4	0.245	73820	61733	my8039_rel_o2nofp.cz11a_c32r128
l.x
l.x: create secondary indexes.
Average throughput:
Performance metrics for the DBMS listed above. Some are normalized by throughput, others are not. Legend for results is here.
ips	qps	rps	rmbps	wps	wmbps	rpq	rkbpq	wpi	wkbpi	csps	cpups	cspq	cpupq	dbgb1	dbgb2	rss	maxop	p50	p99	tag
298352	0	3998	264.7	16624.5	606.4	0.013	0.909	0.056	2.081	119028	35.8	0.399	58	557.3	657.8	107.8	0.003	NA	NA	my5651_rel_o2nofp.cz11a_c32r128
1793722	0	17853	1554.2	29637.8	1923.1	0.010	0.887	0.017	1.098	206052	25.9	0.115	7	605.8	706.3	105.4	0.002	NA	NA	my5744_rel_o2nofp.cz11a_c32r128
1367521	0	34508	1991.3	40701.9	1795.0	0.025	1.491	0.030	1.344	192617	57.8	0.141	20	603.6	704.2	104.9	0.007	NA	NA	my8039_rel_o2nofp.cz11a_c32r128
l.i1
l.i1: continue load after secondary indexes created with 50 inserts per transaction. Graphs for performance per 1-second interval are here.
Average throughput:
Insert response time histogram: each cell has the percentage of responses that take <= the time in the header and max is the max response time in seconds. For the max column values in the top 25% of the range have a red background and in the bottom 25% of the range have a green background. The red background is not used when the min value is within 80% of the max value.
| dbms | 256us | 1ms | 4ms | 16ms | 64ms | 256ms | 1s | 4s | 16s | gt | max |
|---|---|---|---|---|---|---|---|---|---|---|---|
| my5651_rel_o2nofp.cz11a_c32r128 | 0.001 | 4.124 | 64.166 | 11.736 | 19.972 | nonzero | 1.626 | ||||
| my5744_rel_o2nofp.cz11a_c32r128 | 0.023 | 30.572 | 42.689 | 11.900 | 14.815 | 0.373 | |||||
| my8039_rel_o2nofp.cz11a_c32r128 | 0.124 | 14.794 | 38.441 | 46.315 | 0.325 | 0.475 |
Delete response time histogram: each cell has the percentage of responses that take <= the time in the header and max is the max response time in seconds. For the max column values in the top 25% of the range have a red background and in the bottom 25% of the range have a green background. The red background is not used when the min value is within 80% of the max value.
| dbms | 256us | 1ms | 4ms | 16ms | 64ms | 256ms | 1s | 4s | 16s | gt | max |
|---|---|---|---|---|---|---|---|---|---|---|---|
| my5651_rel_o2nofp.cz11a_c32r128 | 1.760 | 35.847 | 42.238 | 0.185 | 19.970 | nonzero | 1.140 | ||||
| my5744_rel_o2nofp.cz11a_c32r128 | 17.859 | 64.695 | 2.547 | 0.097 | 14.802 | 0.366 | |||||
| my8039_rel_o2nofp.cz11a_c32r128 | 18.416 | 20.612 | 29.232 | 31.741 | 0.199 |
Performance metrics for the DBMS listed above. Some are normalized by throughput, others are not. Legend for results is here.
ips	qps	rps	rmbps	wps	wmbps	rpq	rkbpq	wpi	wkbpi	csps	cpups	cspq	cpupq	dbgb1	dbgb2	rss	maxop	p50	p99	tag
11325	0	28421	439.6	55822.6	1148.5	2.510	39.751	4.929	103.847	264139	16.0	23.324	678	819.8	933.2	105.4	1.626	200	150	my5651_rel_o2nofp.cz11a_c32r128
14164	0	34684	541.9	59410.6	1386.1	2.449	39.179	4.194	100.204	321279	20.9	22.682	708	820.2	934.0	107.8	0.373	200	150	my5744_rel_o2nofp.cz11a_c32r128
16129	0	36470	569.9	53356.1	1517.7	2.261	36.179	3.308	96.355	334131	20.7	20.716	616	819.2	935.6	107.5	0.475	699	300	my8039_rel_o2nofp.cz11a_c32r128
l.i2
l.i2: continue load after secondary indexes created with 5 inserts per transaction. Graphs for performance per 1-second interval are here.
Average throughput:
Insert response time histogram: each cell has the percentage of responses that take <= the time in the header and max is the max response time in seconds. For the max column values in the top 25% of the range have a red background and in the bottom 25% of the range have a green background. The red background is not used when the min value is within 80% of the max value.
| dbms | 256us | 1ms | 4ms | 16ms | 64ms | 256ms | 1s | 4s | 16s | gt | max |
|---|---|---|---|---|---|---|---|---|---|---|---|
| my5651_rel_o2nofp.cz11a_c32r128 | 0.001 | 0.092 | 8.215 | 45.109 | 37.733 | 8.850 | 0.122 | ||||
| my5744_rel_o2nofp.cz11a_c32r128 | nonzero | 4.866 | 37.914 | 18.258 | 38.855 | 0.107 | 0.091 | ||||
| my8039_rel_o2nofp.cz11a_c32r128 | 0.403 | 72.701 | 26.833 | 0.063 | 0.145 |
Delete response time histogram: each cell has the percentage of responses that take <= the time in the header and max is the max response time in seconds. For the max column values in the top 25% of the range have a red background and in the bottom 25% of the range have a green background. The red background is not used when the min value is within 80% of the max value.
| dbms | 256us | 1ms | 4ms | 16ms | 64ms | 256ms | 1s | 4s | 16s | gt | max |
|---|---|---|---|---|---|---|---|---|---|---|---|
| my5651_rel_o2nofp.cz11a_c32r128 | 0.001 | 0.616 | 26.399 | 26.535 | 38.200 | 8.249 | 0.112 | ||||
| my5744_rel_o2nofp.cz11a_c32r128 | 0.002 | 52.887 | 8.248 | 0.139 | 38.711 | 0.013 | 0.089 | ||||
| my8039_rel_o2nofp.cz11a_c32r128 | 0.662 | 73.380 | 25.937 | 0.021 | 0.124 |
Performance metrics for the DBMS listed above. Some are normalized by throughput, others are not. Legend for results is here.
ips	qps	rps	rmbps	wps	wmbps	rpq	rkbpq	wpi	wkbpi	csps	cpups	cspq	cpupq	dbgb1	dbgb2	rss	maxop	p50	p99	tag
4215	0	28835	438.8	52533.2	1038.2	6.841	106.607	12.464	252.227	256167	13.6	60.777	1549	819.8	933.2	105.0	0.122	115	65	my5651_rel_o2nofp.cz11a_c32r128
5800	0	36879	576.2	58906.5	1345.6	6.358	101.727	10.156	237.554	297041	16.6	51.210	1374	820.2	934.0	107.6	0.091	130	80	my5744_rel_o2nofp.cz11a_c32r128
5790	0	39308	614.2	50752.8	1457.6	6.789	108.619	8.765	257.774	341275	17.5	58.939	1451	819.2	932.8	105.9	0.145	145	85	my8039_rel_o2nofp.cz11a_c32r128
qr100.L1
qr100.L1: range queries with 100 insert/s per client. Graphs for performance per 1-second interval are here.
Average throughput:
Query response time histogram: each cell has the percentage of responses that take <= the time in the header and max is the max response time in seconds. For max values in the top 25% of the range have a red background and in the bottom 25% of the range have a green background. The red background is not used when the min value is within 80% of the max value.
| dbms | 256us | 1ms | 4ms | 16ms | 64ms | 256ms | 1s | 4s | 16s | gt | max |
|---|---|---|---|---|---|---|---|---|---|---|---|
| my5651_rel_o2nofp.cz11a_c32r128 | 99.548 | 0.396 | 0.045 | 0.010 | nonzero | 0.022 | |||||
| my5744_rel_o2nofp.cz11a_c32r128 | 99.830 | 0.139 | 0.030 | nonzero | nonzero | 0.027 | |||||
| my8039_rel_o2nofp.cz11a_c32r128 | 99.882 | 0.114 | 0.004 | nonzero | 0.014 |
Insert response time histogram: each cell has the percentage of responses that take <= the time in the header and max is the max response time in seconds. For max values in the top 25% of the range have a red background and in the bottom 25% of the range have a green background. The red background is not used when the min value is within 80% of the max value.
| dbms | 256us | 1ms | 4ms | 16ms | 64ms | 256ms | 1s | 4s | 16s | gt | max |
|---|---|---|---|---|---|---|---|---|---|---|---|
| my5651_rel_o2nofp.cz11a_c32r128 | 20.406 | 79.589 | 0.006 | 0.080 | |||||||
| my5744_rel_o2nofp.cz11a_c32r128 | 88.731 | 11.269 | 0.054 | ||||||||
| my8039_rel_o2nofp.cz11a_c32r128 | 93.482 | 6.518 | 0.031 |
Delete response time histogram: each cell has the percentage of responses that take <= the time in the header and max is the max response time in seconds. For max values in the top 25% of the range have a red background and in the bottom 25% of the range have a green background. The red background is not used when the min value is within 80% of the max value.
| dbms | 256us | 1ms | 4ms | 16ms | 64ms | 256ms | 1s | 4s | 16s | gt | max |
|---|---|---|---|---|---|---|---|---|---|---|---|
| my5651_rel_o2nofp.cz11a_c32r128 | 9.621 | 78.699 | 11.681 | 0.047 | |||||||
| my5744_rel_o2nofp.cz11a_c32r128 | 85.693 | 14.154 | 0.153 | 0.038 | |||||||
| my8039_rel_o2nofp.cz11a_c32r128 | 87.174 | 12.821 | 0.006 | 0.021 |
Performance metrics for the DBMS listed above. Some are normalized by throughput, others are not. Legend for results is here.
ips	qps	rps	rmbps	wps	wmbps	rpq	rkbpq	wpi	wkbpi	csps	cpups	cspq	cpupq	dbgb1	dbgb2	rss	maxop	p50	p99	tag
1977	232061	9338	145.1	8562.3	241.2	0.040	0.640	4.331	124.944	940200	43.4	4.052	90	819.8	933.2	105.0	0.022	11891	10213	my5651_rel_o2nofp.cz11a_c32r128
1977	194689	9264	144.7	9189.5	258.6	0.048	0.761	4.648	133.954	789529	44.8	4.055	110	820.2	934.0	107.6	0.027	9880	8135	my5744_rel_o2nofp.cz11a_c32r128
1977	179440	8285	129.5	9268.4	266.9	0.046	0.739	4.688	138.242	730948	45.0	4.074	120	819.2	932.8	105.9	0.014	9046	8458	my8039_rel_o2nofp.cz11a_c32r128
qp100.L2
qp100.L2: point queries with 100 insert/s per client. Graphs for performance per 1-second interval are here.
Average throughput:
Query response time histogram: each cell has the percentage of responses that take <= the time in the header and max is the max response time in seconds. For max values in the top 25% of the range have a red background and in the bottom 25% of the range have a green background. The red background is not used when the min value is within 80% of the max value.
| dbms | 256us | 1ms | 4ms | 16ms | 64ms | 256ms | 1s | 4s | 16s | gt | max |
|---|---|---|---|---|---|---|---|---|---|---|---|
| my5651_rel_o2nofp.cz11a_c32r128 | 0.002 | 14.600 | 61.709 | 23.008 | 0.682 | nonzero | 0.071 | ||||
| my5744_rel_o2nofp.cz11a_c32r128 | 0.006 | 44.769 | 54.929 | 0.295 | nonzero | 0.026 | |||||
| my8039_rel_o2nofp.cz11a_c32r128 | 0.002 | 50.707 | 48.462 | 0.829 | 0.014 |
Insert response time histogram: each cell has the percentage of responses that take <= the time in the header and max is the max response time in seconds. For max values in the top 25% of the range have a red background and in the bottom 25% of the range have a green background. The red background is not used when the min value is within 80% of the max value.
| dbms | 256us | 1ms | 4ms | 16ms | 64ms | 256ms | 1s | 4s | 16s | gt | max |
|---|---|---|---|---|---|---|---|---|---|---|---|
| my5651_rel_o2nofp.cz11a_c32r128 | 1.701 | 57.760 | 40.531 | 0.008 | 0.284 | ||||||
| my5744_rel_o2nofp.cz11a_c32r128 | 37.832 | 60.837 | 1.331 | 0.149 | |||||||
| my8039_rel_o2nofp.cz11a_c32r128 | 42.778 | 57.221 | 0.001 | 0.067 |
Delete response time histogram: each cell has the percentage of responses that take <= the time in the header and max is the max response time in seconds. For max values in the top 25% of the range have a red background and in the bottom 25% of the range have a green background. The red background is not used when the min value is within 80% of the max value.
| dbms | 256us | 1ms | 4ms | 16ms | 64ms | 256ms | 1s | 4s | 16s | gt | max |
|---|---|---|---|---|---|---|---|---|---|---|---|
| my5651_rel_o2nofp.cz11a_c32r128 | 2.576 | 73.019 | 23.754 | 0.650 | 0.157 | ||||||
| my5744_rel_o2nofp.cz11a_c32r128 | 36.368 | 63.131 | 0.501 | 0.034 | |||||||
| my8039_rel_o2nofp.cz11a_c32r128 | 85.842 | 14.140 | 0.018 | 0.029 |
Performance metrics for the DBMS listed above. Some are normalized by throughput, others are not. Legend for results is here.
ips	qps	rps	rmbps	wps	wmbps	rpq	rkbpq	wpi	wkbpi	csps	cpups	cspq	cpupq	dbgb1	dbgb2	rss	maxop	p50	p99	tag
1977	6318	57264	894.0	26301.5	448.7	9.064	144.893	13.304	232.437	348709	27.5	55.195	2089	819.8	933.2	105.0	0.071	320	224	my5651_rel_o2nofp.cz11a_c32r128
1977	17422	128177	2002.8	22004.4	481.9	7.357	117.717	11.131	249.609	413569	16.9	23.739	466	820.2	934.0	107.6	0.026	927	240	my5744_rel_o2nofp.cz11a_c32r128
1977	17190	126334	1974.0	17461.7	490.0	7.349	117.591	8.833	253.792	373985	16.7	21.757	466	819.2	932.8	106.0	0.014	911	352	my8039_rel_o2nofp.cz11a_c32r128
qr500.L3
qr500.L3: range queries with 500 insert/s per client. Graphs for performance per 1-second interval are here.
Average throughput:
Query response time histogram: each cell has the percentage of responses that take <= the time in the header and max is the max response time in seconds. For max values in the top 25% of the range have a red background and in the bottom 25% of the range have a green background. The red background is not used when the min value is within 80% of the max value.
| dbms | 256us | 1ms | 4ms | 16ms | 64ms | 256ms | 1s | 4s | 16s | gt | max |
|---|---|---|---|---|---|---|---|---|---|---|---|
| my5651_rel_o2nofp.cz11a_c32r128 | 95.302 | 3.741 | 0.857 | 0.099 | 0.001 | nonzero | 0.068 | ||||
| my5744_rel_o2nofp.cz11a_c32r128 | 97.799 | 1.914 | 0.277 | 0.009 | 0.001 | 0.047 | |||||
| my8039_rel_o2nofp.cz11a_c32r128 | 99.270 | 0.702 | 0.025 | 0.002 | nonzero | 0.029 |
Insert response time histogram: each cell has the percentage of responses that take <= the time in the header and max is the max response time in seconds. For max values in the top 25% of the range have a red background and in the bottom 25% of the range have a green background. The red background is not used when the min value is within 80% of the max value.
| dbms | 256us | 1ms | 4ms | 16ms | 64ms | 256ms | 1s | 4s | 16s | gt | max |
|---|---|---|---|---|---|---|---|---|---|---|---|
| my5651_rel_o2nofp.cz11a_c32r128 | 0.519 | 95.517 | 3.964 | 0.236 | |||||||
| my5744_rel_o2nofp.cz11a_c32r128 | 1.921 | 89.637 | 8.442 | 0.181 | |||||||
| my8039_rel_o2nofp.cz11a_c32r128 | 20.188 | 79.411 | 0.402 | 0.103 |
Delete response time histogram: each cell has the percentage of responses that take <= the time in the header and max is the max response time in seconds. For max values in the top 25% of the range have a red background and in the bottom 25% of the range have a green background. The red background is not used when the min value is within 80% of the max value.
| dbms | 256us | 1ms | 4ms | 16ms | 64ms | 256ms | 1s | 4s | 16s | gt | max |
|---|---|---|---|---|---|---|---|---|---|---|---|
| my5651_rel_o2nofp.cz11a_c32r128 | nonzero | 1.527 | 63.252 | 35.217 | 0.004 | 0.088 | |||||
| my5744_rel_o2nofp.cz11a_c32r128 | 12.344 | 79.076 | 8.579 | nonzero | 0.066 | ||||||
| my8039_rel_o2nofp.cz11a_c32r128 | 53.027 | 46.692 | 0.281 | 0.040 |
Performance metrics for the DBMS listed above. Some are normalized by throughput, others are not. Legend for results is here.
ips	qps	rps	rmbps	wps	wmbps	rpq	rkbpq	wpi	wkbpi	csps	cpups	cspq	cpupq	dbgb1	dbgb2	rss	maxop	p50	p99	tag
9885	148810	31583	489.7	56498.8	1091.0	0.212	3.370	5.716	113.018	823807	48.6	5.536	157	819.8	933.2	105.0	0.068	7786	1295	my5651_rel_o2nofp.cz11a_c32r128
9885	149680	38017	594.0	58567.9	1285.8	0.254	4.064	5.925	133.205	831031	58.0	5.552	186	820.2	934.0	107.6	0.047	7656	5961	my5744_rel_o2nofp.cz11a_c32r128
9885	158454	37426	585.0	45321.2	1272.5	0.236	3.780	4.585	131.826	805284	54.6	5.082	165	819.2	932.8	105.9	0.029	8007	7032	my8039_rel_o2nofp.cz11a_c32r128
qp500.L4
qp500.L4: point queries with 500 insert/s per client. Graphs for performance per 1-second interval are here.
Average throughput:
Query response time histogram: each cell has the percentage of responses that take <= the time in the header and max is the max response time in seconds. For max values in the top 25% of the range have a red background and in the bottom 25% of the range have a green background. The red background is not used when the min value is within 80% of the max value.
| dbms | 256us | 1ms | 4ms | 16ms | 64ms | 256ms | 1s | 4s | 16s | gt | max |
|---|---|---|---|---|---|---|---|---|---|---|---|
| my5651_rel_o2nofp.cz11a_c32r128 | 0.584 | 56.586 | 41.815 | 1.016 | 0.054 | ||||||
| my5744_rel_o2nofp.cz11a_c32r128 | 0.419 | 90.611 | 8.942 | 0.029 | 0.036 | ||||||
| my8039_rel_o2nofp.cz11a_c32r128 | nonzero | 7.374 | 83.661 | 8.952 | 0.013 | 0.035 |
Insert response time histogram: each cell has the percentage of responses that take <= the time in the header and max is the max response time in seconds. For max values in the top 25% of the range have a red background and in the bottom 25% of the range have a green background. The red background is not used when the min value is within 80% of the max value.
| dbms | 256us | 1ms | 4ms | 16ms | 64ms | 256ms | 1s | 4s | 16s | gt | max |
|---|---|---|---|---|---|---|---|---|---|---|---|
| my5651_rel_o2nofp.cz11a_c32r128 | 0.356 | 72.075 | 27.566 | 0.003 | 0.309 | ||||||
| my5744_rel_o2nofp.cz11a_c32r128 | 2.338 | 95.620 | 2.042 | 0.238 | |||||||
| my8039_rel_o2nofp.cz11a_c32r128 | 11.010 | 88.875 | 0.116 | 0.135 |
Delete response time histogram: each cell has the percentage of responses that take <= the time in the header and max is the max response time in seconds. For max values in the top 25% of the range have a red background and in the bottom 25% of the range have a green background. The red background is not used when the min value is within 80% of the max value.
| dbms | 256us | 1ms | 4ms | 16ms | 64ms | 256ms | 1s | 4s | 16s | gt | max |
|---|---|---|---|---|---|---|---|---|---|---|---|
| my5651_rel_o2nofp.cz11a_c32r128 | 0.206 | 16.374 | 77.017 | 6.404 | 0.243 | ||||||
| my5744_rel_o2nofp.cz11a_c32r128 | 5.112 | 92.263 | 2.625 | nonzero | 0.080 | ||||||
| my8039_rel_o2nofp.cz11a_c32r128 | 30.789 | 68.220 | 0.990 | 0.058 |
Performance metrics for the DBMS listed above. Some are normalized by throughput, others are not. Legend for results is here.
ips	qps	rps	rmbps	wps	wmbps	rpq	rkbpq	wpi	wkbpi	csps	cpups	cspq	cpupq	dbgb1	dbgb2	rss	maxop	p50	p99	tag
9885	4456	56140	873.5	39405.0	695.7	12.599	200.731	3.987	72.071	487061	38.8	109.305	4180	819.8	933.2	105.0	0.054	224	144	my5651_rel_o2nofp.cz11a_c32r128
9885	7750	106025	1656.6	67661.7	1403.5	13.680	218.879	6.845	145.393	502552	26.7	64.842	1654	820.2	934.0	107.6	0.036	400	144	my5744_rel_o2nofp.cz11a_c32r128
9885	9095	109080	1704.4	48233.1	1336.8	11.994	191.905	4.880	138.488	430060	22.6	47.287	1193	819.2	932.8	106.0	0.035	464	240	my8039_rel_o2nofp.cz11a_c32r128
qr1000.L5
qr1000.L5: range queries with 1000 insert/s per client. Graphs for performance per 1-second interval are here.
Average throughput:
Query response time histogram: each cell has the percentage of responses that take <= the time in the header and max is the max response time in seconds. For max values in the top 25% of the range have a red background and in the bottom 25% of the range have a green background. The red background is not used when the min value is within 80% of the max value.
| dbms | 256us | 1ms | 4ms | 16ms | 64ms | 256ms | 1s | 4s | 16s | gt | max |
|---|---|---|---|---|---|---|---|---|---|---|---|
| my5651_rel_o2nofp.cz11a_c32r128 | 94.790 | 3.939 | 1.227 | 0.044 | 0.001 | nonzero | nonzero | 0.388 | |||
| my5744_rel_o2nofp.cz11a_c32r128 | 96.794 | 2.572 | 0.608 | 0.026 | nonzero | 0.047 | |||||
| my8039_rel_o2nofp.cz11a_c32r128 | 95.959 | 3.146 | 0.883 | 0.013 | nonzero | 0.041 |
Insert response time histogram: each cell has the percentage of responses that take <= the time in the header and max is the max response time in seconds. For max values in the top 25% of the range have a red background and in the bottom 25% of the range have a green background. The red background is not used when the min value is within 80% of the max value.
| dbms | 256us | 1ms | 4ms | 16ms | 64ms | 256ms | 1s | 4s | 16s | gt | max |
|---|---|---|---|---|---|---|---|---|---|---|---|
| my5651_rel_o2nofp.cz11a_c32r128 | nonzero | 24.653 | 57.586 | 0.630 | 17.131 | 0.318 | |||||
| my5744_rel_o2nofp.cz11a_c32r128 | nonzero | 50.616 | 49.172 | 0.212 | 0.137 | ||||||
| my8039_rel_o2nofp.cz11a_c32r128 | 0.001 | 35.885 | 64.083 | 0.032 | 0.110 |
Delete response time histogram: each cell has the percentage of responses that take <= the time in the header and max is the max response time in seconds. For max values in the top 25% of the range have a red background and in the bottom 25% of the range have a green background. The red background is not used when the min value is within 80% of the max value.
| dbms | 256us | 1ms | 4ms | 16ms | 64ms | 256ms | 1s | 4s | 16s | gt | max |
|---|---|---|---|---|---|---|---|---|---|---|---|
| my5651_rel_o2nofp.cz11a_c32r128 | 24.955 | 51.414 | 6.239 | 0.077 | 17.314 | 0.308 | |||||
| my5744_rel_o2nofp.cz11a_c32r128 | 78.267 | 21.554 | 0.180 | 0.058 | |||||||
| my8039_rel_o2nofp.cz11a_c32r128 | 28.722 | 68.530 | 2.748 | 0.048 |
Performance metrics for the DBMS listed above. Some are normalized by throughput, others are not. Legend for results is here.
ips	qps	rps	rmbps	wps	wmbps	rpq	rkbpq	wpi	wkbpi	csps	cpups	cspq	cpupq	dbgb1	dbgb2	rss	maxop	p50	p99	tag
11125	128256	27668	427.9	52543.7	1036.5	0.216	3.416	4.723	95.407	711073	48.8	5.544	183	819.8	933.2	105.0	0.388	6665	943	my5651_rel_o2nofp.cz11a_c32r128
19748	130415	38913	608.0	65920.4	1455.5	0.298	4.774	3.338	75.473	748802	58.8	5.742	216	820.2	934.0	107.6	0.047	6856	2894	my5744_rel_o2nofp.cz11a_c32r128
19769	118613	37092	579.6	48481.6	1394.8	0.313	5.004	2.452	72.246	675233	59.2	5.693	240	819.2	933.7	106.0	0.041	5930	5162	my8039_rel_o2nofp.cz11a_c32r128
qp1000.L6
qp1000.L6: point queries with 1000 insert/s per client. Graphs for performance per 1-second interval are here.
Average throughput:
Query response time histogram: each cell has the percentage of responses that take <= the time in the header and max is the max response time in seconds. For max values in the top 25% of the range have a red background and in the bottom 25% of the range have a green background. The red background is not used when the min value is within 80% of the max value.
| dbms | 256us | 1ms | 4ms | 16ms | 64ms | 256ms | 1s | 4s | 16s | gt | max |
|---|---|---|---|---|---|---|---|---|---|---|---|
| my5651_rel_o2nofp.cz11a_c32r128 | nonzero | 7.699 | 67.594 | 23.687 | 1.020 | nonzero | 0.084 | ||||
| my5744_rel_o2nofp.cz11a_c32r128 | nonzero | 2.294 | 96.357 | 1.329 | 0.021 | 0.050 | |||||
| my8039_rel_o2nofp.cz11a_c32r128 | nonzero | 4.874 | 85.562 | 9.546 | 0.017 | 0.052 |
Insert response time histogram: each cell has the percentage of responses that take <= the time in the header and max is the max response time in seconds. For max values in the top 25% of the range have a red background and in the bottom 25% of the range have a green background. The red background is not used when the min value is within 80% of the max value.
| dbms | 256us | 1ms | 4ms | 16ms | 64ms | 256ms | 1s | 4s | 16s | gt | max |
|---|---|---|---|---|---|---|---|---|---|---|---|
| my5651_rel_o2nofp.cz11a_c32r128 | 0.082 | 9.848 | 6.371 | 83.699 | 0.708 | ||||||
| my5744_rel_o2nofp.cz11a_c32r128 | 42.274 | 38.294 | 0.777 | 18.654 | 0.343 | ||||||
| my8039_rel_o2nofp.cz11a_c32r128 | 7.346 | 31.335 | 61.320 | 0.217 |
Delete response time histogram: each cell has the percentage of responses that take <= the time in the header and max is the max response time in seconds. For max values in the top 25% of the range have a red background and in the bottom 25% of the range have a green background. The red background is not used when the min value is within 80% of the max value.
| dbms | 256us | 1ms | 4ms | 16ms | 64ms | 256ms | 1s | 4s | 16s | gt | max |
|---|---|---|---|---|---|---|---|---|---|---|---|
| my5651_rel_o2nofp.cz11a_c32r128 | 0.589 | 9.011 | 6.464 | 0.307 | 83.627 | 0.688 | |||||
| my5744_rel_o2nofp.cz11a_c32r128 | 25.136 | 54.198 | 1.712 | 0.062 | 18.892 | 0.335 | |||||
| my8039_rel_o2nofp.cz11a_c32r128 | 2.691 | 20.284 | 22.352 | 54.673 | 0.207 |
Performance metrics for the DBMS listed above. Some are normalized by throughput, others are not. Legend for results is here.
ips	qps	rps	rmbps	wps	wmbps	rpq	rkbpq	wpi	wkbpi	csps	cpups	cspq	cpupq	dbgb1	dbgb2	rss	maxop	p50	p99	tag
3306	5839	58466	912.2	29916.9	511.6	10.013	159.979	9.048	158.458	408250	31.5	69.919	2590	819.8	933.2	105.0	0.084	288	208	my5651_rel_o2nofp.cz11a_c32r128
10870	10282	117767	1840.1	54627.2	1255.6	11.453	183.252	5.026	118.289	460013	26.9	44.738	1256	820.2	934.0	107.6	0.050	543	224	my5744_rel_o2nofp.cz11a_c32r128
12798	8682	107354	1677.5	47684.2	1352.1	12.365	197.852	3.726	108.191	469240	27.3	54.047	1509	819.2	935.3	106.0	0.052	448	272	my8039_rel_o2nofp.cz11a_c32r128
l.i0
l.i0: load without secondary indexes
Performance metrics for all DBMS, not just the ones listed above. Some are normalized by throughput, others are not. Legend for results is here.
ips	qps	rps	rmbps	wps	wmbps	rpq	rkbpq	wpi	wkbpi	csps	cpups	cspq	cpupq	dbgb1	dbgb2	rss	maxop	p50	p99	tag
371264	0	2185	8.5	2467.7	132.8	0.006	0.024	0.007	0.366	139954	37.7	0.377	49	263.2	363.7	107.1	0.173	17586	15184	my5651_rel_o2nofp.cz11a_c32r128
672043	0	2	0.0	4526.7	240.6	0.000	0.000	0.007	0.367	82544	46.0	0.123	33	263.2	363.7	108.1	0.177	34063	29169	my5744_rel_o2nofp.cz11a_c32r128
1429082	0	5	0.1	9725.7	531.2	0.000	0.000	0.007	0.381	297221	54.8	0.208	18	262.3	362.8	108.4	0.245	73820	61733	my8039_rel_o2nofp.cz11a_c32r128
l.x
l.x: create secondary indexes
Performance metrics for all DBMS, not just the ones listed above. Some are normalized by throughput, others are not. Legend for results is here.
ips	qps	rps	rmbps	wps	wmbps	rpq	rkbpq	wpi	wkbpi	csps	cpups	cspq	cpupq	dbgb1	dbgb2	rss	maxop	p50	p99	tag
298352	0	3998	264.7	16624.5	606.4	0.013	0.909	0.056	2.081	119028	35.8	0.399	58	557.3	657.8	107.8	0.003	NA	NA	my5651_rel_o2nofp.cz11a_c32r128
1793722	0	17853	1554.2	29637.8	1923.1	0.010	0.887	0.017	1.098	206052	25.9	0.115	7	605.8	706.3	105.4	0.002	NA	NA	my5744_rel_o2nofp.cz11a_c32r128
1367521	0	34508	1991.3	40701.9	1795.0	0.025	1.491	0.030	1.344	192617	57.8	0.141	20	603.6	704.2	104.9	0.007	NA	NA	my8039_rel_o2nofp.cz11a_c32r128
l.i1
l.i1: continue load after secondary indexes created with 50 inserts per transaction
Performance metrics for all DBMS, not just the ones listed above. Some are normalized by throughput, others are not. Legend for results is here.
ips	qps	rps	rmbps	wps	wmbps	rpq	rkbpq	wpi	wkbpi	csps	cpups	cspq	cpupq	dbgb1	dbgb2	rss	maxop	p50	p99	tag
11325	0	28421	439.6	55822.6	1148.5	2.510	39.751	4.929	103.847	264139	16.0	23.324	678	819.8	933.2	105.4	1.626	200	150	my5651_rel_o2nofp.cz11a_c32r128
14164	0	34684	541.9	59410.6	1386.1	2.449	39.179	4.194	100.204	321279	20.9	22.682	708	820.2	934.0	107.8	0.373	200	150	my5744_rel_o2nofp.cz11a_c32r128
16129	0	36470	569.9	53356.1	1517.7	2.261	36.179	3.308	96.355	334131	20.7	20.716	616	819.2	935.6	107.5	0.475	699	300	my8039_rel_o2nofp.cz11a_c32r128
l.i2
l.i2: continue load after secondary indexes created with 5 inserts per transaction
Performance metrics for all DBMS, not just the ones listed above. Some are normalized by throughput, others are not. Legend for results is here.
ips	qps	rps	rmbps	wps	wmbps	rpq	rkbpq	wpi	wkbpi	csps	cpups	cspq	cpupq	dbgb1	dbgb2	rss	maxop	p50	p99	tag
4215	0	28835	438.8	52533.2	1038.2	6.841	106.607	12.464	252.227	256167	13.6	60.777	1549	819.8	933.2	105.0	0.122	115	65	my5651_rel_o2nofp.cz11a_c32r128
5800	0	36879	576.2	58906.5	1345.6	6.358	101.727	10.156	237.554	297041	16.6	51.210	1374	820.2	934.0	107.6	0.091	130	80	my5744_rel_o2nofp.cz11a_c32r128
5790	0	39308	614.2	50752.8	1457.6	6.789	108.619	8.765	257.774	341275	17.5	58.939	1451	819.2	932.8	105.9	0.145	145	85	my8039_rel_o2nofp.cz11a_c32r128
qr100.L1
qr100.L1: range queries with 100 insert/s per client
Performance metrics for all DBMS, not just the ones listed above. Some are normalized by throughput, others are not. Legend for results is here.
ips	qps	rps	rmbps	wps	wmbps	rpq	rkbpq	wpi	wkbpi	csps	cpups	cspq	cpupq	dbgb1	dbgb2	rss	maxop	p50	p99	tag
1977	232061	9338	145.1	8562.3	241.2	0.040	0.640	4.331	124.944	940200	43.4	4.052	90	819.8	933.2	105.0	0.022	11891	10213	my5651_rel_o2nofp.cz11a_c32r128
1977	194689	9264	144.7	9189.5	258.6	0.048	0.761	4.648	133.954	789529	44.8	4.055	110	820.2	934.0	107.6	0.027	9880	8135	my5744_rel_o2nofp.cz11a_c32r128
1977	179440	8285	129.5	9268.4	266.9	0.046	0.739	4.688	138.242	730948	45.0	4.074	120	819.2	932.8	105.9	0.014	9046	8458	my8039_rel_o2nofp.cz11a_c32r128
qp100.L2
qp100.L2: point queries with 100 insert/s per client
Performance metrics for all DBMS, not just the ones listed above. Some are normalized by throughput, others are not. Legend for results is here.
ips	qps	rps	rmbps	wps	wmbps	rpq	rkbpq	wpi	wkbpi	csps	cpups	cspq	cpupq	dbgb1	dbgb2	rss	maxop	p50	p99	tag
1977	6318	57264	894.0	26301.5	448.7	9.064	144.893	13.304	232.437	348709	27.5	55.195	2089	819.8	933.2	105.0	0.071	320	224	my5651_rel_o2nofp.cz11a_c32r128
1977	17422	128177	2002.8	22004.4	481.9	7.357	117.717	11.131	249.609	413569	16.9	23.739	466	820.2	934.0	107.6	0.026	927	240	my5744_rel_o2nofp.cz11a_c32r128
1977	17190	126334	1974.0	17461.7	490.0	7.349	117.591	8.833	253.792	373985	16.7	21.757	466	819.2	932.8	106.0	0.014	911	352	my8039_rel_o2nofp.cz11a_c32r128
qr500.L3
qr500.L3: range queries with 500 insert/s per client
Performance metrics for all DBMS, not just the ones listed above. Some are normalized by throughput, others are not. Legend for results is here.
ips	qps	rps	rmbps	wps	wmbps	rpq	rkbpq	wpi	wkbpi	csps	cpups	cspq	cpupq	dbgb1	dbgb2	rss	maxop	p50	p99	tag
9885	148810	31583	489.7	56498.8	1091.0	0.212	3.370	5.716	113.018	823807	48.6	5.536	157	819.8	933.2	105.0	0.068	7786	1295	my5651_rel_o2nofp.cz11a_c32r128
9885	149680	38017	594.0	58567.9	1285.8	0.254	4.064	5.925	133.205	831031	58.0	5.552	186	820.2	934.0	107.6	0.047	7656	5961	my5744_rel_o2nofp.cz11a_c32r128
9885	158454	37426	585.0	45321.2	1272.5	0.236	3.780	4.585	131.826	805284	54.6	5.082	165	819.2	932.8	105.9	0.029	8007	7032	my8039_rel_o2nofp.cz11a_c32r128
qp500.L4
qp500.L4: point queries with 500 insert/s per client
Performance metrics for all DBMS, not just the ones listed above. Some are normalized by throughput, others are not. Legend for results is here.
ips	qps	rps	rmbps	wps	wmbps	rpq	rkbpq	wpi	wkbpi	csps	cpups	cspq	cpupq	dbgb1	dbgb2	rss	maxop	p50	p99	tag
9885	4456	56140	873.5	39405.0	695.7	12.599	200.731	3.987	72.071	487061	38.8	109.305	4180	819.8	933.2	105.0	0.054	224	144	my5651_rel_o2nofp.cz11a_c32r128
9885	7750	106025	1656.6	67661.7	1403.5	13.680	218.879	6.845	145.393	502552	26.7	64.842	1654	820.2	934.0	107.6	0.036	400	144	my5744_rel_o2nofp.cz11a_c32r128
9885	9095	109080	1704.4	48233.1	1336.8	11.994	191.905	4.880	138.488	430060	22.6	47.287	1193	819.2	932.8	106.0	0.035	464	240	my8039_rel_o2nofp.cz11a_c32r128
qr1000.L5
qr1000.L5: range queries with 1000 insert/s per client
Performance metrics for all DBMS, not just the ones listed above. Some are normalized by throughput, others are not. Legend for results is here.
ips	qps	rps	rmbps	wps	wmbps	rpq	rkbpq	wpi	wkbpi	csps	cpups	cspq	cpupq	dbgb1	dbgb2	rss	maxop	p50	p99	tag
11125	128256	27668	427.9	52543.7	1036.5	0.216	3.416	4.723	95.407	711073	48.8	5.544	183	819.8	933.2	105.0	0.388	6665	943	my5651_rel_o2nofp.cz11a_c32r128
19748	130415	38913	608.0	65920.4	1455.5	0.298	4.774	3.338	75.473	748802	58.8	5.742	216	820.2	934.0	107.6	0.047	6856	2894	my5744_rel_o2nofp.cz11a_c32r128
19769	118613	37092	579.6	48481.6	1394.8	0.313	5.004	2.452	72.246	675233	59.2	5.693	240	819.2	933.7	106.0	0.041	5930	5162	my8039_rel_o2nofp.cz11a_c32r128
qp1000.L6
qp1000.L6: point queries with 1000 insert/s per client
Performance metrics for all DBMS, not just the ones listed above. Some are normalized by throughput, others are not. Legend for results is here.
ips	qps	rps	rmbps	wps	wmbps	rpq	rkbpq	wpi	wkbpi	csps	cpups	cspq	cpupq	dbgb1	dbgb2	rss	maxop	p50	p99	tag
3306	5839	58466	912.2	29916.9	511.6	10.013	159.979	9.048	158.458	408250	31.5	69.919	2590	819.8	933.2	105.0	0.084	288	208	my5651_rel_o2nofp.cz11a_c32r128
10870	10282	117767	1840.1	54627.2	1255.6	11.453	183.252	5.026	118.289	460013	26.9	44.738	1256	820.2	934.0	107.6	0.050	543	224	my5744_rel_o2nofp.cz11a_c32r128
12798	8682	107354	1677.5	47684.2	1352.1	12.365	197.852	3.726	108.191	469240	27.3	54.047	1509	819.2	935.3	106.0	0.052	448	272	my8039_rel_o2nofp.cz11a_c32r128
l.i0
- l.i0: load without secondary indexes
- Legend for results is here.
- Each entry lists the percentage of responses that fit in that bucket (slower than max time for previous bucket, faster than min time for next bucket).
Insert response time histogram
256us	1ms	4ms	16ms	64ms	256ms	1s	4s	16s	gt	max	tag
0.000	0.164	10.763	88.563	0.473	0.037	0.000	0.000	0.000	0.000	0.173	my5651_rel_o2nofp.cz11a_c32r128
0.000	0.153	99.593	0.206	0.011	0.037	0.000	0.000	0.000	0.000	0.177	my5744_rel_o2nofp.cz11a_c32r128
0.000	0.099	99.788	0.060	0.014	0.039	0.000	0.000	0.000	0.000	0.245	my8039_rel_o2nofp.cz11a_c32r128
l.x
- l.x: create secondary indexes
- Legend for results is here.
- Each entry lists the percentage of responses that fit in that bucket (slower than max time for previous bucket, faster than min time for next bucket).
TODO - determine whether there is data for create index response time
l.i1
- l.i1: continue load after secondary indexes created with 50 inserts per transaction
- Legend for results is here.
- Each entry lists the percentage of responses that fit in that bucket (slower than max time for previous bucket, faster than min time for next bucket).
Insert response time histogram
256us	1ms	4ms	16ms	64ms	256ms	1s	4s	16s	gt	max	tag
0.000	0.000	0.001	4.124	64.166	11.736	19.972	nonzero	0.000	0.000	1.626	my5651_rel_o2nofp.cz11a_c32r128
0.000	0.000	0.023	30.572	42.689	11.900	14.815	0.000	0.000	0.000	0.373	my5744_rel_o2nofp.cz11a_c32r128
0.000	0.000	0.124	14.794	38.441	46.315	0.325	0.000	0.000	0.000	0.475	my8039_rel_o2nofp.cz11a_c32r128
Delete response time histogram
256us	1ms	4ms	16ms	64ms	256ms	1s	4s	16s	gt	max	tag
0.000	0.000	1.760	35.847	42.238	0.185	19.970	nonzero	0.000	0.000	1.140	my5651_rel_o2nofp.cz11a_c32r128
0.000	0.000	17.859	64.695	2.547	0.097	14.802	0.000	0.000	0.000	0.366	my5744_rel_o2nofp.cz11a_c32r128
0.000	0.000	18.416	20.612	29.232	31.741	0.000	0.000	0.000	0.000	0.199	my8039_rel_o2nofp.cz11a_c32r128
l.i2
- l.i2: continue load after secondary indexes created with 5 inserts per transaction
- Legend for results is here.
- Each entry lists the percentage of responses that fit in that bucket (slower than max time for previous bucket, faster than min time for next bucket).
Insert response time histogram
256us	1ms	4ms	16ms	64ms	256ms	1s	4s	16s	gt	max	tag
0.001	0.092	8.215	45.109	37.733	8.850	0.000	0.000	0.000	0.000	0.122	my5651_rel_o2nofp.cz11a_c32r128
nonzero	4.866	37.914	18.258	38.855	0.107	0.000	0.000	0.000	0.000	0.091	my5744_rel_o2nofp.cz11a_c32r128
0.000	0.000	0.403	72.701	26.833	0.063	0.000	0.000	0.000	0.000	0.145	my8039_rel_o2nofp.cz11a_c32r128
Delete response time histogram
256us	1ms	4ms	16ms	64ms	256ms	1s	4s	16s	gt	max	tag
0.001	0.616	26.399	26.535	38.200	8.249	0.000	0.000	0.000	0.000	0.112	my5651_rel_o2nofp.cz11a_c32r128
0.002	52.887	8.248	0.139	38.711	0.013	0.000	0.000	0.000	0.000	0.089	my5744_rel_o2nofp.cz11a_c32r128
0.000	0.000	0.662	73.380	25.937	0.021	0.000	0.000	0.000	0.000	0.124	my8039_rel_o2nofp.cz11a_c32r128
qr100.L1
- qr100.L1: range queries with 100 insert/s per client
- Legend for results is here.
- Each entry lists the percentage of responses that fit in that bucket (slower than max time for previous bucket, faster than min time for next bucket).
Query response time histogram
256us	1ms	4ms	16ms	64ms	256ms	1s	4s	16s	gt	max	tag
99.548	0.396	0.045	0.010	nonzero	0.000	0.000	0.000	0.000	0.000	0.022	my5651_rel_o2nofp.cz11a_c32r128
99.830	0.139	0.030	nonzero	nonzero	0.000	0.000	0.000	0.000	0.000	0.027	my5744_rel_o2nofp.cz11a_c32r128
99.882	0.114	0.004	nonzero	0.000	0.000	0.000	0.000	0.000	0.000	0.014	my8039_rel_o2nofp.cz11a_c32r128
Insert response time histogram
256us	1ms	4ms	16ms	64ms	256ms	1s	4s	16s	gt	max	tag
0.000	0.000	0.000	20.406	79.589	0.006	0.000	0.000	0.000	0.000	0.080	my5651_rel_o2nofp.cz11a_c32r128
0.000	0.000	0.000	88.731	11.269	0.000	0.000	0.000	0.000	0.000	0.054	my5744_rel_o2nofp.cz11a_c32r128
0.000	0.000	0.000	93.482	6.518	0.000	0.000	0.000	0.000	0.000	0.031	my8039_rel_o2nofp.cz11a_c32r128
Delete response time histogram
256us	1ms	4ms	16ms	64ms	256ms	1s	4s	16s	gt	max	tag
0.000	0.000	9.621	78.699	11.681	0.000	0.000	0.000	0.000	0.000	0.047	my5651_rel_o2nofp.cz11a_c32r128
0.000	0.000	85.693	14.154	0.153	0.000	0.000	0.000	0.000	0.000	0.038	my5744_rel_o2nofp.cz11a_c32r128
0.000	0.000	87.174	12.821	0.006	0.000	0.000	0.000	0.000	0.000	0.021	my8039_rel_o2nofp.cz11a_c32r128
qp100.L2
- qp100.L2: point queries with 100 insert/s per client
- Legend for results is here.
- Each entry lists the percentage of responses that fit in that bucket (slower than max time for previous bucket, faster than min time for next bucket).
Query response time histogram
256us	1ms	4ms	16ms	64ms	256ms	1s	4s	16s	gt	max	tag
0.002	14.600	61.709	23.008	0.682	nonzero	0.000	0.000	0.000	0.000	0.071	my5651_rel_o2nofp.cz11a_c32r128
0.006	44.769	54.929	0.295	nonzero	0.000	0.000	0.000	0.000	0.000	0.026	my5744_rel_o2nofp.cz11a_c32r128
0.002	50.707	48.462	0.829	0.000	0.000	0.000	0.000	0.000	0.000	0.014	my8039_rel_o2nofp.cz11a_c32r128
Insert response time histogram
256us	1ms	4ms	16ms	64ms	256ms	1s	4s	16s	gt	max	tag
0.000	0.000	0.000	1.701	57.760	40.531	0.008	0.000	0.000	0.000	0.284	my5651_rel_o2nofp.cz11a_c32r128
0.000	0.000	0.000	37.832	60.837	1.331	0.000	0.000	0.000	0.000	0.149	my5744_rel_o2nofp.cz11a_c32r128
0.000	0.000	0.000	42.778	57.221	0.001	0.000	0.000	0.000	0.000	0.067	my8039_rel_o2nofp.cz11a_c32r128
Delete response time histogram
256us	1ms	4ms	16ms	64ms	256ms	1s	4s	16s	gt	max	tag
0.000	0.000	2.576	73.019	23.754	0.650	0.000	0.000	0.000	0.000	0.157	my5651_rel_o2nofp.cz11a_c32r128
0.000	0.000	36.368	63.131	0.501	0.000	0.000	0.000	0.000	0.000	0.034	my5744_rel_o2nofp.cz11a_c32r128
0.000	0.000	85.842	14.140	0.018	0.000	0.000	0.000	0.000	0.000	0.029	my8039_rel_o2nofp.cz11a_c32r128
qr500.L3
- qr500.L3: range queries with 500 insert/s per client
- Legend for results is here.
- Each entry lists the percentage of responses that fit in that bucket (slower than max time for previous bucket, faster than min time for next bucket).
Query response time histogram
256us	1ms	4ms	16ms	64ms	256ms	1s	4s	16s	gt	max	tag
95.302	3.741	0.857	0.099	0.001	nonzero	0.000	0.000	0.000	0.000	0.068	my5651_rel_o2nofp.cz11a_c32r128
97.799	1.914	0.277	0.009	0.001	0.000	0.000	0.000	0.000	0.000	0.047	my5744_rel_o2nofp.cz11a_c32r128
99.270	0.702	0.025	0.002	nonzero	0.000	0.000	0.000	0.000	0.000	0.029	my8039_rel_o2nofp.cz11a_c32r128
Insert response time histogram
256us	1ms	4ms	16ms	64ms	256ms	1s	4s	16s	gt	max	tag
0.000	0.000	0.000	0.519	95.517	3.964	0.000	0.000	0.000	0.000	0.236	my5651_rel_o2nofp.cz11a_c32r128
0.000	0.000	0.000	1.921	89.637	8.442	0.000	0.000	0.000	0.000	0.181	my5744_rel_o2nofp.cz11a_c32r128
0.000	0.000	0.000	20.188	79.411	0.402	0.000	0.000	0.000	0.000	0.103	my8039_rel_o2nofp.cz11a_c32r128
Delete response time histogram
256us	1ms	4ms	16ms	64ms	256ms	1s	4s	16s	gt	max	tag
0.000	nonzero	1.527	63.252	35.217	0.004	0.000	0.000	0.000	0.000	0.088	my5651_rel_o2nofp.cz11a_c32r128
0.000	0.000	12.344	79.076	8.579	nonzero	0.000	0.000	0.000	0.000	0.066	my5744_rel_o2nofp.cz11a_c32r128
0.000	0.000	53.027	46.692	0.281	0.000	0.000	0.000	0.000	0.000	0.040	my8039_rel_o2nofp.cz11a_c32r128
qp500.L4
- qp500.L4: point queries with 500 insert/s per client
- Legend for results is here.
- Each entry lists the percentage of responses that fit in that bucket (slower than max time for previous bucket, faster than min time for next bucket).
Query response time histogram
256us	1ms	4ms	16ms	64ms	256ms	1s	4s	16s	gt	max	tag
0.000	0.584	56.586	41.815	1.016	0.000	0.000	0.000	0.000	0.000	0.054	my5651_rel_o2nofp.cz11a_c32r128
0.000	0.419	90.611	8.942	0.029	0.000	0.000	0.000	0.000	0.000	0.036	my5744_rel_o2nofp.cz11a_c32r128
nonzero	7.374	83.661	8.952	0.013	0.000	0.000	0.000	0.000	0.000	0.035	my8039_rel_o2nofp.cz11a_c32r128
Insert response time histogram
256us	1ms	4ms	16ms	64ms	256ms	1s	4s	16s	gt	max	tag
0.000	0.000	0.000	0.356	72.075	27.566	0.003	0.000	0.000	0.000	0.309	my5651_rel_o2nofp.cz11a_c32r128
0.000	0.000	0.000	2.338	95.620	2.042	0.000	0.000	0.000	0.000	0.238	my5744_rel_o2nofp.cz11a_c32r128
0.000	0.000	0.000	11.010	88.875	0.116	0.000	0.000	0.000	0.000	0.135	my8039_rel_o2nofp.cz11a_c32r128
Delete response time histogram
256us	1ms	4ms	16ms	64ms	256ms	1s	4s	16s	gt	max	tag
0.000	0.000	0.206	16.374	77.017	6.404	0.000	0.000	0.000	0.000	0.243	my5651_rel_o2nofp.cz11a_c32r128
0.000	0.000	5.112	92.263	2.625	nonzero	0.000	0.000	0.000	0.000	0.080	my5744_rel_o2nofp.cz11a_c32r128
0.000	0.000	30.789	68.220	0.990	0.000	0.000	0.000	0.000	0.000	0.058	my8039_rel_o2nofp.cz11a_c32r128
qr1000.L5
- qr1000.L5: range queries with 1000 insert/s per client
- Legend for results is here.
- Each entry lists the percentage of responses that fit in that bucket (slower than max time for previous bucket, faster than min time for next bucket).
Query response time histogram
256us	1ms	4ms	16ms	64ms	256ms	1s	4s	16s	gt	max	tag
94.790	3.939	1.227	0.044	0.001	nonzero	nonzero	0.000	0.000	0.000	0.388	my5651_rel_o2nofp.cz11a_c32r128
96.794	2.572	0.608	0.026	nonzero	0.000	0.000	0.000	0.000	0.000	0.047	my5744_rel_o2nofp.cz11a_c32r128
95.959	3.146	0.883	0.013	nonzero	0.000	0.000	0.000	0.000	0.000	0.041	my8039_rel_o2nofp.cz11a_c32r128
Insert response time histogram
256us	1ms	4ms	16ms	64ms	256ms	1s	4s	16s	gt	max	tag
0.000	0.000	nonzero	24.653	57.586	0.630	17.131	0.000	0.000	0.000	0.318	my5651_rel_o2nofp.cz11a_c32r128
0.000	0.000	nonzero	50.616	49.172	0.212	0.000	0.000	0.000	0.000	0.137	my5744_rel_o2nofp.cz11a_c32r128
0.000	0.000	0.001	35.885	64.083	0.032	0.000	0.000	0.000	0.000	0.110	my8039_rel_o2nofp.cz11a_c32r128
Delete response time histogram
256us	1ms	4ms	16ms	64ms	256ms	1s	4s	16s	gt	max	tag
0.000	0.000	24.955	51.414	6.239	0.077	17.314	0.000	0.000	0.000	0.308	my5651_rel_o2nofp.cz11a_c32r128
0.000	0.000	78.267	21.554	0.180	0.000	0.000	0.000	0.000	0.000	0.058	my5744_rel_o2nofp.cz11a_c32r128
0.000	0.000	28.722	68.530	2.748	0.000	0.000	0.000	0.000	0.000	0.048	my8039_rel_o2nofp.cz11a_c32r128
qp1000.L6
- qp1000.L6: point queries with 1000 insert/s per client
- Legend for results is here.
- Each entry lists the percentage of responses that fit in that bucket (slower than max time for previous bucket, faster than min time for next bucket).
Query response time histogram
256us	1ms	4ms	16ms	64ms	256ms	1s	4s	16s	gt	max	tag
nonzero	7.699	67.594	23.687	1.020	nonzero	0.000	0.000	0.000	0.000	0.084	my5651_rel_o2nofp.cz11a_c32r128
nonzero	2.294	96.357	1.329	0.021	0.000	0.000	0.000	0.000	0.000	0.050	my5744_rel_o2nofp.cz11a_c32r128
nonzero	4.874	85.562	9.546	0.017	0.000	0.000	0.000	0.000	0.000	0.052	my8039_rel_o2nofp.cz11a_c32r128
Insert response time histogram
256us	1ms	4ms	16ms	64ms	256ms	1s	4s	16s	gt	max	tag
0.000	0.000	0.000	0.082	9.848	6.371	83.699	0.000	0.000	0.000	0.708	my5651_rel_o2nofp.cz11a_c32r128
0.000	0.000	0.000	42.274	38.294	0.777	18.654	0.000	0.000	0.000	0.343	my5744_rel_o2nofp.cz11a_c32r128
0.000	0.000	0.000	7.346	31.335	61.320	0.000	0.000	0.000	0.000	0.217	my8039_rel_o2nofp.cz11a_c32r128
Delete response time histogram
256us	1ms	4ms	16ms	64ms	256ms	1s	4s	16s	gt	max	tag
0.000	0.000	0.589	9.011	6.464	0.307	83.627	0.000	0.000	0.000	0.688	my5651_rel_o2nofp.cz11a_c32r128
0.000	0.000	25.136	54.198	1.712	0.062	18.892	0.000	0.000	0.000	0.335	my5744_rel_o2nofp.cz11a_c32r128
0.000	0.000	2.691	20.284	22.352	54.673	0.000	0.000	0.000	0.000	0.207	my8039_rel_o2nofp.cz11a_c32r128