Introduction
This is a report for the insert benchmark with 80M docs and 8 client(s). It is generated by scripts (bash, awk, sed) and Tufte might not be impressed. An overview of the insert benchmark is here and a short update is here. Below, by DBMS, I mean DBMS+version.config. An example is my8020.c10b40 where my means MySQL, 8020 is version 8.0.20 and c10b40 is the name for the configuration file.
The test server has is a c2d-standard-30 with HT off, 16 cores, 64G RAM, Ubuntu 22.04 and ext4 using SW RAID 0 and 2 NVMe devices. The benchmark was run with 8 clients and there were 1 or 3 connections per client (1 for queries or inserts without rate limits, 1+1 for rate limited inserts+deletes). It uses 8 tables with a table per client. It loads 10M rows per table without secondary indexes, creates 3 secondary indexes per table, then inserts 40m+10m rows per table with a delete per insert to avoid growing the table. It then does 6 read+write tests for 1800s each that do queries as fast as possible with 100,100,500,500,1000,1000 inserts/s and the same for deletes/s per client concurrent with the queries. The database is cached by InnoDB. Clients and the DBMS share one server. The per-database configs are in the per-database subdirectories here.
The tested DBMS are:
- my8037_rel_o2nofp.cz11a_c24r64 - MySQL 8.0.37, compiled with -DCMAKE_BUILD_TYPE=Release and -O2
- ma100618_rel_withdbg.cz11a_c24r64 - MariaDB 10.6.18, compiled with -DCMAKE_BUILD_TYPE=RelWithDebInfo
- ma101108_rel_withdbg.cz11a_c24r64 - MariaDB 10.11.8, compiled with -DCMAKE_BUILD_TYPE=RelWithDebInfo
- ma1011_240723_c944cd6e_ilwas.cz11a_c24r64 - MariaDB 10.11, compiled with -DCMAKE_BUILD_TYPE=RelWithDebInfo on July 7, 2024 at git hash c944cd6e
- ma110402_rel_withdbg.cz11b_c24r64 - MariaDB 11.4.2, compiled with -DCMAKE_BUILD_TYPE=RelWithDebInfo
- ma1104_240723_2ee061c2_ilwas.cz11b_c24r64 - MariaDB 11.4, compiled with -DCMAKE_BUILD_TYPE=RelWithDebInfo on July 7, 2024 at git hash 2ee061c2
Contents
- Summary
- l.i0: load without secondary indexes
- l.x: create secondary indexes
- l.i1: continue load after secondary indexes created with 50 inserts per transaction
- l.i2: continue load after secondary indexes created with 5 inserts per transaction
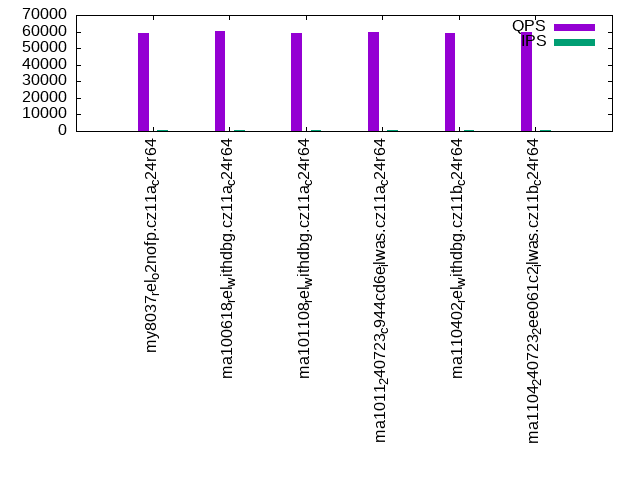
- qr100.L1: range queries with 100 insert/s per client
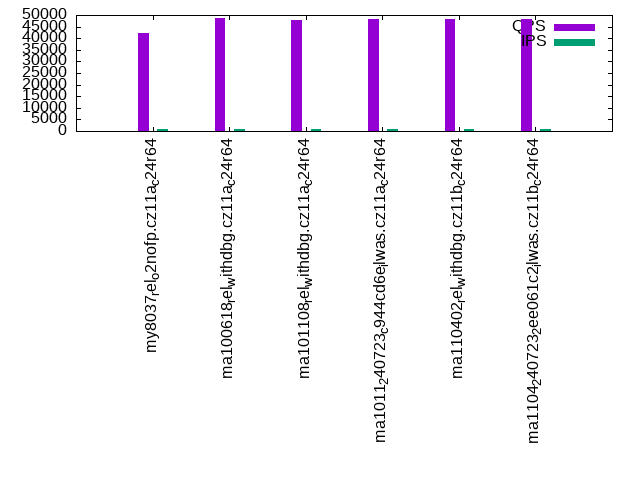
- qp100.L2: point queries with 100 insert/s per client
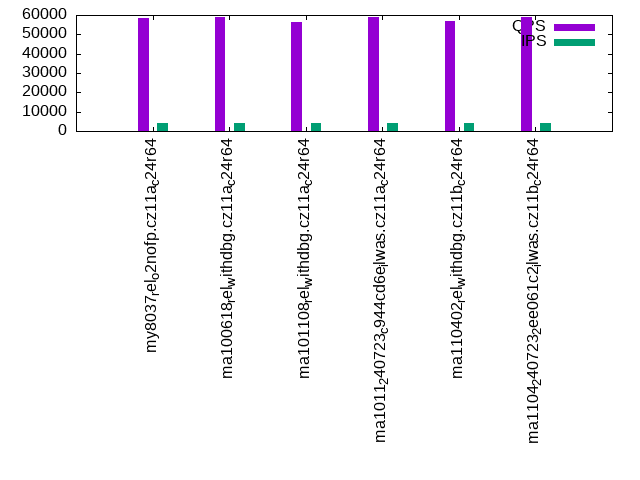
- qr500.L3: range queries with 500 insert/s per client
- qp500.L4: point queries with 500 insert/s per client
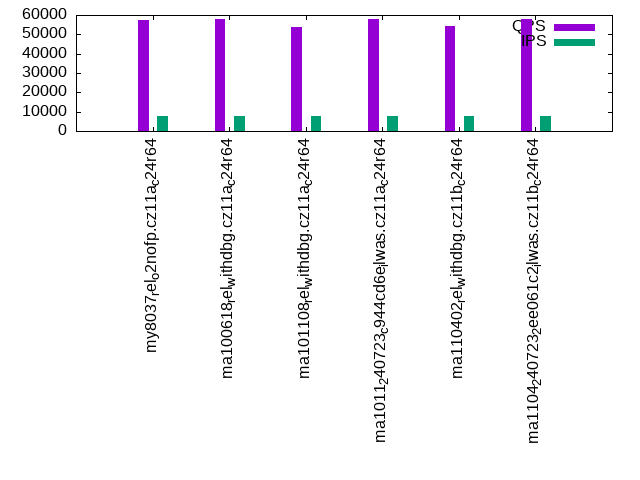
- qr1000.L5: range queries with 1000 insert/s per client
- qp1000.L6: point queries with 1000 insert/s per client
Summary
The numbers are inserts/s for l.i0, l.i1 and l.i2, indexed docs (or rows) /s for l.x and queries/s for qr100, qp100 thru qr1000, qp1000" The values are the average rate over the entire test for inserts (IPS) and queries (QPS). The range of values for IPS and QPS is split into 3 parts: bottom 25%, middle 50%, top 25%. Values in the bottom 25% have a red background, values in the top 25% have a green background and values in the middle have no color. A gray background is used for values that can be ignored because the DBMS did not sustain the target insert rate. Red backgrounds are not used when the minimum value is within 80% of the max value.
| dbms | l.i0 | l.x | l.i1 | l.i2 | qr100 | qp100 | qr500 | qp500 | qr1000 | qp1000 |
|---|---|---|---|---|---|---|---|---|---|---|
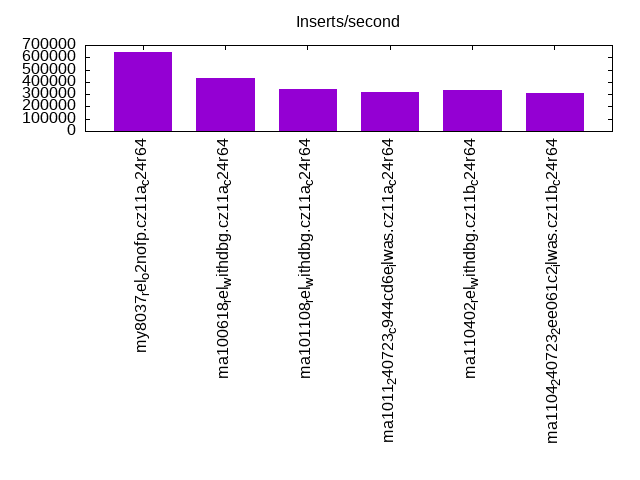
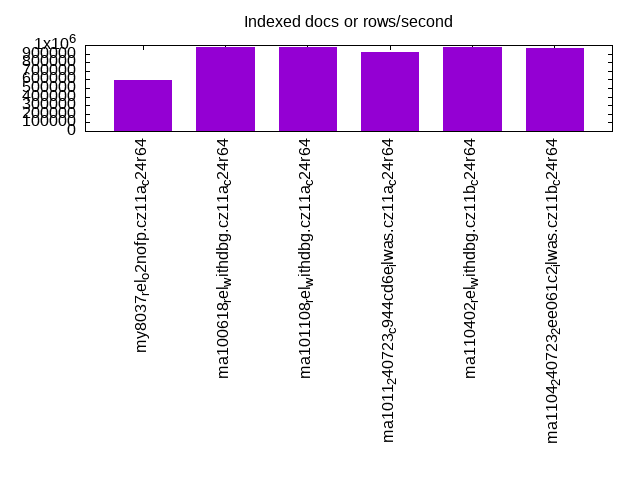
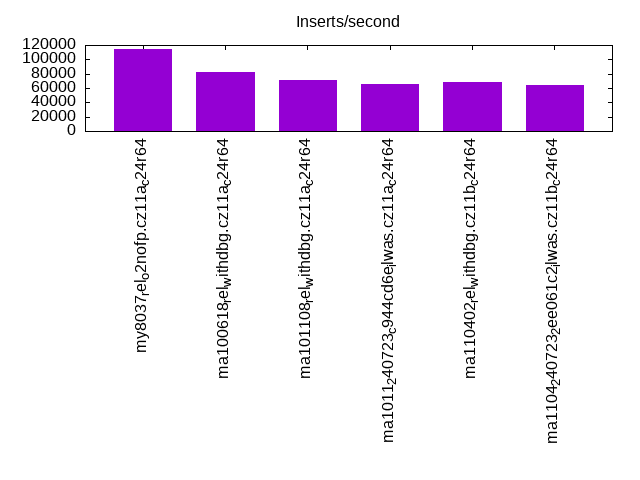
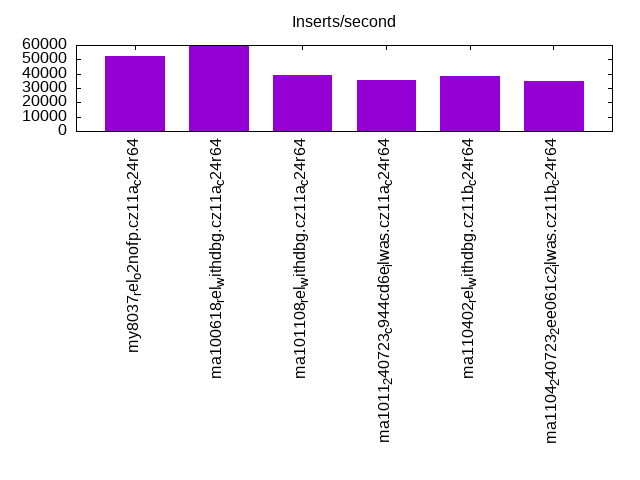
| my8037_rel_o2nofp.cz11a_c24r64 | 640000 | 597016 | 114942 | 52459 | 59115 | 42416 | 58621 | 41753 | 57568 | 41877 |
| ma100618_rel_withdbg.cz11a_c24r64 | 434783 | 975611 | 81967 | 59480 | 60249 | 48748 | 58905 | 47570 | 57900 | 46816 |
| ma101108_rel_withdbg.cz11a_c24r64 | 344828 | 975611 | 71190 | 39005 | 58905 | 47801 | 56366 | 46509 | 53861 | 46218 |
| ma1011_240723_c944cd6e_ilwas.cz11a_c24r64 | 317460 | 919541 | 65884 | 35635 | 59908 | 48102 | 59036 | 46979 | 58123 | 45786 |
| ma110402_rel_withdbg.cz11b_c24r64 | 337553 | 975611 | 67868 | 38168 | 59251 | 48089 | 56684 | 46940 | 54072 | 46314 |
| ma1104_240723_2ee061c2_ilwas.cz11b_c24r64 | 306513 | 963857 | 63732 | 34587 | 59512 | 48116 | 58806 | 47105 | 57937 | 45951 |
This table has relative throughput, throughput for the DBMS relative to the DBMS in the first line, using the absolute throughput from the previous table. Values less than 0.95 have a yellow background. Values greater than 1.05 have a blue background.
| dbms | l.i0 | l.x | l.i1 | l.i2 | qr100 | qp100 | qr500 | qp500 | qr1000 | qp1000 |
|---|---|---|---|---|---|---|---|---|---|---|
| my8037_rel_o2nofp.cz11a_c24r64 | 1.00 | 1.00 | 1.00 | 1.00 | 1.00 | 1.00 | 1.00 | 1.00 | 1.00 | 1.00 |
| ma100618_rel_withdbg.cz11a_c24r64 | 0.68 | 1.63 | 0.71 | 1.13 | 1.02 | 1.15 | 1.00 | 1.14 | 1.01 | 1.12 |
| ma101108_rel_withdbg.cz11a_c24r64 | 0.54 | 1.63 | 0.62 | 0.74 | 1.00 | 1.13 | 0.96 | 1.11 | 0.94 | 1.10 |
| ma1011_240723_c944cd6e_ilwas.cz11a_c24r64 | 0.50 | 1.54 | 0.57 | 0.68 | 1.01 | 1.13 | 1.01 | 1.13 | 1.01 | 1.09 |
| ma110402_rel_withdbg.cz11b_c24r64 | 0.53 | 1.63 | 0.59 | 0.73 | 1.00 | 1.13 | 0.97 | 1.12 | 0.94 | 1.11 |
| ma1104_240723_2ee061c2_ilwas.cz11b_c24r64 | 0.48 | 1.61 | 0.55 | 0.66 | 1.01 | 1.13 | 1.00 | 1.13 | 1.01 | 1.10 |
This lists the average rate of inserts/s for the tests that do inserts concurrent with queries. For such tests the query rate is listed in the table above. The read+write tests are setup so that the insert rate should match the target rate every second. Cells that are not at least 95% of the target have a red background to indicate a failure to satisfy the target.
| dbms | qr100.L1 | qp100.L2 | qr500.L3 | qp500.L4 | qr1000.L5 | qp1000.L6 |
|---|---|---|---|---|---|---|
| my8037_rel_o2nofp.cz11a_c24r64 | 796 | 796 | 3980 | 3980 | 7960 | 7960 |
| ma100618_rel_withdbg.cz11a_c24r64 | 796 | 796 | 3980 | 3980 | 7960 | 7965 |
| ma101108_rel_withdbg.cz11a_c24r64 | 796 | 796 | 3980 | 3980 | 7960 | 7960 |
| ma1011_240723_c944cd6e_ilwas.cz11a_c24r64 | 796 | 796 | 3980 | 3980 | 7965 | 7960 |
| ma110402_rel_withdbg.cz11b_c24r64 | 796 | 796 | 3980 | 3980 | 7960 | 7960 |
| ma1104_240723_2ee061c2_ilwas.cz11b_c24r64 | 796 | 796 | 3980 | 3982 | 7960 | 7960 |
| target | 800 | 800 | 4000 | 4000 | 8000 | 8000 |
l.i0
l.i0: load without secondary indexes. Graphs for performance per 1-second interval are here.
Average throughput:
Insert response time histogram: each cell has the percentage of responses that take <= the time in the header and max is the max response time in seconds. For the max column values in the top 25% of the range have a red background and in the bottom 25% of the range have a green background. The red background is not used when the min value is within 80% of the max value.
| dbms | 256us | 1ms | 4ms | 16ms | 64ms | 256ms | 1s | 4s | 16s | gt | max |
|---|---|---|---|---|---|---|---|---|---|---|---|
| my8037_rel_o2nofp.cz11a_c24r64 | 78.948 | 20.921 | 0.067 | 0.042 | 0.009 | 0.014 | 0.488 | ||||
| ma100618_rel_withdbg.cz11a_c24r64 | 29.617 | 70.153 | 0.190 | 0.007 | 0.002 | 0.032 | 0.447 | ||||
| ma101108_rel_withdbg.cz11a_c24r64 | 7.953 | 89.022 | 2.977 | 0.015 | 0.001 | 0.032 | 0.446 | ||||
| ma1011_240723_c944cd6e_ilwas.cz11a_c24r64 | 8.705 | 84.298 | 6.951 | 0.014 | 0.001 | 0.032 | 0.430 | ||||
| ma110402_rel_withdbg.cz11b_c24r64 | 8.379 | 88.199 | 3.375 | 0.013 | 0.001 | 0.032 | 0.454 | ||||
| ma1104_240723_2ee061c2_ilwas.cz11b_c24r64 | 5.209 | 88.031 | 6.711 | 0.016 | 0.001 | 0.032 | 0.452 |
Performance metrics for the DBMS listed above. Some are normalized by throughput, others are not. Legend for results is here.
ips	qps	rps	rmbps	wps	wmbps	rpq	rkbpq	wpi	wkbpi	csps	cpups	cspq	cpupq	dbgb1	dbgb2	rss	maxop	p50	p99	tag
640000	0	0	0.0	1589.2	181.8	0.000	0.000	0.002	0.291	120028	61.6	0.188	15	5.3	55.9	8.9	0.488	95327	54342	my8037_rel_o2nofp.cz11a_c24r64
434783	0	0	0.0	1276.3	105.0	0.000	0.000	0.003	0.247	478073	60.5	1.100	22	5.3	56.1	6.1	0.447	59254	39670	ma100618_rel_withdbg.cz11a_c24r64
344828	0	0	0.0	1091.1	86.7	0.000	0.000	0.003	0.258	222418	48.1	0.645	22	5.3	56.1	5.7	0.446	45362	29876	ma101108_rel_withdbg.cz11a_c24r64
317460	0	0	0.0	1021.2	79.9	0.000	0.000	0.003	0.258	256255	52.6	0.807	27	5.3	56.1	6.0	0.430	40568	25872	ma1011_240723_c944cd6e_ilwas.cz11a_c24r64
337553	0	0	0.0	1072.9	84.8	0.000	0.000	0.003	0.257	246747	47.8	0.731	23	5.3	56.1	6.3	0.454	44253	29768	ma110402_rel_withdbg.cz11b_c24r64
306513	0	0	0.0	983.4	77.0	0.000	0.000	0.003	0.257	288857	52.0	0.942	27	5.3	56.1	5.8	0.452	39358	25872	ma1104_240723_2ee061c2_ilwas.cz11b_c24r64
l.x
l.x: create secondary indexes.
Average throughput:
Performance metrics for the DBMS listed above. Some are normalized by throughput, others are not. Legend for results is here.
ips	qps	rps	rmbps	wps	wmbps	rpq	rkbpq	wpi	wkbpi	csps	cpups	cspq	cpupq	dbgb1	dbgb2	rss	maxop	p50	p99	tag
597016	0	3488	210.8	13286.7	640.5	0.006	0.362	0.022	1.099	40304	47.8	0.068	13	12.1	62.7	14.2	0.002	NA	NA	my8037_rel_o2nofp.cz11a_c24r64
975611	0	0	0.0	4308.4	692.1	0.000	0.000	0.004	0.726	14322	25.9	0.015	4	11.2	62.1	10.0	0.001	NA	NA	ma100618_rel_withdbg.cz11a_c24r64
975611	0	0	0.0	3933.3	685.2	0.000	0.000	0.004	0.719	12374	27.0	0.013	4	11.2	62.1	9.7	0.001	NA	NA	ma101108_rel_withdbg.cz11a_c24r64
919541	0	0	0.0	4122.5	657.8	0.000	0.000	0.004	0.733	13243	27.4	0.014	5	11.2	62.1	9.5	0.001	NA	NA	ma1011_240723_c944cd6e_ilwas.cz11a_c24r64
975611	0	0	0.0	3850.4	684.9	0.000	0.000	0.004	0.719	12391	27.2	0.013	4	11.2	62.1	9.8	0.001	NA	NA	ma110402_rel_withdbg.cz11b_c24r64
963857	0	0	0.0	3988.1	687.1	0.000	0.000	0.004	0.730	12306	28.4	0.013	5	11.2	62.1	9.6	0.001	NA	NA	ma1104_240723_2ee061c2_ilwas.cz11b_c24r64
l.i1
l.i1: continue load after secondary indexes created with 50 inserts per transaction. Graphs for performance per 1-second interval are here.
Average throughput:
Insert response time histogram: each cell has the percentage of responses that take <= the time in the header and max is the max response time in seconds. For the max column values in the top 25% of the range have a red background and in the bottom 25% of the range have a green background. The red background is not used when the min value is within 80% of the max value.
| dbms | 256us | 1ms | 4ms | 16ms | 64ms | 256ms | 1s | 4s | 16s | gt | max |
|---|---|---|---|---|---|---|---|---|---|---|---|
| my8037_rel_o2nofp.cz11a_c24r64 | 80.216 | 19.407 | 0.320 | 0.038 | 0.018 | nonzero | 1.242 | ||||
| ma100618_rel_withdbg.cz11a_c24r64 | 0.008 | 38.927 | 60.480 | 0.511 | 0.026 | 0.048 | 0.735 | ||||
| ma101108_rel_withdbg.cz11a_c24r64 | 0.001 | 26.880 | 71.980 | 1.085 | 0.028 | 0.026 | 0.728 | ||||
| ma1011_240723_c944cd6e_ilwas.cz11a_c24r64 | 0.008 | 16.593 | 82.686 | 0.650 | 0.018 | 0.046 | nonzero | 1.061 | |||
| ma110402_rel_withdbg.cz11b_c24r64 | 0.001 | 21.293 | 77.565 | 1.094 | 0.021 | 0.025 | 0.650 | ||||
| ma1104_240723_2ee061c2_ilwas.cz11b_c24r64 | 0.007 | 15.255 | 83.969 | 0.709 | 0.019 | 0.041 | 0.728 |
Delete response time histogram: each cell has the percentage of responses that take <= the time in the header and max is the max response time in seconds. For the max column values in the top 25% of the range have a red background and in the bottom 25% of the range have a green background. The red background is not used when the min value is within 80% of the max value.
| dbms | 256us | 1ms | 4ms | 16ms | 64ms | 256ms | 1s | 4s | 16s | gt | max |
|---|---|---|---|---|---|---|---|---|---|---|---|
| my8037_rel_o2nofp.cz11a_c24r64 | 0.070 | 85.464 | 14.175 | 0.245 | 0.030 | 0.016 | 0.699 | ||||
| ma100618_rel_withdbg.cz11a_c24r64 | 0.060 | 58.050 | 41.459 | 0.363 | 0.025 | 0.043 | 0.741 | ||||
| ma101108_rel_withdbg.cz11a_c24r64 | 0.027 | 41.785 | 57.293 | 0.851 | 0.021 | 0.023 | 0.728 | ||||
| ma1011_240723_c944cd6e_ilwas.cz11a_c24r64 | 0.065 | 30.360 | 69.065 | 0.449 | 0.018 | 0.043 | 0.771 | ||||
| ma110402_rel_withdbg.cz11b_c24r64 | 0.021 | 32.975 | 66.093 | 0.872 | 0.017 | 0.022 | 0.649 | ||||
| ma1104_240723_2ee061c2_ilwas.cz11b_c24r64 | 0.050 | 21.547 | 77.758 | 0.588 | 0.018 | 0.038 | 0.726 |
Performance metrics for the DBMS listed above. Some are normalized by throughput, others are not. Legend for results is here.
ips	qps	rps	rmbps	wps	wmbps	rpq	rkbpq	wpi	wkbpi	csps	cpups	cspq	cpupq	dbgb1	dbgb2	rss	maxop	p50	p99	tag
114942	0	139	2.2	8087.0	386.5	0.001	0.019	0.070	3.443	180773	77.6	1.573	108	17.3	68.1	21.4	1.242	15038	6293	my8037_rel_o2nofp.cz11a_c24r64
81967	0	0	0.0	8432.4	308.9	0.000	0.000	0.103	3.860	594816	73.4	7.257	143	17.0	69.4	19.7	0.735	10538	4595	ma100618_rel_withdbg.cz11a_c24r64
71190	0	2644	10.3	6714.8	260.8	0.037	0.149	0.094	3.752	295989	54.8	4.158	123	16.0	67.8	16.9	0.728	8990	5646	ma101108_rel_withdbg.cz11a_c24r64
65884	0	0	0.0	6990.8	251.0	0.000	0.000	0.106	3.901	338770	68.8	5.142	167	17.1	69.4	19.6	1.061	8392	3746	ma1011_240723_c944cd6e_ilwas.cz11a_c24r64
67868	0	2621	10.2	6568.3	251.5	0.039	0.154	0.097	3.794	314418	53.9	4.633	127	15.2	66.4	16.5	0.650	8590	5744	ma110402_rel_withdbg.cz11b_c24r64
63732	0	0	0.0	6841.5	250.4	0.000	0.000	0.107	4.023	356516	67.2	5.594	169	16.0	68.5	18.6	0.728	8141	4196	ma1104_240723_2ee061c2_ilwas.cz11b_c24r64
l.i2
l.i2: continue load after secondary indexes created with 5 inserts per transaction. Graphs for performance per 1-second interval are here.
Average throughput:
Insert response time histogram: each cell has the percentage of responses that take <= the time in the header and max is the max response time in seconds. For the max column values in the top 25% of the range have a red background and in the bottom 25% of the range have a green background. The red background is not used when the min value is within 80% of the max value.
| dbms | 256us | 1ms | 4ms | 16ms | 64ms | 256ms | 1s | 4s | 16s | gt | max |
|---|---|---|---|---|---|---|---|---|---|---|---|
| my8037_rel_o2nofp.cz11a_c24r64 | 0.237 | 85.768 | 13.879 | 0.083 | 0.029 | 0.002 | 0.003 | 0.571 | |||
| ma100618_rel_withdbg.cz11a_c24r64 | 2.759 | 88.806 | 8.147 | 0.273 | 0.011 | nonzero | 0.004 | 0.594 | |||
| ma101108_rel_withdbg.cz11a_c24r64 | 0.322 | 69.724 | 29.612 | 0.283 | 0.055 | nonzero | 0.004 | 0.512 | |||
| ma1011_240723_c944cd6e_ilwas.cz11a_c24r64 | 0.497 | 50.847 | 48.398 | 0.238 | 0.016 | nonzero | 0.004 | 0.543 | |||
| ma110402_rel_withdbg.cz11b_c24r64 | 0.306 | 67.273 | 32.087 | 0.275 | 0.054 | 0.001 | 0.004 | 0.503 | |||
| ma1104_240723_2ee061c2_ilwas.cz11b_c24r64 | 0.519 | 48.514 | 50.709 | 0.249 | 0.006 | 0.004 | 0.532 |
Delete response time histogram: each cell has the percentage of responses that take <= the time in the header and max is the max response time in seconds. For the max column values in the top 25% of the range have a red background and in the bottom 25% of the range have a green background. The red background is not used when the min value is within 80% of the max value.
| dbms | 256us | 1ms | 4ms | 16ms | 64ms | 256ms | 1s | 4s | 16s | gt | max |
|---|---|---|---|---|---|---|---|---|---|---|---|
| my8037_rel_o2nofp.cz11a_c24r64 | 0.318 | 86.344 | 13.222 | 0.082 | 0.029 | 0.002 | 0.003 | 0.569 | |||
| ma100618_rel_withdbg.cz11a_c24r64 | 3.327 | 88.075 | 8.329 | 0.255 | 0.010 | nonzero | 0.004 | 0.593 | |||
| ma101108_rel_withdbg.cz11a_c24r64 | 0.386 | 69.979 | 29.309 | 0.267 | 0.055 | 0.001 | 0.004 | 0.512 | |||
| ma1011_240723_c944cd6e_ilwas.cz11a_c24r64 | 0.709 | 53.294 | 45.764 | 0.213 | 0.015 | nonzero | 0.004 | 0.543 | |||
| ma110402_rel_withdbg.cz11b_c24r64 | 0.374 | 67.372 | 31.934 | 0.263 | 0.053 | nonzero | 0.004 | 0.502 | |||
| ma1104_240723_2ee061c2_ilwas.cz11b_c24r64 | 0.507 | 48.425 | 50.824 | 0.234 | 0.005 | 0.004 | 0.532 |
Performance metrics for the DBMS listed above. Some are normalized by throughput, others are not. Legend for results is here.
ips	qps	rps	rmbps	wps	wmbps	rpq	rkbpq	wpi	wkbpi	csps	cpups	cspq	cpupq	dbgb1	dbgb2	rss	maxop	p50	p99	tag
52459	0	0	0.0	4580.7	199.2	0.000	0.000	0.087	3.889	263807	71.5	5.029	218	17.3	68.1	21.4	0.571	6694	3501	my8037_rel_o2nofp.cz11a_c24r64
59480	0	0	0.0	5272.4	209.7	0.000	0.000	0.089	3.610	396907	70.4	6.673	189	17.0	69.4	19.8	0.594	7597	4860	ma100618_rel_withdbg.cz11a_c24r64
39005	0	3595	14.0	3578.5	142.7	0.092	0.369	0.092	3.747	274281	46.8	7.032	192	16.0	67.8	16.7	0.512	4935	3296	ma101108_rel_withdbg.cz11a_c24r64
35635	0	0	0.0	3311.3	131.8	0.000	0.000	0.093	3.787	480863	58.2	13.494	261	17.1	69.4	19.7	0.543	4507	3097	ma1011_240723_c944cd6e_ilwas.cz11a_c24r64
38168	0	3552	13.9	3523.6	139.9	0.093	0.372	0.092	3.753	279046	46.5	7.311	195	15.2	66.4	16.4	0.503	4824	3316	ma110402_rel_withdbg.cz11b_c24r64
34587	0	0	0.0	3137.6	125.1	0.000	0.000	0.091	3.703	476226	57.7	13.769	267	16.0	68.5	18.6	0.532	4351	3097	ma1104_240723_2ee061c2_ilwas.cz11b_c24r64
qr100.L1
qr100.L1: range queries with 100 insert/s per client. Graphs for performance per 1-second interval are here.
Average throughput:
Query response time histogram: each cell has the percentage of responses that take <= the time in the header and max is the max response time in seconds. For max values in the top 25% of the range have a red background and in the bottom 25% of the range have a green background. The red background is not used when the min value is within 80% of the max value.
| dbms | 256us | 1ms | 4ms | 16ms | 64ms | 256ms | 1s | 4s | 16s | gt | max |
|---|---|---|---|---|---|---|---|---|---|---|---|
| my8037_rel_o2nofp.cz11a_c24r64 | 99.964 | 0.036 | 0.001 | nonzero | 0.013 | ||||||
| ma100618_rel_withdbg.cz11a_c24r64 | 99.973 | 0.026 | 0.001 | 0.004 | |||||||
| ma101108_rel_withdbg.cz11a_c24r64 | 99.967 | 0.032 | 0.001 | nonzero | 0.006 | ||||||
| ma1011_240723_c944cd6e_ilwas.cz11a_c24r64 | 99.977 | 0.022 | 0.001 | 0.004 | |||||||
| ma110402_rel_withdbg.cz11b_c24r64 | 99.964 | 0.034 | 0.002 | nonzero | 0.005 | ||||||
| ma1104_240723_2ee061c2_ilwas.cz11b_c24r64 | 99.979 | 0.020 | 0.001 | nonzero | 0.004 |
Insert response time histogram: each cell has the percentage of responses that take <= the time in the header and max is the max response time in seconds. For max values in the top 25% of the range have a red background and in the bottom 25% of the range have a green background. The red background is not used when the min value is within 80% of the max value.
| dbms | 256us | 1ms | 4ms | 16ms | 64ms | 256ms | 1s | 4s | 16s | gt | max |
|---|---|---|---|---|---|---|---|---|---|---|---|
| my8037_rel_o2nofp.cz11a_c24r64 | 98.330 | 1.670 | 0.009 | ||||||||
| ma100618_rel_withdbg.cz11a_c24r64 | 0.267 | 98.753 | 0.979 | 0.012 | |||||||
| ma101108_rel_withdbg.cz11a_c24r64 | 0.014 | 80.569 | 19.417 | 0.008 | |||||||
| ma1011_240723_c944cd6e_ilwas.cz11a_c24r64 | 1.479 | 86.851 | 11.670 | 0.007 | |||||||
| ma110402_rel_withdbg.cz11b_c24r64 | 0.007 | 74.483 | 25.510 | 0.008 | |||||||
| ma1104_240723_2ee061c2_ilwas.cz11b_c24r64 | 0.174 | 95.285 | 4.542 | 0.007 |
Delete response time histogram: each cell has the percentage of responses that take <= the time in the header and max is the max response time in seconds. For max values in the top 25% of the range have a red background and in the bottom 25% of the range have a green background. The red background is not used when the min value is within 80% of the max value.
| dbms | 256us | 1ms | 4ms | 16ms | 64ms | 256ms | 1s | 4s | 16s | gt | max |
|---|---|---|---|---|---|---|---|---|---|---|---|
| my8037_rel_o2nofp.cz11a_c24r64 | 0.597 | 98.455 | 0.948 | 0.010 | |||||||
| ma100618_rel_withdbg.cz11a_c24r64 | 7.135 | 92.233 | 0.632 | 0.009 | |||||||
| ma101108_rel_withdbg.cz11a_c24r64 | 0.330 | 84.872 | 14.799 | 0.009 | |||||||
| ma1011_240723_c944cd6e_ilwas.cz11a_c24r64 | 10.781 | 81.875 | 7.344 | 0.007 | |||||||
| ma110402_rel_withdbg.cz11b_c24r64 | 0.278 | 80.076 | 19.646 | 0.008 | |||||||
| ma1104_240723_2ee061c2_ilwas.cz11b_c24r64 | 1.833 | 95.622 | 2.545 | 0.008 |
Performance metrics for the DBMS listed above. Some are normalized by throughput, others are not. Legend for results is here.
ips	qps	rps	rmbps	wps	wmbps	rpq	rkbpq	wpi	wkbpi	csps	cpups	cspq	cpupq	dbgb1	dbgb2	rss	maxop	p50	p99	tag
796	59115	0	0.0	1002.1	28.5	0.000	0.000	1.259	36.656	219994	50.3	3.721	136	17.3	68.1	21.4	0.013	7480	7224	my8037_rel_o2nofp.cz11a_c24r64
796	60249	0	0.0	5.0	0.8	0.000	0.000	0.006	1.080	226620	50.5	3.761	134	17.0	69.4	19.4	0.004	7576	7352	ma100618_rel_withdbg.cz11a_c24r64
796	58905	22	0.1	5.0	0.9	0.000	0.001	0.006	1.100	220422	50.4	3.742	137	16.0	67.8	16.5	0.006	7464	7240	ma101108_rel_withdbg.cz11a_c24r64
796	59908	0	0.0	5.1	0.9	0.000	0.000	0.006	1.114	225518	50.5	3.764	135	17.1	69.4	19.3	0.004	7544	7306	ma1011_240723_c944cd6e_ilwas.cz11a_c24r64
796	59251	24	0.1	5.1	0.9	0.000	0.002	0.006	1.104	222354	50.5	3.753	136	15.2	66.4	16.3	0.005	7442	7192	ma110402_rel_withdbg.cz11b_c24r64
796	59512	0	0.0	5.1	0.9	0.000	0.000	0.006	1.104	223467	50.5	3.755	136	16.0	68.5	18.2	0.004	7464	7256	ma1104_240723_2ee061c2_ilwas.cz11b_c24r64
qp100.L2
qp100.L2: point queries with 100 insert/s per client. Graphs for performance per 1-second interval are here.
Average throughput:
Query response time histogram: each cell has the percentage of responses that take <= the time in the header and max is the max response time in seconds. For max values in the top 25% of the range have a red background and in the bottom 25% of the range have a green background. The red background is not used when the min value is within 80% of the max value.
| dbms | 256us | 1ms | 4ms | 16ms | 64ms | 256ms | 1s | 4s | 16s | gt | max |
|---|---|---|---|---|---|---|---|---|---|---|---|
| my8037_rel_o2nofp.cz11a_c24r64 | 98.499 | 1.491 | 0.010 | 0.004 | |||||||
| ma100618_rel_withdbg.cz11a_c24r64 | 99.320 | 0.674 | 0.006 | 0.004 | |||||||
| ma101108_rel_withdbg.cz11a_c24r64 | 99.276 | 0.717 | 0.008 | nonzero | 0.004 | ||||||
| ma1011_240723_c944cd6e_ilwas.cz11a_c24r64 | 99.254 | 0.738 | 0.008 | nonzero | 0.007 | ||||||
| ma110402_rel_withdbg.cz11b_c24r64 | 99.279 | 0.713 | 0.009 | 0.004 | |||||||
| ma1104_240723_2ee061c2_ilwas.cz11b_c24r64 | 99.242 | 0.750 | 0.008 | nonzero | 0.005 |
Insert response time histogram: each cell has the percentage of responses that take <= the time in the header and max is the max response time in seconds. For max values in the top 25% of the range have a red background and in the bottom 25% of the range have a green background. The red background is not used when the min value is within 80% of the max value.
| dbms | 256us | 1ms | 4ms | 16ms | 64ms | 256ms | 1s | 4s | 16s | gt | max |
|---|---|---|---|---|---|---|---|---|---|---|---|
| my8037_rel_o2nofp.cz11a_c24r64 | 99.677 | 0.323 | 0.006 | ||||||||
| ma100618_rel_withdbg.cz11a_c24r64 | 0.003 | 95.611 | 4.385 | 0.006 | |||||||
| ma101108_rel_withdbg.cz11a_c24r64 | 0.028 | 77.042 | 22.931 | 0.008 | |||||||
| ma1011_240723_c944cd6e_ilwas.cz11a_c24r64 | 0.010 | 61.639 | 38.351 | 0.008 | |||||||
| ma110402_rel_withdbg.cz11b_c24r64 | 0.125 | 91.375 | 8.500 | 0.008 | |||||||
| ma1104_240723_2ee061c2_ilwas.cz11b_c24r64 | 0.017 | 71.941 | 28.042 | 0.008 |
Delete response time histogram: each cell has the percentage of responses that take <= the time in the header and max is the max response time in seconds. For max values in the top 25% of the range have a red background and in the bottom 25% of the range have a green background. The red background is not used when the min value is within 80% of the max value.
| dbms | 256us | 1ms | 4ms | 16ms | 64ms | 256ms | 1s | 4s | 16s | gt | max |
|---|---|---|---|---|---|---|---|---|---|---|---|
| my8037_rel_o2nofp.cz11a_c24r64 | 0.049 | 99.851 | 0.101 | 0.006 | |||||||
| ma100618_rel_withdbg.cz11a_c24r64 | 0.420 | 97.934 | 1.646 | 0.006 | |||||||
| ma101108_rel_withdbg.cz11a_c24r64 | 0.378 | 84.531 | 15.090 | 0.008 | |||||||
| ma1011_240723_c944cd6e_ilwas.cz11a_c24r64 | 0.250 | 72.792 | 26.958 | 0.007 | |||||||
| ma110402_rel_withdbg.cz11b_c24r64 | 0.545 | 94.465 | 4.990 | 0.013 | |||||||
| ma1104_240723_2ee061c2_ilwas.cz11b_c24r64 | 0.361 | 78.757 | 20.882 | 0.008 |
Performance metrics for the DBMS listed above. Some are normalized by throughput, others are not. Legend for results is here.
ips	qps	rps	rmbps	wps	wmbps	rpq	rkbpq	wpi	wkbpi	csps	cpups	cspq	cpupq	dbgb1	dbgb2	rss	maxop	p50	p99	tag
796	42416	0	0.0	109.5	3.7	0.000	0.000	0.138	4.768	165233	48.7	3.896	184	17.3	68.2	21.4	0.004	5335	5210	my8037_rel_o2nofp.cz11a_c24r64
796	48748	0	0.0	10.4	1.0	0.000	0.000	0.013	1.292	190109	49.1	3.900	161	17.0	69.4	19.4	0.004	6121	5914	ma100618_rel_withdbg.cz11a_c24r64
796	47801	23	0.1	5.0	0.8	0.000	0.002	0.006	1.090	186157	48.9	3.894	164	16.0	67.8	16.5	0.004	6010	5802	ma101108_rel_withdbg.cz11a_c24r64
796	48102	0	0.0	10.6	1.0	0.000	0.000	0.013	1.327	187610	49.1	3.900	163	17.1	69.4	19.3	0.007	6042	5850	ma1011_240723_c944cd6e_ilwas.cz11a_c24r64
796	48089	23	0.1	10.8	1.0	0.000	0.002	0.014	1.323	186848	48.9	3.885	163	15.2	66.4	16.3	0.004	6042	5877	ma110402_rel_withdbg.cz11b_c24r64
796	48116	0	0.0	5.1	0.9	0.000	0.000	0.006	1.097	187351	48.9	3.894	163	16.0	68.5	18.2	0.005	6027	5850	ma1104_240723_2ee061c2_ilwas.cz11b_c24r64
qr500.L3
qr500.L3: range queries with 500 insert/s per client. Graphs for performance per 1-second interval are here.
Average throughput:
Query response time histogram: each cell has the percentage of responses that take <= the time in the header and max is the max response time in seconds. For max values in the top 25% of the range have a red background and in the bottom 25% of the range have a green background. The red background is not used when the min value is within 80% of the max value.
| dbms | 256us | 1ms | 4ms | 16ms | 64ms | 256ms | 1s | 4s | 16s | gt | max |
|---|---|---|---|---|---|---|---|---|---|---|---|
| my8037_rel_o2nofp.cz11a_c24r64 | 99.920 | 0.063 | 0.015 | 0.001 | nonzero | 0.025 | |||||
| ma100618_rel_withdbg.cz11a_c24r64 | 99.801 | 0.191 | 0.006 | 0.002 | nonzero | 0.033 | |||||
| ma101108_rel_withdbg.cz11a_c24r64 | 99.536 | 0.450 | 0.012 | 0.002 | nonzero | 0.033 | |||||
| ma1011_240723_c944cd6e_ilwas.cz11a_c24r64 | 99.884 | 0.109 | 0.005 | 0.002 | nonzero | 0.033 | |||||
| ma110402_rel_withdbg.cz11b_c24r64 | 99.567 | 0.421 | 0.012 | nonzero | nonzero | 0.016 | |||||
| ma1104_240723_2ee061c2_ilwas.cz11b_c24r64 | 99.881 | 0.115 | 0.004 | nonzero | nonzero | 0.036 |
Insert response time histogram: each cell has the percentage of responses that take <= the time in the header and max is the max response time in seconds. For max values in the top 25% of the range have a red background and in the bottom 25% of the range have a green background. The red background is not used when the min value is within 80% of the max value.
| dbms | 256us | 1ms | 4ms | 16ms | 64ms | 256ms | 1s | 4s | 16s | gt | max |
|---|---|---|---|---|---|---|---|---|---|---|---|
| my8037_rel_o2nofp.cz11a_c24r64 | 84.204 | 15.693 | 0.103 | 0.026 | |||||||
| ma100618_rel_withdbg.cz11a_c24r64 | 0.408 | 83.742 | 15.809 | 0.042 | 0.034 | ||||||
| ma101108_rel_withdbg.cz11a_c24r64 | 0.044 | 56.171 | 43.742 | 0.043 | 0.035 | ||||||
| ma1011_240723_c944cd6e_ilwas.cz11a_c24r64 | 0.235 | 51.901 | 47.808 | 0.056 | 0.031 | ||||||
| ma110402_rel_withdbg.cz11b_c24r64 | 0.028 | 49.190 | 50.745 | 0.036 | 0.052 | ||||||
| ma1104_240723_2ee061c2_ilwas.cz11b_c24r64 | 0.162 | 43.905 | 55.863 | 0.071 | 0.045 |
Delete response time histogram: each cell has the percentage of responses that take <= the time in the header and max is the max response time in seconds. For max values in the top 25% of the range have a red background and in the bottom 25% of the range have a green background. The red background is not used when the min value is within 80% of the max value.
| dbms | 256us | 1ms | 4ms | 16ms | 64ms | 256ms | 1s | 4s | 16s | gt | max |
|---|---|---|---|---|---|---|---|---|---|---|---|
| my8037_rel_o2nofp.cz11a_c24r64 | 0.460 | 89.476 | 10.032 | 0.033 | 0.021 | ||||||
| ma100618_rel_withdbg.cz11a_c24r64 | 0.762 | 89.319 | 9.892 | 0.027 | 0.030 | ||||||
| ma101108_rel_withdbg.cz11a_c24r64 | 0.128 | 66.674 | 33.170 | 0.027 | 0.031 | ||||||
| ma1011_240723_c944cd6e_ilwas.cz11a_c24r64 | 0.401 | 61.578 | 37.988 | 0.034 | 0.029 | ||||||
| ma110402_rel_withdbg.cz11b_c24r64 | 0.113 | 58.227 | 41.636 | 0.024 | 0.027 | ||||||
| ma1104_240723_2ee061c2_ilwas.cz11b_c24r64 | 0.224 | 50.564 | 49.178 | 0.035 | 0.027 |
Performance metrics for the DBMS listed above. Some are normalized by throughput, others are not. Legend for results is here.
ips	qps	rps	rmbps	wps	wmbps	rpq	rkbpq	wpi	wkbpi	csps	cpups	cspq	cpupq	dbgb1	dbgb2	rss	maxop	p50	p99	tag
3980	58621	0	0.0	587.4	20.8	0.000	0.000	0.148	5.348	215022	51.8	3.668	141	17.3	68.2	21.4	0.025	7336	7081	my8037_rel_o2nofp.cz11a_c24r64
3980	58905	0	0.0	254.4	10.7	0.000	0.000	0.064	2.766	223244	51.9	3.790	141	17.0	69.4	19.4	0.033	7448	6920	ma100618_rel_withdbg.cz11a_c24r64
3980	56366	118	0.5	254.1	10.8	0.002	0.008	0.064	2.781	210830	51.4	3.740	146	16.0	67.8	16.6	0.033	7096	6553	ma101108_rel_withdbg.cz11a_c24r64
3980	59036	0	0.0	256.1	10.9	0.000	0.000	0.064	2.812	224361	52.4	3.800	142	17.1	69.4	19.4	0.033	7448	6953	ma1011_240723_c944cd6e_ilwas.cz11a_c24r64
3980	56684	121	0.5	255.2	10.8	0.002	0.009	0.064	2.781	211942	51.5	3.739	145	15.2	66.4	16.3	0.016	7096	6660	ma110402_rel_withdbg.cz11b_c24r64
3980	58806	0	0.0	262.3	10.9	0.000	0.000	0.066	2.817	223787	52.4	3.806	143	16.0	68.5	18.3	0.036	7371	7128	ma1104_240723_2ee061c2_ilwas.cz11b_c24r64
qp500.L4
qp500.L4: point queries with 500 insert/s per client. Graphs for performance per 1-second interval are here.
Average throughput:

Query response time histogram: each cell has the percentage of responses that take <= the time in the header and max is the max response time in seconds. For max values in the top 25% of the range have a red background and in the bottom 25% of the range have a green background. The red background is not used when the min value is within 80% of the max value.
| dbms | 256us | 1ms | 4ms | 16ms | 64ms | 256ms | 1s | 4s | 16s | gt | max |
|---|---|---|---|---|---|---|---|---|---|---|---|
| my8037_rel_o2nofp.cz11a_c24r64 | 97.833 | 2.096 | 0.070 | 0.002 | nonzero | 0.017 | |||||
| ma100618_rel_withdbg.cz11a_c24r64 | 98.428 | 1.553 | 0.019 | nonzero | 0.011 | ||||||
| ma101108_rel_withdbg.cz11a_c24r64 | 98.350 | 1.628 | 0.021 | nonzero | 0.010 | ||||||
| ma1011_240723_c944cd6e_ilwas.cz11a_c24r64 | 98.296 | 1.687 | 0.017 | nonzero | 0.011 | ||||||
| ma110402_rel_withdbg.cz11b_c24r64 | 98.359 | 1.617 | 0.024 | 0.001 | 0.010 | ||||||
| ma1104_240723_2ee061c2_ilwas.cz11b_c24r64 | 98.265 | 1.716 | 0.019 | nonzero | 0.009 |
Insert response time histogram: each cell has the percentage of responses that take <= the time in the header and max is the max response time in seconds. For max values in the top 25% of the range have a red background and in the bottom 25% of the range have a green background. The red background is not used when the min value is within 80% of the max value.
| dbms | 256us | 1ms | 4ms | 16ms | 64ms | 256ms | 1s | 4s | 16s | gt | max |
|---|---|---|---|---|---|---|---|---|---|---|---|
| my8037_rel_o2nofp.cz11a_c24r64 | 87.244 | 12.734 | 0.022 | 0.020 | |||||||
| ma100618_rel_withdbg.cz11a_c24r64 | 0.454 | 85.808 | 13.694 | 0.044 | 0.027 | ||||||
| ma101108_rel_withdbg.cz11a_c24r64 | 0.028 | 52.990 | 46.942 | 0.039 | 0.027 | ||||||
| ma1011_240723_c944cd6e_ilwas.cz11a_c24r64 | 0.125 | 40.114 | 59.708 | 0.053 | 0.030 | ||||||
| ma110402_rel_withdbg.cz11b_c24r64 | 0.010 | 43.119 | 56.824 | 0.047 | 0.030 | ||||||
| ma1104_240723_2ee061c2_ilwas.cz11b_c24r64 | 0.097 | 35.429 | 64.415 | 0.059 | 0.032 |
Delete response time histogram: each cell has the percentage of responses that take <= the time in the header and max is the max response time in seconds. For max values in the top 25% of the range have a red background and in the bottom 25% of the range have a green background. The red background is not used when the min value is within 80% of the max value.
| dbms | 256us | 1ms | 4ms | 16ms | 64ms | 256ms | 1s | 4s | 16s | gt | max |
|---|---|---|---|---|---|---|---|---|---|---|---|
| my8037_rel_o2nofp.cz11a_c24r64 | 0.177 | 91.663 | 8.151 | 0.009 | 0.020 | ||||||
| ma100618_rel_withdbg.cz11a_c24r64 | 0.655 | 91.099 | 8.221 | 0.026 | 0.027 | ||||||
| ma101108_rel_withdbg.cz11a_c24r64 | 0.084 | 64.676 | 35.206 | 0.033 | 0.027 | ||||||
| ma1011_240723_c944cd6e_ilwas.cz11a_c24r64 | 0.279 | 50.262 | 49.428 | 0.031 | 0.031 | ||||||
| ma110402_rel_withdbg.cz11b_c24r64 | 0.057 | 53.001 | 46.907 | 0.035 | 0.028 | ||||||
| ma1104_240723_2ee061c2_ilwas.cz11b_c24r64 | 0.104 | 41.513 | 58.344 | 0.040 | 0.035 |
Performance metrics for the DBMS listed above. Some are normalized by throughput, others are not. Legend for results is here.
ips	qps	rps	rmbps	wps	wmbps	rpq	rkbpq	wpi	wkbpi	csps	cpups	cspq	cpupq	dbgb1	dbgb2	rss	maxop	p50	p99	tag
3980	41753	0	0.0	599.6	21.2	0.000	0.000	0.151	5.453	157945	50.4	3.783	193	17.3	68.4	21.4	0.017	5239	5068	my8037_rel_o2nofp.cz11a_c24r64
3980	47570	0	0.0	424.8	15.7	0.000	0.000	0.107	4.033	192140	50.4	4.039	170	17.0	69.4	19.4	0.011	5963	5770	ma100618_rel_withdbg.cz11a_c24r64
3980	46509	123	0.5	434.4	16.0	0.003	0.011	0.109	4.115	184627	50.1	3.970	172	16.0	67.8	16.6	0.010	5849	5645	ma101108_rel_withdbg.cz11a_c24r64
3980	46979	0	0.0	435.4	16.1	0.000	0.000	0.109	4.136	190537	50.5	4.056	172	17.1	69.4	19.4	0.011	5898	5705	ma1011_240723_c944cd6e_ilwas.cz11a_c24r64
3980	46940	122	0.5	437.4	16.0	0.003	0.010	0.110	4.119	187350	50.2	3.991	171	15.2	66.4	16.3	0.010	5913	5722	ma110402_rel_withdbg.cz11b_c24r64
3982	47105	0	0.0	434.0	16.0	0.000	0.000	0.109	4.107	191650	50.5	4.069	172	16.0	68.5	18.2	0.009	5902	5706	ma1104_240723_2ee061c2_ilwas.cz11b_c24r64
qr1000.L5
qr1000.L5: range queries with 1000 insert/s per client. Graphs for performance per 1-second interval are here.
Average throughput:
Query response time histogram: each cell has the percentage of responses that take <= the time in the header and max is the max response time in seconds. For max values in the top 25% of the range have a red background and in the bottom 25% of the range have a green background. The red background is not used when the min value is within 80% of the max value.
| dbms | 256us | 1ms | 4ms | 16ms | 64ms | 256ms | 1s | 4s | 16s | gt | max |
|---|---|---|---|---|---|---|---|---|---|---|---|
| my8037_rel_o2nofp.cz11a_c24r64 | 99.751 | 0.206 | 0.040 | 0.003 | nonzero | 0.032 | |||||
| ma100618_rel_withdbg.cz11a_c24r64 | 99.572 | 0.411 | 0.012 | 0.005 | nonzero | 0.044 | |||||
| ma101108_rel_withdbg.cz11a_c24r64 | 98.641 | 1.328 | 0.024 | 0.006 | nonzero | 0.026 | |||||
| ma1011_240723_c944cd6e_ilwas.cz11a_c24r64 | 99.786 | 0.198 | 0.010 | 0.006 | nonzero | 0.051 | |||||
| ma110402_rel_withdbg.cz11b_c24r64 | 98.643 | 1.331 | 0.025 | 0.001 | nonzero | 0.019 | |||||
| ma1104_240723_2ee061c2_ilwas.cz11b_c24r64 | 99.773 | 0.217 | 0.009 | 0.001 | nonzero | 0.024 |
Insert response time histogram: each cell has the percentage of responses that take <= the time in the header and max is the max response time in seconds. For max values in the top 25% of the range have a red background and in the bottom 25% of the range have a green background. The red background is not used when the min value is within 80% of the max value.
| dbms | 256us | 1ms | 4ms | 16ms | 64ms | 256ms | 1s | 4s | 16s | gt | max |
|---|---|---|---|---|---|---|---|---|---|---|---|
| my8037_rel_o2nofp.cz11a_c24r64 | 80.162 | 19.413 | 0.425 | 0.034 | |||||||
| ma100618_rel_withdbg.cz11a_c24r64 | 0.644 | 80.627 | 18.673 | 0.055 | 0.046 | ||||||
| ma101108_rel_withdbg.cz11a_c24r64 | 0.057 | 55.969 | 43.882 | 0.092 | 0.059 | ||||||
| ma1011_240723_c944cd6e_ilwas.cz11a_c24r64 | 0.868 | 58.525 | 40.464 | 0.143 | 0.062 | ||||||
| ma110402_rel_withdbg.cz11b_c24r64 | 0.057 | 51.555 | 48.268 | 0.121 | 0.058 | ||||||
| ma1104_240723_2ee061c2_ilwas.cz11b_c24r64 | 0.544 | 53.935 | 45.339 | 0.182 | 0.057 |
Delete response time histogram: each cell has the percentage of responses that take <= the time in the header and max is the max response time in seconds. For max values in the top 25% of the range have a red background and in the bottom 25% of the range have a green background. The red background is not used when the min value is within 80% of the max value.
| dbms | 256us | 1ms | 4ms | 16ms | 64ms | 256ms | 1s | 4s | 16s | gt | max |
|---|---|---|---|---|---|---|---|---|---|---|---|
| my8037_rel_o2nofp.cz11a_c24r64 | 0.554 | 84.145 | 14.985 | 0.316 | 0.037 | ||||||
| ma100618_rel_withdbg.cz11a_c24r64 | 1.277 | 86.067 | 12.622 | 0.033 | 0.046 | ||||||
| ma101108_rel_withdbg.cz11a_c24r64 | 0.262 | 64.099 | 35.587 | 0.052 | 0.057 | ||||||
| ma1011_240723_c944cd6e_ilwas.cz11a_c24r64 | 2.366 | 64.066 | 33.490 | 0.078 | nonzero | 0.064 | |||||
| ma110402_rel_withdbg.cz11b_c24r64 | 0.228 | 58.291 | 41.403 | 0.077 | 0.058 | ||||||
| ma1104_240723_2ee061c2_ilwas.cz11b_c24r64 | 0.810 | 57.945 | 41.113 | 0.132 | 0.054 |
Performance metrics for the DBMS listed above. Some are normalized by throughput, others are not. Legend for results is here.
ips	qps	rps	rmbps	wps	wmbps	rpq	rkbpq	wpi	wkbpi	csps	cpups	cspq	cpupq	dbgb1	dbgb2	rss	maxop	p50	p99	tag
7960	57568	0	0.0	956.7	35.8	0.000	0.000	0.120	4.609	208733	53.9	3.626	150	17.3	68.4	21.4	0.032	7291	6729	my8037_rel_o2nofp.cz11a_c24r64
7960	57900	0	0.0	543.1	22.2	0.000	0.000	0.068	2.862	223397	53.9	3.858	149	17.0	69.4	19.4	0.044	7320	6745	ma100618_rel_withdbg.cz11a_c24r64
7960	53861	254	1.0	669.0	26.2	0.005	0.019	0.084	3.372	210762	52.4	3.913	156	16.0	67.8	16.6	0.026	6763	6297	ma101108_rel_withdbg.cz11a_c24r64
7965	58123	0	0.0	685.4	26.8	0.000	0.000	0.086	3.442	223879	54.5	3.852	150	17.1	69.4	19.4	0.051	7336	6857	ma1011_240723_c944cd6e_ilwas.cz11a_c24r64
7960	54072	262	1.0	675.3	26.3	0.005	0.019	0.085	3.386	211383	52.6	3.909	156	15.2	66.4	16.3	0.019	6777	6329	ma110402_rel_withdbg.cz11b_c24r64
7960	57937	0	0.0	655.5	25.8	0.000	0.000	0.082	3.317	223750	54.7	3.862	151	16.0	68.5	18.2	0.024	7304	7017	ma1104_240723_2ee061c2_ilwas.cz11b_c24r64
qp1000.L6
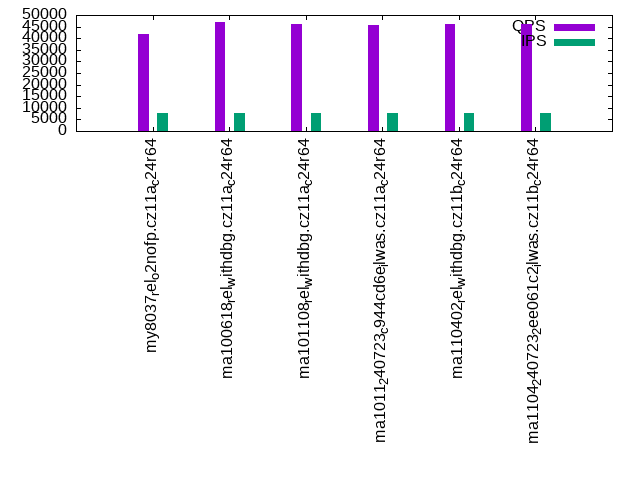
qp1000.L6: point queries with 1000 insert/s per client. Graphs for performance per 1-second interval are here.
Average throughput:
Query response time histogram: each cell has the percentage of responses that take <= the time in the header and max is the max response time in seconds. For max values in the top 25% of the range have a red background and in the bottom 25% of the range have a green background. The red background is not used when the min value is within 80% of the max value.
| dbms | 256us | 1ms | 4ms | 16ms | 64ms | 256ms | 1s | 4s | 16s | gt | max |
|---|---|---|---|---|---|---|---|---|---|---|---|
| my8037_rel_o2nofp.cz11a_c24r64 | 97.901 | 1.986 | 0.107 | 0.006 | nonzero | 0.027 | |||||
| ma100618_rel_withdbg.cz11a_c24r64 | 97.707 | 2.266 | 0.027 | nonzero | nonzero | 0.027 | |||||
| ma101108_rel_withdbg.cz11a_c24r64 | 98.115 | 1.855 | 0.030 | nonzero | 0.012 | ||||||
| ma1011_240723_c944cd6e_ilwas.cz11a_c24r64 | 97.267 | 2.710 | 0.023 | nonzero | nonzero | 0.020 | |||||
| ma110402_rel_withdbg.cz11b_c24r64 | 97.803 | 2.164 | 0.033 | nonzero | nonzero | 0.018 | |||||
| ma1104_240723_2ee061c2_ilwas.cz11b_c24r64 | 97.232 | 2.745 | 0.023 | nonzero | 0.009 |
Insert response time histogram: each cell has the percentage of responses that take <= the time in the header and max is the max response time in seconds. For max values in the top 25% of the range have a red background and in the bottom 25% of the range have a green background. The red background is not used when the min value is within 80% of the max value.
| dbms | 256us | 1ms | 4ms | 16ms | 64ms | 256ms | 1s | 4s | 16s | gt | max |
|---|---|---|---|---|---|---|---|---|---|---|---|
| my8037_rel_o2nofp.cz11a_c24r64 | 76.182 | 23.408 | 0.411 | 0.034 | |||||||
| ma100618_rel_withdbg.cz11a_c24r64 | 0.523 | 81.648 | 17.782 | 0.047 | 0.043 | ||||||
| ma101108_rel_withdbg.cz11a_c24r64 | 0.045 | 54.906 | 44.920 | 0.129 | 0.041 | ||||||
| ma1011_240723_c944cd6e_ilwas.cz11a_c24r64 | 0.398 | 43.608 | 55.855 | 0.139 | 0.048 | ||||||
| ma110402_rel_withdbg.cz11b_c24r64 | 0.026 | 49.763 | 50.070 | 0.141 | 0.001 | 0.072 | |||||
| ma1104_240723_2ee061c2_ilwas.cz11b_c24r64 | 0.257 | 40.651 | 58.981 | 0.111 | 0.035 |
Delete response time histogram: each cell has the percentage of responses that take <= the time in the header and max is the max response time in seconds. For max values in the top 25% of the range have a red background and in the bottom 25% of the range have a green background. The red background is not used when the min value is within 80% of the max value.
| dbms | 256us | 1ms | 4ms | 16ms | 64ms | 256ms | 1s | 4s | 16s | gt | max |
|---|---|---|---|---|---|---|---|---|---|---|---|
| my8037_rel_o2nofp.cz11a_c24r64 | 0.041 | 81.041 | 18.623 | 0.294 | 0.030 | ||||||
| ma100618_rel_withdbg.cz11a_c24r64 | 0.975 | 87.660 | 11.331 | 0.034 | 0.036 | ||||||
| ma101108_rel_withdbg.cz11a_c24r64 | 0.192 | 63.362 | 36.374 | 0.073 | 0.041 | ||||||
| ma1011_240723_c944cd6e_ilwas.cz11a_c24r64 | 1.095 | 49.728 | 49.100 | 0.076 | 0.051 | ||||||
| ma110402_rel_withdbg.cz11b_c24r64 | 0.130 | 56.517 | 43.272 | 0.081 | 0.063 | ||||||
| ma1104_240723_2ee061c2_ilwas.cz11b_c24r64 | 0.541 | 44.145 | 55.241 | 0.073 | 0.035 |
Performance metrics for the DBMS listed above. Some are normalized by throughput, others are not. Legend for results is here.
ips	qps	rps	rmbps	wps	wmbps	rpq	rkbpq	wpi	wkbpi	csps	cpups	cspq	cpupq	dbgb1	dbgb2	rss	maxop	p50	p99	tag
7960	41877	0	0.0	985.6	36.7	0.000	0.000	0.124	4.715	152525	52.8	3.642	202	17.3	68.5	21.4	0.027	5242	4971	my8037_rel_o2nofp.cz11a_c24r64
7965	46816	0	0.0	685.3	26.4	0.000	0.000	0.086	3.395	190538	52.1	4.070	178	17.0	69.4	19.4	0.027	5820	5626	ma100618_rel_withdbg.cz11a_c24r64
7960	46218	256	1.0	567.3	23.1	0.006	0.022	0.071	2.973	176452	52.2	3.818	181	16.0	67.8	16.6	0.012	5818	5530	ma101108_rel_withdbg.cz11a_c24r64
7960	45786	0	0.0	567.3	23.2	0.000	0.000	0.071	2.979	193394	52.4	4.224	183	17.1	69.4	19.4	0.020	5769	5530	ma1011_240723_c944cd6e_ilwas.cz11a_c24r64
7960	46314	265	1.0	572.7	23.2	0.006	0.023	0.072	2.989	182315	52.1	3.937	180	15.2	66.4	16.3	0.018	5786	5562	ma110402_rel_withdbg.cz11b_c24r64
7960	45951	0	0.0	582.7	23.5	0.000	0.000	0.073	3.022	195246	52.4	4.249	182	16.0	68.5	18.2	0.009	5770	5546	ma1104_240723_2ee061c2_ilwas.cz11b_c24r64
l.i0
l.i0: load without secondary indexes
Performance metrics for all DBMS, not just the ones listed above. Some are normalized by throughput, others are not. Legend for results is here.
ips	qps	rps	rmbps	wps	wmbps	rpq	rkbpq	wpi	wkbpi	csps	cpups	cspq	cpupq	dbgb1	dbgb2	rss	maxop	p50	p99	tag
640000	0	0	0.0	1589.2	181.8	0.000	0.000	0.002	0.291	120028	61.6	0.188	15	5.3	55.9	8.9	0.488	95327	54342	my8037_rel_o2nofp.cz11a_c24r64
434783	0	0	0.0	1276.3	105.0	0.000	0.000	0.003	0.247	478073	60.5	1.100	22	5.3	56.1	6.1	0.447	59254	39670	ma100618_rel_withdbg.cz11a_c24r64
344828	0	0	0.0	1091.1	86.7	0.000	0.000	0.003	0.258	222418	48.1	0.645	22	5.3	56.1	5.7	0.446	45362	29876	ma101108_rel_withdbg.cz11a_c24r64
317460	0	0	0.0	1021.2	79.9	0.000	0.000	0.003	0.258	256255	52.6	0.807	27	5.3	56.1	6.0	0.430	40568	25872	ma1011_240723_c944cd6e_ilwas.cz11a_c24r64
337553	0	0	0.0	1072.9	84.8	0.000	0.000	0.003	0.257	246747	47.8	0.731	23	5.3	56.1	6.3	0.454	44253	29768	ma110402_rel_withdbg.cz11b_c24r64
306513	0	0	0.0	983.4	77.0	0.000	0.000	0.003	0.257	288857	52.0	0.942	27	5.3	56.1	5.8	0.452	39358	25872	ma1104_240723_2ee061c2_ilwas.cz11b_c24r64
l.x
l.x: create secondary indexes
Performance metrics for all DBMS, not just the ones listed above. Some are normalized by throughput, others are not. Legend for results is here.
ips	qps	rps	rmbps	wps	wmbps	rpq	rkbpq	wpi	wkbpi	csps	cpups	cspq	cpupq	dbgb1	dbgb2	rss	maxop	p50	p99	tag
597016	0	3488	210.8	13286.7	640.5	0.006	0.362	0.022	1.099	40304	47.8	0.068	13	12.1	62.7	14.2	0.002	NA	NA	my8037_rel_o2nofp.cz11a_c24r64
975611	0	0	0.0	4308.4	692.1	0.000	0.000	0.004	0.726	14322	25.9	0.015	4	11.2	62.1	10.0	0.001	NA	NA	ma100618_rel_withdbg.cz11a_c24r64
975611	0	0	0.0	3933.3	685.2	0.000	0.000	0.004	0.719	12374	27.0	0.013	4	11.2	62.1	9.7	0.001	NA	NA	ma101108_rel_withdbg.cz11a_c24r64
919541	0	0	0.0	4122.5	657.8	0.000	0.000	0.004	0.733	13243	27.4	0.014	5	11.2	62.1	9.5	0.001	NA	NA	ma1011_240723_c944cd6e_ilwas.cz11a_c24r64
975611	0	0	0.0	3850.4	684.9	0.000	0.000	0.004	0.719	12391	27.2	0.013	4	11.2	62.1	9.8	0.001	NA	NA	ma110402_rel_withdbg.cz11b_c24r64
963857	0	0	0.0	3988.1	687.1	0.000	0.000	0.004	0.730	12306	28.4	0.013	5	11.2	62.1	9.6	0.001	NA	NA	ma1104_240723_2ee061c2_ilwas.cz11b_c24r64
l.i1
l.i1: continue load after secondary indexes created with 50 inserts per transaction
Performance metrics for all DBMS, not just the ones listed above. Some are normalized by throughput, others are not. Legend for results is here.
ips	qps	rps	rmbps	wps	wmbps	rpq	rkbpq	wpi	wkbpi	csps	cpups	cspq	cpupq	dbgb1	dbgb2	rss	maxop	p50	p99	tag
114942	0	139	2.2	8087.0	386.5	0.001	0.019	0.070	3.443	180773	77.6	1.573	108	17.3	68.1	21.4	1.242	15038	6293	my8037_rel_o2nofp.cz11a_c24r64
81967	0	0	0.0	8432.4	308.9	0.000	0.000	0.103	3.860	594816	73.4	7.257	143	17.0	69.4	19.7	0.735	10538	4595	ma100618_rel_withdbg.cz11a_c24r64
71190	0	2644	10.3	6714.8	260.8	0.037	0.149	0.094	3.752	295989	54.8	4.158	123	16.0	67.8	16.9	0.728	8990	5646	ma101108_rel_withdbg.cz11a_c24r64
65884	0	0	0.0	6990.8	251.0	0.000	0.000	0.106	3.901	338770	68.8	5.142	167	17.1	69.4	19.6	1.061	8392	3746	ma1011_240723_c944cd6e_ilwas.cz11a_c24r64
67868	0	2621	10.2	6568.3	251.5	0.039	0.154	0.097	3.794	314418	53.9	4.633	127	15.2	66.4	16.5	0.650	8590	5744	ma110402_rel_withdbg.cz11b_c24r64
63732	0	0	0.0	6841.5	250.4	0.000	0.000	0.107	4.023	356516	67.2	5.594	169	16.0	68.5	18.6	0.728	8141	4196	ma1104_240723_2ee061c2_ilwas.cz11b_c24r64
l.i2
l.i2: continue load after secondary indexes created with 5 inserts per transaction
Performance metrics for all DBMS, not just the ones listed above. Some are normalized by throughput, others are not. Legend for results is here.
ips	qps	rps	rmbps	wps	wmbps	rpq	rkbpq	wpi	wkbpi	csps	cpups	cspq	cpupq	dbgb1	dbgb2	rss	maxop	p50	p99	tag
52459	0	0	0.0	4580.7	199.2	0.000	0.000	0.087	3.889	263807	71.5	5.029	218	17.3	68.1	21.4	0.571	6694	3501	my8037_rel_o2nofp.cz11a_c24r64
59480	0	0	0.0	5272.4	209.7	0.000	0.000	0.089	3.610	396907	70.4	6.673	189	17.0	69.4	19.8	0.594	7597	4860	ma100618_rel_withdbg.cz11a_c24r64
39005	0	3595	14.0	3578.5	142.7	0.092	0.369	0.092	3.747	274281	46.8	7.032	192	16.0	67.8	16.7	0.512	4935	3296	ma101108_rel_withdbg.cz11a_c24r64
35635	0	0	0.0	3311.3	131.8	0.000	0.000	0.093	3.787	480863	58.2	13.494	261	17.1	69.4	19.7	0.543	4507	3097	ma1011_240723_c944cd6e_ilwas.cz11a_c24r64
38168	0	3552	13.9	3523.6	139.9	0.093	0.372	0.092	3.753	279046	46.5	7.311	195	15.2	66.4	16.4	0.503	4824	3316	ma110402_rel_withdbg.cz11b_c24r64
34587	0	0	0.0	3137.6	125.1	0.000	0.000	0.091	3.703	476226	57.7	13.769	267	16.0	68.5	18.6	0.532	4351	3097	ma1104_240723_2ee061c2_ilwas.cz11b_c24r64
qr100.L1
qr100.L1: range queries with 100 insert/s per client
Performance metrics for all DBMS, not just the ones listed above. Some are normalized by throughput, others are not. Legend for results is here.
ips	qps	rps	rmbps	wps	wmbps	rpq	rkbpq	wpi	wkbpi	csps	cpups	cspq	cpupq	dbgb1	dbgb2	rss	maxop	p50	p99	tag
796	59115	0	0.0	1002.1	28.5	0.000	0.000	1.259	36.656	219994	50.3	3.721	136	17.3	68.1	21.4	0.013	7480	7224	my8037_rel_o2nofp.cz11a_c24r64
796	60249	0	0.0	5.0	0.8	0.000	0.000	0.006	1.080	226620	50.5	3.761	134	17.0	69.4	19.4	0.004	7576	7352	ma100618_rel_withdbg.cz11a_c24r64
796	58905	22	0.1	5.0	0.9	0.000	0.001	0.006	1.100	220422	50.4	3.742	137	16.0	67.8	16.5	0.006	7464	7240	ma101108_rel_withdbg.cz11a_c24r64
796	59908	0	0.0	5.1	0.9	0.000	0.000	0.006	1.114	225518	50.5	3.764	135	17.1	69.4	19.3	0.004	7544	7306	ma1011_240723_c944cd6e_ilwas.cz11a_c24r64
796	59251	24	0.1	5.1	0.9	0.000	0.002	0.006	1.104	222354	50.5	3.753	136	15.2	66.4	16.3	0.005	7442	7192	ma110402_rel_withdbg.cz11b_c24r64
796	59512	0	0.0	5.1	0.9	0.000	0.000	0.006	1.104	223467	50.5	3.755	136	16.0	68.5	18.2	0.004	7464	7256	ma1104_240723_2ee061c2_ilwas.cz11b_c24r64
qp100.L2
qp100.L2: point queries with 100 insert/s per client
Performance metrics for all DBMS, not just the ones listed above. Some are normalized by throughput, others are not. Legend for results is here.
ips	qps	rps	rmbps	wps	wmbps	rpq	rkbpq	wpi	wkbpi	csps	cpups	cspq	cpupq	dbgb1	dbgb2	rss	maxop	p50	p99	tag
796	42416	0	0.0	109.5	3.7	0.000	0.000	0.138	4.768	165233	48.7	3.896	184	17.3	68.2	21.4	0.004	5335	5210	my8037_rel_o2nofp.cz11a_c24r64
796	48748	0	0.0	10.4	1.0	0.000	0.000	0.013	1.292	190109	49.1	3.900	161	17.0	69.4	19.4	0.004	6121	5914	ma100618_rel_withdbg.cz11a_c24r64
796	47801	23	0.1	5.0	0.8	0.000	0.002	0.006	1.090	186157	48.9	3.894	164	16.0	67.8	16.5	0.004	6010	5802	ma101108_rel_withdbg.cz11a_c24r64
796	48102	0	0.0	10.6	1.0	0.000	0.000	0.013	1.327	187610	49.1	3.900	163	17.1	69.4	19.3	0.007	6042	5850	ma1011_240723_c944cd6e_ilwas.cz11a_c24r64
796	48089	23	0.1	10.8	1.0	0.000	0.002	0.014	1.323	186848	48.9	3.885	163	15.2	66.4	16.3	0.004	6042	5877	ma110402_rel_withdbg.cz11b_c24r64
796	48116	0	0.0	5.1	0.9	0.000	0.000	0.006	1.097	187351	48.9	3.894	163	16.0	68.5	18.2	0.005	6027	5850	ma1104_240723_2ee061c2_ilwas.cz11b_c24r64
qr500.L3
qr500.L3: range queries with 500 insert/s per client
Performance metrics for all DBMS, not just the ones listed above. Some are normalized by throughput, others are not. Legend for results is here.
ips	qps	rps	rmbps	wps	wmbps	rpq	rkbpq	wpi	wkbpi	csps	cpups	cspq	cpupq	dbgb1	dbgb2	rss	maxop	p50	p99	tag
3980	58621	0	0.0	587.4	20.8	0.000	0.000	0.148	5.348	215022	51.8	3.668	141	17.3	68.2	21.4	0.025	7336	7081	my8037_rel_o2nofp.cz11a_c24r64
3980	58905	0	0.0	254.4	10.7	0.000	0.000	0.064	2.766	223244	51.9	3.790	141	17.0	69.4	19.4	0.033	7448	6920	ma100618_rel_withdbg.cz11a_c24r64
3980	56366	118	0.5	254.1	10.8	0.002	0.008	0.064	2.781	210830	51.4	3.740	146	16.0	67.8	16.6	0.033	7096	6553	ma101108_rel_withdbg.cz11a_c24r64
3980	59036	0	0.0	256.1	10.9	0.000	0.000	0.064	2.812	224361	52.4	3.800	142	17.1	69.4	19.4	0.033	7448	6953	ma1011_240723_c944cd6e_ilwas.cz11a_c24r64
3980	56684	121	0.5	255.2	10.8	0.002	0.009	0.064	2.781	211942	51.5	3.739	145	15.2	66.4	16.3	0.016	7096	6660	ma110402_rel_withdbg.cz11b_c24r64
3980	58806	0	0.0	262.3	10.9	0.000	0.000	0.066	2.817	223787	52.4	3.806	143	16.0	68.5	18.3	0.036	7371	7128	ma1104_240723_2ee061c2_ilwas.cz11b_c24r64
qp500.L4
qp500.L4: point queries with 500 insert/s per client
Performance metrics for all DBMS, not just the ones listed above. Some are normalized by throughput, others are not. Legend for results is here.
ips	qps	rps	rmbps	wps	wmbps	rpq	rkbpq	wpi	wkbpi	csps	cpups	cspq	cpupq	dbgb1	dbgb2	rss	maxop	p50	p99	tag
3980	41753	0	0.0	599.6	21.2	0.000	0.000	0.151	5.453	157945	50.4	3.783	193	17.3	68.4	21.4	0.017	5239	5068	my8037_rel_o2nofp.cz11a_c24r64
3980	47570	0	0.0	424.8	15.7	0.000	0.000	0.107	4.033	192140	50.4	4.039	170	17.0	69.4	19.4	0.011	5963	5770	ma100618_rel_withdbg.cz11a_c24r64
3980	46509	123	0.5	434.4	16.0	0.003	0.011	0.109	4.115	184627	50.1	3.970	172	16.0	67.8	16.6	0.010	5849	5645	ma101108_rel_withdbg.cz11a_c24r64
3980	46979	0	0.0	435.4	16.1	0.000	0.000	0.109	4.136	190537	50.5	4.056	172	17.1	69.4	19.4	0.011	5898	5705	ma1011_240723_c944cd6e_ilwas.cz11a_c24r64
3980	46940	122	0.5	437.4	16.0	0.003	0.010	0.110	4.119	187350	50.2	3.991	171	15.2	66.4	16.3	0.010	5913	5722	ma110402_rel_withdbg.cz11b_c24r64
3982	47105	0	0.0	434.0	16.0	0.000	0.000	0.109	4.107	191650	50.5	4.069	172	16.0	68.5	18.2	0.009	5902	5706	ma1104_240723_2ee061c2_ilwas.cz11b_c24r64
qr1000.L5
qr1000.L5: range queries with 1000 insert/s per client
Performance metrics for all DBMS, not just the ones listed above. Some are normalized by throughput, others are not. Legend for results is here.
ips	qps	rps	rmbps	wps	wmbps	rpq	rkbpq	wpi	wkbpi	csps	cpups	cspq	cpupq	dbgb1	dbgb2	rss	maxop	p50	p99	tag
7960	57568	0	0.0	956.7	35.8	0.000	0.000	0.120	4.609	208733	53.9	3.626	150	17.3	68.4	21.4	0.032	7291	6729	my8037_rel_o2nofp.cz11a_c24r64
7960	57900	0	0.0	543.1	22.2	0.000	0.000	0.068	2.862	223397	53.9	3.858	149	17.0	69.4	19.4	0.044	7320	6745	ma100618_rel_withdbg.cz11a_c24r64
7960	53861	254	1.0	669.0	26.2	0.005	0.019	0.084	3.372	210762	52.4	3.913	156	16.0	67.8	16.6	0.026	6763	6297	ma101108_rel_withdbg.cz11a_c24r64
7965	58123	0	0.0	685.4	26.8	0.000	0.000	0.086	3.442	223879	54.5	3.852	150	17.1	69.4	19.4	0.051	7336	6857	ma1011_240723_c944cd6e_ilwas.cz11a_c24r64
7960	54072	262	1.0	675.3	26.3	0.005	0.019	0.085	3.386	211383	52.6	3.909	156	15.2	66.4	16.3	0.019	6777	6329	ma110402_rel_withdbg.cz11b_c24r64
7960	57937	0	0.0	655.5	25.8	0.000	0.000	0.082	3.317	223750	54.7	3.862	151	16.0	68.5	18.2	0.024	7304	7017	ma1104_240723_2ee061c2_ilwas.cz11b_c24r64
qp1000.L6
qp1000.L6: point queries with 1000 insert/s per client
Performance metrics for all DBMS, not just the ones listed above. Some are normalized by throughput, others are not. Legend for results is here.
ips	qps	rps	rmbps	wps	wmbps	rpq	rkbpq	wpi	wkbpi	csps	cpups	cspq	cpupq	dbgb1	dbgb2	rss	maxop	p50	p99	tag
7960	41877	0	0.0	985.6	36.7	0.000	0.000	0.124	4.715	152525	52.8	3.642	202	17.3	68.5	21.4	0.027	5242	4971	my8037_rel_o2nofp.cz11a_c24r64
7965	46816	0	0.0	685.3	26.4	0.000	0.000	0.086	3.395	190538	52.1	4.070	178	17.0	69.4	19.4	0.027	5820	5626	ma100618_rel_withdbg.cz11a_c24r64
7960	46218	256	1.0	567.3	23.1	0.006	0.022	0.071	2.973	176452	52.2	3.818	181	16.0	67.8	16.6	0.012	5818	5530	ma101108_rel_withdbg.cz11a_c24r64
7960	45786	0	0.0	567.3	23.2	0.000	0.000	0.071	2.979	193394	52.4	4.224	183	17.1	69.4	19.4	0.020	5769	5530	ma1011_240723_c944cd6e_ilwas.cz11a_c24r64
7960	46314	265	1.0	572.7	23.2	0.006	0.023	0.072	2.989	182315	52.1	3.937	180	15.2	66.4	16.3	0.018	5786	5562	ma110402_rel_withdbg.cz11b_c24r64
7960	45951	0	0.0	582.7	23.5	0.000	0.000	0.073	3.022	195246	52.4	4.249	182	16.0	68.5	18.2	0.009	5770	5546	ma1104_240723_2ee061c2_ilwas.cz11b_c24r64
l.i0
- l.i0: load without secondary indexes
- Legend for results is here.
- Each entry lists the percentage of responses that fit in that bucket (slower than max time for previous bucket, faster than min time for next bucket).
Insert response time histogram
256us	1ms	4ms	16ms	64ms	256ms	1s	4s	16s	gt	max	tag
0.000	78.948	20.921	0.067	0.042	0.009	0.014	0.000	0.000	0.000	0.488	my8037_rel_o2nofp.cz11a_c24r64
0.000	29.617	70.153	0.190	0.007	0.002	0.032	0.000	0.000	0.000	0.447	ma100618_rel_withdbg.cz11a_c24r64
0.000	7.953	89.022	2.977	0.015	0.001	0.032	0.000	0.000	0.000	0.446	ma101108_rel_withdbg.cz11a_c24r64
0.000	8.705	84.298	6.951	0.014	0.001	0.032	0.000	0.000	0.000	0.430	ma1011_240723_c944cd6e_ilwas.cz11a_c24r64
0.000	8.379	88.199	3.375	0.013	0.001	0.032	0.000	0.000	0.000	0.454	ma110402_rel_withdbg.cz11b_c24r64
0.000	5.209	88.031	6.711	0.016	0.001	0.032	0.000	0.000	0.000	0.452	ma1104_240723_2ee061c2_ilwas.cz11b_c24r64
l.x
- l.x: create secondary indexes
- Legend for results is here.
- Each entry lists the percentage of responses that fit in that bucket (slower than max time for previous bucket, faster than min time for next bucket).
TODO - determine whether there is data for create index response time
l.i1
- l.i1: continue load after secondary indexes created with 50 inserts per transaction
- Legend for results is here.
- Each entry lists the percentage of responses that fit in that bucket (slower than max time for previous bucket, faster than min time for next bucket).
Insert response time histogram
256us	1ms	4ms	16ms	64ms	256ms	1s	4s	16s	gt	max	tag
0.000	0.000	80.216	19.407	0.320	0.038	0.018	nonzero	0.000	0.000	1.242	my8037_rel_o2nofp.cz11a_c24r64
0.000	0.008	38.927	60.480	0.511	0.026	0.048	0.000	0.000	0.000	0.735	ma100618_rel_withdbg.cz11a_c24r64
0.000	0.001	26.880	71.980	1.085	0.028	0.026	0.000	0.000	0.000	0.728	ma101108_rel_withdbg.cz11a_c24r64
0.000	0.008	16.593	82.686	0.650	0.018	0.046	nonzero	0.000	0.000	1.061	ma1011_240723_c944cd6e_ilwas.cz11a_c24r64
0.000	0.001	21.293	77.565	1.094	0.021	0.025	0.000	0.000	0.000	0.650	ma110402_rel_withdbg.cz11b_c24r64
0.000	0.007	15.255	83.969	0.709	0.019	0.041	0.000	0.000	0.000	0.728	ma1104_240723_2ee061c2_ilwas.cz11b_c24r64
Delete response time histogram
256us	1ms	4ms	16ms	64ms	256ms	1s	4s	16s	gt	max	tag
0.000	0.070	85.464	14.175	0.245	0.030	0.016	0.000	0.000	0.000	0.699	my8037_rel_o2nofp.cz11a_c24r64
0.000	0.060	58.050	41.459	0.363	0.025	0.043	0.000	0.000	0.000	0.741	ma100618_rel_withdbg.cz11a_c24r64
0.000	0.027	41.785	57.293	0.851	0.021	0.023	0.000	0.000	0.000	0.728	ma101108_rel_withdbg.cz11a_c24r64
0.000	0.065	30.360	69.065	0.449	0.018	0.043	0.000	0.000	0.000	0.771	ma1011_240723_c944cd6e_ilwas.cz11a_c24r64
0.000	0.021	32.975	66.093	0.872	0.017	0.022	0.000	0.000	0.000	0.649	ma110402_rel_withdbg.cz11b_c24r64
0.000	0.050	21.547	77.758	0.588	0.018	0.038	0.000	0.000	0.000	0.726	ma1104_240723_2ee061c2_ilwas.cz11b_c24r64
l.i2
- l.i2: continue load after secondary indexes created with 5 inserts per transaction
- Legend for results is here.
- Each entry lists the percentage of responses that fit in that bucket (slower than max time for previous bucket, faster than min time for next bucket).
Insert response time histogram
256us	1ms	4ms	16ms	64ms	256ms	1s	4s	16s	gt	max	tag
0.237	85.768	13.879	0.083	0.029	0.002	0.003	0.000	0.000	0.000	0.571	my8037_rel_o2nofp.cz11a_c24r64
2.759	88.806	8.147	0.273	0.011	nonzero	0.004	0.000	0.000	0.000	0.594	ma100618_rel_withdbg.cz11a_c24r64
0.322	69.724	29.612	0.283	0.055	nonzero	0.004	0.000	0.000	0.000	0.512	ma101108_rel_withdbg.cz11a_c24r64
0.497	50.847	48.398	0.238	0.016	nonzero	0.004	0.000	0.000	0.000	0.543	ma1011_240723_c944cd6e_ilwas.cz11a_c24r64
0.306	67.273	32.087	0.275	0.054	0.001	0.004	0.000	0.000	0.000	0.503	ma110402_rel_withdbg.cz11b_c24r64
0.519	48.514	50.709	0.249	0.006	0.000	0.004	0.000	0.000	0.000	0.532	ma1104_240723_2ee061c2_ilwas.cz11b_c24r64
Delete response time histogram
256us	1ms	4ms	16ms	64ms	256ms	1s	4s	16s	gt	max	tag
0.318	86.344	13.222	0.082	0.029	0.002	0.003	0.000	0.000	0.000	0.569	my8037_rel_o2nofp.cz11a_c24r64
3.327	88.075	8.329	0.255	0.010	nonzero	0.004	0.000	0.000	0.000	0.593	ma100618_rel_withdbg.cz11a_c24r64
0.386	69.979	29.309	0.267	0.055	0.001	0.004	0.000	0.000	0.000	0.512	ma101108_rel_withdbg.cz11a_c24r64
0.709	53.294	45.764	0.213	0.015	nonzero	0.004	0.000	0.000	0.000	0.543	ma1011_240723_c944cd6e_ilwas.cz11a_c24r64
0.374	67.372	31.934	0.263	0.053	nonzero	0.004	0.000	0.000	0.000	0.502	ma110402_rel_withdbg.cz11b_c24r64
0.507	48.425	50.824	0.234	0.005	0.000	0.004	0.000	0.000	0.000	0.532	ma1104_240723_2ee061c2_ilwas.cz11b_c24r64
qr100.L1
- qr100.L1: range queries with 100 insert/s per client
- Legend for results is here.
- Each entry lists the percentage of responses that fit in that bucket (slower than max time for previous bucket, faster than min time for next bucket).
Query response time histogram
256us	1ms	4ms	16ms	64ms	256ms	1s	4s	16s	gt	max	tag
99.964	0.036	0.001	nonzero	0.000	0.000	0.000	0.000	0.000	0.000	0.013	my8037_rel_o2nofp.cz11a_c24r64
99.973	0.026	0.001	0.000	0.000	0.000	0.000	0.000	0.000	0.000	0.004	ma100618_rel_withdbg.cz11a_c24r64
99.967	0.032	0.001	nonzero	0.000	0.000	0.000	0.000	0.000	0.000	0.006	ma101108_rel_withdbg.cz11a_c24r64
99.977	0.022	0.001	0.000	0.000	0.000	0.000	0.000	0.000	0.000	0.004	ma1011_240723_c944cd6e_ilwas.cz11a_c24r64
99.964	0.034	0.002	nonzero	0.000	0.000	0.000	0.000	0.000	0.000	0.005	ma110402_rel_withdbg.cz11b_c24r64
99.979	0.020	0.001	nonzero	0.000	0.000	0.000	0.000	0.000	0.000	0.004	ma1104_240723_2ee061c2_ilwas.cz11b_c24r64
Insert response time histogram
256us	1ms	4ms	16ms	64ms	256ms	1s	4s	16s	gt	max	tag
0.000	0.000	98.330	1.670	0.000	0.000	0.000	0.000	0.000	0.000	0.009	my8037_rel_o2nofp.cz11a_c24r64
0.000	0.267	98.753	0.979	0.000	0.000	0.000	0.000	0.000	0.000	0.012	ma100618_rel_withdbg.cz11a_c24r64
0.000	0.014	80.569	19.417	0.000	0.000	0.000	0.000	0.000	0.000	0.008	ma101108_rel_withdbg.cz11a_c24r64
0.000	1.479	86.851	11.670	0.000	0.000	0.000	0.000	0.000	0.000	0.007	ma1011_240723_c944cd6e_ilwas.cz11a_c24r64
0.000	0.007	74.483	25.510	0.000	0.000	0.000	0.000	0.000	0.000	0.008	ma110402_rel_withdbg.cz11b_c24r64
0.000	0.174	95.285	4.542	0.000	0.000	0.000	0.000	0.000	0.000	0.007	ma1104_240723_2ee061c2_ilwas.cz11b_c24r64
Delete response time histogram
256us	1ms	4ms	16ms	64ms	256ms	1s	4s	16s	gt	max	tag
0.000	0.597	98.455	0.948	0.000	0.000	0.000	0.000	0.000	0.000	0.010	my8037_rel_o2nofp.cz11a_c24r64
0.000	7.135	92.233	0.632	0.000	0.000	0.000	0.000	0.000	0.000	0.009	ma100618_rel_withdbg.cz11a_c24r64
0.000	0.330	84.872	14.799	0.000	0.000	0.000	0.000	0.000	0.000	0.009	ma101108_rel_withdbg.cz11a_c24r64
0.000	10.781	81.875	7.344	0.000	0.000	0.000	0.000	0.000	0.000	0.007	ma1011_240723_c944cd6e_ilwas.cz11a_c24r64
0.000	0.278	80.076	19.646	0.000	0.000	0.000	0.000	0.000	0.000	0.008	ma110402_rel_withdbg.cz11b_c24r64
0.000	1.833	95.622	2.545	0.000	0.000	0.000	0.000	0.000	0.000	0.008	ma1104_240723_2ee061c2_ilwas.cz11b_c24r64
qp100.L2
- qp100.L2: point queries with 100 insert/s per client
- Legend for results is here.
- Each entry lists the percentage of responses that fit in that bucket (slower than max time for previous bucket, faster than min time for next bucket).
Query response time histogram
256us	1ms	4ms	16ms	64ms	256ms	1s	4s	16s	gt	max	tag
98.499	1.491	0.010	0.000	0.000	0.000	0.000	0.000	0.000	0.000	0.004	my8037_rel_o2nofp.cz11a_c24r64
99.320	0.674	0.006	0.000	0.000	0.000	0.000	0.000	0.000	0.000	0.004	ma100618_rel_withdbg.cz11a_c24r64
99.276	0.717	0.008	nonzero	0.000	0.000	0.000	0.000	0.000	0.000	0.004	ma101108_rel_withdbg.cz11a_c24r64
99.254	0.738	0.008	nonzero	0.000	0.000	0.000	0.000	0.000	0.000	0.007	ma1011_240723_c944cd6e_ilwas.cz11a_c24r64
99.279	0.713	0.009	0.000	0.000	0.000	0.000	0.000	0.000	0.000	0.004	ma110402_rel_withdbg.cz11b_c24r64
99.242	0.750	0.008	nonzero	0.000	0.000	0.000	0.000	0.000	0.000	0.005	ma1104_240723_2ee061c2_ilwas.cz11b_c24r64
Insert response time histogram
256us	1ms	4ms	16ms	64ms	256ms	1s	4s	16s	gt	max	tag
0.000	0.000	99.677	0.323	0.000	0.000	0.000	0.000	0.000	0.000	0.006	my8037_rel_o2nofp.cz11a_c24r64
0.000	0.003	95.611	4.385	0.000	0.000	0.000	0.000	0.000	0.000	0.006	ma100618_rel_withdbg.cz11a_c24r64
0.000	0.028	77.042	22.931	0.000	0.000	0.000	0.000	0.000	0.000	0.008	ma101108_rel_withdbg.cz11a_c24r64
0.000	0.010	61.639	38.351	0.000	0.000	0.000	0.000	0.000	0.000	0.008	ma1011_240723_c944cd6e_ilwas.cz11a_c24r64
0.000	0.125	91.375	8.500	0.000	0.000	0.000	0.000	0.000	0.000	0.008	ma110402_rel_withdbg.cz11b_c24r64
0.000	0.017	71.941	28.042	0.000	0.000	0.000	0.000	0.000	0.000	0.008	ma1104_240723_2ee061c2_ilwas.cz11b_c24r64
Delete response time histogram
256us	1ms	4ms	16ms	64ms	256ms	1s	4s	16s	gt	max	tag
0.000	0.049	99.851	0.101	0.000	0.000	0.000	0.000	0.000	0.000	0.006	my8037_rel_o2nofp.cz11a_c24r64
0.000	0.420	97.934	1.646	0.000	0.000	0.000	0.000	0.000	0.000	0.006	ma100618_rel_withdbg.cz11a_c24r64
0.000	0.378	84.531	15.090	0.000	0.000	0.000	0.000	0.000	0.000	0.008	ma101108_rel_withdbg.cz11a_c24r64
0.000	0.250	72.792	26.958	0.000	0.000	0.000	0.000	0.000	0.000	0.007	ma1011_240723_c944cd6e_ilwas.cz11a_c24r64
0.000	0.545	94.465	4.990	0.000	0.000	0.000	0.000	0.000	0.000	0.013	ma110402_rel_withdbg.cz11b_c24r64
0.000	0.361	78.757	20.882	0.000	0.000	0.000	0.000	0.000	0.000	0.008	ma1104_240723_2ee061c2_ilwas.cz11b_c24r64
qr500.L3
- qr500.L3: range queries with 500 insert/s per client
- Legend for results is here.
- Each entry lists the percentage of responses that fit in that bucket (slower than max time for previous bucket, faster than min time for next bucket).
Query response time histogram
256us	1ms	4ms	16ms	64ms	256ms	1s	4s	16s	gt	max	tag
99.920	0.063	0.015	0.001	nonzero	0.000	0.000	0.000	0.000	0.000	0.025	my8037_rel_o2nofp.cz11a_c24r64
99.801	0.191	0.006	0.002	nonzero	0.000	0.000	0.000	0.000	0.000	0.033	ma100618_rel_withdbg.cz11a_c24r64
99.536	0.450	0.012	0.002	nonzero	0.000	0.000	0.000	0.000	0.000	0.033	ma101108_rel_withdbg.cz11a_c24r64
99.884	0.109	0.005	0.002	nonzero	0.000	0.000	0.000	0.000	0.000	0.033	ma1011_240723_c944cd6e_ilwas.cz11a_c24r64
99.567	0.421	0.012	nonzero	nonzero	0.000	0.000	0.000	0.000	0.000	0.016	ma110402_rel_withdbg.cz11b_c24r64
99.881	0.115	0.004	nonzero	nonzero	0.000	0.000	0.000	0.000	0.000	0.036	ma1104_240723_2ee061c2_ilwas.cz11b_c24r64
Insert response time histogram
256us	1ms	4ms	16ms	64ms	256ms	1s	4s	16s	gt	max	tag
0.000	0.000	84.204	15.693	0.103	0.000	0.000	0.000	0.000	0.000	0.026	my8037_rel_o2nofp.cz11a_c24r64
0.000	0.408	83.742	15.809	0.042	0.000	0.000	0.000	0.000	0.000	0.034	ma100618_rel_withdbg.cz11a_c24r64
0.000	0.044	56.171	43.742	0.043	0.000	0.000	0.000	0.000	0.000	0.035	ma101108_rel_withdbg.cz11a_c24r64
0.000	0.235	51.901	47.808	0.056	0.000	0.000	0.000	0.000	0.000	0.031	ma1011_240723_c944cd6e_ilwas.cz11a_c24r64
0.000	0.028	49.190	50.745	0.036	0.000	0.000	0.000	0.000	0.000	0.052	ma110402_rel_withdbg.cz11b_c24r64
0.000	0.162	43.905	55.863	0.071	0.000	0.000	0.000	0.000	0.000	0.045	ma1104_240723_2ee061c2_ilwas.cz11b_c24r64
Delete response time histogram
256us	1ms	4ms	16ms	64ms	256ms	1s	4s	16s	gt	max	tag
0.000	0.460	89.476	10.032	0.033	0.000	0.000	0.000	0.000	0.000	0.021	my8037_rel_o2nofp.cz11a_c24r64
0.000	0.762	89.319	9.892	0.027	0.000	0.000	0.000	0.000	0.000	0.030	ma100618_rel_withdbg.cz11a_c24r64
0.000	0.128	66.674	33.170	0.027	0.000	0.000	0.000	0.000	0.000	0.031	ma101108_rel_withdbg.cz11a_c24r64
0.000	0.401	61.578	37.988	0.034	0.000	0.000	0.000	0.000	0.000	0.029	ma1011_240723_c944cd6e_ilwas.cz11a_c24r64
0.000	0.113	58.227	41.636	0.024	0.000	0.000	0.000	0.000	0.000	0.027	ma110402_rel_withdbg.cz11b_c24r64
0.000	0.224	50.564	49.178	0.035	0.000	0.000	0.000	0.000	0.000	0.027	ma1104_240723_2ee061c2_ilwas.cz11b_c24r64
qp500.L4
- qp500.L4: point queries with 500 insert/s per client
- Legend for results is here.
- Each entry lists the percentage of responses that fit in that bucket (slower than max time for previous bucket, faster than min time for next bucket).
Query response time histogram
256us	1ms	4ms	16ms	64ms	256ms	1s	4s	16s	gt	max	tag
97.833	2.096	0.070	0.002	nonzero	0.000	0.000	0.000	0.000	0.000	0.017	my8037_rel_o2nofp.cz11a_c24r64
98.428	1.553	0.019	nonzero	0.000	0.000	0.000	0.000	0.000	0.000	0.011	ma100618_rel_withdbg.cz11a_c24r64
98.350	1.628	0.021	nonzero	0.000	0.000	0.000	0.000	0.000	0.000	0.010	ma101108_rel_withdbg.cz11a_c24r64
98.296	1.687	0.017	nonzero	0.000	0.000	0.000	0.000	0.000	0.000	0.011	ma1011_240723_c944cd6e_ilwas.cz11a_c24r64
98.359	1.617	0.024	0.001	0.000	0.000	0.000	0.000	0.000	0.000	0.010	ma110402_rel_withdbg.cz11b_c24r64
98.265	1.716	0.019	nonzero	0.000	0.000	0.000	0.000	0.000	0.000	0.009	ma1104_240723_2ee061c2_ilwas.cz11b_c24r64
Insert response time histogram
256us	1ms	4ms	16ms	64ms	256ms	1s	4s	16s	gt	max	tag
0.000	0.000	87.244	12.734	0.022	0.000	0.000	0.000	0.000	0.000	0.020	my8037_rel_o2nofp.cz11a_c24r64
0.000	0.454	85.808	13.694	0.044	0.000	0.000	0.000	0.000	0.000	0.027	ma100618_rel_withdbg.cz11a_c24r64
0.000	0.028	52.990	46.942	0.039	0.000	0.000	0.000	0.000	0.000	0.027	ma101108_rel_withdbg.cz11a_c24r64
0.000	0.125	40.114	59.708	0.053	0.000	0.000	0.000	0.000	0.000	0.030	ma1011_240723_c944cd6e_ilwas.cz11a_c24r64
0.000	0.010	43.119	56.824	0.047	0.000	0.000	0.000	0.000	0.000	0.030	ma110402_rel_withdbg.cz11b_c24r64
0.000	0.097	35.429	64.415	0.059	0.000	0.000	0.000	0.000	0.000	0.032	ma1104_240723_2ee061c2_ilwas.cz11b_c24r64
Delete response time histogram
256us	1ms	4ms	16ms	64ms	256ms	1s	4s	16s	gt	max	tag
0.000	0.177	91.663	8.151	0.009	0.000	0.000	0.000	0.000	0.000	0.020	my8037_rel_o2nofp.cz11a_c24r64
0.000	0.655	91.099	8.221	0.026	0.000	0.000	0.000	0.000	0.000	0.027	ma100618_rel_withdbg.cz11a_c24r64
0.000	0.084	64.676	35.206	0.033	0.000	0.000	0.000	0.000	0.000	0.027	ma101108_rel_withdbg.cz11a_c24r64
0.000	0.279	50.262	49.428	0.031	0.000	0.000	0.000	0.000	0.000	0.031	ma1011_240723_c944cd6e_ilwas.cz11a_c24r64
0.000	0.057	53.001	46.907	0.035	0.000	0.000	0.000	0.000	0.000	0.028	ma110402_rel_withdbg.cz11b_c24r64
0.000	0.104	41.513	58.344	0.040	0.000	0.000	0.000	0.000	0.000	0.035	ma1104_240723_2ee061c2_ilwas.cz11b_c24r64
qr1000.L5
- qr1000.L5: range queries with 1000 insert/s per client
- Legend for results is here.
- Each entry lists the percentage of responses that fit in that bucket (slower than max time for previous bucket, faster than min time for next bucket).
Query response time histogram
256us	1ms	4ms	16ms	64ms	256ms	1s	4s	16s	gt	max	tag
99.751	0.206	0.040	0.003	nonzero	0.000	0.000	0.000	0.000	0.000	0.032	my8037_rel_o2nofp.cz11a_c24r64
99.572	0.411	0.012	0.005	nonzero	0.000	0.000	0.000	0.000	0.000	0.044	ma100618_rel_withdbg.cz11a_c24r64
98.641	1.328	0.024	0.006	nonzero	0.000	0.000	0.000	0.000	0.000	0.026	ma101108_rel_withdbg.cz11a_c24r64
99.786	0.198	0.010	0.006	nonzero	0.000	0.000	0.000	0.000	0.000	0.051	ma1011_240723_c944cd6e_ilwas.cz11a_c24r64
98.643	1.331	0.025	0.001	nonzero	0.000	0.000	0.000	0.000	0.000	0.019	ma110402_rel_withdbg.cz11b_c24r64
99.773	0.217	0.009	0.001	nonzero	0.000	0.000	0.000	0.000	0.000	0.024	ma1104_240723_2ee061c2_ilwas.cz11b_c24r64
Insert response time histogram
256us	1ms	4ms	16ms	64ms	256ms	1s	4s	16s	gt	max	tag
0.000	0.000	80.162	19.413	0.425	0.000	0.000	0.000	0.000	0.000	0.034	my8037_rel_o2nofp.cz11a_c24r64
0.000	0.644	80.627	18.673	0.055	0.000	0.000	0.000	0.000	0.000	0.046	ma100618_rel_withdbg.cz11a_c24r64
0.000	0.057	55.969	43.882	0.092	0.000	0.000	0.000	0.000	0.000	0.059	ma101108_rel_withdbg.cz11a_c24r64
0.000	0.868	58.525	40.464	0.143	0.000	0.000	0.000	0.000	0.000	0.062	ma1011_240723_c944cd6e_ilwas.cz11a_c24r64
0.000	0.057	51.555	48.268	0.121	0.000	0.000	0.000	0.000	0.000	0.058	ma110402_rel_withdbg.cz11b_c24r64
0.000	0.544	53.935	45.339	0.182	0.000	0.000	0.000	0.000	0.000	0.057	ma1104_240723_2ee061c2_ilwas.cz11b_c24r64
Delete response time histogram
256us	1ms	4ms	16ms	64ms	256ms	1s	4s	16s	gt	max	tag
0.000	0.554	84.145	14.985	0.316	0.000	0.000	0.000	0.000	0.000	0.037	my8037_rel_o2nofp.cz11a_c24r64
0.000	1.277	86.067	12.622	0.033	0.000	0.000	0.000	0.000	0.000	0.046	ma100618_rel_withdbg.cz11a_c24r64
0.000	0.262	64.099	35.587	0.052	0.000	0.000	0.000	0.000	0.000	0.057	ma101108_rel_withdbg.cz11a_c24r64
0.000	2.366	64.066	33.490	0.078	nonzero	0.000	0.000	0.000	0.000	0.064	ma1011_240723_c944cd6e_ilwas.cz11a_c24r64
0.000	0.228	58.291	41.403	0.077	0.000	0.000	0.000	0.000	0.000	0.058	ma110402_rel_withdbg.cz11b_c24r64
0.000	0.810	57.945	41.113	0.132	0.000	0.000	0.000	0.000	0.000	0.054	ma1104_240723_2ee061c2_ilwas.cz11b_c24r64
qp1000.L6
- qp1000.L6: point queries with 1000 insert/s per client
- Legend for results is here.
- Each entry lists the percentage of responses that fit in that bucket (slower than max time for previous bucket, faster than min time for next bucket).
Query response time histogram
256us	1ms	4ms	16ms	64ms	256ms	1s	4s	16s	gt	max	tag
97.901	1.986	0.107	0.006	nonzero	0.000	0.000	0.000	0.000	0.000	0.027	my8037_rel_o2nofp.cz11a_c24r64
97.707	2.266	0.027	nonzero	nonzero	0.000	0.000	0.000	0.000	0.000	0.027	ma100618_rel_withdbg.cz11a_c24r64
98.115	1.855	0.030	nonzero	0.000	0.000	0.000	0.000	0.000	0.000	0.012	ma101108_rel_withdbg.cz11a_c24r64
97.267	2.710	0.023	nonzero	nonzero	0.000	0.000	0.000	0.000	0.000	0.020	ma1011_240723_c944cd6e_ilwas.cz11a_c24r64
97.803	2.164	0.033	nonzero	nonzero	0.000	0.000	0.000	0.000	0.000	0.018	ma110402_rel_withdbg.cz11b_c24r64
97.232	2.745	0.023	nonzero	0.000	0.000	0.000	0.000	0.000	0.000	0.009	ma1104_240723_2ee061c2_ilwas.cz11b_c24r64
Insert response time histogram
256us	1ms	4ms	16ms	64ms	256ms	1s	4s	16s	gt	max	tag
0.000	0.000	76.182	23.408	0.411	0.000	0.000	0.000	0.000	0.000	0.034	my8037_rel_o2nofp.cz11a_c24r64
0.000	0.523	81.648	17.782	0.047	0.000	0.000	0.000	0.000	0.000	0.043	ma100618_rel_withdbg.cz11a_c24r64
0.000	0.045	54.906	44.920	0.129	0.000	0.000	0.000	0.000	0.000	0.041	ma101108_rel_withdbg.cz11a_c24r64
0.000	0.398	43.608	55.855	0.139	0.000	0.000	0.000	0.000	0.000	0.048	ma1011_240723_c944cd6e_ilwas.cz11a_c24r64
0.000	0.026	49.763	50.070	0.141	0.001	0.000	0.000	0.000	0.000	0.072	ma110402_rel_withdbg.cz11b_c24r64
0.000	0.257	40.651	58.981	0.111	0.000	0.000	0.000	0.000	0.000	0.035	ma1104_240723_2ee061c2_ilwas.cz11b_c24r64
Delete response time histogram
256us	1ms	4ms	16ms	64ms	256ms	1s	4s	16s	gt	max	tag
0.000	0.041	81.041	18.623	0.294	0.000	0.000	0.000	0.000	0.000	0.030	my8037_rel_o2nofp.cz11a_c24r64
0.000	0.975	87.660	11.331	0.034	0.000	0.000	0.000	0.000	0.000	0.036	ma100618_rel_withdbg.cz11a_c24r64
0.000	0.192	63.362	36.374	0.073	0.000	0.000	0.000	0.000	0.000	0.041	ma101108_rel_withdbg.cz11a_c24r64
0.000	1.095	49.728	49.100	0.076	0.000	0.000	0.000	0.000	0.000	0.051	ma1011_240723_c944cd6e_ilwas.cz11a_c24r64
0.000	0.130	56.517	43.272	0.081	0.000	0.000	0.000	0.000	0.000	0.063	ma110402_rel_withdbg.cz11b_c24r64
0.000	0.541	44.145	55.241	0.073	0.000	0.000	0.000	0.000	0.000	0.035	ma1104_240723_2ee061c2_ilwas.cz11b_c24r64