Introduction
This is a report for the insert benchmark with 80M docs and 8 client(s). It is generated by scripts (bash, awk, sed) and Tufte might not be impressed. An overview of the insert benchmark is here and a short update is here. Below, by DBMS, I mean DBMS+version.config. An example is my8020.c10b40 where my means MySQL, 8020 is version 8.0.20 and c10b40 is the name for the configuration file.
The test server has is a c2d-standard-30 with HT off, 16 cores, 64G RAM, Ubuntu 22.04 and ext4 using SW RAID 0 and 2 NVMe devices. The benchmark was run with 8 clients and there were 1 or 3 connections per client (1 for queries or inserts without rate limits, 1+1 for rate limited inserts+deletes). It uses 8 table with a table per client. It loads 10M rows per table without secondary indexes, creates 3 secondary indexes per table, then inserts 40m+10m rows per table with a delete per insert to avoid growing the table. It then does 6 read+write tests for 1800s each that do queries as fast as possible with 100,100,500,500,1000,1000 inserts/s and the same for deletes/s per client concurrent with the queries. The database is cached by InnoDB. Clients and the DBMS share one server. The per-database configs are in the per-database subdirectories here.
The tested DBMS are:
- my8028_rel_o2nofp.cz11a_c24r64 - MSQL 8.0.28, InnoDB and the cz11a_c24r64 config
- my8032_rel_o2nofp.cz11a_c24r64 - MSQL 8.0.32, InnoDB and the cz11a_c24r64 config
- my8036_rel_o2nofp.cz11a_c24r64 - MSQL 8.0.36, InnoDB and the cz11a_c24r64 config
- my8037_rel_o2nofp.cz11a_c24r64 - MSQL 8.0.37, InnoDB and the cz11a_c24r64 config
- my8038_rel_o2nofp.cz11a_c24r64 - MSQL 8.0.38, InnoDB and the cz11a_c24r64 config
Contents
- Summary
- l.i0: load without secondary indexes
- l.x: create secondary indexes
- l.i1: continue load after secondary indexes created with 50 inserts per transaction
- l.i2: continue load after secondary indexes created with 5 inserts per transaction
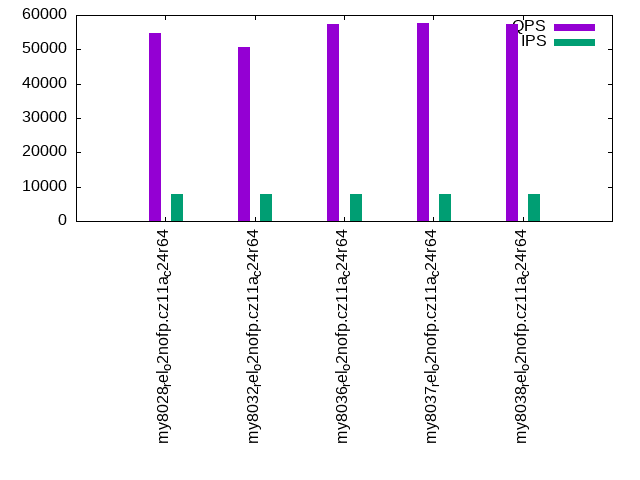
- qr100.L1: range queries with 100 insert/s per client
- qp100.L2: point queries with 100 insert/s per client
- qr500.L3: range queries with 500 insert/s per client
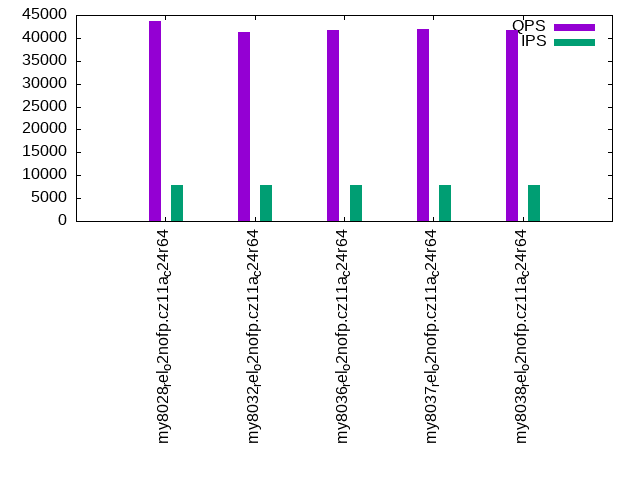
- qp500.L4: point queries with 500 insert/s per client
- qr1000.L5: range queries with 1000 insert/s per client
- qp1000.L6: point queries with 1000 insert/s per client
Summary
The numbers are inserts/s for l.i0, l.i1 and l.i2, indexed docs (or rows) /s for l.x and queries/s for qr100, qp100 thru qr1000, qp1000" The values are the average rate over the entire test for inserts (IPS) and queries (QPS). The range of values for IPS and QPS is split into 3 parts: bottom 25%, middle 50%, top 25%. Values in the bottom 25% have a red background, values in the top 25% have a green background and values in the middle have no color. A gray background is used for values that can be ignored because the DBMS did not sustain the target insert rate. Red backgrounds are not used when the minimum value is within 80% of the max value.
| dbms | l.i0 | l.x | l.i1 | l.i2 | qr100 | qp100 | qr500 | qp500 | qr1000 | qp1000 |
|---|---|---|---|---|---|---|---|---|---|---|
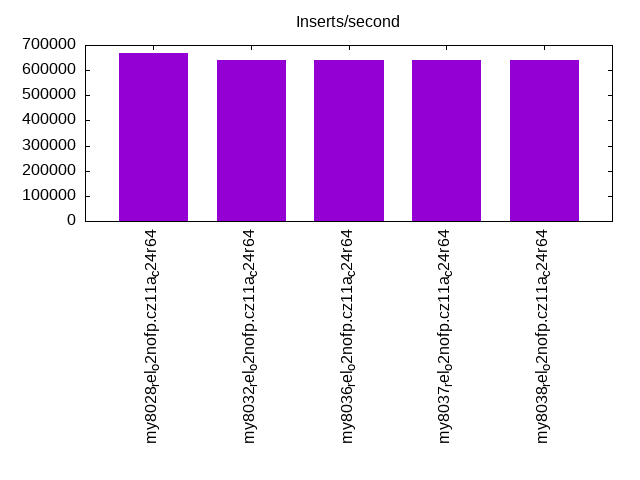
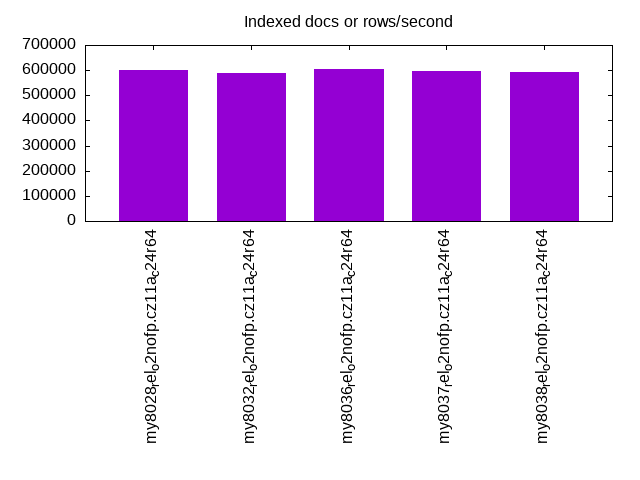
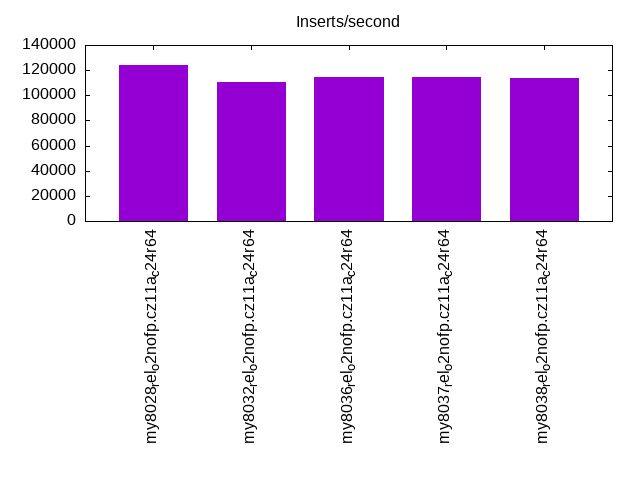
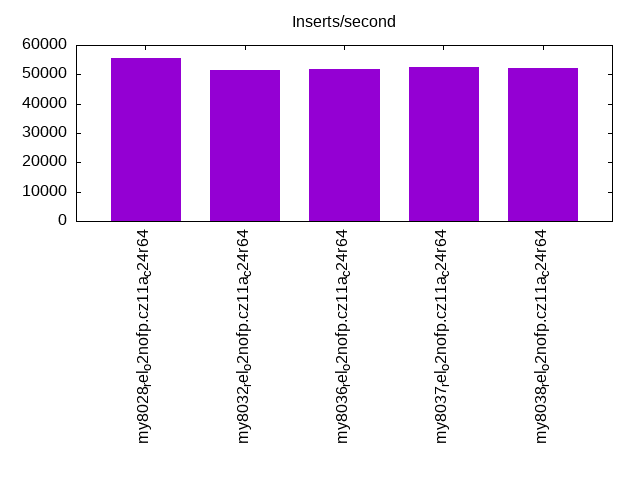
| my8028_rel_o2nofp.cz11a_c24r64 | 666667 | 601504 | 124079 | 55710 | 56489 | 45213 | 55878 | 44538 | 54880 | 43616 |
| my8032_rel_o2nofp.cz11a_c24r64 | 640000 | 588236 | 110803 | 51414 | 52500 | 41993 | 51768 | 41391 | 50719 | 41380 |
| my8036_rel_o2nofp.cz11a_c24r64 | 640000 | 606061 | 114326 | 51914 | 59042 | 42270 | 58495 | 41690 | 57383 | 41724 |
| my8037_rel_o2nofp.cz11a_c24r64 | 640000 | 597016 | 114942 | 52459 | 59115 | 42416 | 58621 | 41753 | 57568 | 41877 |
| my8038_rel_o2nofp.cz11a_c24r64 | 640000 | 592593 | 113879 | 52151 | 58813 | 42356 | 58290 | 42449 | 57338 | 41754 |
This table has relative throughput, throughput for the DBMS relative to the DBMS in the first line, using the absolute throughput from the previous table. Values less than 0.95 have a yellow background. Values greater than 1.05 have a blue background.
| dbms | l.i0 | l.x | l.i1 | l.i2 | qr100 | qp100 | qr500 | qp500 | qr1000 | qp1000 |
|---|---|---|---|---|---|---|---|---|---|---|
| my8028_rel_o2nofp.cz11a_c24r64 | 1.00 | 1.00 | 1.00 | 1.00 | 1.00 | 1.00 | 1.00 | 1.00 | 1.00 | 1.00 |
| my8032_rel_o2nofp.cz11a_c24r64 | 0.96 | 0.98 | 0.89 | 0.92 | 0.93 | 0.93 | 0.93 | 0.93 | 0.92 | 0.95 |
| my8036_rel_o2nofp.cz11a_c24r64 | 0.96 | 1.01 | 0.92 | 0.93 | 1.05 | 0.93 | 1.05 | 0.94 | 1.05 | 0.96 |
| my8037_rel_o2nofp.cz11a_c24r64 | 0.96 | 0.99 | 0.93 | 0.94 | 1.05 | 0.94 | 1.05 | 0.94 | 1.05 | 0.96 |
| my8038_rel_o2nofp.cz11a_c24r64 | 0.96 | 0.99 | 0.92 | 0.94 | 1.04 | 0.94 | 1.04 | 0.95 | 1.04 | 0.96 |
This lists the average rate of inserts/s for the tests that do inserts concurrent with queries. For such tests the query rate is listed in the table above. The read+write tests are setup so that the insert rate should match the target rate every second. Cells that are not at least 95% of the target have a red background to indicate a failure to satisfy the target.
| dbms | qr100.L1 | qp100.L2 | qr500.L3 | qp500.L4 | qr1000.L5 | qp1000.L6 |
|---|---|---|---|---|---|---|
| my8028_rel_o2nofp.cz11a_c24r64 | 796 | 796 | 3982 | 3982 | 7965 | 7960 |
| my8032_rel_o2nofp.cz11a_c24r64 | 796 | 796 | 3980 | 3980 | 7960 | 7960 |
| my8036_rel_o2nofp.cz11a_c24r64 | 796 | 796 | 3980 | 3980 | 7965 | 7960 |
| my8037_rel_o2nofp.cz11a_c24r64 | 796 | 796 | 3980 | 3980 | 7960 | 7960 |
| my8038_rel_o2nofp.cz11a_c24r64 | 796 | 796 | 3978 | 3980 | 7960 | 7960 |
| target | 800 | 800 | 4000 | 4000 | 8000 | 8000 |
l.i0
l.i0: load without secondary indexes. Graphs for performance per 1-second interval are here.
Average throughput:
Insert response time histogram: each cell has the percentage of responses that take <= the time in the header and max is the max response time in seconds. For the max column values in the top 25% of the range have a red background and in the bottom 25% of the range have a green background. The red background is not used when the min value is within 80% of the max value.
| dbms | 256us | 1ms | 4ms | 16ms | 64ms | 256ms | 1s | 4s | 16s | gt | max |
|---|---|---|---|---|---|---|---|---|---|---|---|
| my8028_rel_o2nofp.cz11a_c24r64 | 92.130 | 7.763 | 0.061 | 0.027 | 0.005 | 0.014 | 0.480 | ||||
| my8032_rel_o2nofp.cz11a_c24r64 | 72.530 | 27.327 | 0.085 | 0.037 | 0.007 | 0.014 | 0.476 | ||||
| my8036_rel_o2nofp.cz11a_c24r64 | 72.662 | 27.205 | 0.077 | 0.035 | 0.007 | 0.014 | 0.497 | ||||
| my8037_rel_o2nofp.cz11a_c24r64 | 78.948 | 20.921 | 0.067 | 0.042 | 0.009 | 0.014 | 0.488 | ||||
| my8038_rel_o2nofp.cz11a_c24r64 | 77.627 | 22.236 | 0.080 | 0.037 | 0.007 | 0.014 | 0.496 |
Performance metrics for the DBMS listed above. Some are normalized by throughput, others are not. Legend for results is here.
ips	qps	rps	rmbps	wps	wmbps	rpq	rkbpq	wpi	wkbpi	csps	cpups	cspq	cpupq	dbgb1	dbgb2	rss	maxop	p50	p99	tag
666667	0	0	0.0	1521.9	188.7	0.000	0.000	0.002	0.290	146990	62.5	0.220	15	5.3	55.9	9.2	0.480	103390	54941	my8028_rel_o2nofp.cz11a_c24r64
640000	0	0	0.0	1376.2	175.7	0.000	0.000	0.002	0.281	114429	62.0	0.179	16	5.3	55.9	8.9	0.476	95198	53842	my8032_rel_o2nofp.cz11a_c24r64
640000	0	0	0.0	1579.7	181.4	0.000	0.000	0.002	0.290	123770	62.0	0.193	16	5.3	55.9	8.9	0.497	95798	54758	my8036_rel_o2nofp.cz11a_c24r64
640000	0	0	0.0	1589.2	181.8	0.000	0.000	0.002	0.291	120028	61.6	0.188	15	5.3	55.9	8.9	0.488	95327	54342	my8037_rel_o2nofp.cz11a_c24r64
640000	0	0	0.0	1588.5	181.7	0.000	0.000	0.002	0.291	111105	61.9	0.174	15	5.3	55.9	8.9	0.496	96197	61633	my8038_rel_o2nofp.cz11a_c24r64
l.x
l.x: create secondary indexes.
Average throughput:
Performance metrics for the DBMS listed above. Some are normalized by throughput, others are not. Legend for results is here.
ips	qps	rps	rmbps	wps	wmbps	rpq	rkbpq	wpi	wkbpi	csps	cpups	cspq	cpupq	dbgb1	dbgb2	rss	maxop	p50	p99	tag
601504	0	3487	210.9	13418.9	641.6	0.006	0.359	0.022	1.092	41678	40.1	0.069	11	12.1	62.7	14.5	0.001	NA	NA	my8028_rel_o2nofp.cz11a_c24r64
588236	0	3367	203.2	13532.4	627.7	0.006	0.354	0.023	1.093	41016	48.4	0.070	13	12.1	62.7	13.9	0.002	NA	NA	my8032_rel_o2nofp.cz11a_c24r64
606061	0	3488	210.9	13509.1	641.5	0.006	0.356	0.022	1.084	39920	48.7	0.066	13	12.1	62.7	14.1	0.002	NA	NA	my8036_rel_o2nofp.cz11a_c24r64
597016	0	3488	210.8	13286.7	640.5	0.006	0.362	0.022	1.099	40304	47.8	0.068	13	12.1	62.7	14.2	0.002	NA	NA	my8037_rel_o2nofp.cz11a_c24r64
592593	0	3367	203.2	13482.3	626.1	0.006	0.351	0.023	1.082	40364	48.1	0.068	13	12.1	62.7	14.2	0.002	NA	NA	my8038_rel_o2nofp.cz11a_c24r64
l.i1
l.i1: continue load after secondary indexes created with 50 inserts per transaction. Graphs for performance per 1-second interval are here.
Average throughput:
Insert response time histogram: each cell has the percentage of responses that take <= the time in the header and max is the max response time in seconds. For the max column values in the top 25% of the range have a red background and in the bottom 25% of the range have a green background. The red background is not used when the min value is within 80% of the max value.
| dbms | 256us | 1ms | 4ms | 16ms | 64ms | 256ms | 1s | 4s | 16s | gt | max |
|---|---|---|---|---|---|---|---|---|---|---|---|
| my8028_rel_o2nofp.cz11a_c24r64 | 0.001 | 84.976 | 14.748 | 0.231 | 0.027 | 0.016 | 0.739 | ||||
| my8032_rel_o2nofp.cz11a_c24r64 | 76.788 | 22.838 | 0.322 | 0.035 | 0.018 | 0.925 | |||||
| my8036_rel_o2nofp.cz11a_c24r64 | nonzero | 79.750 | 19.876 | 0.321 | 0.034 | 0.019 | 0.792 | ||||
| my8037_rel_o2nofp.cz11a_c24r64 | 80.216 | 19.407 | 0.320 | 0.038 | 0.018 | nonzero | 1.242 | ||||
| my8038_rel_o2nofp.cz11a_c24r64 | 79.378 | 20.255 | 0.315 | 0.034 | 0.018 | 0.833 |
Delete response time histogram: each cell has the percentage of responses that take <= the time in the header and max is the max response time in seconds. For the max column values in the top 25% of the range have a red background and in the bottom 25% of the range have a green background. The red background is not used when the min value is within 80% of the max value.
| dbms | 256us | 1ms | 4ms | 16ms | 64ms | 256ms | 1s | 4s | 16s | gt | max |
|---|---|---|---|---|---|---|---|---|---|---|---|
| my8028_rel_o2nofp.cz11a_c24r64 | 0.390 | 89.249 | 10.148 | 0.178 | 0.020 | 0.014 | 0.738 | ||||
| my8032_rel_o2nofp.cz11a_c24r64 | 0.019 | 82.968 | 16.724 | 0.248 | 0.026 | 0.016 | 0.784 | ||||
| my8036_rel_o2nofp.cz11a_c24r64 | 0.043 | 85.124 | 14.540 | 0.250 | 0.026 | 0.016 | 0.788 | ||||
| my8037_rel_o2nofp.cz11a_c24r64 | 0.070 | 85.464 | 14.175 | 0.245 | 0.030 | 0.016 | 0.699 | ||||
| my8038_rel_o2nofp.cz11a_c24r64 | 0.056 | 84.774 | 14.886 | 0.243 | 0.026 | 0.015 | 0.828 |
Performance metrics for the DBMS listed above. Some are normalized by throughput, others are not. Legend for results is here.
ips	qps	rps	rmbps	wps	wmbps	rpq	rkbpq	wpi	wkbpi	csps	cpups	cspq	cpupq	dbgb1	dbgb2	rss	maxop	p50	p99	tag
124079	0	150	2.3	7001.0	327.8	0.001	0.019	0.056	2.705	183903	78.2	1.482	101	17.7	68.5	21.8	0.739	16037	7991	my8028_rel_o2nofp.cz11a_c24r64
110803	0	134	2.1	7878.6	375.0	0.001	0.019	0.071	3.466	181093	78.6	1.634	113	17.5	68.2	21.5	0.925	14435	5744	my8032_rel_o2nofp.cz11a_c24r64
114326	0	138	2.2	8076.7	384.9	0.001	0.019	0.071	3.447	180392	77.8	1.578	109	17.6	68.3	21.6	0.792	14934	5944	my8036_rel_o2nofp.cz11a_c24r64
114942	0	139	2.2	8087.0	386.5	0.001	0.019	0.070	3.443	180773	77.6	1.573	108	17.3	68.1	21.4	1.242	15038	6293	my8037_rel_o2nofp.cz11a_c24r64
113879	0	137	2.1	8052.7	383.5	0.001	0.019	0.071	3.448	178950	77.8	1.571	109	17.5	68.3	21.5	0.833	14937	6045	my8038_rel_o2nofp.cz11a_c24r64
l.i2
l.i2: continue load after secondary indexes created with 5 inserts per transaction. Graphs for performance per 1-second interval are here.
Average throughput:
Insert response time histogram: each cell has the percentage of responses that take <= the time in the header and max is the max response time in seconds. For the max column values in the top 25% of the range have a red background and in the bottom 25% of the range have a green background. The red background is not used when the min value is within 80% of the max value.
| dbms | 256us | 1ms | 4ms | 16ms | 64ms | 256ms | 1s | 4s | 16s | gt | max |
|---|---|---|---|---|---|---|---|---|---|---|---|
| my8028_rel_o2nofp.cz11a_c24r64 | 1.512 | 87.327 | 11.073 | 0.061 | 0.022 | 0.001 | 0.003 | 0.569 | |||
| my8032_rel_o2nofp.cz11a_c24r64 | 0.088 | 84.350 | 15.441 | 0.085 | 0.031 | 0.001 | 0.003 | 0.550 | |||
| my8036_rel_o2nofp.cz11a_c24r64 | 0.186 | 85.269 | 14.431 | 0.079 | 0.031 | 0.002 | 0.003 | 0.544 | |||
| my8037_rel_o2nofp.cz11a_c24r64 | 0.237 | 85.768 | 13.879 | 0.083 | 0.029 | 0.002 | 0.003 | 0.571 | |||
| my8038_rel_o2nofp.cz11a_c24r64 | 0.197 | 85.533 | 14.150 | 0.085 | 0.031 | 0.001 | 0.003 | 0.557 |
Delete response time histogram: each cell has the percentage of responses that take <= the time in the header and max is the max response time in seconds. For the max column values in the top 25% of the range have a red background and in the bottom 25% of the range have a green background. The red background is not used when the min value is within 80% of the max value.
| dbms | 256us | 1ms | 4ms | 16ms | 64ms | 256ms | 1s | 4s | 16s | gt | max |
|---|---|---|---|---|---|---|---|---|---|---|---|
| my8028_rel_o2nofp.cz11a_c24r64 | 1.740 | 87.546 | 10.630 | 0.060 | 0.022 | nonzero | 0.003 | 0.568 | |||
| my8032_rel_o2nofp.cz11a_c24r64 | 0.069 | 84.866 | 14.946 | 0.084 | 0.031 | 0.001 | 0.003 | 0.548 | |||
| my8036_rel_o2nofp.cz11a_c24r64 | 0.231 | 85.903 | 13.754 | 0.077 | 0.030 | 0.002 | 0.003 | 0.544 | |||
| my8037_rel_o2nofp.cz11a_c24r64 | 0.318 | 86.344 | 13.222 | 0.082 | 0.029 | 0.002 | 0.003 | 0.569 | |||
| my8038_rel_o2nofp.cz11a_c24r64 | 0.229 | 86.131 | 13.522 | 0.084 | 0.030 | 0.001 | 0.003 | 0.555 |
Performance metrics for the DBMS listed above. Some are normalized by throughput, others are not. Legend for results is here.
ips	qps	rps	rmbps	wps	wmbps	rpq	rkbpq	wpi	wkbpi	csps	cpups	cspq	cpupq	dbgb1	dbgb2	rss	maxop	p50	p99	tag
55710	0	0	0.0	3963.9	172.2	0.000	0.000	0.071	3.165	274061	71.5	4.919	205	17.7	68.5	21.8	0.569	7103	4167	my8028_rel_o2nofp.cz11a_c24r64
51414	0	0	0.0	4514.0	196.2	0.000	0.000	0.088	3.907	260901	72.1	5.075	224	17.5	68.2	21.5	0.550	6533	3996	my8032_rel_o2nofp.cz11a_c24r64
51914	0	0	0.0	4551.9	197.6	0.000	0.000	0.088	3.897	261852	71.4	5.044	220	17.6	68.3	21.6	0.544	6618	3782	my8036_rel_o2nofp.cz11a_c24r64
52459	0	0	0.0	4580.7	199.2	0.000	0.000	0.087	3.889	263807	71.5	5.029	218	17.3	68.1	21.4	0.571	6694	3501	my8037_rel_o2nofp.cz11a_c24r64
52151	0	0	0.0	4549.2	197.7	0.000	0.000	0.087	3.882	265104	71.3	5.083	219	17.5	68.3	21.5	0.557	6638	3706	my8038_rel_o2nofp.cz11a_c24r64
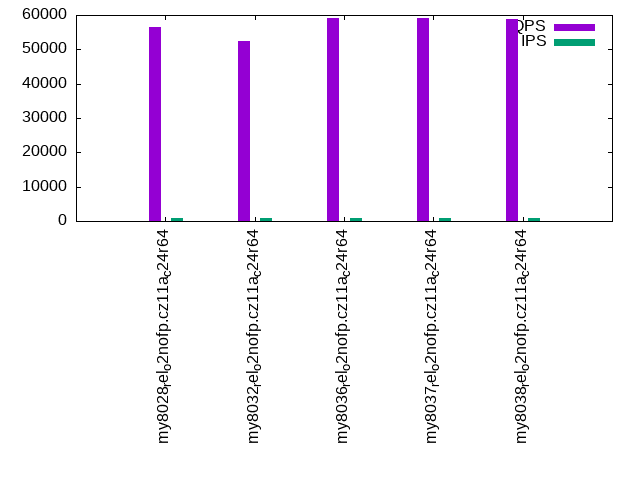
qr100.L1
qr100.L1: range queries with 100 insert/s per client. Graphs for performance per 1-second interval are here.
Average throughput:
Query response time histogram: each cell has the percentage of responses that take <= the time in the header and max is the max response time in seconds. For max values in the top 25% of the range have a red background and in the bottom 25% of the range have a green background. The red background is not used when the min value is within 80% of the max value.
| dbms | 256us | 1ms | 4ms | 16ms | 64ms | 256ms | 1s | 4s | 16s | gt | max |
|---|---|---|---|---|---|---|---|---|---|---|---|
| my8028_rel_o2nofp.cz11a_c24r64 | 99.954 | 0.045 | 0.001 | nonzero | 0.007 | ||||||
| my8032_rel_o2nofp.cz11a_c24r64 | 99.943 | 0.056 | 0.001 | nonzero | 0.007 | ||||||
| my8036_rel_o2nofp.cz11a_c24r64 | 99.966 | 0.033 | 0.001 | nonzero | 0.012 | ||||||
| my8037_rel_o2nofp.cz11a_c24r64 | 99.964 | 0.036 | 0.001 | nonzero | 0.013 | ||||||
| my8038_rel_o2nofp.cz11a_c24r64 | 99.965 | 0.034 | 0.001 | nonzero | 0.006 |
Insert response time histogram: each cell has the percentage of responses that take <= the time in the header and max is the max response time in seconds. For max values in the top 25% of the range have a red background and in the bottom 25% of the range have a green background. The red background is not used when the min value is within 80% of the max value.
| dbms | 256us | 1ms | 4ms | 16ms | 64ms | 256ms | 1s | 4s | 16s | gt | max |
|---|---|---|---|---|---|---|---|---|---|---|---|
| my8028_rel_o2nofp.cz11a_c24r64 | 98.528 | 1.472 | 0.010 | ||||||||
| my8032_rel_o2nofp.cz11a_c24r64 | 96.819 | 3.177 | 0.003 | 0.018 | |||||||
| my8036_rel_o2nofp.cz11a_c24r64 | 97.347 | 2.653 | 0.014 | ||||||||
| my8037_rel_o2nofp.cz11a_c24r64 | 98.330 | 1.670 | 0.009 | ||||||||
| my8038_rel_o2nofp.cz11a_c24r64 | 98.177 | 1.823 | 0.009 |
Delete response time histogram: each cell has the percentage of responses that take <= the time in the header and max is the max response time in seconds. For max values in the top 25% of the range have a red background and in the bottom 25% of the range have a green background. The red background is not used when the min value is within 80% of the max value.
| dbms | 256us | 1ms | 4ms | 16ms | 64ms | 256ms | 1s | 4s | 16s | gt | max |
|---|---|---|---|---|---|---|---|---|---|---|---|
| my8028_rel_o2nofp.cz11a_c24r64 | 1.878 | 97.441 | 0.681 | 0.011 | |||||||
| my8032_rel_o2nofp.cz11a_c24r64 | 0.010 | 97.969 | 2.021 | 0.012 | |||||||
| my8036_rel_o2nofp.cz11a_c24r64 | 0.507 | 97.938 | 1.556 | 0.013 | |||||||
| my8037_rel_o2nofp.cz11a_c24r64 | 0.597 | 98.455 | 0.948 | 0.010 | |||||||
| my8038_rel_o2nofp.cz11a_c24r64 | 0.441 | 98.604 | 0.955 | 0.009 |
Performance metrics for the DBMS listed above. Some are normalized by throughput, others are not. Legend for results is here.
ips	qps	rps	rmbps	wps	wmbps	rpq	rkbpq	wpi	wkbpi	csps	cpups	cspq	cpupq	dbgb1	dbgb2	rss	maxop	p50	p99	tag
796	56489	0	0.0	862.0	24.4	0.000	0.000	1.083	31.429	210804	50.3	3.732	142	17.7	68.5	21.8	0.007	7112	6841	my8028_rel_o2nofp.cz11a_c24r64
796	52500	0	0.0	827.9	23.6	0.000	0.000	1.040	30.375	195903	50.3	3.732	153	17.5	68.2	21.5	0.007	6601	6409	my8032_rel_o2nofp.cz11a_c24r64
796	59042	0	0.0	778.2	22.2	0.000	0.000	0.978	28.622	219902	50.2	3.725	136	17.6	68.3	21.6	0.012	7432	7198	my8036_rel_o2nofp.cz11a_c24r64
796	59115	0	0.0	1002.1	28.5	0.000	0.000	1.259	36.656	219994	50.3	3.721	136	17.3	68.1	21.4	0.013	7480	7224	my8037_rel_o2nofp.cz11a_c24r64
796	58813	0	0.0	953.3	27.1	0.000	0.000	1.198	34.910	218660	50.3	3.718	137	17.5	68.3	21.5	0.006	7416	7176	my8038_rel_o2nofp.cz11a_c24r64
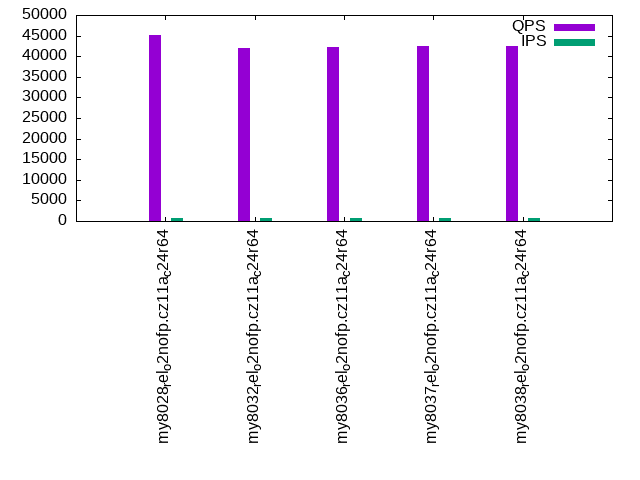
qp100.L2
qp100.L2: point queries with 100 insert/s per client. Graphs for performance per 1-second interval are here.
Average throughput:
Query response time histogram: each cell has the percentage of responses that take <= the time in the header and max is the max response time in seconds. For max values in the top 25% of the range have a red background and in the bottom 25% of the range have a green background. The red background is not used when the min value is within 80% of the max value.
| dbms | 256us | 1ms | 4ms | 16ms | 64ms | 256ms | 1s | 4s | 16s | gt | max |
|---|---|---|---|---|---|---|---|---|---|---|---|
| my8028_rel_o2nofp.cz11a_c24r64 | 99.095 | 0.895 | 0.010 | nonzero | 0.004 | ||||||
| my8032_rel_o2nofp.cz11a_c24r64 | 98.442 | 1.547 | 0.011 | nonzero | 0.004 | ||||||
| my8036_rel_o2nofp.cz11a_c24r64 | 98.502 | 1.488 | 0.010 | nonzero | 0.004 | ||||||
| my8037_rel_o2nofp.cz11a_c24r64 | 98.499 | 1.491 | 0.010 | 0.004 | |||||||
| my8038_rel_o2nofp.cz11a_c24r64 | 98.529 | 1.461 | 0.010 | nonzero | 0.004 |
Insert response time histogram: each cell has the percentage of responses that take <= the time in the header and max is the max response time in seconds. For max values in the top 25% of the range have a red background and in the bottom 25% of the range have a green background. The red background is not used when the min value is within 80% of the max value.
| dbms | 256us | 1ms | 4ms | 16ms | 64ms | 256ms | 1s | 4s | 16s | gt | max |
|---|---|---|---|---|---|---|---|---|---|---|---|
| my8028_rel_o2nofp.cz11a_c24r64 | 99.767 | 0.233 | 0.005 | ||||||||
| my8032_rel_o2nofp.cz11a_c24r64 | 99.278 | 0.722 | 0.007 | ||||||||
| my8036_rel_o2nofp.cz11a_c24r64 | 99.597 | 0.403 | 0.008 | ||||||||
| my8037_rel_o2nofp.cz11a_c24r64 | 99.677 | 0.323 | 0.006 | ||||||||
| my8038_rel_o2nofp.cz11a_c24r64 | 99.351 | 0.649 | 0.006 |
Delete response time histogram: each cell has the percentage of responses that take <= the time in the header and max is the max response time in seconds. For max values in the top 25% of the range have a red background and in the bottom 25% of the range have a green background. The red background is not used when the min value is within 80% of the max value.
| dbms | 256us | 1ms | 4ms | 16ms | 64ms | 256ms | 1s | 4s | 16s | gt | max |
|---|---|---|---|---|---|---|---|---|---|---|---|
| my8028_rel_o2nofp.cz11a_c24r64 | 0.660 | 99.274 | 0.066 | 0.005 | |||||||
| my8032_rel_o2nofp.cz11a_c24r64 | 99.764 | 0.236 | 0.006 | ||||||||
| my8036_rel_o2nofp.cz11a_c24r64 | 0.038 | 99.812 | 0.149 | 0.008 | |||||||
| my8037_rel_o2nofp.cz11a_c24r64 | 0.049 | 99.851 | 0.101 | 0.006 | |||||||
| my8038_rel_o2nofp.cz11a_c24r64 | 0.007 | 99.722 | 0.271 | 0.005 |
Performance metrics for the DBMS listed above. Some are normalized by throughput, others are not. Legend for results is here.
ips	qps	rps	rmbps	wps	wmbps	rpq	rkbpq	wpi	wkbpi	csps	cpups	cspq	cpupq	dbgb1	dbgb2	rss	maxop	p50	p99	tag
796	45213	0	0.0	93.0	3.1	0.000	0.000	0.117	3.961	176538	48.9	3.905	173	17.7	68.5	21.8	0.004	5705	5562	my8028_rel_o2nofp.cz11a_c24r64
796	41993	0	0.0	90.5	3.2	0.000	0.000	0.114	4.113	163104	48.8	3.884	186	17.5	68.2	21.5	0.004	5274	5161	my8032_rel_o2nofp.cz11a_c24r64
796	42270	0	0.0	96.8	3.4	0.000	0.000	0.122	4.369	164523	48.7	3.892	184	17.6	68.5	21.6	0.004	5307	5194	my8036_rel_o2nofp.cz11a_c24r64
796	42416	0	0.0	109.5	3.7	0.000	0.000	0.138	4.768	165233	48.7	3.896	184	17.3	68.2	21.4	0.004	5335	5210	my8037_rel_o2nofp.cz11a_c24r64
796	42356	0	0.0	93.7	3.3	0.000	0.000	0.118	4.186	165046	48.8	3.897	184	17.5	68.3	21.5	0.004	5323	5194	my8038_rel_o2nofp.cz11a_c24r64
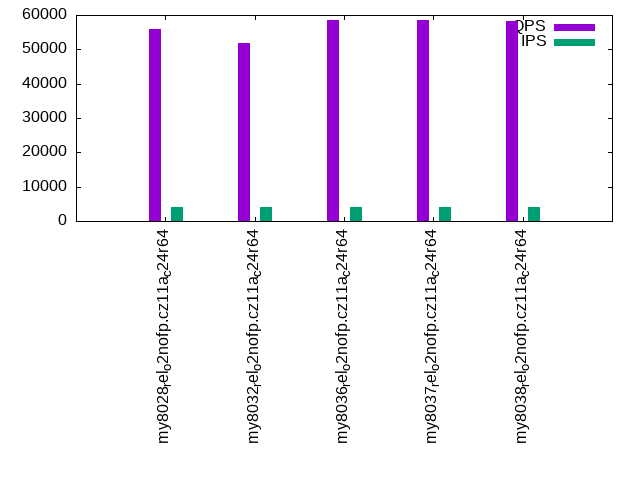
qr500.L3
qr500.L3: range queries with 500 insert/s per client. Graphs for performance per 1-second interval are here.
Average throughput:
Query response time histogram: each cell has the percentage of responses that take <= the time in the header and max is the max response time in seconds. For max values in the top 25% of the range have a red background and in the bottom 25% of the range have a green background. The red background is not used when the min value is within 80% of the max value.
| dbms | 256us | 1ms | 4ms | 16ms | 64ms | 256ms | 1s | 4s | 16s | gt | max |
|---|---|---|---|---|---|---|---|---|---|---|---|
| my8028_rel_o2nofp.cz11a_c24r64 | 99.901 | 0.080 | 0.018 | 0.001 | nonzero | 0.017 | |||||
| my8032_rel_o2nofp.cz11a_c24r64 | 99.862 | 0.118 | 0.019 | 0.001 | nonzero | 0.020 | |||||
| my8036_rel_o2nofp.cz11a_c24r64 | 99.921 | 0.063 | 0.016 | 0.001 | nonzero | 0.020 | |||||
| my8037_rel_o2nofp.cz11a_c24r64 | 99.920 | 0.063 | 0.015 | 0.001 | nonzero | 0.025 | |||||
| my8038_rel_o2nofp.cz11a_c24r64 | 99.919 | 0.065 | 0.015 | 0.001 | nonzero | 0.017 |
Insert response time histogram: each cell has the percentage of responses that take <= the time in the header and max is the max response time in seconds. For max values in the top 25% of the range have a red background and in the bottom 25% of the range have a green background. The red background is not used when the min value is within 80% of the max value.
| dbms | 256us | 1ms | 4ms | 16ms | 64ms | 256ms | 1s | 4s | 16s | gt | max |
|---|---|---|---|---|---|---|---|---|---|---|---|
| my8028_rel_o2nofp.cz11a_c24r64 | 85.612 | 14.305 | 0.083 | 0.030 | |||||||
| my8032_rel_o2nofp.cz11a_c24r64 | 83.928 | 15.905 | 0.167 | 0.033 | |||||||
| my8036_rel_o2nofp.cz11a_c24r64 | 82.874 | 17.000 | 0.126 | 0.028 | |||||||
| my8037_rel_o2nofp.cz11a_c24r64 | 84.204 | 15.693 | 0.103 | 0.026 | |||||||
| my8038_rel_o2nofp.cz11a_c24r64 | 85.999 | 13.926 | 0.075 | 0.028 |
Delete response time histogram: each cell has the percentage of responses that take <= the time in the header and max is the max response time in seconds. For max values in the top 25% of the range have a red background and in the bottom 25% of the range have a green background. The red background is not used when the min value is within 80% of the max value.
| dbms | 256us | 1ms | 4ms | 16ms | 64ms | 256ms | 1s | 4s | 16s | gt | max |
|---|---|---|---|---|---|---|---|---|---|---|---|
| my8028_rel_o2nofp.cz11a_c24r64 | 2.367 | 88.893 | 8.710 | 0.030 | 0.030 | ||||||
| my8032_rel_o2nofp.cz11a_c24r64 | 0.045 | 89.639 | 10.231 | 0.085 | 0.028 | ||||||
| my8036_rel_o2nofp.cz11a_c24r64 | 0.324 | 88.879 | 10.735 | 0.062 | 0.024 | ||||||
| my8037_rel_o2nofp.cz11a_c24r64 | 0.460 | 89.476 | 10.032 | 0.033 | 0.021 | ||||||
| my8038_rel_o2nofp.cz11a_c24r64 | 0.705 | 90.433 | 8.833 | 0.028 | 0.023 |
Performance metrics for the DBMS listed above. Some are normalized by throughput, others are not. Legend for results is here.
ips	qps	rps	rmbps	wps	wmbps	rpq	rkbpq	wpi	wkbpi	csps	cpups	cspq	cpupq	dbgb1	dbgb2	rss	maxop	p50	p99	tag
3982	55878	0	0.0	381.5	14.0	0.000	0.000	0.096	3.607	205372	51.6	3.675	148	17.7	68.5	21.8	0.017	7000	6755	my8028_rel_o2nofp.cz11a_c24r64
3980	51768	0	0.0	590.2	20.9	0.000	0.000	0.148	5.365	190246	51.9	3.675	160	17.5	68.2	21.5	0.020	6489	6219	my8032_rel_o2nofp.cz11a_c24r64
3980	58495	0	0.0	591.9	20.9	0.000	0.000	0.149	5.370	214464	51.8	3.666	142	17.6	68.5	21.6	0.020	7306	7053	my8036_rel_o2nofp.cz11a_c24r64
3980	58621	0	0.0	587.4	20.8	0.000	0.000	0.148	5.348	215022	51.8	3.668	141	17.3	68.2	21.4	0.025	7336	7081	my8037_rel_o2nofp.cz11a_c24r64
3978	58290	0	0.0	582.3	20.6	0.000	0.000	0.146	5.298	213267	51.8	3.659	142	17.5	68.3	21.5	0.017	7320	7037	my8038_rel_o2nofp.cz11a_c24r64
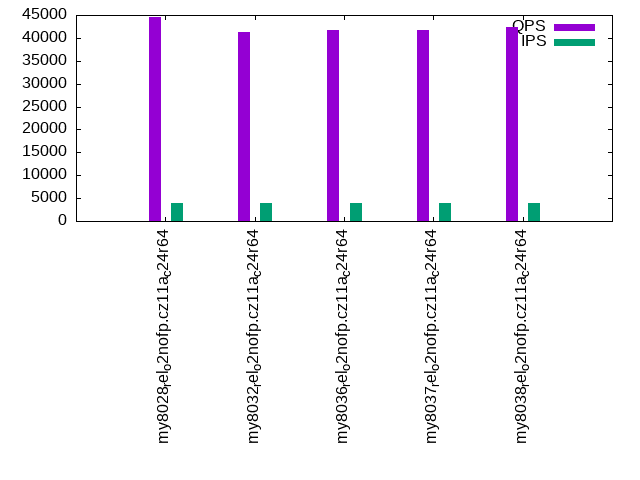
qp500.L4
qp500.L4: point queries with 500 insert/s per client. Graphs for performance per 1-second interval are here.
Average throughput:
Query response time histogram: each cell has the percentage of responses that take <= the time in the header and max is the max response time in seconds. For max values in the top 25% of the range have a red background and in the bottom 25% of the range have a green background. The red background is not used when the min value is within 80% of the max value.
| dbms | 256us | 1ms | 4ms | 16ms | 64ms | 256ms | 1s | 4s | 16s | gt | max |
|---|---|---|---|---|---|---|---|---|---|---|---|
| my8028_rel_o2nofp.cz11a_c24r64 | 98.336 | 1.588 | 0.074 | 0.001 | 0.014 | ||||||
| my8032_rel_o2nofp.cz11a_c24r64 | 97.787 | 2.138 | 0.073 | 0.002 | nonzero | 0.016 | |||||
| my8036_rel_o2nofp.cz11a_c24r64 | 97.760 | 2.169 | 0.069 | 0.002 | 0.016 | ||||||
| my8037_rel_o2nofp.cz11a_c24r64 | 97.833 | 2.096 | 0.070 | 0.002 | nonzero | 0.017 | |||||
| my8038_rel_o2nofp.cz11a_c24r64 | 98.000 | 1.929 | 0.070 | 0.002 | 0.016 |
Insert response time histogram: each cell has the percentage of responses that take <= the time in the header and max is the max response time in seconds. For max values in the top 25% of the range have a red background and in the bottom 25% of the range have a green background. The red background is not used when the min value is within 80% of the max value.
| dbms | 256us | 1ms | 4ms | 16ms | 64ms | 256ms | 1s | 4s | 16s | gt | max |
|---|---|---|---|---|---|---|---|---|---|---|---|
| my8028_rel_o2nofp.cz11a_c24r64 | 91.302 | 8.693 | 0.005 | 0.020 | |||||||
| my8032_rel_o2nofp.cz11a_c24r64 | 83.596 | 16.376 | 0.028 | 0.022 | |||||||
| my8036_rel_o2nofp.cz11a_c24r64 | 87.186 | 12.797 | 0.017 | 0.022 | |||||||
| my8037_rel_o2nofp.cz11a_c24r64 | 87.244 | 12.734 | 0.022 | 0.020 | |||||||
| my8038_rel_o2nofp.cz11a_c24r64 | 88.552 | 11.429 | 0.019 | 0.022 |
Delete response time histogram: each cell has the percentage of responses that take <= the time in the header and max is the max response time in seconds. For max values in the top 25% of the range have a red background and in the bottom 25% of the range have a green background. The red background is not used when the min value is within 80% of the max value.
| dbms | 256us | 1ms | 4ms | 16ms | 64ms | 256ms | 1s | 4s | 16s | gt | max |
|---|---|---|---|---|---|---|---|---|---|---|---|
| my8028_rel_o2nofp.cz11a_c24r64 | 0.433 | 94.432 | 5.133 | 0.002 | 0.019 | ||||||
| my8032_rel_o2nofp.cz11a_c24r64 | 0.011 | 89.056 | 10.919 | 0.014 | 0.024 | ||||||
| my8036_rel_o2nofp.cz11a_c24r64 | 0.067 | 91.697 | 8.228 | 0.008 | 0.020 | ||||||
| my8037_rel_o2nofp.cz11a_c24r64 | 0.177 | 91.663 | 8.151 | 0.009 | 0.020 | ||||||
| my8038_rel_o2nofp.cz11a_c24r64 | 0.084 | 92.759 | 7.148 | 0.009 | 0.025 |
Performance metrics for the DBMS listed above. Some are normalized by throughput, others are not. Legend for results is here.
ips	qps	rps	rmbps	wps	wmbps	rpq	rkbpq	wpi	wkbpi	csps	cpups	cspq	cpupq	dbgb1	dbgb2	rss	maxop	p50	p99	tag
3982	44538	0	0.0	495.6	17.2	0.000	0.000	0.124	4.429	174628	50.2	3.921	180	17.7	68.5	21.8	0.014	5580	5423	my8028_rel_o2nofp.cz11a_c24r64
3980	41391	0	0.0	594.1	20.9	0.000	0.000	0.149	5.384	155599	50.5	3.759	195	17.5	68.2	21.5	0.016	5194	5004	my8032_rel_o2nofp.cz11a_c24r64
3980	41690	0	0.0	598.2	21.1	0.000	0.000	0.150	5.437	158359	50.4	3.799	193	17.6	68.6	21.6	0.016	5242	5067	my8036_rel_o2nofp.cz11a_c24r64
3980	41753	0	0.0	599.6	21.2	0.000	0.000	0.151	5.453	157945	50.4	3.783	193	17.3	68.4	21.4	0.017	5239	5068	my8037_rel_o2nofp.cz11a_c24r64
3980	42449	0	0.0	588.8	20.8	0.000	0.000	0.148	5.353	162639	50.5	3.831	190	17.5	68.3	21.5	0.016	5322	5097	my8038_rel_o2nofp.cz11a_c24r64
qr1000.L5
qr1000.L5: range queries with 1000 insert/s per client. Graphs for performance per 1-second interval are here.
Average throughput:
Query response time histogram: each cell has the percentage of responses that take <= the time in the header and max is the max response time in seconds. For max values in the top 25% of the range have a red background and in the bottom 25% of the range have a green background. The red background is not used when the min value is within 80% of the max value.
| dbms | 256us | 1ms | 4ms | 16ms | 64ms | 256ms | 1s | 4s | 16s | gt | max |
|---|---|---|---|---|---|---|---|---|---|---|---|
| my8028_rel_o2nofp.cz11a_c24r64 | 99.681 | 0.265 | 0.050 | 0.004 | nonzero | 0.026 | |||||
| my8032_rel_o2nofp.cz11a_c24r64 | 99.493 | 0.446 | 0.056 | 0.005 | nonzero | 0.034 | |||||
| my8036_rel_o2nofp.cz11a_c24r64 | 99.744 | 0.212 | 0.041 | 0.003 | nonzero | 0.027 | |||||
| my8037_rel_o2nofp.cz11a_c24r64 | 99.751 | 0.206 | 0.040 | 0.003 | nonzero | 0.032 | |||||
| my8038_rel_o2nofp.cz11a_c24r64 | 99.758 | 0.196 | 0.042 | 0.004 | nonzero | 0.027 |
Insert response time histogram: each cell has the percentage of responses that take <= the time in the header and max is the max response time in seconds. For max values in the top 25% of the range have a red background and in the bottom 25% of the range have a green background. The red background is not used when the min value is within 80% of the max value.
| dbms | 256us | 1ms | 4ms | 16ms | 64ms | 256ms | 1s | 4s | 16s | gt | max |
|---|---|---|---|---|---|---|---|---|---|---|---|
| my8028_rel_o2nofp.cz11a_c24r64 | nonzero | 78.156 | 21.245 | 0.599 | 0.034 | ||||||
| my8032_rel_o2nofp.cz11a_c24r64 | 78.611 | 20.958 | 0.431 | 0.035 | |||||||
| my8036_rel_o2nofp.cz11a_c24r64 | 79.068 | 20.505 | 0.427 | 0.039 | |||||||
| my8037_rel_o2nofp.cz11a_c24r64 | 80.162 | 19.413 | 0.425 | 0.034 | |||||||
| my8038_rel_o2nofp.cz11a_c24r64 | 75.745 | 23.540 | 0.715 | 0.039 |
Delete response time histogram: each cell has the percentage of responses that take <= the time in the header and max is the max response time in seconds. For max values in the top 25% of the range have a red background and in the bottom 25% of the range have a green background. The red background is not used when the min value is within 80% of the max value.
| dbms | 256us | 1ms | 4ms | 16ms | 64ms | 256ms | 1s | 4s | 16s | gt | max |
|---|---|---|---|---|---|---|---|---|---|---|---|
| my8028_rel_o2nofp.cz11a_c24r64 | 1.085 | 81.910 | 16.592 | 0.414 | 0.035 | ||||||
| my8032_rel_o2nofp.cz11a_c24r64 | 0.128 | 82.977 | 16.591 | 0.303 | 0.036 | ||||||
| my8036_rel_o2nofp.cz11a_c24r64 | 0.416 | 83.175 | 16.086 | 0.323 | 0.036 | ||||||
| my8037_rel_o2nofp.cz11a_c24r64 | 0.554 | 84.145 | 14.985 | 0.316 | 0.037 | ||||||
| my8038_rel_o2nofp.cz11a_c24r64 | 0.269 | 80.450 | 18.767 | 0.514 | 0.040 |
Performance metrics for the DBMS listed above. Some are normalized by throughput, others are not. Legend for results is here.
ips	qps	rps	rmbps	wps	wmbps	rpq	rkbpq	wpi	wkbpi	csps	cpups	cspq	cpupq	dbgb1	dbgb2	rss	maxop	p50	p99	tag
7965	54880	0	0.0	767.8	28.5	0.000	0.000	0.096	3.665	200089	53.3	3.646	155	17.7	68.5	21.8	0.026	6952	6409	my8028_rel_o2nofp.cz11a_c24r64
7960	50719	0	0.0	952.9	35.8	0.000	0.000	0.120	4.601	185040	53.9	3.648	170	17.5	68.2	21.5	0.034	6393	5914	my8032_rel_o2nofp.cz11a_c24r64
7965	57383	0	0.0	953.6	35.8	0.000	0.000	0.120	4.606	207441	53.8	3.615	150	17.6	68.6	21.6	0.027	7240	6665	my8036_rel_o2nofp.cz11a_c24r64
7960	57568	0	0.0	956.7	35.8	0.000	0.000	0.120	4.609	208733	53.9	3.626	150	17.3	68.4	21.4	0.032	7291	6729	my8037_rel_o2nofp.cz11a_c24r64
7960	57338	0	0.0	950.1	35.7	0.000	0.000	0.119	4.597	207485	53.9	3.619	150	17.5	68.3	21.5	0.027	7226	6665	my8038_rel_o2nofp.cz11a_c24r64
qp1000.L6
qp1000.L6: point queries with 1000 insert/s per client. Graphs for performance per 1-second interval are here.
Average throughput:
Query response time histogram: each cell has the percentage of responses that take <= the time in the header and max is the max response time in seconds. For max values in the top 25% of the range have a red background and in the bottom 25% of the range have a green background. The red background is not used when the min value is within 80% of the max value.
| dbms | 256us | 1ms | 4ms | 16ms | 64ms | 256ms | 1s | 4s | 16s | gt | max |
|---|---|---|---|---|---|---|---|---|---|---|---|
| my8028_rel_o2nofp.cz11a_c24r64 | 97.768 | 2.098 | 0.129 | 0.006 | nonzero | 0.024 | |||||
| my8032_rel_o2nofp.cz11a_c24r64 | 97.922 | 1.980 | 0.091 | 0.006 | nonzero | 0.025 | |||||
| my8036_rel_o2nofp.cz11a_c24r64 | 98.064 | 1.840 | 0.090 | 0.006 | nonzero | 0.024 | |||||
| my8037_rel_o2nofp.cz11a_c24r64 | 97.901 | 1.986 | 0.107 | 0.006 | nonzero | 0.027 | |||||
| my8038_rel_o2nofp.cz11a_c24r64 | 97.988 | 1.905 | 0.100 | 0.006 | nonzero | 0.036 |
Insert response time histogram: each cell has the percentage of responses that take <= the time in the header and max is the max response time in seconds. For max values in the top 25% of the range have a red background and in the bottom 25% of the range have a green background. The red background is not used when the min value is within 80% of the max value.
| dbms | 256us | 1ms | 4ms | 16ms | 64ms | 256ms | 1s | 4s | 16s | gt | max |
|---|---|---|---|---|---|---|---|---|---|---|---|
| my8028_rel_o2nofp.cz11a_c24r64 | 81.594 | 18.247 | 0.160 | 0.029 | |||||||
| my8032_rel_o2nofp.cz11a_c24r64 | 78.499 | 21.065 | 0.436 | 0.037 | |||||||
| my8036_rel_o2nofp.cz11a_c24r64 | 79.720 | 20.006 | 0.275 | 0.035 | |||||||
| my8037_rel_o2nofp.cz11a_c24r64 | 76.182 | 23.408 | 0.411 | 0.034 | |||||||
| my8038_rel_o2nofp.cz11a_c24r64 | 77.341 | 22.247 | 0.413 | 0.039 |
Delete response time histogram: each cell has the percentage of responses that take <= the time in the header and max is the max response time in seconds. For max values in the top 25% of the range have a red background and in the bottom 25% of the range have a green background. The red background is not used when the min value is within 80% of the max value.
| dbms | 256us | 1ms | 4ms | 16ms | 64ms | 256ms | 1s | 4s | 16s | gt | max |
|---|---|---|---|---|---|---|---|---|---|---|---|
| my8028_rel_o2nofp.cz11a_c24r64 | 0.411 | 85.671 | 13.807 | 0.110 | 0.027 | ||||||
| my8032_rel_o2nofp.cz11a_c24r64 | 0.024 | 83.197 | 16.497 | 0.283 | 0.035 | ||||||
| my8036_rel_o2nofp.cz11a_c24r64 | 0.157 | 84.195 | 15.464 | 0.183 | 0.032 | ||||||
| my8037_rel_o2nofp.cz11a_c24r64 | 0.041 | 81.041 | 18.623 | 0.294 | 0.030 | ||||||
| my8038_rel_o2nofp.cz11a_c24r64 | 0.071 | 82.298 | 17.332 | 0.299 | 0.035 |
Performance metrics for the DBMS listed above. Some are normalized by throughput, others are not. Legend for results is here.
ips	qps	rps	rmbps	wps	wmbps	rpq	rkbpq	wpi	wkbpi	csps	cpups	cspq	cpupq	dbgb1	dbgb2	rss	maxop	p50	p99	tag
7960	43616	0	0.0	785.4	29.0	0.000	0.000	0.099	3.725	166333	51.9	3.814	190	17.7	68.5	21.8	0.024	5452	5265	my8028_rel_o2nofp.cz11a_c24r64
7960	41380	0	0.0	978.6	36.5	0.000	0.000	0.123	4.695	148324	52.9	3.584	205	17.5	68.2	21.5	0.025	5195	4955	my8032_rel_o2nofp.cz11a_c24r64
7960	41724	0	0.0	979.3	36.6	0.000	0.000	0.123	4.705	149673	52.8	3.587	202	17.6	68.8	21.6	0.024	5259	5019	my8036_rel_o2nofp.cz11a_c24r64
7960	41877	0	0.0	985.6	36.7	0.000	0.000	0.124	4.715	152525	52.8	3.642	202	17.3	68.5	21.4	0.027	5242	4971	my8037_rel_o2nofp.cz11a_c24r64
7960	41754	0	0.0	978.3	36.4	0.000	0.000	0.123	4.684	151286	52.7	3.623	202	17.5	68.3	21.5	0.036	5258	5020	my8038_rel_o2nofp.cz11a_c24r64
l.i0
l.i0: load without secondary indexes
Performance metrics for all DBMS, not just the ones listed above. Some are normalized by throughput, others are not. Legend for results is here.
ips	qps	rps	rmbps	wps	wmbps	rpq	rkbpq	wpi	wkbpi	csps	cpups	cspq	cpupq	dbgb1	dbgb2	rss	maxop	p50	p99	tag
666667	0	0	0.0	1521.9	188.7	0.000	0.000	0.002	0.290	146990	62.5	0.220	15	5.3	55.9	9.2	0.480	103390	54941	my8028_rel_o2nofp.cz11a_c24r64
640000	0	0	0.0	1376.2	175.7	0.000	0.000	0.002	0.281	114429	62.0	0.179	16	5.3	55.9	8.9	0.476	95198	53842	my8032_rel_o2nofp.cz11a_c24r64
640000	0	0	0.0	1579.7	181.4	0.000	0.000	0.002	0.290	123770	62.0	0.193	16	5.3	55.9	8.9	0.497	95798	54758	my8036_rel_o2nofp.cz11a_c24r64
640000	0	0	0.0	1589.2	181.8	0.000	0.000	0.002	0.291	120028	61.6	0.188	15	5.3	55.9	8.9	0.488	95327	54342	my8037_rel_o2nofp.cz11a_c24r64
640000	0	0	0.0	1588.5	181.7	0.000	0.000	0.002	0.291	111105	61.9	0.174	15	5.3	55.9	8.9	0.496	96197	61633	my8038_rel_o2nofp.cz11a_c24r64
l.x
l.x: create secondary indexes
Performance metrics for all DBMS, not just the ones listed above. Some are normalized by throughput, others are not. Legend for results is here.
ips	qps	rps	rmbps	wps	wmbps	rpq	rkbpq	wpi	wkbpi	csps	cpups	cspq	cpupq	dbgb1	dbgb2	rss	maxop	p50	p99	tag
601504	0	3487	210.9	13418.9	641.6	0.006	0.359	0.022	1.092	41678	40.1	0.069	11	12.1	62.7	14.5	0.001	NA	NA	my8028_rel_o2nofp.cz11a_c24r64
588236	0	3367	203.2	13532.4	627.7	0.006	0.354	0.023	1.093	41016	48.4	0.070	13	12.1	62.7	13.9	0.002	NA	NA	my8032_rel_o2nofp.cz11a_c24r64
606061	0	3488	210.9	13509.1	641.5	0.006	0.356	0.022	1.084	39920	48.7	0.066	13	12.1	62.7	14.1	0.002	NA	NA	my8036_rel_o2nofp.cz11a_c24r64
597016	0	3488	210.8	13286.7	640.5	0.006	0.362	0.022	1.099	40304	47.8	0.068	13	12.1	62.7	14.2	0.002	NA	NA	my8037_rel_o2nofp.cz11a_c24r64
592593	0	3367	203.2	13482.3	626.1	0.006	0.351	0.023	1.082	40364	48.1	0.068	13	12.1	62.7	14.2	0.002	NA	NA	my8038_rel_o2nofp.cz11a_c24r64
l.i1
l.i1: continue load after secondary indexes created with 50 inserts per transaction
Performance metrics for all DBMS, not just the ones listed above. Some are normalized by throughput, others are not. Legend for results is here.
ips	qps	rps	rmbps	wps	wmbps	rpq	rkbpq	wpi	wkbpi	csps	cpups	cspq	cpupq	dbgb1	dbgb2	rss	maxop	p50	p99	tag
124079	0	150	2.3	7001.0	327.8	0.001	0.019	0.056	2.705	183903	78.2	1.482	101	17.7	68.5	21.8	0.739	16037	7991	my8028_rel_o2nofp.cz11a_c24r64
110803	0	134	2.1	7878.6	375.0	0.001	0.019	0.071	3.466	181093	78.6	1.634	113	17.5	68.2	21.5	0.925	14435	5744	my8032_rel_o2nofp.cz11a_c24r64
114326	0	138	2.2	8076.7	384.9	0.001	0.019	0.071	3.447	180392	77.8	1.578	109	17.6	68.3	21.6	0.792	14934	5944	my8036_rel_o2nofp.cz11a_c24r64
114942	0	139	2.2	8087.0	386.5	0.001	0.019	0.070	3.443	180773	77.6	1.573	108	17.3	68.1	21.4	1.242	15038	6293	my8037_rel_o2nofp.cz11a_c24r64
113879	0	137	2.1	8052.7	383.5	0.001	0.019	0.071	3.448	178950	77.8	1.571	109	17.5	68.3	21.5	0.833	14937	6045	my8038_rel_o2nofp.cz11a_c24r64
l.i2
l.i2: continue load after secondary indexes created with 5 inserts per transaction
Performance metrics for all DBMS, not just the ones listed above. Some are normalized by throughput, others are not. Legend for results is here.
ips	qps	rps	rmbps	wps	wmbps	rpq	rkbpq	wpi	wkbpi	csps	cpups	cspq	cpupq	dbgb1	dbgb2	rss	maxop	p50	p99	tag
55710	0	0	0.0	3963.9	172.2	0.000	0.000	0.071	3.165	274061	71.5	4.919	205	17.7	68.5	21.8	0.569	7103	4167	my8028_rel_o2nofp.cz11a_c24r64
51414	0	0	0.0	4514.0	196.2	0.000	0.000	0.088	3.907	260901	72.1	5.075	224	17.5	68.2	21.5	0.550	6533	3996	my8032_rel_o2nofp.cz11a_c24r64
51914	0	0	0.0	4551.9	197.6	0.000	0.000	0.088	3.897	261852	71.4	5.044	220	17.6	68.3	21.6	0.544	6618	3782	my8036_rel_o2nofp.cz11a_c24r64
52459	0	0	0.0	4580.7	199.2	0.000	0.000	0.087	3.889	263807	71.5	5.029	218	17.3	68.1	21.4	0.571	6694	3501	my8037_rel_o2nofp.cz11a_c24r64
52151	0	0	0.0	4549.2	197.7	0.000	0.000	0.087	3.882	265104	71.3	5.083	219	17.5	68.3	21.5	0.557	6638	3706	my8038_rel_o2nofp.cz11a_c24r64
qr100.L1
qr100.L1: range queries with 100 insert/s per client
Performance metrics for all DBMS, not just the ones listed above. Some are normalized by throughput, others are not. Legend for results is here.
ips	qps	rps	rmbps	wps	wmbps	rpq	rkbpq	wpi	wkbpi	csps	cpups	cspq	cpupq	dbgb1	dbgb2	rss	maxop	p50	p99	tag
796	56489	0	0.0	862.0	24.4	0.000	0.000	1.083	31.429	210804	50.3	3.732	142	17.7	68.5	21.8	0.007	7112	6841	my8028_rel_o2nofp.cz11a_c24r64
796	52500	0	0.0	827.9	23.6	0.000	0.000	1.040	30.375	195903	50.3	3.732	153	17.5	68.2	21.5	0.007	6601	6409	my8032_rel_o2nofp.cz11a_c24r64
796	59042	0	0.0	778.2	22.2	0.000	0.000	0.978	28.622	219902	50.2	3.725	136	17.6	68.3	21.6	0.012	7432	7198	my8036_rel_o2nofp.cz11a_c24r64
796	59115	0	0.0	1002.1	28.5	0.000	0.000	1.259	36.656	219994	50.3	3.721	136	17.3	68.1	21.4	0.013	7480	7224	my8037_rel_o2nofp.cz11a_c24r64
796	58813	0	0.0	953.3	27.1	0.000	0.000	1.198	34.910	218660	50.3	3.718	137	17.5	68.3	21.5	0.006	7416	7176	my8038_rel_o2nofp.cz11a_c24r64
qp100.L2
qp100.L2: point queries with 100 insert/s per client
Performance metrics for all DBMS, not just the ones listed above. Some are normalized by throughput, others are not. Legend for results is here.
ips	qps	rps	rmbps	wps	wmbps	rpq	rkbpq	wpi	wkbpi	csps	cpups	cspq	cpupq	dbgb1	dbgb2	rss	maxop	p50	p99	tag
796	45213	0	0.0	93.0	3.1	0.000	0.000	0.117	3.961	176538	48.9	3.905	173	17.7	68.5	21.8	0.004	5705	5562	my8028_rel_o2nofp.cz11a_c24r64
796	41993	0	0.0	90.5	3.2	0.000	0.000	0.114	4.113	163104	48.8	3.884	186	17.5	68.2	21.5	0.004	5274	5161	my8032_rel_o2nofp.cz11a_c24r64
796	42270	0	0.0	96.8	3.4	0.000	0.000	0.122	4.369	164523	48.7	3.892	184	17.6	68.5	21.6	0.004	5307	5194	my8036_rel_o2nofp.cz11a_c24r64
796	42416	0	0.0	109.5	3.7	0.000	0.000	0.138	4.768	165233	48.7	3.896	184	17.3	68.2	21.4	0.004	5335	5210	my8037_rel_o2nofp.cz11a_c24r64
796	42356	0	0.0	93.7	3.3	0.000	0.000	0.118	4.186	165046	48.8	3.897	184	17.5	68.3	21.5	0.004	5323	5194	my8038_rel_o2nofp.cz11a_c24r64
qr500.L3
qr500.L3: range queries with 500 insert/s per client
Performance metrics for all DBMS, not just the ones listed above. Some are normalized by throughput, others are not. Legend for results is here.
ips	qps	rps	rmbps	wps	wmbps	rpq	rkbpq	wpi	wkbpi	csps	cpups	cspq	cpupq	dbgb1	dbgb2	rss	maxop	p50	p99	tag
3982	55878	0	0.0	381.5	14.0	0.000	0.000	0.096	3.607	205372	51.6	3.675	148	17.7	68.5	21.8	0.017	7000	6755	my8028_rel_o2nofp.cz11a_c24r64
3980	51768	0	0.0	590.2	20.9	0.000	0.000	0.148	5.365	190246	51.9	3.675	160	17.5	68.2	21.5	0.020	6489	6219	my8032_rel_o2nofp.cz11a_c24r64
3980	58495	0	0.0	591.9	20.9	0.000	0.000	0.149	5.370	214464	51.8	3.666	142	17.6	68.5	21.6	0.020	7306	7053	my8036_rel_o2nofp.cz11a_c24r64
3980	58621	0	0.0	587.4	20.8	0.000	0.000	0.148	5.348	215022	51.8	3.668	141	17.3	68.2	21.4	0.025	7336	7081	my8037_rel_o2nofp.cz11a_c24r64
3978	58290	0	0.0	582.3	20.6	0.000	0.000	0.146	5.298	213267	51.8	3.659	142	17.5	68.3	21.5	0.017	7320	7037	my8038_rel_o2nofp.cz11a_c24r64
qp500.L4
qp500.L4: point queries with 500 insert/s per client
Performance metrics for all DBMS, not just the ones listed above. Some are normalized by throughput, others are not. Legend for results is here.
ips	qps	rps	rmbps	wps	wmbps	rpq	rkbpq	wpi	wkbpi	csps	cpups	cspq	cpupq	dbgb1	dbgb2	rss	maxop	p50	p99	tag
3982	44538	0	0.0	495.6	17.2	0.000	0.000	0.124	4.429	174628	50.2	3.921	180	17.7	68.5	21.8	0.014	5580	5423	my8028_rel_o2nofp.cz11a_c24r64
3980	41391	0	0.0	594.1	20.9	0.000	0.000	0.149	5.384	155599	50.5	3.759	195	17.5	68.2	21.5	0.016	5194	5004	my8032_rel_o2nofp.cz11a_c24r64
3980	41690	0	0.0	598.2	21.1	0.000	0.000	0.150	5.437	158359	50.4	3.799	193	17.6	68.6	21.6	0.016	5242	5067	my8036_rel_o2nofp.cz11a_c24r64
3980	41753	0	0.0	599.6	21.2	0.000	0.000	0.151	5.453	157945	50.4	3.783	193	17.3	68.4	21.4	0.017	5239	5068	my8037_rel_o2nofp.cz11a_c24r64
3980	42449	0	0.0	588.8	20.8	0.000	0.000	0.148	5.353	162639	50.5	3.831	190	17.5	68.3	21.5	0.016	5322	5097	my8038_rel_o2nofp.cz11a_c24r64
qr1000.L5
qr1000.L5: range queries with 1000 insert/s per client
Performance metrics for all DBMS, not just the ones listed above. Some are normalized by throughput, others are not. Legend for results is here.
ips	qps	rps	rmbps	wps	wmbps	rpq	rkbpq	wpi	wkbpi	csps	cpups	cspq	cpupq	dbgb1	dbgb2	rss	maxop	p50	p99	tag
7965	54880	0	0.0	767.8	28.5	0.000	0.000	0.096	3.665	200089	53.3	3.646	155	17.7	68.5	21.8	0.026	6952	6409	my8028_rel_o2nofp.cz11a_c24r64
7960	50719	0	0.0	952.9	35.8	0.000	0.000	0.120	4.601	185040	53.9	3.648	170	17.5	68.2	21.5	0.034	6393	5914	my8032_rel_o2nofp.cz11a_c24r64
7965	57383	0	0.0	953.6	35.8	0.000	0.000	0.120	4.606	207441	53.8	3.615	150	17.6	68.6	21.6	0.027	7240	6665	my8036_rel_o2nofp.cz11a_c24r64
7960	57568	0	0.0	956.7	35.8	0.000	0.000	0.120	4.609	208733	53.9	3.626	150	17.3	68.4	21.4	0.032	7291	6729	my8037_rel_o2nofp.cz11a_c24r64
7960	57338	0	0.0	950.1	35.7	0.000	0.000	0.119	4.597	207485	53.9	3.619	150	17.5	68.3	21.5	0.027	7226	6665	my8038_rel_o2nofp.cz11a_c24r64
qp1000.L6
qp1000.L6: point queries with 1000 insert/s per client
Performance metrics for all DBMS, not just the ones listed above. Some are normalized by throughput, others are not. Legend for results is here.
ips	qps	rps	rmbps	wps	wmbps	rpq	rkbpq	wpi	wkbpi	csps	cpups	cspq	cpupq	dbgb1	dbgb2	rss	maxop	p50	p99	tag
7960	43616	0	0.0	785.4	29.0	0.000	0.000	0.099	3.725	166333	51.9	3.814	190	17.7	68.5	21.8	0.024	5452	5265	my8028_rel_o2nofp.cz11a_c24r64
7960	41380	0	0.0	978.6	36.5	0.000	0.000	0.123	4.695	148324	52.9	3.584	205	17.5	68.2	21.5	0.025	5195	4955	my8032_rel_o2nofp.cz11a_c24r64
7960	41724	0	0.0	979.3	36.6	0.000	0.000	0.123	4.705	149673	52.8	3.587	202	17.6	68.8	21.6	0.024	5259	5019	my8036_rel_o2nofp.cz11a_c24r64
7960	41877	0	0.0	985.6	36.7	0.000	0.000	0.124	4.715	152525	52.8	3.642	202	17.3	68.5	21.4	0.027	5242	4971	my8037_rel_o2nofp.cz11a_c24r64
7960	41754	0	0.0	978.3	36.4	0.000	0.000	0.123	4.684	151286	52.7	3.623	202	17.5	68.3	21.5	0.036	5258	5020	my8038_rel_o2nofp.cz11a_c24r64
l.i0
- l.i0: load without secondary indexes
- Legend for results is here.
- Each entry lists the percentage of responses that fit in that bucket (slower than max time for previous bucket, faster than min time for next bucket).
Insert response time histogram
256us	1ms	4ms	16ms	64ms	256ms	1s	4s	16s	gt	max	tag
0.000	92.130	7.763	0.061	0.027	0.005	0.014	0.000	0.000	0.000	0.480	my8028_rel_o2nofp.cz11a_c24r64
0.000	72.530	27.327	0.085	0.037	0.007	0.014	0.000	0.000	0.000	0.476	my8032_rel_o2nofp.cz11a_c24r64
0.000	72.662	27.205	0.077	0.035	0.007	0.014	0.000	0.000	0.000	0.497	my8036_rel_o2nofp.cz11a_c24r64
0.000	78.948	20.921	0.067	0.042	0.009	0.014	0.000	0.000	0.000	0.488	my8037_rel_o2nofp.cz11a_c24r64
0.000	77.627	22.236	0.080	0.037	0.007	0.014	0.000	0.000	0.000	0.496	my8038_rel_o2nofp.cz11a_c24r64
l.x
- l.x: create secondary indexes
- Legend for results is here.
- Each entry lists the percentage of responses that fit in that bucket (slower than max time for previous bucket, faster than min time for next bucket).
TODO - determine whether there is data for create index response time
l.i1
- l.i1: continue load after secondary indexes created with 50 inserts per transaction
- Legend for results is here.
- Each entry lists the percentage of responses that fit in that bucket (slower than max time for previous bucket, faster than min time for next bucket).
Insert response time histogram
256us	1ms	4ms	16ms	64ms	256ms	1s	4s	16s	gt	max	tag
0.000	0.001	84.976	14.748	0.231	0.027	0.016	0.000	0.000	0.000	0.739	my8028_rel_o2nofp.cz11a_c24r64
0.000	0.000	76.788	22.838	0.322	0.035	0.018	0.000	0.000	0.000	0.925	my8032_rel_o2nofp.cz11a_c24r64
0.000	nonzero	79.750	19.876	0.321	0.034	0.019	0.000	0.000	0.000	0.792	my8036_rel_o2nofp.cz11a_c24r64
0.000	0.000	80.216	19.407	0.320	0.038	0.018	nonzero	0.000	0.000	1.242	my8037_rel_o2nofp.cz11a_c24r64
0.000	0.000	79.378	20.255	0.315	0.034	0.018	0.000	0.000	0.000	0.833	my8038_rel_o2nofp.cz11a_c24r64
Delete response time histogram
256us	1ms	4ms	16ms	64ms	256ms	1s	4s	16s	gt	max	tag
0.000	0.390	89.249	10.148	0.178	0.020	0.014	0.000	0.000	0.000	0.738	my8028_rel_o2nofp.cz11a_c24r64
0.000	0.019	82.968	16.724	0.248	0.026	0.016	0.000	0.000	0.000	0.784	my8032_rel_o2nofp.cz11a_c24r64
0.000	0.043	85.124	14.540	0.250	0.026	0.016	0.000	0.000	0.000	0.788	my8036_rel_o2nofp.cz11a_c24r64
0.000	0.070	85.464	14.175	0.245	0.030	0.016	0.000	0.000	0.000	0.699	my8037_rel_o2nofp.cz11a_c24r64
0.000	0.056	84.774	14.886	0.243	0.026	0.015	0.000	0.000	0.000	0.828	my8038_rel_o2nofp.cz11a_c24r64
l.i2
- l.i2: continue load after secondary indexes created with 5 inserts per transaction
- Legend for results is here.
- Each entry lists the percentage of responses that fit in that bucket (slower than max time for previous bucket, faster than min time for next bucket).
Insert response time histogram
256us	1ms	4ms	16ms	64ms	256ms	1s	4s	16s	gt	max	tag
1.512	87.327	11.073	0.061	0.022	0.001	0.003	0.000	0.000	0.000	0.569	my8028_rel_o2nofp.cz11a_c24r64
0.088	84.350	15.441	0.085	0.031	0.001	0.003	0.000	0.000	0.000	0.550	my8032_rel_o2nofp.cz11a_c24r64
0.186	85.269	14.431	0.079	0.031	0.002	0.003	0.000	0.000	0.000	0.544	my8036_rel_o2nofp.cz11a_c24r64
0.237	85.768	13.879	0.083	0.029	0.002	0.003	0.000	0.000	0.000	0.571	my8037_rel_o2nofp.cz11a_c24r64
0.197	85.533	14.150	0.085	0.031	0.001	0.003	0.000	0.000	0.000	0.557	my8038_rel_o2nofp.cz11a_c24r64
Delete response time histogram
256us	1ms	4ms	16ms	64ms	256ms	1s	4s	16s	gt	max	tag
1.740	87.546	10.630	0.060	0.022	nonzero	0.003	0.000	0.000	0.000	0.568	my8028_rel_o2nofp.cz11a_c24r64
0.069	84.866	14.946	0.084	0.031	0.001	0.003	0.000	0.000	0.000	0.548	my8032_rel_o2nofp.cz11a_c24r64
0.231	85.903	13.754	0.077	0.030	0.002	0.003	0.000	0.000	0.000	0.544	my8036_rel_o2nofp.cz11a_c24r64
0.318	86.344	13.222	0.082	0.029	0.002	0.003	0.000	0.000	0.000	0.569	my8037_rel_o2nofp.cz11a_c24r64
0.229	86.131	13.522	0.084	0.030	0.001	0.003	0.000	0.000	0.000	0.555	my8038_rel_o2nofp.cz11a_c24r64
qr100.L1
- qr100.L1: range queries with 100 insert/s per client
- Legend for results is here.
- Each entry lists the percentage of responses that fit in that bucket (slower than max time for previous bucket, faster than min time for next bucket).
Query response time histogram
256us	1ms	4ms	16ms	64ms	256ms	1s	4s	16s	gt	max	tag
99.954	0.045	0.001	nonzero	0.000	0.000	0.000	0.000	0.000	0.000	0.007	my8028_rel_o2nofp.cz11a_c24r64
99.943	0.056	0.001	nonzero	0.000	0.000	0.000	0.000	0.000	0.000	0.007	my8032_rel_o2nofp.cz11a_c24r64
99.966	0.033	0.001	nonzero	0.000	0.000	0.000	0.000	0.000	0.000	0.012	my8036_rel_o2nofp.cz11a_c24r64
99.964	0.036	0.001	nonzero	0.000	0.000	0.000	0.000	0.000	0.000	0.013	my8037_rel_o2nofp.cz11a_c24r64
99.965	0.034	0.001	nonzero	0.000	0.000	0.000	0.000	0.000	0.000	0.006	my8038_rel_o2nofp.cz11a_c24r64
Insert response time histogram
256us	1ms	4ms	16ms	64ms	256ms	1s	4s	16s	gt	max	tag
0.000	0.000	98.528	1.472	0.000	0.000	0.000	0.000	0.000	0.000	0.010	my8028_rel_o2nofp.cz11a_c24r64
0.000	0.000	96.819	3.177	0.003	0.000	0.000	0.000	0.000	0.000	0.018	my8032_rel_o2nofp.cz11a_c24r64
0.000	0.000	97.347	2.653	0.000	0.000	0.000	0.000	0.000	0.000	0.014	my8036_rel_o2nofp.cz11a_c24r64
0.000	0.000	98.330	1.670	0.000	0.000	0.000	0.000	0.000	0.000	0.009	my8037_rel_o2nofp.cz11a_c24r64
0.000	0.000	98.177	1.823	0.000	0.000	0.000	0.000	0.000	0.000	0.009	my8038_rel_o2nofp.cz11a_c24r64
Delete response time histogram
256us	1ms	4ms	16ms	64ms	256ms	1s	4s	16s	gt	max	tag
0.000	1.878	97.441	0.681	0.000	0.000	0.000	0.000	0.000	0.000	0.011	my8028_rel_o2nofp.cz11a_c24r64
0.000	0.010	97.969	2.021	0.000	0.000	0.000	0.000	0.000	0.000	0.012	my8032_rel_o2nofp.cz11a_c24r64
0.000	0.507	97.938	1.556	0.000	0.000	0.000	0.000	0.000	0.000	0.013	my8036_rel_o2nofp.cz11a_c24r64
0.000	0.597	98.455	0.948	0.000	0.000	0.000	0.000	0.000	0.000	0.010	my8037_rel_o2nofp.cz11a_c24r64
0.000	0.441	98.604	0.955	0.000	0.000	0.000	0.000	0.000	0.000	0.009	my8038_rel_o2nofp.cz11a_c24r64
qp100.L2
- qp100.L2: point queries with 100 insert/s per client
- Legend for results is here.
- Each entry lists the percentage of responses that fit in that bucket (slower than max time for previous bucket, faster than min time for next bucket).
Query response time histogram
256us	1ms	4ms	16ms	64ms	256ms	1s	4s	16s	gt	max	tag
99.095	0.895	0.010	nonzero	0.000	0.000	0.000	0.000	0.000	0.000	0.004	my8028_rel_o2nofp.cz11a_c24r64
98.442	1.547	0.011	nonzero	0.000	0.000	0.000	0.000	0.000	0.000	0.004	my8032_rel_o2nofp.cz11a_c24r64
98.502	1.488	0.010	nonzero	0.000	0.000	0.000	0.000	0.000	0.000	0.004	my8036_rel_o2nofp.cz11a_c24r64
98.499	1.491	0.010	0.000	0.000	0.000	0.000	0.000	0.000	0.000	0.004	my8037_rel_o2nofp.cz11a_c24r64
98.529	1.461	0.010	nonzero	0.000	0.000	0.000	0.000	0.000	0.000	0.004	my8038_rel_o2nofp.cz11a_c24r64
Insert response time histogram
256us	1ms	4ms	16ms	64ms	256ms	1s	4s	16s	gt	max	tag
0.000	0.000	99.767	0.233	0.000	0.000	0.000	0.000	0.000	0.000	0.005	my8028_rel_o2nofp.cz11a_c24r64
0.000	0.000	99.278	0.722	0.000	0.000	0.000	0.000	0.000	0.000	0.007	my8032_rel_o2nofp.cz11a_c24r64
0.000	0.000	99.597	0.403	0.000	0.000	0.000	0.000	0.000	0.000	0.008	my8036_rel_o2nofp.cz11a_c24r64
0.000	0.000	99.677	0.323	0.000	0.000	0.000	0.000	0.000	0.000	0.006	my8037_rel_o2nofp.cz11a_c24r64
0.000	0.000	99.351	0.649	0.000	0.000	0.000	0.000	0.000	0.000	0.006	my8038_rel_o2nofp.cz11a_c24r64
Delete response time histogram
256us	1ms	4ms	16ms	64ms	256ms	1s	4s	16s	gt	max	tag
0.000	0.660	99.274	0.066	0.000	0.000	0.000	0.000	0.000	0.000	0.005	my8028_rel_o2nofp.cz11a_c24r64
0.000	0.000	99.764	0.236	0.000	0.000	0.000	0.000	0.000	0.000	0.006	my8032_rel_o2nofp.cz11a_c24r64
0.000	0.038	99.812	0.149	0.000	0.000	0.000	0.000	0.000	0.000	0.008	my8036_rel_o2nofp.cz11a_c24r64
0.000	0.049	99.851	0.101	0.000	0.000	0.000	0.000	0.000	0.000	0.006	my8037_rel_o2nofp.cz11a_c24r64
0.000	0.007	99.722	0.271	0.000	0.000	0.000	0.000	0.000	0.000	0.005	my8038_rel_o2nofp.cz11a_c24r64
qr500.L3
- qr500.L3: range queries with 500 insert/s per client
- Legend for results is here.
- Each entry lists the percentage of responses that fit in that bucket (slower than max time for previous bucket, faster than min time for next bucket).
Query response time histogram
256us	1ms	4ms	16ms	64ms	256ms	1s	4s	16s	gt	max	tag
99.901	0.080	0.018	0.001	nonzero	0.000	0.000	0.000	0.000	0.000	0.017	my8028_rel_o2nofp.cz11a_c24r64
99.862	0.118	0.019	0.001	nonzero	0.000	0.000	0.000	0.000	0.000	0.020	my8032_rel_o2nofp.cz11a_c24r64
99.921	0.063	0.016	0.001	nonzero	0.000	0.000	0.000	0.000	0.000	0.020	my8036_rel_o2nofp.cz11a_c24r64
99.920	0.063	0.015	0.001	nonzero	0.000	0.000	0.000	0.000	0.000	0.025	my8037_rel_o2nofp.cz11a_c24r64
99.919	0.065	0.015	0.001	nonzero	0.000	0.000	0.000	0.000	0.000	0.017	my8038_rel_o2nofp.cz11a_c24r64
Insert response time histogram
256us	1ms	4ms	16ms	64ms	256ms	1s	4s	16s	gt	max	tag
0.000	0.000	85.612	14.305	0.083	0.000	0.000	0.000	0.000	0.000	0.030	my8028_rel_o2nofp.cz11a_c24r64
0.000	0.000	83.928	15.905	0.167	0.000	0.000	0.000	0.000	0.000	0.033	my8032_rel_o2nofp.cz11a_c24r64
0.000	0.000	82.874	17.000	0.126	0.000	0.000	0.000	0.000	0.000	0.028	my8036_rel_o2nofp.cz11a_c24r64
0.000	0.000	84.204	15.693	0.103	0.000	0.000	0.000	0.000	0.000	0.026	my8037_rel_o2nofp.cz11a_c24r64
0.000	0.000	85.999	13.926	0.075	0.000	0.000	0.000	0.000	0.000	0.028	my8038_rel_o2nofp.cz11a_c24r64
Delete response time histogram
256us	1ms	4ms	16ms	64ms	256ms	1s	4s	16s	gt	max	tag
0.000	2.367	88.893	8.710	0.030	0.000	0.000	0.000	0.000	0.000	0.030	my8028_rel_o2nofp.cz11a_c24r64
0.000	0.045	89.639	10.231	0.085	0.000	0.000	0.000	0.000	0.000	0.028	my8032_rel_o2nofp.cz11a_c24r64
0.000	0.324	88.879	10.735	0.062	0.000	0.000	0.000	0.000	0.000	0.024	my8036_rel_o2nofp.cz11a_c24r64
0.000	0.460	89.476	10.032	0.033	0.000	0.000	0.000	0.000	0.000	0.021	my8037_rel_o2nofp.cz11a_c24r64
0.000	0.705	90.433	8.833	0.028	0.000	0.000	0.000	0.000	0.000	0.023	my8038_rel_o2nofp.cz11a_c24r64
qp500.L4
- qp500.L4: point queries with 500 insert/s per client
- Legend for results is here.
- Each entry lists the percentage of responses that fit in that bucket (slower than max time for previous bucket, faster than min time for next bucket).
Query response time histogram
256us	1ms	4ms	16ms	64ms	256ms	1s	4s	16s	gt	max	tag
98.336	1.588	0.074	0.001	0.000	0.000	0.000	0.000	0.000	0.000	0.014	my8028_rel_o2nofp.cz11a_c24r64
97.787	2.138	0.073	0.002	nonzero	0.000	0.000	0.000	0.000	0.000	0.016	my8032_rel_o2nofp.cz11a_c24r64
97.760	2.169	0.069	0.002	0.000	0.000	0.000	0.000	0.000	0.000	0.016	my8036_rel_o2nofp.cz11a_c24r64
97.833	2.096	0.070	0.002	nonzero	0.000	0.000	0.000	0.000	0.000	0.017	my8037_rel_o2nofp.cz11a_c24r64
98.000	1.929	0.070	0.002	0.000	0.000	0.000	0.000	0.000	0.000	0.016	my8038_rel_o2nofp.cz11a_c24r64
Insert response time histogram
256us	1ms	4ms	16ms	64ms	256ms	1s	4s	16s	gt	max	tag
0.000	0.000	91.302	8.693	0.005	0.000	0.000	0.000	0.000	0.000	0.020	my8028_rel_o2nofp.cz11a_c24r64
0.000	0.000	83.596	16.376	0.028	0.000	0.000	0.000	0.000	0.000	0.022	my8032_rel_o2nofp.cz11a_c24r64
0.000	0.000	87.186	12.797	0.017	0.000	0.000	0.000	0.000	0.000	0.022	my8036_rel_o2nofp.cz11a_c24r64
0.000	0.000	87.244	12.734	0.022	0.000	0.000	0.000	0.000	0.000	0.020	my8037_rel_o2nofp.cz11a_c24r64
0.000	0.000	88.552	11.429	0.019	0.000	0.000	0.000	0.000	0.000	0.022	my8038_rel_o2nofp.cz11a_c24r64
Delete response time histogram
256us	1ms	4ms	16ms	64ms	256ms	1s	4s	16s	gt	max	tag
0.000	0.433	94.432	5.133	0.002	0.000	0.000	0.000	0.000	0.000	0.019	my8028_rel_o2nofp.cz11a_c24r64
0.000	0.011	89.056	10.919	0.014	0.000	0.000	0.000	0.000	0.000	0.024	my8032_rel_o2nofp.cz11a_c24r64
0.000	0.067	91.697	8.228	0.008	0.000	0.000	0.000	0.000	0.000	0.020	my8036_rel_o2nofp.cz11a_c24r64
0.000	0.177	91.663	8.151	0.009	0.000	0.000	0.000	0.000	0.000	0.020	my8037_rel_o2nofp.cz11a_c24r64
0.000	0.084	92.759	7.148	0.009	0.000	0.000	0.000	0.000	0.000	0.025	my8038_rel_o2nofp.cz11a_c24r64
qr1000.L5
- qr1000.L5: range queries with 1000 insert/s per client
- Legend for results is here.
- Each entry lists the percentage of responses that fit in that bucket (slower than max time for previous bucket, faster than min time for next bucket).
Query response time histogram
256us	1ms	4ms	16ms	64ms	256ms	1s	4s	16s	gt	max	tag
99.681	0.265	0.050	0.004	nonzero	0.000	0.000	0.000	0.000	0.000	0.026	my8028_rel_o2nofp.cz11a_c24r64
99.493	0.446	0.056	0.005	nonzero	0.000	0.000	0.000	0.000	0.000	0.034	my8032_rel_o2nofp.cz11a_c24r64
99.744	0.212	0.041	0.003	nonzero	0.000	0.000	0.000	0.000	0.000	0.027	my8036_rel_o2nofp.cz11a_c24r64
99.751	0.206	0.040	0.003	nonzero	0.000	0.000	0.000	0.000	0.000	0.032	my8037_rel_o2nofp.cz11a_c24r64
99.758	0.196	0.042	0.004	nonzero	0.000	0.000	0.000	0.000	0.000	0.027	my8038_rel_o2nofp.cz11a_c24r64
Insert response time histogram
256us	1ms	4ms	16ms	64ms	256ms	1s	4s	16s	gt	max	tag
0.000	nonzero	78.156	21.245	0.599	0.000	0.000	0.000	0.000	0.000	0.034	my8028_rel_o2nofp.cz11a_c24r64
0.000	0.000	78.611	20.958	0.431	0.000	0.000	0.000	0.000	0.000	0.035	my8032_rel_o2nofp.cz11a_c24r64
0.000	0.000	79.068	20.505	0.427	0.000	0.000	0.000	0.000	0.000	0.039	my8036_rel_o2nofp.cz11a_c24r64
0.000	0.000	80.162	19.413	0.425	0.000	0.000	0.000	0.000	0.000	0.034	my8037_rel_o2nofp.cz11a_c24r64
0.000	0.000	75.745	23.540	0.715	0.000	0.000	0.000	0.000	0.000	0.039	my8038_rel_o2nofp.cz11a_c24r64
Delete response time histogram
256us	1ms	4ms	16ms	64ms	256ms	1s	4s	16s	gt	max	tag
0.000	1.085	81.910	16.592	0.414	0.000	0.000	0.000	0.000	0.000	0.035	my8028_rel_o2nofp.cz11a_c24r64
0.000	0.128	82.977	16.591	0.303	0.000	0.000	0.000	0.000	0.000	0.036	my8032_rel_o2nofp.cz11a_c24r64
0.000	0.416	83.175	16.086	0.323	0.000	0.000	0.000	0.000	0.000	0.036	my8036_rel_o2nofp.cz11a_c24r64
0.000	0.554	84.145	14.985	0.316	0.000	0.000	0.000	0.000	0.000	0.037	my8037_rel_o2nofp.cz11a_c24r64
0.000	0.269	80.450	18.767	0.514	0.000	0.000	0.000	0.000	0.000	0.040	my8038_rel_o2nofp.cz11a_c24r64
qp1000.L6
- qp1000.L6: point queries with 1000 insert/s per client
- Legend for results is here.
- Each entry lists the percentage of responses that fit in that bucket (slower than max time for previous bucket, faster than min time for next bucket).
Query response time histogram
256us	1ms	4ms	16ms	64ms	256ms	1s	4s	16s	gt	max	tag
97.768	2.098	0.129	0.006	nonzero	0.000	0.000	0.000	0.000	0.000	0.024	my8028_rel_o2nofp.cz11a_c24r64
97.922	1.980	0.091	0.006	nonzero	0.000	0.000	0.000	0.000	0.000	0.025	my8032_rel_o2nofp.cz11a_c24r64
98.064	1.840	0.090	0.006	nonzero	0.000	0.000	0.000	0.000	0.000	0.024	my8036_rel_o2nofp.cz11a_c24r64
97.901	1.986	0.107	0.006	nonzero	0.000	0.000	0.000	0.000	0.000	0.027	my8037_rel_o2nofp.cz11a_c24r64
97.988	1.905	0.100	0.006	nonzero	0.000	0.000	0.000	0.000	0.000	0.036	my8038_rel_o2nofp.cz11a_c24r64
Insert response time histogram
256us	1ms	4ms	16ms	64ms	256ms	1s	4s	16s	gt	max	tag
0.000	0.000	81.594	18.247	0.160	0.000	0.000	0.000	0.000	0.000	0.029	my8028_rel_o2nofp.cz11a_c24r64
0.000	0.000	78.499	21.065	0.436	0.000	0.000	0.000	0.000	0.000	0.037	my8032_rel_o2nofp.cz11a_c24r64
0.000	0.000	79.720	20.006	0.275	0.000	0.000	0.000	0.000	0.000	0.035	my8036_rel_o2nofp.cz11a_c24r64
0.000	0.000	76.182	23.408	0.411	0.000	0.000	0.000	0.000	0.000	0.034	my8037_rel_o2nofp.cz11a_c24r64
0.000	0.000	77.341	22.247	0.413	0.000	0.000	0.000	0.000	0.000	0.039	my8038_rel_o2nofp.cz11a_c24r64
Delete response time histogram
256us	1ms	4ms	16ms	64ms	256ms	1s	4s	16s	gt	max	tag
0.000	0.411	85.671	13.807	0.110	0.000	0.000	0.000	0.000	0.000	0.027	my8028_rel_o2nofp.cz11a_c24r64
0.000	0.024	83.197	16.497	0.283	0.000	0.000	0.000	0.000	0.000	0.035	my8032_rel_o2nofp.cz11a_c24r64
0.000	0.157	84.195	15.464	0.183	0.000	0.000	0.000	0.000	0.000	0.032	my8036_rel_o2nofp.cz11a_c24r64
0.000	0.041	81.041	18.623	0.294	0.000	0.000	0.000	0.000	0.000	0.030	my8037_rel_o2nofp.cz11a_c24r64
0.000	0.071	82.298	17.332	0.299	0.000	0.000	0.000	0.000	0.000	0.035	my8038_rel_o2nofp.cz11a_c24r64