Introduction
This is a report for the insert benchmark with 1024M docs and 8 client(s). It is generated by scripts (bash, awk, sed) and Tufte might not be impressed. An overview of the insert benchmark is here and a short update is here. Below, by DBMS, I mean DBMS+version.config. An example is my8020.c10b40 where my means MySQL, 8020 is version 8.0.20 and c10b40 is the name for the configuration file.
The test server has is a c2d-standard-30 with HT off, 16 cores, 64G RAM, Ubuntu 22.04 and ext4 using SW RAID 0 and 2 NVMe devices. The benchmark was run with 8 clients and there were 1 or 3 connections per client (1 for queries or inserts without rate limits, 1+1 for rate limited inserts+deletes). It uses 8 table with a table per client. It loads 128M rows per table without secondary indexes, creates 3 secondary indexes per table, then inserts 4m+1m rows per table with a delete per insert to avoid growing the table. It then does 6 read+write tests for 1800s each that do queries as fast as possible with 100,100,500,500,1000,1000 inserts/s and the same for deletes/s per client concurrent with the queries. The database is larger than memory. Clients and the DBMS share one server. The per-database configs are in the per-database subdirectories here.
The tested DBMS are:
- my8028_rel_o2nofp.cz11a_c24r64 - MSQL 8.0.28, InnoDB and the cz11a_c24r64 config
- my8032_rel_o2nofp.cz11a_c24r64 - MSQL 8.0.32, InnoDB and the cz11a_c24r64 config
- my8036_rel_o2nofp.cz11a_c24r64 - MSQL 8.0.36, InnoDB and the cz11a_c24r64 config
- my8037_rel_o2nofp.cz11a_c24r64 - MSQL 8.0.37, InnoDB and the cz11a_c24r64 config
- my8038_rel_o2nofp.cz11a_c24r64 - MSQL 8.0.38, InnoDB and the cz11a_c24r64 config
Contents
- Summary
- l.i0: load without secondary indexes
- l.x: create secondary indexes
- l.i1: continue load after secondary indexes created with 50 inserts per transaction
- l.i2: continue load after secondary indexes created with 5 inserts per transaction
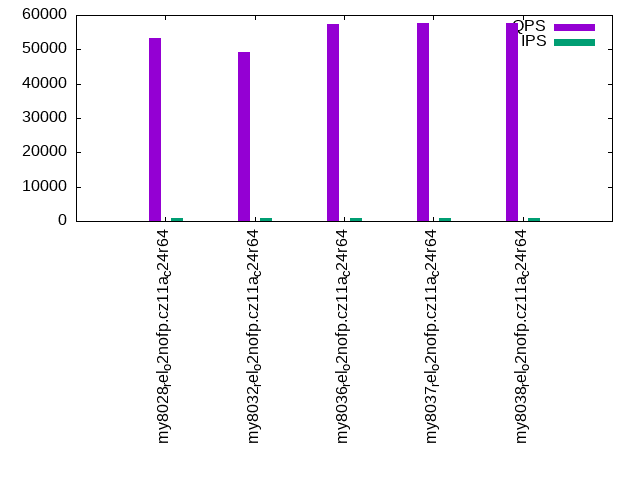
- qr100.L1: range queries with 100 insert/s per client
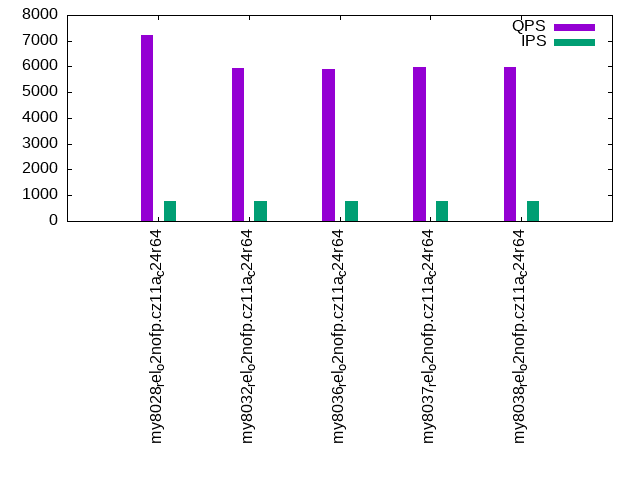
- qp100.L2: point queries with 100 insert/s per client
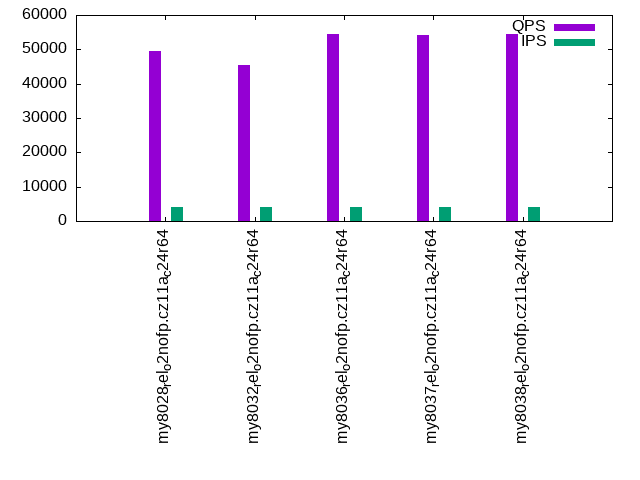
- qr500.L3: range queries with 500 insert/s per client
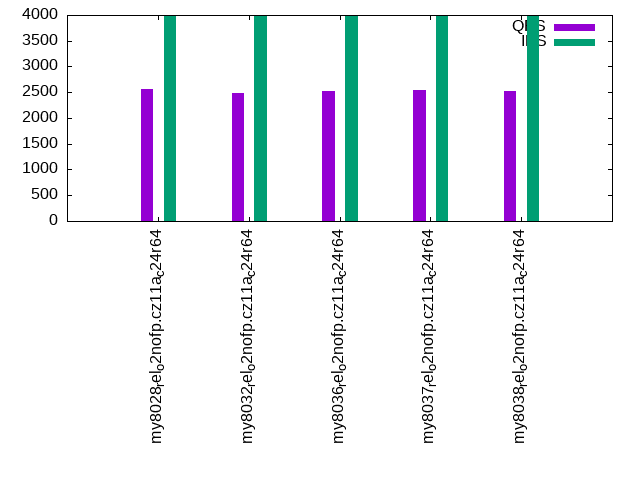
- qp500.L4: point queries with 500 insert/s per client
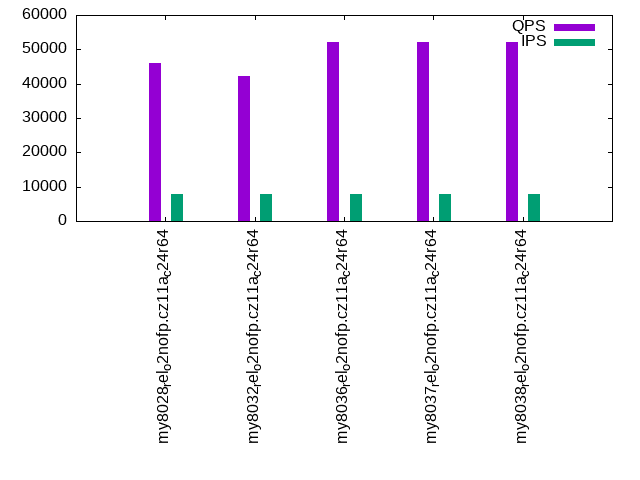
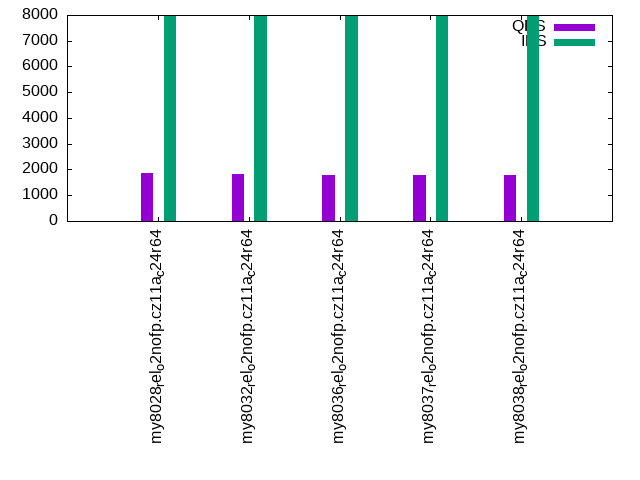
- qr1000.L5: range queries with 1000 insert/s per client
- qp1000.L6: point queries with 1000 insert/s per client
Summary
The numbers are inserts/s for l.i0, l.i1 and l.i2, indexed docs (or rows) /s for l.x and queries/s for qr100, qp100 thru qr1000, qp1000" The values are the average rate over the entire test for inserts (IPS) and queries (QPS). The range of values for IPS and QPS is split into 3 parts: bottom 25%, middle 50%, top 25%. Values in the bottom 25% have a red background, values in the top 25% have a green background and values in the middle have no color. A gray background is used for values that can be ignored because the DBMS did not sustain the target insert rate. Red backgrounds are not used when the minimum value is within 80% of the max value.
| dbms | l.i0 | l.x | l.i1 | l.i2 | qr100 | qp100 | qr500 | qp500 | qr1000 | qp1000 |
|---|---|---|---|---|---|---|---|---|---|---|
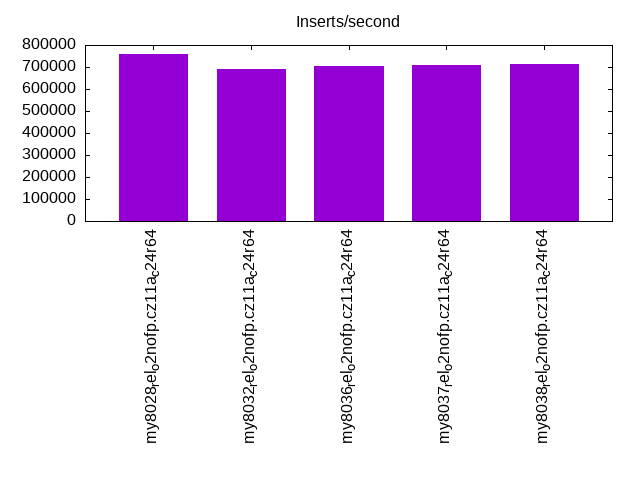
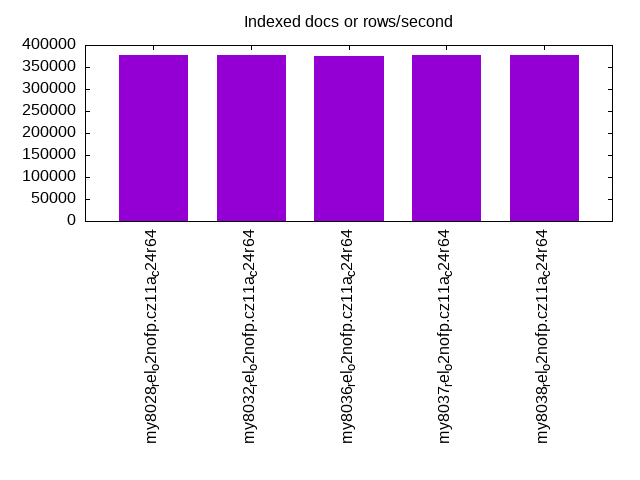
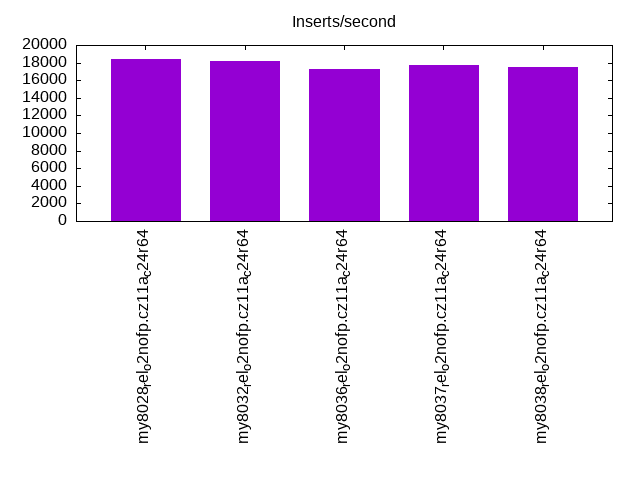
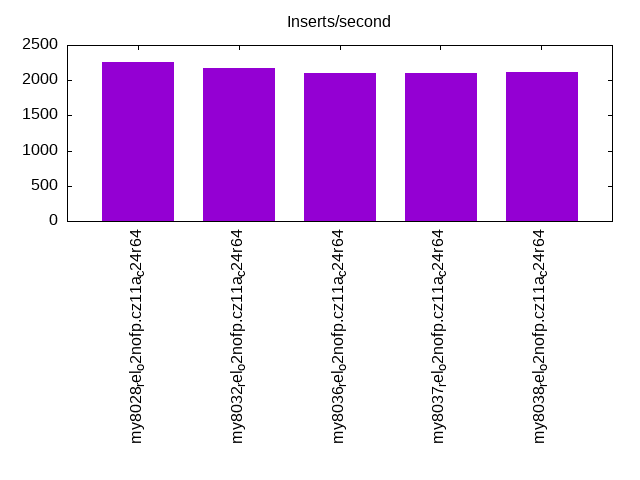
| my8028_rel_o2nofp.cz11a_c24r64 | 759081 | 377999 | 18412 | 2259 | 53400 | 7242 | 49614 | 2566 | 46156 | 1853 |
| my8032_rel_o2nofp.cz11a_c24r64 | 689098 | 377581 | 18151 | 2172 | 49108 | 5927 | 45546 | 2476 | 42216 | 1831 |
| my8036_rel_o2nofp.cz11a_c24r64 | 703780 | 375642 | 17307 | 2107 | 57510 | 5909 | 54451 | 2521 | 52149 | 1767 |
| my8037_rel_o2nofp.cz11a_c24r64 | 708650 | 377720 | 17689 | 2096 | 57680 | 5978 | 54229 | 2539 | 52174 | 1788 |
| my8038_rel_o2nofp.cz11a_c24r64 | 712100 | 377303 | 17515 | 2115 | 57602 | 5990 | 54518 | 2531 | 52259 | 1782 |
This table has relative throughput, throughput for the DBMS relative to the DBMS in the first line, using the absolute throughput from the previous table. Values less than 0.95 have a yellow background. Values greater than 1.05 have a blue background.
| dbms | l.i0 | l.x | l.i1 | l.i2 | qr100 | qp100 | qr500 | qp500 | qr1000 | qp1000 |
|---|---|---|---|---|---|---|---|---|---|---|
| my8028_rel_o2nofp.cz11a_c24r64 | 1.00 | 1.00 | 1.00 | 1.00 | 1.00 | 1.00 | 1.00 | 1.00 | 1.00 | 1.00 |
| my8032_rel_o2nofp.cz11a_c24r64 | 0.91 | 1.00 | 0.99 | 0.96 | 0.92 | 0.82 | 0.92 | 0.96 | 0.91 | 0.99 |
| my8036_rel_o2nofp.cz11a_c24r64 | 0.93 | 0.99 | 0.94 | 0.93 | 1.08 | 0.82 | 1.10 | 0.98 | 1.13 | 0.95 |
| my8037_rel_o2nofp.cz11a_c24r64 | 0.93 | 1.00 | 0.96 | 0.93 | 1.08 | 0.83 | 1.09 | 0.99 | 1.13 | 0.96 |
| my8038_rel_o2nofp.cz11a_c24r64 | 0.94 | 1.00 | 0.95 | 0.94 | 1.08 | 0.83 | 1.10 | 0.99 | 1.13 | 0.96 |
This lists the average rate of inserts/s for the tests that do inserts concurrent with queries. For such tests the query rate is listed in the table above. The read+write tests are setup so that the insert rate should match the target rate every second. Cells that are not at least 95% of the target have a red background to indicate a failure to satisfy the target.
| dbms | qr100.L1 | qp100.L2 | qr500.L3 | qp500.L4 | qr1000.L5 | qp1000.L6 |
|---|---|---|---|---|---|---|
| my8028_rel_o2nofp.cz11a_c24r64 | 796 | 796 | 3980 | 3978 | 7965 | 7965 |
| my8032_rel_o2nofp.cz11a_c24r64 | 796 | 796 | 3980 | 3978 | 7960 | 7960 |
| my8036_rel_o2nofp.cz11a_c24r64 | 796 | 796 | 3980 | 3980 | 7960 | 7965 |
| my8037_rel_o2nofp.cz11a_c24r64 | 796 | 796 | 3980 | 3980 | 7965 | 7965 |
| my8038_rel_o2nofp.cz11a_c24r64 | 796 | 796 | 3980 | 3980 | 7960 | 7965 |
| target | 800 | 800 | 4000 | 4000 | 8000 | 8000 |
l.i0
l.i0: load without secondary indexes. Graphs for performance per 1-second interval are here.
Average throughput:
Insert response time histogram: each cell has the percentage of responses that take <= the time in the header and max is the max response time in seconds. For the max column values in the top 25% of the range have a red background and in the bottom 25% of the range have a green background. The red background is not used when the min value is within 80% of the max value.
| dbms | 256us | 1ms | 4ms | 16ms | 64ms | 256ms | 1s | 4s | 16s | gt | max |
|---|---|---|---|---|---|---|---|---|---|---|---|
| my8028_rel_o2nofp.cz11a_c24r64 | 91.907 | 7.906 | 0.112 | 0.054 | 0.006 | 0.015 | 0.591 | ||||
| my8032_rel_o2nofp.cz11a_c24r64 | 51.144 | 48.657 | 0.121 | 0.057 | 0.007 | 0.015 | 0.567 | ||||
| my8036_rel_o2nofp.cz11a_c24r64 | 69.669 | 30.136 | 0.114 | 0.057 | 0.009 | 0.015 | 0.575 | ||||
| my8037_rel_o2nofp.cz11a_c24r64 | 73.880 | 25.926 | 0.115 | 0.056 | 0.009 | 0.015 | 0.571 | ||||
| my8038_rel_o2nofp.cz11a_c24r64 | 76.531 | 23.270 | 0.118 | 0.058 | 0.008 | 0.015 | 0.567 |
Performance metrics for the DBMS listed above. Some are normalized by throughput, others are not. Legend for results is here.
ips	qps	rps	rmbps	wps	wmbps	rpq	rkbpq	wpi	wkbpi	csps	cpups	cspq	cpupq	dbgb1	dbgb2	rss	maxop	p50	p99	tag
759081	0	1	0.0	4167.3	277.2	0.000	0.000	0.005	0.374	156741	69.7	0.206	15	67.2	117.7	48.9	0.591	101692	52344	my8028_rel_o2nofp.cz11a_c24r64
689098	0	1	0.0	3829.9	255.0	0.000	0.000	0.006	0.379	120548	68.9	0.175	16	67.2	117.7	49.0	0.567	91929	44652	my8032_rel_o2nofp.cz11a_c24r64
703780	0	1	0.0	3909.7	260.4	0.000	0.000	0.006	0.379	126970	69.3	0.180	16	67.2	117.7	49.0	0.575	93740	46051	my8036_rel_o2nofp.cz11a_c24r64
708650	0	1	0.0	3930.1	262.0	0.000	0.000	0.006	0.379	124366	69.5	0.175	16	67.2	117.7	49.0	0.571	94199	47248	my8037_rel_o2nofp.cz11a_c24r64
712100	0	1	0.0	3956.9	263.6	0.000	0.000	0.006	0.379	123022	69.6	0.173	16	67.2	117.7	49.0	0.567	95426	46850	my8038_rel_o2nofp.cz11a_c24r64
l.x
l.x: create secondary indexes.
Average throughput:
Performance metrics for the DBMS listed above. Some are normalized by throughput, others are not. Legend for results is here.
ips	qps	rps	rmbps	wps	wmbps	rpq	rkbpq	wpi	wkbpi	csps	cpups	cspq	cpupq	dbgb1	dbgb2	rss	maxop	p50	p99	tag
377999	0	4630	535.4	8809.7	474.4	0.012	1.450	0.023	1.285	25657	28.2	0.068	12	154.6	205.1	49.1	0.002	NA	NA	my8028_rel_o2nofp.cz11a_c24r64
377581	0	4619	536.1	8810.1	473.1	0.012	1.454	0.023	1.283	29272	34.1	0.078	14	154.6	205.1	49.1	0.002	NA	NA	my8032_rel_o2nofp.cz11a_c24r64
375642	0	4608	534.0	8714.9	470.7	0.012	1.456	0.023	1.283	24300	34.4	0.065	15	154.6	205.1	49.1	0.002	NA	NA	my8036_rel_o2nofp.cz11a_c24r64
377720	0	4655	537.6	8750.8	473.3	0.012	1.457	0.023	1.283	24215	35.7	0.064	15	154.6	205.1	49.1	0.009	NA	NA	my8037_rel_o2nofp.cz11a_c24r64
377303	0	4622	535.8	8769.9	473.0	0.012	1.454	0.023	1.284	22164	33.0	0.059	14	154.6	205.1	49.1	0.002	NA	NA	my8038_rel_o2nofp.cz11a_c24r64
l.i1
l.i1: continue load after secondary indexes created with 50 inserts per transaction. Graphs for performance per 1-second interval are here.
Average throughput:
Insert response time histogram: each cell has the percentage of responses that take <= the time in the header and max is the max response time in seconds. For the max column values in the top 25% of the range have a red background and in the bottom 25% of the range have a green background. The red background is not used when the min value is within 80% of the max value.
| dbms | 256us | 1ms | 4ms | 16ms | 64ms | 256ms | 1s | 4s | 16s | gt | max |
|---|---|---|---|---|---|---|---|---|---|---|---|
| my8028_rel_o2nofp.cz11a_c24r64 | 20.418 | 52.415 | 20.251 | 6.553 | 0.362 | 0.753 | |||||
| my8032_rel_o2nofp.cz11a_c24r64 | 35.461 | 36.760 | 20.868 | 6.414 | 0.496 | 0.767 | |||||
| my8036_rel_o2nofp.cz11a_c24r64 | 8.935 | 62.884 | 20.926 | 6.726 | 0.529 | 0.829 | |||||
| my8037_rel_o2nofp.cz11a_c24r64 | 10.943 | 62.113 | 19.785 | 6.642 | 0.518 | 0.826 | |||||
| my8038_rel_o2nofp.cz11a_c24r64 | 9.322 | 62.665 | 20.800 | 6.707 | 0.506 | 0.830 |
Delete response time histogram: each cell has the percentage of responses that take <= the time in the header and max is the max response time in seconds. For the max column values in the top 25% of the range have a red background and in the bottom 25% of the range have a green background. The red background is not used when the min value is within 80% of the max value.
| dbms | 256us | 1ms | 4ms | 16ms | 64ms | 256ms | 1s | 4s | 16s | gt | max |
|---|---|---|---|---|---|---|---|---|---|---|---|
| my8028_rel_o2nofp.cz11a_c24r64 | 41.406 | 52.492 | 5.499 | 0.487 | 0.115 | 0.756 | |||||
| my8032_rel_o2nofp.cz11a_c24r64 | 49.048 | 44.057 | 6.301 | 0.473 | 0.122 | 0.676 | |||||
| my8036_rel_o2nofp.cz11a_c24r64 | 34.175 | 56.508 | 8.395 | 0.793 | 0.129 | 0.658 | |||||
| my8037_rel_o2nofp.cz11a_c24r64 | 35.161 | 57.562 | 6.477 | 0.682 | 0.117 | 0.641 | |||||
| my8038_rel_o2nofp.cz11a_c24r64 | 33.936 | 56.888 | 8.247 | 0.808 | 0.121 | 0.720 |
Performance metrics for the DBMS listed above. Some are normalized by throughput, others are not. Legend for results is here.
ips	qps	rps	rmbps	wps	wmbps	rpq	rkbpq	wpi	wkbpi	csps	cpups	cspq	cpupq	dbgb1	dbgb2	rss	maxop	p50	p99	tag
18412	0	11712	183.0	23334.2	618.6	0.636	10.178	1.267	34.404	133285	30.5	7.239	265	214.5	277.0	49.1	0.753	1200	300	my8028_rel_o2nofp.cz11a_c24r64
18151	0	11221	175.3	22552.4	623.5	0.618	9.891	1.242	35.175	133054	32.4	7.330	286	214.6	277.6	49.1	0.767	1099	250	my8032_rel_o2nofp.cz11a_c24r64
17307	0	11621	181.6	22745.0	625.6	0.671	10.744	1.314	37.017	133814	35.6	7.732	329	214.1	276.2	49.1	0.829	1898	300	my8036_rel_o2nofp.cz11a_c24r64
17689	0	11316	176.8	22657.2	622.4	0.640	10.235	1.281	36.027	133538	35.3	7.549	319	214.3	277.1	49.1	0.826	2048	350	my8037_rel_o2nofp.cz11a_c24r64
17515	0	11644	181.9	22770.3	627.0	0.665	10.636	1.300	36.656	133882	35.8	7.644	327	214.1	276.3	49.1	0.830	1998	400	my8038_rel_o2nofp.cz11a_c24r64
l.i2
l.i2: continue load after secondary indexes created with 5 inserts per transaction. Graphs for performance per 1-second interval are here.
Average throughput:
Insert response time histogram: each cell has the percentage of responses that take <= the time in the header and max is the max response time in seconds. For the max column values in the top 25% of the range have a red background and in the bottom 25% of the range have a green background. The red background is not used when the min value is within 80% of the max value.
| dbms | 256us | 1ms | 4ms | 16ms | 64ms | 256ms | 1s | 4s | 16s | gt | max |
|---|---|---|---|---|---|---|---|---|---|---|---|
| my8028_rel_o2nofp.cz11a_c24r64 | nonzero | 0.890 | 10.034 | 44.614 | 43.993 | 0.468 | nonzero | 0.293 | |||
| my8032_rel_o2nofp.cz11a_c24r64 | 0.004 | 8.860 | 45.766 | 44.673 | 0.697 | nonzero | 0.346 | ||||
| my8036_rel_o2nofp.cz11a_c24r64 | 1.478 | 9.444 | 43.275 | 45.019 | 0.784 | nonzero | 0.348 | ||||
| my8037_rel_o2nofp.cz11a_c24r64 | 0.028 | 8.574 | 45.126 | 45.491 | 0.781 | nonzero | 0.285 | ||||
| my8038_rel_o2nofp.cz11a_c24r64 | 1.403 | 8.910 | 43.915 | 44.955 | 0.815 | nonzero | 0.348 |
Delete response time histogram: each cell has the percentage of responses that take <= the time in the header and max is the max response time in seconds. For the max column values in the top 25% of the range have a red background and in the bottom 25% of the range have a green background. The red background is not used when the min value is within 80% of the max value.
| dbms | 256us | 1ms | 4ms | 16ms | 64ms | 256ms | 1s | 4s | 16s | gt | max |
|---|---|---|---|---|---|---|---|---|---|---|---|
| my8028_rel_o2nofp.cz11a_c24r64 | 0.858 | 17.637 | 38.936 | 42.269 | 0.299 | nonzero | 0.308 | ||||
| my8032_rel_o2nofp.cz11a_c24r64 | 15.974 | 40.444 | 43.110 | 0.472 | nonzero | 0.348 | |||||
| my8036_rel_o2nofp.cz11a_c24r64 | 1.369 | 16.779 | 37.818 | 43.561 | 0.473 | 0.229 | |||||
| my8037_rel_o2nofp.cz11a_c24r64 | 0.006 | 16.163 | 39.287 | 44.070 | 0.474 | nonzero | 0.279 | ||||
| my8038_rel_o2nofp.cz11a_c24r64 | 1.402 | 16.289 | 38.466 | 43.350 | 0.493 | 0.234 |
Performance metrics for the DBMS listed above. Some are normalized by throughput, others are not. Legend for results is here.
ips	qps	rps	rmbps	wps	wmbps	rpq	rkbpq	wpi	wkbpi	csps	cpups	cspq	cpupq	dbgb1	dbgb2	rss	maxop	p50	p99	tag
2259	0	15914	248.7	24157.3	622.5	7.046	112.737	10.696	282.217	140855	22.0	62.364	1558	214.5	275.5	49.1	0.293	175	115	my8028_rel_o2nofp.cz11a_c24r64
2172	0	15740	245.9	23027.0	616.5	7.248	115.976	10.604	290.697	137710	23.6	63.417	1739	214.6	276.0	49.1	0.346	170	110	my8032_rel_o2nofp.cz11a_c24r64
2107	0	16001	250.0	24241.5	626.1	7.593	121.485	11.503	304.231	138301	24.1	65.626	1830	214.1	276.2	49.1	0.348	155	100	my8036_rel_o2nofp.cz11a_c24r64
2096	0	15998	250.0	24298.8	623.6	7.631	122.102	11.591	304.586	137902	24.5	65.780	1870	214.3	276.3	49.1	0.285	155	100	my8037_rel_o2nofp.cz11a_c24r64
2115	0	16103	251.6	24560.9	626.5	7.613	121.808	11.612	303.318	138248	24.2	65.359	1831	214.1	276.3	49.1	0.348	155	105	my8038_rel_o2nofp.cz11a_c24r64
qr100.L1
qr100.L1: range queries with 100 insert/s per client. Graphs for performance per 1-second interval are here.
Average throughput:
Query response time histogram: each cell has the percentage of responses that take <= the time in the header and max is the max response time in seconds. For max values in the top 25% of the range have a red background and in the bottom 25% of the range have a green background. The red background is not used when the min value is within 80% of the max value.
| dbms | 256us | 1ms | 4ms | 16ms | 64ms | 256ms | 1s | 4s | 16s | gt | max |
|---|---|---|---|---|---|---|---|---|---|---|---|
| my8028_rel_o2nofp.cz11a_c24r64 | 99.685 | 0.255 | 0.059 | 0.001 | nonzero | 0.049 | |||||
| my8032_rel_o2nofp.cz11a_c24r64 | 99.609 | 0.320 | 0.070 | 0.001 | nonzero | 0.029 | |||||
| my8036_rel_o2nofp.cz11a_c24r64 | 99.798 | 0.199 | 0.003 | nonzero | nonzero | 0.024 | |||||
| my8037_rel_o2nofp.cz11a_c24r64 | 99.803 | 0.195 | 0.002 | nonzero | nonzero | 0.030 | |||||
| my8038_rel_o2nofp.cz11a_c24r64 | 99.803 | 0.194 | 0.002 | nonzero | nonzero | 0.031 |
Insert response time histogram: each cell has the percentage of responses that take <= the time in the header and max is the max response time in seconds. For max values in the top 25% of the range have a red background and in the bottom 25% of the range have a green background. The red background is not used when the min value is within 80% of the max value.
| dbms | 256us | 1ms | 4ms | 16ms | 64ms | 256ms | 1s | 4s | 16s | gt | max |
|---|---|---|---|---|---|---|---|---|---|---|---|
| my8028_rel_o2nofp.cz11a_c24r64 | 95.931 | 4.069 | 0.051 | ||||||||
| my8032_rel_o2nofp.cz11a_c24r64 | 94.760 | 5.240 | 0.039 | ||||||||
| my8036_rel_o2nofp.cz11a_c24r64 | 0.003 | 94.708 | 5.288 | 0.038 | |||||||
| my8037_rel_o2nofp.cz11a_c24r64 | 95.253 | 4.747 | 0.044 | ||||||||
| my8038_rel_o2nofp.cz11a_c24r64 | 0.003 | 94.306 | 5.688 | 0.003 | 0.081 |
Delete response time histogram: each cell has the percentage of responses that take <= the time in the header and max is the max response time in seconds. For max values in the top 25% of the range have a red background and in the bottom 25% of the range have a green background. The red background is not used when the min value is within 80% of the max value.
| dbms | 256us | 1ms | 4ms | 16ms | 64ms | 256ms | 1s | 4s | 16s | gt | max |
|---|---|---|---|---|---|---|---|---|---|---|---|
| my8028_rel_o2nofp.cz11a_c24r64 | 98.003 | 1.979 | 0.017 | 0.019 | |||||||
| my8032_rel_o2nofp.cz11a_c24r64 | 98.066 | 1.934 | 0.009 | ||||||||
| my8036_rel_o2nofp.cz11a_c24r64 | 97.385 | 2.615 | 0.014 | ||||||||
| my8037_rel_o2nofp.cz11a_c24r64 | 98.319 | 1.681 | 0.010 | ||||||||
| my8038_rel_o2nofp.cz11a_c24r64 | 97.497 | 2.417 | 0.087 | 0.033 |
Performance metrics for the DBMS listed above. Some are normalized by throughput, others are not. Legend for results is here.
ips	qps	rps	rmbps	wps	wmbps	rpq	rkbpq	wpi	wkbpi	csps	cpups	cspq	cpupq	dbgb1	dbgb2	rss	maxop	p50	p99	tag
796	53400	2277	35.6	2659.0	76.1	0.043	0.682	3.340	97.878	198306	51.1	3.714	153	214.5	275.5	49.1	0.049	6697	4108	my8028_rel_o2nofp.cz11a_c24r64
796	49108	2279	35.6	2742.2	79.9	0.046	0.742	3.445	102.842	183139	51.3	3.729	167	214.6	276.0	49.1	0.029	6220	4076	my8032_rel_o2nofp.cz11a_c24r64
796	57510	2010	31.4	2785.6	81.1	0.035	0.559	3.500	104.300	211514	51.7	3.678	144	214.1	276.2	49.1	0.024	7272	7018	my8036_rel_o2nofp.cz11a_c24r64
796	57680	2007	31.4	2688.8	78.5	0.035	0.557	3.378	100.940	211717	51.7	3.671	143	214.3	276.3	49.1	0.030	7218	6952	my8037_rel_o2nofp.cz11a_c24r64
796	57602	2008	31.4	2685.6	78.3	0.035	0.558	3.374	100.694	211640	51.7	3.674	144	214.1	276.3	49.1	0.031	7177	6921	my8038_rel_o2nofp.cz11a_c24r64
qp100.L2
qp100.L2: point queries with 100 insert/s per client. Graphs for performance per 1-second interval are here.
Average throughput:
Query response time histogram: each cell has the percentage of responses that take <= the time in the header and max is the max response time in seconds. For max values in the top 25% of the range have a red background and in the bottom 25% of the range have a green background. The red background is not used when the min value is within 80% of the max value.
| dbms | 256us | 1ms | 4ms | 16ms | 64ms | 256ms | 1s | 4s | 16s | gt | max |
|---|---|---|---|---|---|---|---|---|---|---|---|
| my8028_rel_o2nofp.cz11a_c24r64 | 19.950 | 25.048 | 54.645 | 0.342 | 0.016 | nonzero | 0.067 | ||||
| my8032_rel_o2nofp.cz11a_c24r64 | 0.670 | 28.640 | 70.181 | 0.487 | 0.023 | nonzero | 0.108 | ||||
| my8036_rel_o2nofp.cz11a_c24r64 | 0.762 | 28.913 | 69.773 | 0.530 | 0.021 | nonzero | 0.078 | ||||
| my8037_rel_o2nofp.cz11a_c24r64 | 0.787 | 29.630 | 69.117 | 0.448 | 0.019 | nonzero | 0.098 | ||||
| my8038_rel_o2nofp.cz11a_c24r64 | 0.726 | 29.949 | 68.806 | 0.498 | 0.021 | nonzero | 0.080 |
Insert response time histogram: each cell has the percentage of responses that take <= the time in the header and max is the max response time in seconds. For max values in the top 25% of the range have a red background and in the bottom 25% of the range have a green background. The red background is not used when the min value is within 80% of the max value.
| dbms | 256us | 1ms | 4ms | 16ms | 64ms | 256ms | 1s | 4s | 16s | gt | max |
|---|---|---|---|---|---|---|---|---|---|---|---|
| my8028_rel_o2nofp.cz11a_c24r64 | 15.486 | 84.090 | 0.424 | 0.147 | |||||||
| my8032_rel_o2nofp.cz11a_c24r64 | 9.247 | 90.188 | 0.566 | 0.159 | |||||||
| my8036_rel_o2nofp.cz11a_c24r64 | 11.257 | 88.319 | 0.424 | 0.148 | |||||||
| my8037_rel_o2nofp.cz11a_c24r64 | 10.535 | 89.024 | 0.441 | 0.132 | |||||||
| my8038_rel_o2nofp.cz11a_c24r64 | 13.448 | 86.017 | 0.535 | 0.183 |
Delete response time histogram: each cell has the percentage of responses that take <= the time in the header and max is the max response time in seconds. For max values in the top 25% of the range have a red background and in the bottom 25% of the range have a green background. The red background is not used when the min value is within 80% of the max value.
| dbms | 256us | 1ms | 4ms | 16ms | 64ms | 256ms | 1s | 4s | 16s | gt | max |
|---|---|---|---|---|---|---|---|---|---|---|---|
| my8028_rel_o2nofp.cz11a_c24r64 | 99.625 | 0.375 | 0.014 | ||||||||
| my8032_rel_o2nofp.cz11a_c24r64 | 98.712 | 1.257 | 0.031 | 0.026 | |||||||
| my8036_rel_o2nofp.cz11a_c24r64 | 99.535 | 0.465 | 0.011 | ||||||||
| my8037_rel_o2nofp.cz11a_c24r64 | 99.524 | 0.476 | 0.012 | ||||||||
| my8038_rel_o2nofp.cz11a_c24r64 | 99.688 | 0.312 | 0.014 |
Performance metrics for the DBMS listed above. Some are normalized by throughput, others are not. Legend for results is here.
ips	qps	rps	rmbps	wps	wmbps	rpq	rkbpq	wpi	wkbpi	csps	cpups	cspq	cpupq	dbgb1	dbgb2	rss	maxop	p50	p99	tag
796	7242	28930	452.0	6792.6	187.6	3.995	63.913	8.533	241.348	105977	17.1	14.633	378	214.5	275.5	49.1	0.067	911	256	my8028_rel_o2nofp.cz11a_c24r64
796	5927	29146	455.4	6842.4	189.8	4.918	78.680	8.596	244.102	101875	16.6	17.188	448	214.6	276.0	49.1	0.108	815	256	my8032_rel_o2nofp.cz11a_c24r64
796	5909	29007	453.2	6784.1	189.5	4.909	78.540	8.523	243.813	101410	16.6	17.161	449	214.1	276.2	49.1	0.078	815	288	my8036_rel_o2nofp.cz11a_c24r64
796	5978	29229	456.7	6808.9	189.5	4.890	78.235	8.554	243.839	102007	16.9	17.065	452	214.3	276.3	49.1	0.098	831	272	my8037_rel_o2nofp.cz11a_c24r64
796	5990	29289	457.6	6785.9	189.1	4.890	78.234	8.530	243.392	102022	16.6	17.032	443	214.1	276.3	49.1	0.080	799	272	my8038_rel_o2nofp.cz11a_c24r64
qr500.L3
qr500.L3: range queries with 500 insert/s per client. Graphs for performance per 1-second interval are here.
Average throughput:
Query response time histogram: each cell has the percentage of responses that take <= the time in the header and max is the max response time in seconds. For max values in the top 25% of the range have a red background and in the bottom 25% of the range have a green background. The red background is not used when the min value is within 80% of the max value.
| dbms | 256us | 1ms | 4ms | 16ms | 64ms | 256ms | 1s | 4s | 16s | gt | max |
|---|---|---|---|---|---|---|---|---|---|---|---|
| my8028_rel_o2nofp.cz11a_c24r64 | 99.122 | 0.743 | 0.126 | 0.008 | 0.001 | nonzero | 0.155 | ||||
| my8032_rel_o2nofp.cz11a_c24r64 | 98.893 | 0.955 | 0.142 | 0.009 | 0.001 | nonzero | 0.145 | ||||
| my8036_rel_o2nofp.cz11a_c24r64 | 99.357 | 0.617 | 0.023 | 0.003 | nonzero | nonzero | 0.090 | ||||
| my8037_rel_o2nofp.cz11a_c24r64 | 99.343 | 0.630 | 0.023 | 0.003 | nonzero | nonzero | 0.113 | ||||
| my8038_rel_o2nofp.cz11a_c24r64 | 99.361 | 0.613 | 0.023 | 0.003 | nonzero | nonzero | 0.092 |
Insert response time histogram: each cell has the percentage of responses that take <= the time in the header and max is the max response time in seconds. For max values in the top 25% of the range have a red background and in the bottom 25% of the range have a green background. The red background is not used when the min value is within 80% of the max value.
| dbms | 256us | 1ms | 4ms | 16ms | 64ms | 256ms | 1s | 4s | 16s | gt | max |
|---|---|---|---|---|---|---|---|---|---|---|---|
| my8028_rel_o2nofp.cz11a_c24r64 | 0.042 | 94.944 | 4.931 | 0.083 | 0.195 | ||||||
| my8032_rel_o2nofp.cz11a_c24r64 | 0.001 | 91.367 | 8.567 | 0.064 | 0.170 | ||||||
| my8036_rel_o2nofp.cz11a_c24r64 | 0.029 | 79.740 | 20.199 | 0.031 | 0.119 | ||||||
| my8037_rel_o2nofp.cz11a_c24r64 | 0.031 | 78.346 | 21.575 | 0.049 | 0.136 | ||||||
| my8038_rel_o2nofp.cz11a_c24r64 | 0.048 | 80.119 | 19.793 | 0.040 | 0.146 |
Delete response time histogram: each cell has the percentage of responses that take <= the time in the header and max is the max response time in seconds. For max values in the top 25% of the range have a red background and in the bottom 25% of the range have a green background. The red background is not used when the min value is within 80% of the max value.
| dbms | 256us | 1ms | 4ms | 16ms | 64ms | 256ms | 1s | 4s | 16s | gt | max |
|---|---|---|---|---|---|---|---|---|---|---|---|
| my8028_rel_o2nofp.cz11a_c24r64 | 85.853 | 14.140 | 0.007 | 0.028 | |||||||
| my8032_rel_o2nofp.cz11a_c24r64 | 77.253 | 22.731 | 0.015 | 0.023 | |||||||
| my8036_rel_o2nofp.cz11a_c24r64 | 73.170 | 26.741 | 0.089 | 0.038 | |||||||
| my8037_rel_o2nofp.cz11a_c24r64 | 73.582 | 26.288 | 0.130 | 0.001 | 0.082 | ||||||
| my8038_rel_o2nofp.cz11a_c24r64 | 73.793 | 26.069 | 0.138 | 0.034 |
Performance metrics for the DBMS listed above. Some are normalized by throughput, others are not. Legend for results is here.
ips	qps	rps	rmbps	wps	wmbps	rpq	rkbpq	wpi	wkbpi	csps	cpups	cspq	cpupq	dbgb1	dbgb2	rss	maxop	p50	p99	tag
3980	49614	9884	154.4	13096.7	373.5	0.199	3.188	3.291	96.087	194638	57.9	3.923	187	214.5	275.5	49.1	0.155	6357	1519	my8028_rel_o2nofp.cz11a_c24r64
3980	45546	9882	154.4	13112.2	379.3	0.217	3.471	3.295	97.593	181380	58.6	3.982	206	214.6	276.0	49.1	0.145	5788	1407	my8032_rel_o2nofp.cz11a_c24r64
3980	54451	9002	140.7	12522.3	362.3	0.165	2.645	3.146	93.215	207996	60.0	3.820	176	214.1	276.2	49.1	0.090	6841	6329	my8036_rel_o2nofp.cz11a_c24r64
3980	54229	9012	140.8	12517.0	362.0	0.166	2.659	3.145	93.147	206751	60.0	3.813	177	214.3	276.3	49.1	0.113	6828	6329	my8037_rel_o2nofp.cz11a_c24r64
3980	54518	8991	140.5	12482.4	361.1	0.165	2.639	3.136	92.898	208532	59.9	3.825	176	214.1	276.3	49.1	0.092	6873	6409	my8038_rel_o2nofp.cz11a_c24r64
qp500.L4
qp500.L4: point queries with 500 insert/s per client. Graphs for performance per 1-second interval are here.
Average throughput:
Query response time histogram: each cell has the percentage of responses that take <= the time in the header and max is the max response time in seconds. For max values in the top 25% of the range have a red background and in the bottom 25% of the range have a green background. The red background is not used when the min value is within 80% of the max value.
| dbms | 256us | 1ms | 4ms | 16ms | 64ms | 256ms | 1s | 4s | 16s | gt | max |
|---|---|---|---|---|---|---|---|---|---|---|---|
| my8028_rel_o2nofp.cz11a_c24r64 | 0.001 | 0.489 | 88.237 | 10.317 | 0.920 | 0.035 | 0.201 | ||||
| my8032_rel_o2nofp.cz11a_c24r64 | 0.001 | 0.352 | 87.493 | 11.152 | 0.944 | 0.059 | nonzero | 0.286 | |||
| my8036_rel_o2nofp.cz11a_c24r64 | 0.001 | 0.384 | 88.259 | 10.388 | 0.914 | 0.054 | 0.227 | ||||
| my8037_rel_o2nofp.cz11a_c24r64 | 0.001 | 0.401 | 88.582 | 10.071 | 0.890 | 0.055 | 0.243 | ||||
| my8038_rel_o2nofp.cz11a_c24r64 | 0.001 | 0.425 | 88.141 | 10.453 | 0.924 | 0.056 | 0.243 |
Insert response time histogram: each cell has the percentage of responses that take <= the time in the header and max is the max response time in seconds. For max values in the top 25% of the range have a red background and in the bottom 25% of the range have a green background. The red background is not used when the min value is within 80% of the max value.
| dbms | 256us | 1ms | 4ms | 16ms | 64ms | 256ms | 1s | 4s | 16s | gt | max |
|---|---|---|---|---|---|---|---|---|---|---|---|
| my8028_rel_o2nofp.cz11a_c24r64 | 0.001 | 49.179 | 47.529 | 3.290 | 0.001 | 0.286 | |||||
| my8032_rel_o2nofp.cz11a_c24r64 | 38.587 | 56.962 | 4.446 | 0.006 | 0.304 | ||||||
| my8036_rel_o2nofp.cz11a_c24r64 | 0.001 | 45.027 | 51.274 | 3.697 | 0.001 | 0.270 | |||||
| my8037_rel_o2nofp.cz11a_c24r64 | 44.051 | 52.226 | 3.718 | 0.004 | 0.320 | ||||||
| my8038_rel_o2nofp.cz11a_c24r64 | 45.504 | 50.727 | 3.767 | 0.002 | 0.276 |
Delete response time histogram: each cell has the percentage of responses that take <= the time in the header and max is the max response time in seconds. For max values in the top 25% of the range have a red background and in the bottom 25% of the range have a green background. The red background is not used when the min value is within 80% of the max value.
| dbms | 256us | 1ms | 4ms | 16ms | 64ms | 256ms | 1s | 4s | 16s | gt | max |
|---|---|---|---|---|---|---|---|---|---|---|---|
| my8028_rel_o2nofp.cz11a_c24r64 | 97.060 | 2.685 | 0.251 | 0.004 | 0.134 | ||||||
| my8032_rel_o2nofp.cz11a_c24r64 | 95.285 | 4.339 | 0.355 | 0.022 | 0.141 | ||||||
| my8036_rel_o2nofp.cz11a_c24r64 | 96.503 | 3.180 | 0.296 | 0.021 | 0.158 | ||||||
| my8037_rel_o2nofp.cz11a_c24r64 | 96.274 | 3.436 | 0.265 | 0.025 | 0.159 | ||||||
| my8038_rel_o2nofp.cz11a_c24r64 | 96.235 | 3.426 | 0.316 | 0.023 | 0.102 |
Performance metrics for the DBMS listed above. Some are normalized by throughput, others are not. Legend for results is here.
ips	qps	rps	rmbps	wps	wmbps	rpq	rkbpq	wpi	wkbpi	csps	cpups	cspq	cpupq	dbgb1	dbgb2	rss	maxop	p50	p99	tag
3978	2566	31879	498.1	19477.4	489.6	12.423	198.762	4.896	126.022	138921	20.5	54.135	1278	214.5	275.5	49.1	0.201	336	128	my8028_rel_o2nofp.cz11a_c24r64
3978	2476	31273	488.6	19339.1	494.5	12.628	202.046	4.862	127.295	138378	22.0	55.876	1421	214.6	276.0	49.1	0.286	320	144	my8032_rel_o2nofp.cz11a_c24r64
3980	2521	31464	491.6	19011.1	493.4	12.483	199.724	4.777	126.937	137950	22.6	54.729	1435	214.1	276.2	49.1	0.227	320	176	my8036_rel_o2nofp.cz11a_c24r64
3980	2539	31591	493.6	19216.9	493.4	12.441	199.051	4.828	126.934	138021	22.8	54.354	1437	214.3	276.4	49.1	0.243	320	176	my8037_rel_o2nofp.cz11a_c24r64
3980	2531	31455	491.5	19055.0	491.8	12.426	198.812	4.788	126.521	137263	22.5	54.224	1422	214.1	276.3	49.1	0.243	320	176	my8038_rel_o2nofp.cz11a_c24r64
qr1000.L5
qr1000.L5: range queries with 1000 insert/s per client. Graphs for performance per 1-second interval are here.
Average throughput:
Query response time histogram: each cell has the percentage of responses that take <= the time in the header and max is the max response time in seconds. For max values in the top 25% of the range have a red background and in the bottom 25% of the range have a green background. The red background is not used when the min value is within 80% of the max value.
| dbms | 256us | 1ms | 4ms | 16ms | 64ms | 256ms | 1s | 4s | 16s | gt | max |
|---|---|---|---|---|---|---|---|---|---|---|---|
| my8028_rel_o2nofp.cz11a_c24r64 | 98.166 | 1.611 | 0.178 | 0.039 | 0.006 | 0.001 | 0.238 | ||||
| my8032_rel_o2nofp.cz11a_c24r64 | 97.565 | 2.179 | 0.208 | 0.040 | 0.007 | 0.001 | nonzero | 0.283 | |||
| my8036_rel_o2nofp.cz11a_c24r64 | 98.905 | 1.033 | 0.053 | 0.009 | 0.001 | nonzero | 0.228 | ||||
| my8037_rel_o2nofp.cz11a_c24r64 | 98.900 | 1.038 | 0.053 | 0.009 | 0.001 | nonzero | 0.165 | ||||
| my8038_rel_o2nofp.cz11a_c24r64 | 98.898 | 1.039 | 0.053 | 0.009 | 0.001 | nonzero | 0.127 |
Insert response time histogram: each cell has the percentage of responses that take <= the time in the header and max is the max response time in seconds. For max values in the top 25% of the range have a red background and in the bottom 25% of the range have a green background. The red background is not used when the min value is within 80% of the max value.
| dbms | 256us | 1ms | 4ms | 16ms | 64ms | 256ms | 1s | 4s | 16s | gt | max |
|---|---|---|---|---|---|---|---|---|---|---|---|
| my8028_rel_o2nofp.cz11a_c24r64 | 0.028 | 63.716 | 34.753 | 1.502 | 0.001 | 0.271 | |||||
| my8032_rel_o2nofp.cz11a_c24r64 | 0.010 | 60.448 | 37.982 | 1.554 | 0.006 | 0.316 | |||||
| my8036_rel_o2nofp.cz11a_c24r64 | 0.095 | 76.509 | 23.311 | 0.085 | 0.243 | ||||||
| my8037_rel_o2nofp.cz11a_c24r64 | 0.081 | 76.088 | 23.760 | 0.071 | 0.192 | ||||||
| my8038_rel_o2nofp.cz11a_c24r64 | 0.132 | 77.622 | 22.171 | 0.075 | 0.253 |
Delete response time histogram: each cell has the percentage of responses that take <= the time in the header and max is the max response time in seconds. For max values in the top 25% of the range have a red background and in the bottom 25% of the range have a green background. The red background is not used when the min value is within 80% of the max value.
| dbms | 256us | 1ms | 4ms | 16ms | 64ms | 256ms | 1s | 4s | 16s | gt | max |
|---|---|---|---|---|---|---|---|---|---|---|---|
| my8028_rel_o2nofp.cz11a_c24r64 | 0.001 | 88.046 | 11.651 | 0.293 | 0.010 | 0.199 | |||||
| my8032_rel_o2nofp.cz11a_c24r64 | 83.425 | 16.165 | 0.389 | 0.020 | 0.148 | ||||||
| my8036_rel_o2nofp.cz11a_c24r64 | 75.370 | 24.265 | 0.357 | 0.007 | 0.143 | ||||||
| my8037_rel_o2nofp.cz11a_c24r64 | 77.040 | 22.625 | 0.332 | 0.003 | 0.095 | ||||||
| my8038_rel_o2nofp.cz11a_c24r64 | 76.266 | 23.321 | 0.410 | 0.003 | 0.095 |
Performance metrics for the DBMS listed above. Some are normalized by throughput, others are not. Legend for results is here.
ips	qps	rps	rmbps	wps	wmbps	rpq	rkbpq	wpi	wkbpi	csps	cpups	cspq	cpupq	dbgb1	dbgb2	rss	maxop	p50	p99	tag
7965	46156	15903	248.5	24820.8	622.8	0.345	5.513	3.116	80.070	211615	64.7	4.585	224	214.5	275.5	49.1	0.238	5977	1295	my8028_rel_o2nofp.cz11a_c24r64
7960	42216	15884	248.2	24086.1	622.3	0.376	6.020	3.026	80.048	201132	66.2	4.764	251	214.6	276.0	49.1	0.283	5468	1279	my8032_rel_o2nofp.cz11a_c24r64
7960	52149	13955	218.0	21236.9	592.4	0.268	4.282	2.668	76.204	213108	67.5	4.087	207	214.1	276.2	49.1	0.228	6606	5932	my8036_rel_o2nofp.cz11a_c24r64
7965	52174	13974	218.3	20809.8	584.8	0.268	4.285	2.613	75.185	211445	67.7	4.053	208	214.3	276.4	49.1	0.165	6632	5802	my8037_rel_o2nofp.cz11a_c24r64
7960	52259	13945	217.9	21169.0	589.0	0.267	4.270	2.659	75.773	213668	67.4	4.089	206	214.1	276.3	49.1	0.127	6633	5818	my8038_rel_o2nofp.cz11a_c24r64
qp1000.L6
qp1000.L6: point queries with 1000 insert/s per client. Graphs for performance per 1-second interval are here.
Average throughput:
Query response time histogram: each cell has the percentage of responses that take <= the time in the header and max is the max response time in seconds. For max values in the top 25% of the range have a red background and in the bottom 25% of the range have a green background. The red background is not used when the min value is within 80% of the max value.
| dbms | 256us | 1ms | 4ms | 16ms | 64ms | 256ms | 1s | 4s | 16s | gt | max |
|---|---|---|---|---|---|---|---|---|---|---|---|
| my8028_rel_o2nofp.cz11a_c24r64 | 0.008 | 76.277 | 21.473 | 2.127 | 0.114 | 0.001 | 0.319 | ||||
| my8032_rel_o2nofp.cz11a_c24r64 | 0.006 | 75.772 | 21.997 | 2.091 | 0.131 | 0.002 | 0.363 | ||||
| my8036_rel_o2nofp.cz11a_c24r64 | 0.006 | 74.006 | 23.412 | 2.430 | 0.144 | 0.002 | 0.338 | ||||
| my8037_rel_o2nofp.cz11a_c24r64 | 0.005 | 74.653 | 22.865 | 2.330 | 0.144 | 0.002 | 0.338 | ||||
| my8038_rel_o2nofp.cz11a_c24r64 | 0.007 | 74.483 | 22.988 | 2.374 | 0.145 | 0.003 | 0.325 |
Insert response time histogram: each cell has the percentage of responses that take <= the time in the header and max is the max response time in seconds. For max values in the top 25% of the range have a red background and in the bottom 25% of the range have a green background. The red background is not used when the min value is within 80% of the max value.
| dbms | 256us | 1ms | 4ms | 16ms | 64ms | 256ms | 1s | 4s | 16s | gt | max |
|---|---|---|---|---|---|---|---|---|---|---|---|
| my8028_rel_o2nofp.cz11a_c24r64 | 0.034 | 51.643 | 44.626 | 3.662 | 0.035 | 0.401 | |||||
| my8032_rel_o2nofp.cz11a_c24r64 | 0.019 | 58.059 | 38.667 | 3.177 | 0.078 | 0.424 | |||||
| my8036_rel_o2nofp.cz11a_c24r64 | 0.022 | 51.137 | 44.541 | 4.227 | 0.073 | 0.358 | |||||
| my8037_rel_o2nofp.cz11a_c24r64 | 0.019 | 51.224 | 44.395 | 4.277 | 0.083 | 0.370 | |||||
| my8038_rel_o2nofp.cz11a_c24r64 | 0.022 | 51.676 | 44.017 | 4.198 | 0.088 | 0.398 |
Delete response time histogram: each cell has the percentage of responses that take <= the time in the header and max is the max response time in seconds. For max values in the top 25% of the range have a red background and in the bottom 25% of the range have a green background. The red background is not used when the min value is within 80% of the max value.
| dbms | 256us | 1ms | 4ms | 16ms | 64ms | 256ms | 1s | 4s | 16s | gt | max |
|---|---|---|---|---|---|---|---|---|---|---|---|
| my8028_rel_o2nofp.cz11a_c24r64 | 89.374 | 9.418 | 1.044 | 0.164 | 0.251 | ||||||
| my8032_rel_o2nofp.cz11a_c24r64 | 90.458 | 8.402 | 0.959 | 0.180 | 0.002 | 0.297 | |||||
| my8036_rel_o2nofp.cz11a_c24r64 | 86.980 | 11.489 | 1.376 | 0.156 | 0.246 | ||||||
| my8037_rel_o2nofp.cz11a_c24r64 | 87.165 | 11.177 | 1.445 | 0.213 | 0.001 | 0.317 | |||||
| my8038_rel_o2nofp.cz11a_c24r64 | 87.391 | 10.965 | 1.463 | 0.181 | 0.001 | 0.334 |
Performance metrics for the DBMS listed above. Some are normalized by throughput, others are not. Legend for results is here.
ips	qps	rps	rmbps	wps	wmbps	rpq	rkbpq	wpi	wkbpi	csps	cpups	cspq	cpupq	dbgb1	dbgb2	rss	maxop	p50	p99	tag
7965	1853	29395	459.3	21674.1	520.8	15.863	253.815	2.721	66.965	142442	25.1	76.871	2167	214.5	275.5	49.1	0.319	240	112	my8028_rel_o2nofp.cz11a_c24r64
7960	1831	28485	445.1	21301.8	527.7	15.555	248.874	2.676	67.879	141353	27.3	77.187	2385	214.6	276.0	49.1	0.363	224	112	my8032_rel_o2nofp.cz11a_c24r64
7965	1767	28146	439.8	21622.4	530.7	15.925	254.797	2.715	68.236	139750	28.2	79.071	2553	214.1	276.2	49.1	0.338	224	128	my8036_rel_o2nofp.cz11a_c24r64
7965	1788	28271	441.7	21667.0	529.6	15.816	253.056	2.720	68.090	139852	28.6	78.239	2560	214.3	276.4	49.1	0.338	224	128	my8037_rel_o2nofp.cz11a_c24r64
7965	1782	28238	441.2	21719.4	529.9	15.850	253.599	2.727	68.132	139834	28.2	78.488	2533	214.1	276.3	49.1	0.325	224	128	my8038_rel_o2nofp.cz11a_c24r64
l.i0
l.i0: load without secondary indexes
Performance metrics for all DBMS, not just the ones listed above. Some are normalized by throughput, others are not. Legend for results is here.
ips	qps	rps	rmbps	wps	wmbps	rpq	rkbpq	wpi	wkbpi	csps	cpups	cspq	cpupq	dbgb1	dbgb2	rss	maxop	p50	p99	tag
759081	0	1	0.0	4167.3	277.2	0.000	0.000	0.005	0.374	156741	69.7	0.206	15	67.2	117.7	48.9	0.591	101692	52344	my8028_rel_o2nofp.cz11a_c24r64
689098	0	1	0.0	3829.9	255.0	0.000	0.000	0.006	0.379	120548	68.9	0.175	16	67.2	117.7	49.0	0.567	91929	44652	my8032_rel_o2nofp.cz11a_c24r64
703780	0	1	0.0	3909.7	260.4	0.000	0.000	0.006	0.379	126970	69.3	0.180	16	67.2	117.7	49.0	0.575	93740	46051	my8036_rel_o2nofp.cz11a_c24r64
708650	0	1	0.0	3930.1	262.0	0.000	0.000	0.006	0.379	124366	69.5	0.175	16	67.2	117.7	49.0	0.571	94199	47248	my8037_rel_o2nofp.cz11a_c24r64
712100	0	1	0.0	3956.9	263.6	0.000	0.000	0.006	0.379	123022	69.6	0.173	16	67.2	117.7	49.0	0.567	95426	46850	my8038_rel_o2nofp.cz11a_c24r64
l.x
l.x: create secondary indexes
Performance metrics for all DBMS, not just the ones listed above. Some are normalized by throughput, others are not. Legend for results is here.
ips	qps	rps	rmbps	wps	wmbps	rpq	rkbpq	wpi	wkbpi	csps	cpups	cspq	cpupq	dbgb1	dbgb2	rss	maxop	p50	p99	tag
377999	0	4630	535.4	8809.7	474.4	0.012	1.450	0.023	1.285	25657	28.2	0.068	12	154.6	205.1	49.1	0.002	NA	NA	my8028_rel_o2nofp.cz11a_c24r64
377581	0	4619	536.1	8810.1	473.1	0.012	1.454	0.023	1.283	29272	34.1	0.078	14	154.6	205.1	49.1	0.002	NA	NA	my8032_rel_o2nofp.cz11a_c24r64
375642	0	4608	534.0	8714.9	470.7	0.012	1.456	0.023	1.283	24300	34.4	0.065	15	154.6	205.1	49.1	0.002	NA	NA	my8036_rel_o2nofp.cz11a_c24r64
377720	0	4655	537.6	8750.8	473.3	0.012	1.457	0.023	1.283	24215	35.7	0.064	15	154.6	205.1	49.1	0.009	NA	NA	my8037_rel_o2nofp.cz11a_c24r64
377303	0	4622	535.8	8769.9	473.0	0.012	1.454	0.023	1.284	22164	33.0	0.059	14	154.6	205.1	49.1	0.002	NA	NA	my8038_rel_o2nofp.cz11a_c24r64
l.i1
l.i1: continue load after secondary indexes created with 50 inserts per transaction
Performance metrics for all DBMS, not just the ones listed above. Some are normalized by throughput, others are not. Legend for results is here.
ips	qps	rps	rmbps	wps	wmbps	rpq	rkbpq	wpi	wkbpi	csps	cpups	cspq	cpupq	dbgb1	dbgb2	rss	maxop	p50	p99	tag
18412	0	11712	183.0	23334.2	618.6	0.636	10.178	1.267	34.404	133285	30.5	7.239	265	214.5	277.0	49.1	0.753	1200	300	my8028_rel_o2nofp.cz11a_c24r64
18151	0	11221	175.3	22552.4	623.5	0.618	9.891	1.242	35.175	133054	32.4	7.330	286	214.6	277.6	49.1	0.767	1099	250	my8032_rel_o2nofp.cz11a_c24r64
17307	0	11621	181.6	22745.0	625.6	0.671	10.744	1.314	37.017	133814	35.6	7.732	329	214.1	276.2	49.1	0.829	1898	300	my8036_rel_o2nofp.cz11a_c24r64
17689	0	11316	176.8	22657.2	622.4	0.640	10.235	1.281	36.027	133538	35.3	7.549	319	214.3	277.1	49.1	0.826	2048	350	my8037_rel_o2nofp.cz11a_c24r64
17515	0	11644	181.9	22770.3	627.0	0.665	10.636	1.300	36.656	133882	35.8	7.644	327	214.1	276.3	49.1	0.830	1998	400	my8038_rel_o2nofp.cz11a_c24r64
l.i2
l.i2: continue load after secondary indexes created with 5 inserts per transaction
Performance metrics for all DBMS, not just the ones listed above. Some are normalized by throughput, others are not. Legend for results is here.
ips	qps	rps	rmbps	wps	wmbps	rpq	rkbpq	wpi	wkbpi	csps	cpups	cspq	cpupq	dbgb1	dbgb2	rss	maxop	p50	p99	tag
2259	0	15914	248.7	24157.3	622.5	7.046	112.737	10.696	282.217	140855	22.0	62.364	1558	214.5	275.5	49.1	0.293	175	115	my8028_rel_o2nofp.cz11a_c24r64
2172	0	15740	245.9	23027.0	616.5	7.248	115.976	10.604	290.697	137710	23.6	63.417	1739	214.6	276.0	49.1	0.346	170	110	my8032_rel_o2nofp.cz11a_c24r64
2107	0	16001	250.0	24241.5	626.1	7.593	121.485	11.503	304.231	138301	24.1	65.626	1830	214.1	276.2	49.1	0.348	155	100	my8036_rel_o2nofp.cz11a_c24r64
2096	0	15998	250.0	24298.8	623.6	7.631	122.102	11.591	304.586	137902	24.5	65.780	1870	214.3	276.3	49.1	0.285	155	100	my8037_rel_o2nofp.cz11a_c24r64
2115	0	16103	251.6	24560.9	626.5	7.613	121.808	11.612	303.318	138248	24.2	65.359	1831	214.1	276.3	49.1	0.348	155	105	my8038_rel_o2nofp.cz11a_c24r64
qr100.L1
qr100.L1: range queries with 100 insert/s per client
Performance metrics for all DBMS, not just the ones listed above. Some are normalized by throughput, others are not. Legend for results is here.
ips	qps	rps	rmbps	wps	wmbps	rpq	rkbpq	wpi	wkbpi	csps	cpups	cspq	cpupq	dbgb1	dbgb2	rss	maxop	p50	p99	tag
796	53400	2277	35.6	2659.0	76.1	0.043	0.682	3.340	97.878	198306	51.1	3.714	153	214.5	275.5	49.1	0.049	6697	4108	my8028_rel_o2nofp.cz11a_c24r64
796	49108	2279	35.6	2742.2	79.9	0.046	0.742	3.445	102.842	183139	51.3	3.729	167	214.6	276.0	49.1	0.029	6220	4076	my8032_rel_o2nofp.cz11a_c24r64
796	57510	2010	31.4	2785.6	81.1	0.035	0.559	3.500	104.300	211514	51.7	3.678	144	214.1	276.2	49.1	0.024	7272	7018	my8036_rel_o2nofp.cz11a_c24r64
796	57680	2007	31.4	2688.8	78.5	0.035	0.557	3.378	100.940	211717	51.7	3.671	143	214.3	276.3	49.1	0.030	7218	6952	my8037_rel_o2nofp.cz11a_c24r64
796	57602	2008	31.4	2685.6	78.3	0.035	0.558	3.374	100.694	211640	51.7	3.674	144	214.1	276.3	49.1	0.031	7177	6921	my8038_rel_o2nofp.cz11a_c24r64
qp100.L2
qp100.L2: point queries with 100 insert/s per client
Performance metrics for all DBMS, not just the ones listed above. Some are normalized by throughput, others are not. Legend for results is here.
ips	qps	rps	rmbps	wps	wmbps	rpq	rkbpq	wpi	wkbpi	csps	cpups	cspq	cpupq	dbgb1	dbgb2	rss	maxop	p50	p99	tag
796	7242	28930	452.0	6792.6	187.6	3.995	63.913	8.533	241.348	105977	17.1	14.633	378	214.5	275.5	49.1	0.067	911	256	my8028_rel_o2nofp.cz11a_c24r64
796	5927	29146	455.4	6842.4	189.8	4.918	78.680	8.596	244.102	101875	16.6	17.188	448	214.6	276.0	49.1	0.108	815	256	my8032_rel_o2nofp.cz11a_c24r64
796	5909	29007	453.2	6784.1	189.5	4.909	78.540	8.523	243.813	101410	16.6	17.161	449	214.1	276.2	49.1	0.078	815	288	my8036_rel_o2nofp.cz11a_c24r64
796	5978	29229	456.7	6808.9	189.5	4.890	78.235	8.554	243.839	102007	16.9	17.065	452	214.3	276.3	49.1	0.098	831	272	my8037_rel_o2nofp.cz11a_c24r64
796	5990	29289	457.6	6785.9	189.1	4.890	78.234	8.530	243.392	102022	16.6	17.032	443	214.1	276.3	49.1	0.080	799	272	my8038_rel_o2nofp.cz11a_c24r64
qr500.L3
qr500.L3: range queries with 500 insert/s per client
Performance metrics for all DBMS, not just the ones listed above. Some are normalized by throughput, others are not. Legend for results is here.
ips	qps	rps	rmbps	wps	wmbps	rpq	rkbpq	wpi	wkbpi	csps	cpups	cspq	cpupq	dbgb1	dbgb2	rss	maxop	p50	p99	tag
3980	49614	9884	154.4	13096.7	373.5	0.199	3.188	3.291	96.087	194638	57.9	3.923	187	214.5	275.5	49.1	0.155	6357	1519	my8028_rel_o2nofp.cz11a_c24r64
3980	45546	9882	154.4	13112.2	379.3	0.217	3.471	3.295	97.593	181380	58.6	3.982	206	214.6	276.0	49.1	0.145	5788	1407	my8032_rel_o2nofp.cz11a_c24r64
3980	54451	9002	140.7	12522.3	362.3	0.165	2.645	3.146	93.215	207996	60.0	3.820	176	214.1	276.2	49.1	0.090	6841	6329	my8036_rel_o2nofp.cz11a_c24r64
3980	54229	9012	140.8	12517.0	362.0	0.166	2.659	3.145	93.147	206751	60.0	3.813	177	214.3	276.3	49.1	0.113	6828	6329	my8037_rel_o2nofp.cz11a_c24r64
3980	54518	8991	140.5	12482.4	361.1	0.165	2.639	3.136	92.898	208532	59.9	3.825	176	214.1	276.3	49.1	0.092	6873	6409	my8038_rel_o2nofp.cz11a_c24r64
qp500.L4
qp500.L4: point queries with 500 insert/s per client
Performance metrics for all DBMS, not just the ones listed above. Some are normalized by throughput, others are not. Legend for results is here.
ips	qps	rps	rmbps	wps	wmbps	rpq	rkbpq	wpi	wkbpi	csps	cpups	cspq	cpupq	dbgb1	dbgb2	rss	maxop	p50	p99	tag
3978	2566	31879	498.1	19477.4	489.6	12.423	198.762	4.896	126.022	138921	20.5	54.135	1278	214.5	275.5	49.1	0.201	336	128	my8028_rel_o2nofp.cz11a_c24r64
3978	2476	31273	488.6	19339.1	494.5	12.628	202.046	4.862	127.295	138378	22.0	55.876	1421	214.6	276.0	49.1	0.286	320	144	my8032_rel_o2nofp.cz11a_c24r64
3980	2521	31464	491.6	19011.1	493.4	12.483	199.724	4.777	126.937	137950	22.6	54.729	1435	214.1	276.2	49.1	0.227	320	176	my8036_rel_o2nofp.cz11a_c24r64
3980	2539	31591	493.6	19216.9	493.4	12.441	199.051	4.828	126.934	138021	22.8	54.354	1437	214.3	276.4	49.1	0.243	320	176	my8037_rel_o2nofp.cz11a_c24r64
3980	2531	31455	491.5	19055.0	491.8	12.426	198.812	4.788	126.521	137263	22.5	54.224	1422	214.1	276.3	49.1	0.243	320	176	my8038_rel_o2nofp.cz11a_c24r64
qr1000.L5
qr1000.L5: range queries with 1000 insert/s per client
Performance metrics for all DBMS, not just the ones listed above. Some are normalized by throughput, others are not. Legend for results is here.
ips	qps	rps	rmbps	wps	wmbps	rpq	rkbpq	wpi	wkbpi	csps	cpups	cspq	cpupq	dbgb1	dbgb2	rss	maxop	p50	p99	tag
7965	46156	15903	248.5	24820.8	622.8	0.345	5.513	3.116	80.070	211615	64.7	4.585	224	214.5	275.5	49.1	0.238	5977	1295	my8028_rel_o2nofp.cz11a_c24r64
7960	42216	15884	248.2	24086.1	622.3	0.376	6.020	3.026	80.048	201132	66.2	4.764	251	214.6	276.0	49.1	0.283	5468	1279	my8032_rel_o2nofp.cz11a_c24r64
7960	52149	13955	218.0	21236.9	592.4	0.268	4.282	2.668	76.204	213108	67.5	4.087	207	214.1	276.2	49.1	0.228	6606	5932	my8036_rel_o2nofp.cz11a_c24r64
7965	52174	13974	218.3	20809.8	584.8	0.268	4.285	2.613	75.185	211445	67.7	4.053	208	214.3	276.4	49.1	0.165	6632	5802	my8037_rel_o2nofp.cz11a_c24r64
7960	52259	13945	217.9	21169.0	589.0	0.267	4.270	2.659	75.773	213668	67.4	4.089	206	214.1	276.3	49.1	0.127	6633	5818	my8038_rel_o2nofp.cz11a_c24r64
qp1000.L6
qp1000.L6: point queries with 1000 insert/s per client
Performance metrics for all DBMS, not just the ones listed above. Some are normalized by throughput, others are not. Legend for results is here.
ips	qps	rps	rmbps	wps	wmbps	rpq	rkbpq	wpi	wkbpi	csps	cpups	cspq	cpupq	dbgb1	dbgb2	rss	maxop	p50	p99	tag
7965	1853	29395	459.3	21674.1	520.8	15.863	253.815	2.721	66.965	142442	25.1	76.871	2167	214.5	275.5	49.1	0.319	240	112	my8028_rel_o2nofp.cz11a_c24r64
7960	1831	28485	445.1	21301.8	527.7	15.555	248.874	2.676	67.879	141353	27.3	77.187	2385	214.6	276.0	49.1	0.363	224	112	my8032_rel_o2nofp.cz11a_c24r64
7965	1767	28146	439.8	21622.4	530.7	15.925	254.797	2.715	68.236	139750	28.2	79.071	2553	214.1	276.2	49.1	0.338	224	128	my8036_rel_o2nofp.cz11a_c24r64
7965	1788	28271	441.7	21667.0	529.6	15.816	253.056	2.720	68.090	139852	28.6	78.239	2560	214.3	276.4	49.1	0.338	224	128	my8037_rel_o2nofp.cz11a_c24r64
7965	1782	28238	441.2	21719.4	529.9	15.850	253.599	2.727	68.132	139834	28.2	78.488	2533	214.1	276.3	49.1	0.325	224	128	my8038_rel_o2nofp.cz11a_c24r64
l.i0
- l.i0: load without secondary indexes
- Legend for results is here.
- Each entry lists the percentage of responses that fit in that bucket (slower than max time for previous bucket, faster than min time for next bucket).
Insert response time histogram
256us	1ms	4ms	16ms	64ms	256ms	1s	4s	16s	gt	max	tag
0.000	91.907	7.906	0.112	0.054	0.006	0.015	0.000	0.000	0.000	0.591	my8028_rel_o2nofp.cz11a_c24r64
0.000	51.144	48.657	0.121	0.057	0.007	0.015	0.000	0.000	0.000	0.567	my8032_rel_o2nofp.cz11a_c24r64
0.000	69.669	30.136	0.114	0.057	0.009	0.015	0.000	0.000	0.000	0.575	my8036_rel_o2nofp.cz11a_c24r64
0.000	73.880	25.926	0.115	0.056	0.009	0.015	0.000	0.000	0.000	0.571	my8037_rel_o2nofp.cz11a_c24r64
0.000	76.531	23.270	0.118	0.058	0.008	0.015	0.000	0.000	0.000	0.567	my8038_rel_o2nofp.cz11a_c24r64
l.x
- l.x: create secondary indexes
- Legend for results is here.
- Each entry lists the percentage of responses that fit in that bucket (slower than max time for previous bucket, faster than min time for next bucket).
TODO - determine whether there is data for create index response time
l.i1
- l.i1: continue load after secondary indexes created with 50 inserts per transaction
- Legend for results is here.
- Each entry lists the percentage of responses that fit in that bucket (slower than max time for previous bucket, faster than min time for next bucket).
Insert response time histogram
256us	1ms	4ms	16ms	64ms	256ms	1s	4s	16s	gt	max	tag
0.000	0.000	20.418	52.415	20.251	6.553	0.362	0.000	0.000	0.000	0.753	my8028_rel_o2nofp.cz11a_c24r64
0.000	0.000	35.461	36.760	20.868	6.414	0.496	0.000	0.000	0.000	0.767	my8032_rel_o2nofp.cz11a_c24r64
0.000	0.000	8.935	62.884	20.926	6.726	0.529	0.000	0.000	0.000	0.829	my8036_rel_o2nofp.cz11a_c24r64
0.000	0.000	10.943	62.113	19.785	6.642	0.518	0.000	0.000	0.000	0.826	my8037_rel_o2nofp.cz11a_c24r64
0.000	0.000	9.322	62.665	20.800	6.707	0.506	0.000	0.000	0.000	0.830	my8038_rel_o2nofp.cz11a_c24r64
Delete response time histogram
256us	1ms	4ms	16ms	64ms	256ms	1s	4s	16s	gt	max	tag
0.000	0.000	41.406	52.492	5.499	0.487	0.115	0.000	0.000	0.000	0.756	my8028_rel_o2nofp.cz11a_c24r64
0.000	0.000	49.048	44.057	6.301	0.473	0.122	0.000	0.000	0.000	0.676	my8032_rel_o2nofp.cz11a_c24r64
0.000	0.000	34.175	56.508	8.395	0.793	0.129	0.000	0.000	0.000	0.658	my8036_rel_o2nofp.cz11a_c24r64
0.000	0.000	35.161	57.562	6.477	0.682	0.117	0.000	0.000	0.000	0.641	my8037_rel_o2nofp.cz11a_c24r64
0.000	0.000	33.936	56.888	8.247	0.808	0.121	0.000	0.000	0.000	0.720	my8038_rel_o2nofp.cz11a_c24r64
l.i2
- l.i2: continue load after secondary indexes created with 5 inserts per transaction
- Legend for results is here.
- Each entry lists the percentage of responses that fit in that bucket (slower than max time for previous bucket, faster than min time for next bucket).
Insert response time histogram
256us	1ms	4ms	16ms	64ms	256ms	1s	4s	16s	gt	max	tag
nonzero	0.890	10.034	44.614	43.993	0.468	nonzero	0.000	0.000	0.000	0.293	my8028_rel_o2nofp.cz11a_c24r64
0.000	0.004	8.860	45.766	44.673	0.697	nonzero	0.000	0.000	0.000	0.346	my8032_rel_o2nofp.cz11a_c24r64
0.000	1.478	9.444	43.275	45.019	0.784	nonzero	0.000	0.000	0.000	0.348	my8036_rel_o2nofp.cz11a_c24r64
0.000	0.028	8.574	45.126	45.491	0.781	nonzero	0.000	0.000	0.000	0.285	my8037_rel_o2nofp.cz11a_c24r64
0.000	1.403	8.910	43.915	44.955	0.815	nonzero	0.000	0.000	0.000	0.348	my8038_rel_o2nofp.cz11a_c24r64
Delete response time histogram
256us	1ms	4ms	16ms	64ms	256ms	1s	4s	16s	gt	max	tag
0.000	0.858	17.637	38.936	42.269	0.299	nonzero	0.000	0.000	0.000	0.308	my8028_rel_o2nofp.cz11a_c24r64
0.000	0.000	15.974	40.444	43.110	0.472	nonzero	0.000	0.000	0.000	0.348	my8032_rel_o2nofp.cz11a_c24r64
0.000	1.369	16.779	37.818	43.561	0.473	0.000	0.000	0.000	0.000	0.229	my8036_rel_o2nofp.cz11a_c24r64
0.000	0.006	16.163	39.287	44.070	0.474	nonzero	0.000	0.000	0.000	0.279	my8037_rel_o2nofp.cz11a_c24r64
0.000	1.402	16.289	38.466	43.350	0.493	0.000	0.000	0.000	0.000	0.234	my8038_rel_o2nofp.cz11a_c24r64
qr100.L1
- qr100.L1: range queries with 100 insert/s per client
- Legend for results is here.
- Each entry lists the percentage of responses that fit in that bucket (slower than max time for previous bucket, faster than min time for next bucket).
Query response time histogram
256us	1ms	4ms	16ms	64ms	256ms	1s	4s	16s	gt	max	tag
99.685	0.255	0.059	0.001	nonzero	0.000	0.000	0.000	0.000	0.000	0.049	my8028_rel_o2nofp.cz11a_c24r64
99.609	0.320	0.070	0.001	nonzero	0.000	0.000	0.000	0.000	0.000	0.029	my8032_rel_o2nofp.cz11a_c24r64
99.798	0.199	0.003	nonzero	nonzero	0.000	0.000	0.000	0.000	0.000	0.024	my8036_rel_o2nofp.cz11a_c24r64
99.803	0.195	0.002	nonzero	nonzero	0.000	0.000	0.000	0.000	0.000	0.030	my8037_rel_o2nofp.cz11a_c24r64
99.803	0.194	0.002	nonzero	nonzero	0.000	0.000	0.000	0.000	0.000	0.031	my8038_rel_o2nofp.cz11a_c24r64
Insert response time histogram
256us	1ms	4ms	16ms	64ms	256ms	1s	4s	16s	gt	max	tag
0.000	0.000	0.000	95.931	4.069	0.000	0.000	0.000	0.000	0.000	0.051	my8028_rel_o2nofp.cz11a_c24r64
0.000	0.000	0.000	94.760	5.240	0.000	0.000	0.000	0.000	0.000	0.039	my8032_rel_o2nofp.cz11a_c24r64
0.000	0.000	0.003	94.708	5.288	0.000	0.000	0.000	0.000	0.000	0.038	my8036_rel_o2nofp.cz11a_c24r64
0.000	0.000	0.000	95.253	4.747	0.000	0.000	0.000	0.000	0.000	0.044	my8037_rel_o2nofp.cz11a_c24r64
0.000	0.000	0.003	94.306	5.688	0.003	0.000	0.000	0.000	0.000	0.081	my8038_rel_o2nofp.cz11a_c24r64
Delete response time histogram
256us	1ms	4ms	16ms	64ms	256ms	1s	4s	16s	gt	max	tag
0.000	0.000	98.003	1.979	0.017	0.000	0.000	0.000	0.000	0.000	0.019	my8028_rel_o2nofp.cz11a_c24r64
0.000	0.000	98.066	1.934	0.000	0.000	0.000	0.000	0.000	0.000	0.009	my8032_rel_o2nofp.cz11a_c24r64
0.000	0.000	97.385	2.615	0.000	0.000	0.000	0.000	0.000	0.000	0.014	my8036_rel_o2nofp.cz11a_c24r64
0.000	0.000	98.319	1.681	0.000	0.000	0.000	0.000	0.000	0.000	0.010	my8037_rel_o2nofp.cz11a_c24r64
0.000	0.000	97.497	2.417	0.087	0.000	0.000	0.000	0.000	0.000	0.033	my8038_rel_o2nofp.cz11a_c24r64
qp100.L2
- qp100.L2: point queries with 100 insert/s per client
- Legend for results is here.
- Each entry lists the percentage of responses that fit in that bucket (slower than max time for previous bucket, faster than min time for next bucket).
Query response time histogram
256us	1ms	4ms	16ms	64ms	256ms	1s	4s	16s	gt	max	tag
19.950	25.048	54.645	0.342	0.016	nonzero	0.000	0.000	0.000	0.000	0.067	my8028_rel_o2nofp.cz11a_c24r64
0.670	28.640	70.181	0.487	0.023	nonzero	0.000	0.000	0.000	0.000	0.108	my8032_rel_o2nofp.cz11a_c24r64
0.762	28.913	69.773	0.530	0.021	nonzero	0.000	0.000	0.000	0.000	0.078	my8036_rel_o2nofp.cz11a_c24r64
0.787	29.630	69.117	0.448	0.019	nonzero	0.000	0.000	0.000	0.000	0.098	my8037_rel_o2nofp.cz11a_c24r64
0.726	29.949	68.806	0.498	0.021	nonzero	0.000	0.000	0.000	0.000	0.080	my8038_rel_o2nofp.cz11a_c24r64
Insert response time histogram
256us	1ms	4ms	16ms	64ms	256ms	1s	4s	16s	gt	max	tag
0.000	0.000	0.000	15.486	84.090	0.424	0.000	0.000	0.000	0.000	0.147	my8028_rel_o2nofp.cz11a_c24r64
0.000	0.000	0.000	9.247	90.188	0.566	0.000	0.000	0.000	0.000	0.159	my8032_rel_o2nofp.cz11a_c24r64
0.000	0.000	0.000	11.257	88.319	0.424	0.000	0.000	0.000	0.000	0.148	my8036_rel_o2nofp.cz11a_c24r64
0.000	0.000	0.000	10.535	89.024	0.441	0.000	0.000	0.000	0.000	0.132	my8037_rel_o2nofp.cz11a_c24r64
0.000	0.000	0.000	13.448	86.017	0.535	0.000	0.000	0.000	0.000	0.183	my8038_rel_o2nofp.cz11a_c24r64
Delete response time histogram
256us	1ms	4ms	16ms	64ms	256ms	1s	4s	16s	gt	max	tag
0.000	0.000	99.625	0.375	0.000	0.000	0.000	0.000	0.000	0.000	0.014	my8028_rel_o2nofp.cz11a_c24r64
0.000	0.000	98.712	1.257	0.031	0.000	0.000	0.000	0.000	0.000	0.026	my8032_rel_o2nofp.cz11a_c24r64
0.000	0.000	99.535	0.465	0.000	0.000	0.000	0.000	0.000	0.000	0.011	my8036_rel_o2nofp.cz11a_c24r64
0.000	0.000	99.524	0.476	0.000	0.000	0.000	0.000	0.000	0.000	0.012	my8037_rel_o2nofp.cz11a_c24r64
0.000	0.000	99.688	0.312	0.000	0.000	0.000	0.000	0.000	0.000	0.014	my8038_rel_o2nofp.cz11a_c24r64
qr500.L3
- qr500.L3: range queries with 500 insert/s per client
- Legend for results is here.
- Each entry lists the percentage of responses that fit in that bucket (slower than max time for previous bucket, faster than min time for next bucket).
Query response time histogram
256us	1ms	4ms	16ms	64ms	256ms	1s	4s	16s	gt	max	tag
99.122	0.743	0.126	0.008	0.001	nonzero	0.000	0.000	0.000	0.000	0.155	my8028_rel_o2nofp.cz11a_c24r64
98.893	0.955	0.142	0.009	0.001	nonzero	0.000	0.000	0.000	0.000	0.145	my8032_rel_o2nofp.cz11a_c24r64
99.357	0.617	0.023	0.003	nonzero	nonzero	0.000	0.000	0.000	0.000	0.090	my8036_rel_o2nofp.cz11a_c24r64
99.343	0.630	0.023	0.003	nonzero	nonzero	0.000	0.000	0.000	0.000	0.113	my8037_rel_o2nofp.cz11a_c24r64
99.361	0.613	0.023	0.003	nonzero	nonzero	0.000	0.000	0.000	0.000	0.092	my8038_rel_o2nofp.cz11a_c24r64
Insert response time histogram
256us	1ms	4ms	16ms	64ms	256ms	1s	4s	16s	gt	max	tag
0.000	0.000	0.042	94.944	4.931	0.083	0.000	0.000	0.000	0.000	0.195	my8028_rel_o2nofp.cz11a_c24r64
0.000	0.000	0.001	91.367	8.567	0.064	0.000	0.000	0.000	0.000	0.170	my8032_rel_o2nofp.cz11a_c24r64
0.000	0.000	0.029	79.740	20.199	0.031	0.000	0.000	0.000	0.000	0.119	my8036_rel_o2nofp.cz11a_c24r64
0.000	0.000	0.031	78.346	21.575	0.049	0.000	0.000	0.000	0.000	0.136	my8037_rel_o2nofp.cz11a_c24r64
0.000	0.000	0.048	80.119	19.793	0.040	0.000	0.000	0.000	0.000	0.146	my8038_rel_o2nofp.cz11a_c24r64
Delete response time histogram
256us	1ms	4ms	16ms	64ms	256ms	1s	4s	16s	gt	max	tag
0.000	0.000	85.853	14.140	0.007	0.000	0.000	0.000	0.000	0.000	0.028	my8028_rel_o2nofp.cz11a_c24r64
0.000	0.000	77.253	22.731	0.015	0.000	0.000	0.000	0.000	0.000	0.023	my8032_rel_o2nofp.cz11a_c24r64
0.000	0.000	73.170	26.741	0.089	0.000	0.000	0.000	0.000	0.000	0.038	my8036_rel_o2nofp.cz11a_c24r64
0.000	0.000	73.582	26.288	0.130	0.001	0.000	0.000	0.000	0.000	0.082	my8037_rel_o2nofp.cz11a_c24r64
0.000	0.000	73.793	26.069	0.138	0.000	0.000	0.000	0.000	0.000	0.034	my8038_rel_o2nofp.cz11a_c24r64
qp500.L4
- qp500.L4: point queries with 500 insert/s per client
- Legend for results is here.
- Each entry lists the percentage of responses that fit in that bucket (slower than max time for previous bucket, faster than min time for next bucket).
Query response time histogram
256us	1ms	4ms	16ms	64ms	256ms	1s	4s	16s	gt	max	tag
0.001	0.489	88.237	10.317	0.920	0.035	0.000	0.000	0.000	0.000	0.201	my8028_rel_o2nofp.cz11a_c24r64
0.001	0.352	87.493	11.152	0.944	0.059	nonzero	0.000	0.000	0.000	0.286	my8032_rel_o2nofp.cz11a_c24r64
0.001	0.384	88.259	10.388	0.914	0.054	0.000	0.000	0.000	0.000	0.227	my8036_rel_o2nofp.cz11a_c24r64
0.001	0.401	88.582	10.071	0.890	0.055	0.000	0.000	0.000	0.000	0.243	my8037_rel_o2nofp.cz11a_c24r64
0.001	0.425	88.141	10.453	0.924	0.056	0.000	0.000	0.000	0.000	0.243	my8038_rel_o2nofp.cz11a_c24r64
Insert response time histogram
256us	1ms	4ms	16ms	64ms	256ms	1s	4s	16s	gt	max	tag
0.000	0.000	0.001	49.179	47.529	3.290	0.001	0.000	0.000	0.000	0.286	my8028_rel_o2nofp.cz11a_c24r64
0.000	0.000	0.000	38.587	56.962	4.446	0.006	0.000	0.000	0.000	0.304	my8032_rel_o2nofp.cz11a_c24r64
0.000	0.000	0.001	45.027	51.274	3.697	0.001	0.000	0.000	0.000	0.270	my8036_rel_o2nofp.cz11a_c24r64
0.000	0.000	0.000	44.051	52.226	3.718	0.004	0.000	0.000	0.000	0.320	my8037_rel_o2nofp.cz11a_c24r64
0.000	0.000	0.000	45.504	50.727	3.767	0.002	0.000	0.000	0.000	0.276	my8038_rel_o2nofp.cz11a_c24r64
Delete response time histogram
256us	1ms	4ms	16ms	64ms	256ms	1s	4s	16s	gt	max	tag
0.000	0.000	97.060	2.685	0.251	0.004	0.000	0.000	0.000	0.000	0.134	my8028_rel_o2nofp.cz11a_c24r64
0.000	0.000	95.285	4.339	0.355	0.022	0.000	0.000	0.000	0.000	0.141	my8032_rel_o2nofp.cz11a_c24r64
0.000	0.000	96.503	3.180	0.296	0.021	0.000	0.000	0.000	0.000	0.158	my8036_rel_o2nofp.cz11a_c24r64
0.000	0.000	96.274	3.436	0.265	0.025	0.000	0.000	0.000	0.000	0.159	my8037_rel_o2nofp.cz11a_c24r64
0.000	0.000	96.235	3.426	0.316	0.023	0.000	0.000	0.000	0.000	0.102	my8038_rel_o2nofp.cz11a_c24r64
qr1000.L5
- qr1000.L5: range queries with 1000 insert/s per client
- Legend for results is here.
- Each entry lists the percentage of responses that fit in that bucket (slower than max time for previous bucket, faster than min time for next bucket).
Query response time histogram
256us	1ms	4ms	16ms	64ms	256ms	1s	4s	16s	gt	max	tag
98.166	1.611	0.178	0.039	0.006	0.001	0.000	0.000	0.000	0.000	0.238	my8028_rel_o2nofp.cz11a_c24r64
97.565	2.179	0.208	0.040	0.007	0.001	nonzero	0.000	0.000	0.000	0.283	my8032_rel_o2nofp.cz11a_c24r64
98.905	1.033	0.053	0.009	0.001	nonzero	0.000	0.000	0.000	0.000	0.228	my8036_rel_o2nofp.cz11a_c24r64
98.900	1.038	0.053	0.009	0.001	nonzero	0.000	0.000	0.000	0.000	0.165	my8037_rel_o2nofp.cz11a_c24r64
98.898	1.039	0.053	0.009	0.001	nonzero	0.000	0.000	0.000	0.000	0.127	my8038_rel_o2nofp.cz11a_c24r64
Insert response time histogram
256us	1ms	4ms	16ms	64ms	256ms	1s	4s	16s	gt	max	tag
0.000	0.000	0.028	63.716	34.753	1.502	0.001	0.000	0.000	0.000	0.271	my8028_rel_o2nofp.cz11a_c24r64
0.000	0.000	0.010	60.448	37.982	1.554	0.006	0.000	0.000	0.000	0.316	my8032_rel_o2nofp.cz11a_c24r64
0.000	0.000	0.095	76.509	23.311	0.085	0.000	0.000	0.000	0.000	0.243	my8036_rel_o2nofp.cz11a_c24r64
0.000	0.000	0.081	76.088	23.760	0.071	0.000	0.000	0.000	0.000	0.192	my8037_rel_o2nofp.cz11a_c24r64
0.000	0.000	0.132	77.622	22.171	0.075	0.000	0.000	0.000	0.000	0.253	my8038_rel_o2nofp.cz11a_c24r64
Delete response time histogram
256us	1ms	4ms	16ms	64ms	256ms	1s	4s	16s	gt	max	tag
0.000	0.001	88.046	11.651	0.293	0.010	0.000	0.000	0.000	0.000	0.199	my8028_rel_o2nofp.cz11a_c24r64
0.000	0.000	83.425	16.165	0.389	0.020	0.000	0.000	0.000	0.000	0.148	my8032_rel_o2nofp.cz11a_c24r64
0.000	0.000	75.370	24.265	0.357	0.007	0.000	0.000	0.000	0.000	0.143	my8036_rel_o2nofp.cz11a_c24r64
0.000	0.000	77.040	22.625	0.332	0.003	0.000	0.000	0.000	0.000	0.095	my8037_rel_o2nofp.cz11a_c24r64
0.000	0.000	76.266	23.321	0.410	0.003	0.000	0.000	0.000	0.000	0.095	my8038_rel_o2nofp.cz11a_c24r64
qp1000.L6
- qp1000.L6: point queries with 1000 insert/s per client
- Legend for results is here.
- Each entry lists the percentage of responses that fit in that bucket (slower than max time for previous bucket, faster than min time for next bucket).
Query response time histogram
256us	1ms	4ms	16ms	64ms	256ms	1s	4s	16s	gt	max	tag
0.000	0.008	76.277	21.473	2.127	0.114	0.001	0.000	0.000	0.000	0.319	my8028_rel_o2nofp.cz11a_c24r64
0.000	0.006	75.772	21.997	2.091	0.131	0.002	0.000	0.000	0.000	0.363	my8032_rel_o2nofp.cz11a_c24r64
0.000	0.006	74.006	23.412	2.430	0.144	0.002	0.000	0.000	0.000	0.338	my8036_rel_o2nofp.cz11a_c24r64
0.000	0.005	74.653	22.865	2.330	0.144	0.002	0.000	0.000	0.000	0.338	my8037_rel_o2nofp.cz11a_c24r64
0.000	0.007	74.483	22.988	2.374	0.145	0.003	0.000	0.000	0.000	0.325	my8038_rel_o2nofp.cz11a_c24r64
Insert response time histogram
256us	1ms	4ms	16ms	64ms	256ms	1s	4s	16s	gt	max	tag
0.000	0.000	0.034	51.643	44.626	3.662	0.035	0.000	0.000	0.000	0.401	my8028_rel_o2nofp.cz11a_c24r64
0.000	0.000	0.019	58.059	38.667	3.177	0.078	0.000	0.000	0.000	0.424	my8032_rel_o2nofp.cz11a_c24r64
0.000	0.000	0.022	51.137	44.541	4.227	0.073	0.000	0.000	0.000	0.358	my8036_rel_o2nofp.cz11a_c24r64
0.000	0.000	0.019	51.224	44.395	4.277	0.083	0.000	0.000	0.000	0.370	my8037_rel_o2nofp.cz11a_c24r64
0.000	0.000	0.022	51.676	44.017	4.198	0.088	0.000	0.000	0.000	0.398	my8038_rel_o2nofp.cz11a_c24r64
Delete response time histogram
256us	1ms	4ms	16ms	64ms	256ms	1s	4s	16s	gt	max	tag
0.000	0.000	89.374	9.418	1.044	0.164	0.000	0.000	0.000	0.000	0.251	my8028_rel_o2nofp.cz11a_c24r64
0.000	0.000	90.458	8.402	0.959	0.180	0.002	0.000	0.000	0.000	0.297	my8032_rel_o2nofp.cz11a_c24r64
0.000	0.000	86.980	11.489	1.376	0.156	0.000	0.000	0.000	0.000	0.246	my8036_rel_o2nofp.cz11a_c24r64
0.000	0.000	87.165	11.177	1.445	0.213	0.001	0.000	0.000	0.000	0.317	my8037_rel_o2nofp.cz11a_c24r64
0.000	0.000	87.391	10.965	1.463	0.181	0.001	0.000	0.000	0.000	0.334	my8038_rel_o2nofp.cz11a_c24r64