Introduction
This is a report for the insert benchmark with 1024M docs and 8 client(s). It is generated by scripts (bash, awk, sed) and Tufte might not be impressed. An overview of the insert benchmark is here and a short update is here. Below, by DBMS, I mean DBMS+version.config. An example is my8020.c10b40 where my means MySQL, 8020 is version 8.0.20 and c10b40 is the name for the configuration file.
The test server has is a c2d-standard-30 with HT off, 16 cores, 64G RAM, Ubuntu 22.04 and ext4 using SW RAID 0 and 2 NVMe devices. The benchmark was run with 8 clients and there were 1 or 3 connections per client (1 for queries or inserts without rate limits, 1+1 for rate limited inserts+deletes). It uses 8 table with a table per client. It loads 128M rows per table without secondary indexes, creates 3 secondary indexes per table, then inserts 4m+1m rows per table with a delete per insert to avoid growing the table. It then does 6 read+write tests for 1800s each that do queries as fast as possible with 100,100,500,500,1000,1000 inserts/s and the same for deletes/s per client concurrent with the queries. The database is larger than memory. Clients and the DBMS share one server. The per-database configs are in the per-database subdirectories here.
The tested DBMS are:
- pg163_o2nofp.cx9a2a_nojit_c24r64 - Postgres 16.3 compiled with -O2 -fno-omit-frame-pointer and the cx9a2a_nojit_c24r64 config
- pg17beta1_o2nofp.cx9a2a_nojit_c24r64 - Postgres 17beta1 compiled with -O2 -fno-omit-frame-pointer and the cx9a2a_nojit_c24r64 config
- pg17beta2_o2nofp.cx9a2a_nojit_c24r64 - Postgres 17beta2 compiled with -O2 -fno-omit-frame-pointer and the cx9a2a_nojit_c24r64 config
Contents
- Summary
- l.i0: load without secondary indexes
- l.x: create secondary indexes
- l.i1: continue load after secondary indexes created with 50 inserts per transaction
- l.i2: continue load after secondary indexes created with 5 inserts per transaction
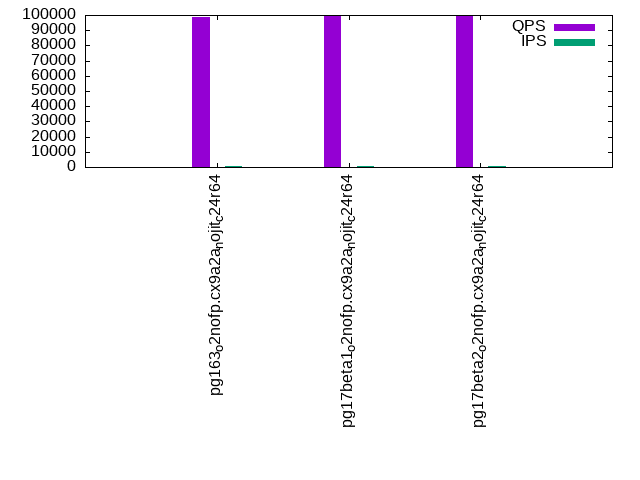
- qr100.L1: range queries with 100 insert/s per client
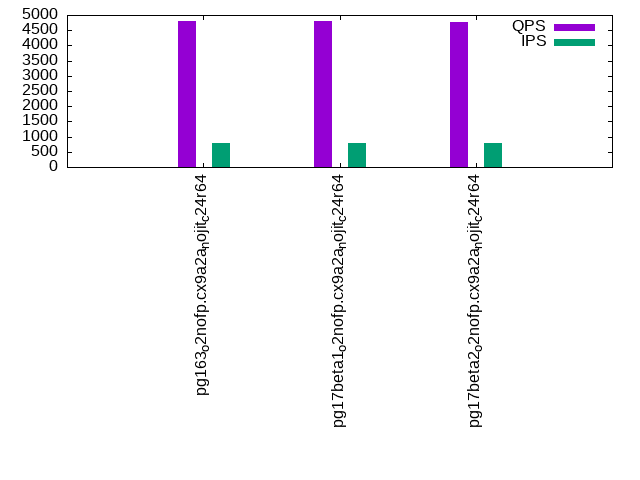
- qp100.L2: point queries with 100 insert/s per client
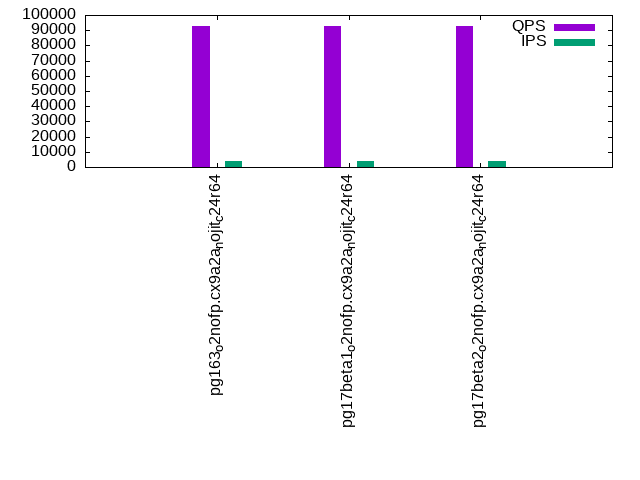
- qr500.L3: range queries with 500 insert/s per client
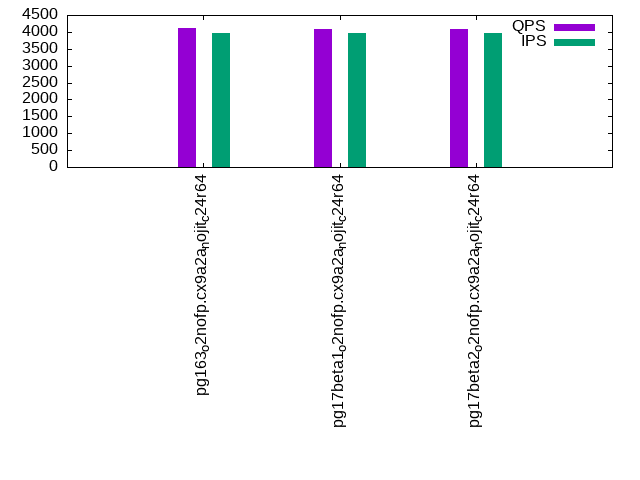
- qp500.L4: point queries with 500 insert/s per client
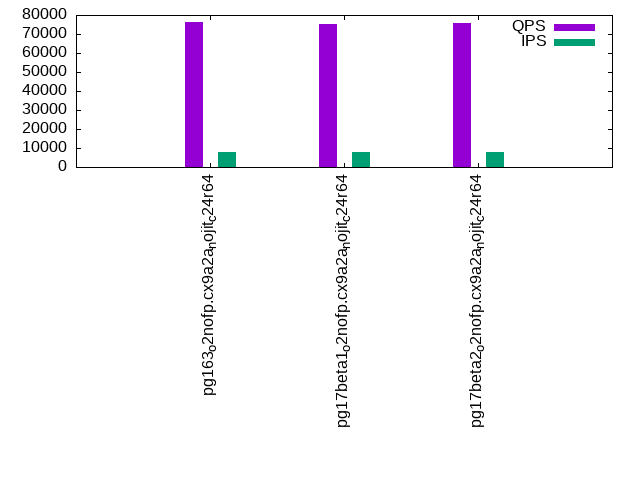
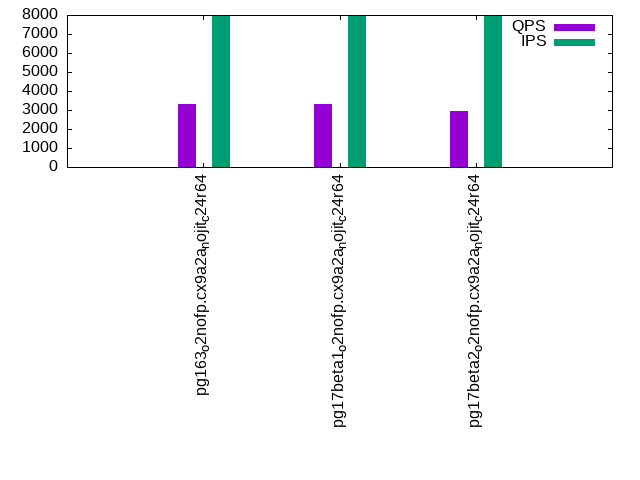
- qr1000.L5: range queries with 1000 insert/s per client
- qp1000.L6: point queries with 1000 insert/s per client
Summary
The numbers are inserts/s for l.i0, l.i1 and l.i2, indexed docs (or rows) /s for l.x and queries/s for qr100, qp100 thru qr1000, qp1000" The values are the average rate over the entire test for inserts (IPS) and queries (QPS). The range of values for IPS and QPS is split into 3 parts: bottom 25%, middle 50%, top 25%. Values in the bottom 25% have a red background, values in the top 25% have a green background and values in the middle have no color. A gray background is used for values that can be ignored because the DBMS did not sustain the target insert rate. Red backgrounds are not used when the minimum value is within 80% of the max value.
| dbms | l.i0 | l.x | l.i1 | l.i2 | qr100 | qp100 | qr500 | qp500 | qr1000 | qp1000 |
|---|---|---|---|---|---|---|---|---|---|---|
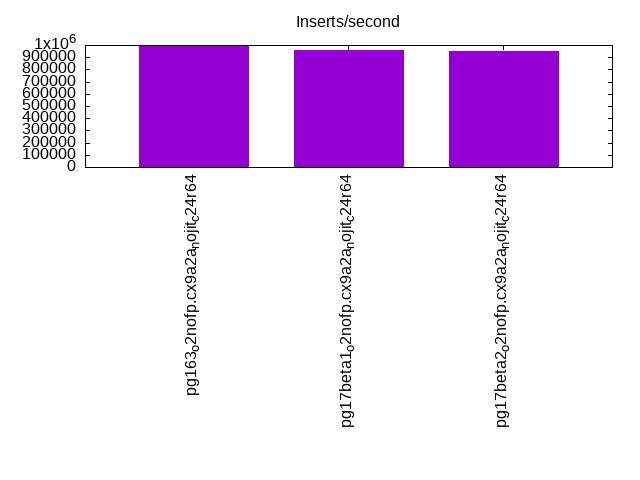
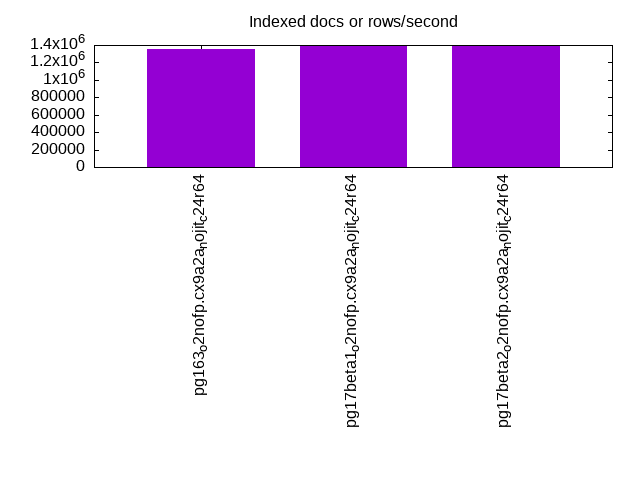
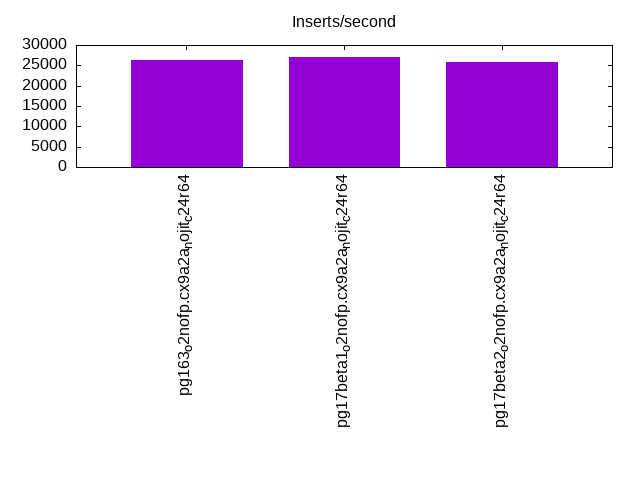
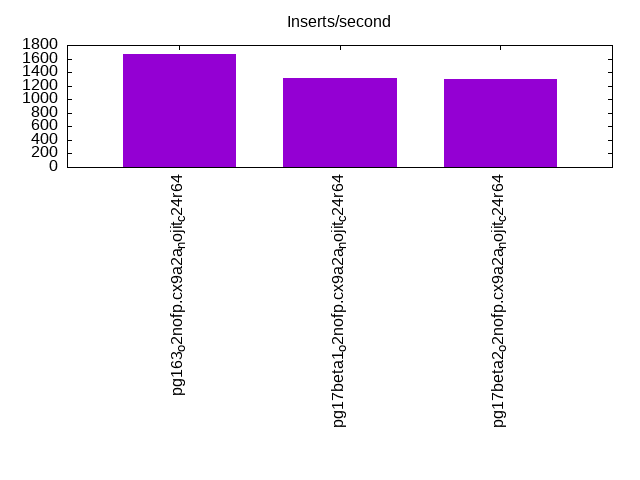
| pg163_o2nofp.cx9a2a_nojit_c24r64 | 992248 | 1358090 | 26424 | 1665 | 98760 | 4801 | 92471 | 4120 | 76385 | 3341 |
| pg17beta1_o2nofp.cx9a2a_nojit_c24r64 | 955224 | 1389417 | 26936 | 1314 | 99126 | 4790 | 92497 | 4099 | 75057 | 3319 |
| pg17beta2_o2nofp.cx9a2a_nojit_c24r64 | 954334 | 1391304 | 25932 | 1304 | 99434 | 4783 | 92557 | 4096 | 75527 | 2962 |
This table has relative throughput, throughput for the DBMS relative to the DBMS in the first line, using the absolute throughput from the previous table. Values less than 0.95 have a yellow background. Values greater than 1.05 have a blue background.
| dbms | l.i0 | l.x | l.i1 | l.i2 | qr100 | qp100 | qr500 | qp500 | qr1000 | qp1000 |
|---|---|---|---|---|---|---|---|---|---|---|
| pg163_o2nofp.cx9a2a_nojit_c24r64 | 1.00 | 1.00 | 1.00 | 1.00 | 1.00 | 1.00 | 1.00 | 1.00 | 1.00 | 1.00 |
| pg17beta1_o2nofp.cx9a2a_nojit_c24r64 | 0.96 | 1.02 | 1.02 | 0.79 | 1.00 | 1.00 | 1.00 | 0.99 | 0.98 | 0.99 |
| pg17beta2_o2nofp.cx9a2a_nojit_c24r64 | 0.96 | 1.02 | 0.98 | 0.78 | 1.01 | 1.00 | 1.00 | 0.99 | 0.99 | 0.89 |
This lists the average rate of inserts/s for the tests that do inserts concurrent with queries. For such tests the query rate is listed in the table above. The read+write tests are setup so that the insert rate should match the target rate every second. Cells that are not at least 95% of the target have a red background to indicate a failure to satisfy the target.
| dbms | qr100.L1 | qp100.L2 | qr500.L3 | qp500.L4 | qr1000.L5 | qp1000.L6 |
|---|---|---|---|---|---|---|
| pg163_o2nofp.cx9a2a_nojit_c24r64 | 796 | 796 | 3980 | 3980 | 7960 | 7960 |
| pg17beta1_o2nofp.cx9a2a_nojit_c24r64 | 796 | 796 | 3980 | 3980 | 7960 | 7960 |
| pg17beta2_o2nofp.cx9a2a_nojit_c24r64 | 796 | 796 | 3978 | 3978 | 7960 | 7960 |
| target | 800 | 800 | 4000 | 4000 | 8000 | 8000 |
l.i0
l.i0: load without secondary indexes. Graphs for performance per 1-second interval are here.
Average throughput:
Insert response time histogram: each cell has the percentage of responses that take <= the time in the header and max is the max response time in seconds. For the max column values in the top 25% of the range have a red background and in the bottom 25% of the range have a green background. The red background is not used when the min value is within 80% of the max value.
| dbms | 256us | 1ms | 4ms | 16ms | 64ms | 256ms | 1s | 4s | 16s | gt | max |
|---|---|---|---|---|---|---|---|---|---|---|---|
| pg163_o2nofp.cx9a2a_nojit_c24r64 | 97.081 | 2.825 | 0.050 | 0.022 | 0.006 | 0.017 | 0.929 | ||||
| pg17beta1_o2nofp.cx9a2a_nojit_c24r64 | 91.631 | 8.274 | 0.045 | 0.027 | 0.007 | 0.017 | nonzero | 1.165 | |||
| pg17beta2_o2nofp.cx9a2a_nojit_c24r64 | 91.333 | 8.577 | 0.041 | 0.026 | 0.007 | 0.017 | 0.918 |
Performance metrics for the DBMS listed above. Some are normalized by throughput, others are not. Legend for results is here.
ips	qps	rps	rmbps	wps	wmbps	rpq	rkbpq	wpi	wkbpi	csps	cpups	cspq	cpupq	dbgb1	dbgb2	rss	maxop	p50	p99	tag
992248	0	414	3.3	2308.9	410.9	0.000	0.003	0.002	0.424	87101	71.9	0.088	12	98.0	162.0	6.7	0.929	139850	19885	pg163_o2nofp.cx9a2a_nojit_c24r64
955224	0	403	3.2	2286.6	396.3	0.000	0.003	0.002	0.425	86109	68.5	0.090	11	98.0	162.0	46.3	1.165	133456	19079	pg17beta1_o2nofp.cx9a2a_nojit_c24r64
954334	0	400	3.2	2268.3	395.4	0.000	0.003	0.002	0.424	85828	68.6	0.090	12	98.0	162.0	46.7	0.918	132358	19579	pg17beta2_o2nofp.cx9a2a_nojit_c24r64
l.x
l.x: create secondary indexes.
Average throughput:
Performance metrics for the DBMS listed above. Some are normalized by throughput, others are not. Legend for results is here.
ips	qps	rps	rmbps	wps	wmbps	rpq	rkbpq	wpi	wkbpi	csps	cpups	cspq	cpupq	dbgb1	dbgb2	rss	maxop	p50	p99	tag
1358090	0	2929	607.9	1461.4	402.8	0.002	0.458	0.001	0.304	21532	25.0	0.016	3	196.7	260.8	4.1	0.051	NA	NA	pg163_o2nofp.cx9a2a_nojit_c24r64
1389417	0	2914	609.7	1471.6	412.6	0.002	0.449	0.001	0.304	8564	25.0	0.006	3	196.7	260.8	28.2	0.091	NA	NA	pg17beta1_o2nofp.cx9a2a_nojit_c24r64
1391304	0	2913	609.8	1438.9	413.6	0.002	0.449	0.001	0.304	8637	25.7	0.006	3	196.7	260.8	22.7	0.036	NA	NA	pg17beta2_o2nofp.cx9a2a_nojit_c24r64
l.i1
l.i1: continue load after secondary indexes created with 50 inserts per transaction. Graphs for performance per 1-second interval are here.
Average throughput:
Insert response time histogram: each cell has the percentage of responses that take <= the time in the header and max is the max response time in seconds. For the max column values in the top 25% of the range have a red background and in the bottom 25% of the range have a green background. The red background is not used when the min value is within 80% of the max value.
| dbms | 256us | 1ms | 4ms | 16ms | 64ms | 256ms | 1s | 4s | 16s | gt | max |
|---|---|---|---|---|---|---|---|---|---|---|---|
| pg163_o2nofp.cx9a2a_nojit_c24r64 | 0.710 | 84.374 | 14.762 | 0.153 | 0.001 | 0.365 | |||||
| pg17beta1_o2nofp.cx9a2a_nojit_c24r64 | 0.469 | 80.419 | 18.863 | 0.248 | nonzero | 0.326 | |||||
| pg17beta2_o2nofp.cx9a2a_nojit_c24r64 | 0.095 | 83.312 | 16.416 | 0.177 | nonzero | 0.362 |
Delete response time histogram: each cell has the percentage of responses that take <= the time in the header and max is the max response time in seconds. For the max column values in the top 25% of the range have a red background and in the bottom 25% of the range have a green background. The red background is not used when the min value is within 80% of the max value.
| dbms | 256us | 1ms | 4ms | 16ms | 64ms | 256ms | 1s | 4s | 16s | gt | max |
|---|---|---|---|---|---|---|---|---|---|---|---|
| pg163_o2nofp.cx9a2a_nojit_c24r64 | 4.085 | 14.972 | 65.619 | 15.287 | 0.037 | 0.203 | |||||
| pg17beta1_o2nofp.cx9a2a_nojit_c24r64 | 4.476 | 16.601 | 68.533 | 10.308 | 0.082 | 0.253 | |||||
| pg17beta2_o2nofp.cx9a2a_nojit_c24r64 | 3.881 | 15.418 | 67.071 | 13.577 | 0.054 | 0.223 |
Performance metrics for the DBMS listed above. Some are normalized by throughput, others are not. Legend for results is here.
ips	qps	rps	rmbps	wps	wmbps	rpq	rkbpq	wpi	wkbpi	csps	cpups	cspq	cpupq	dbgb1	dbgb2	rss	maxop	p50	p99	tag
26424	0	16358	134.8	24201.7	519.0	0.619	5.224	0.916	20.113	42967	44.7	1.626	271	202.0	266.0	48.6	0.365	3099	1898	pg163_o2nofp.cx9a2a_nojit_c24r64
26936	0	17192	160.4	25988.2	551.3	0.638	6.099	0.965	20.960	43316	43.3	1.608	257	201.9	265.9	48.7	0.326	3846	1948	pg17beta1_o2nofp.cx9a2a_nojit_c24r64
25932	0	16140	133.9	24564.0	518.2	0.622	5.287	0.947	20.461	41795	44.0	1.612	271	202.0	266.0	48.7	0.362	3499	2248	pg17beta2_o2nofp.cx9a2a_nojit_c24r64
l.i2
l.i2: continue load after secondary indexes created with 5 inserts per transaction. Graphs for performance per 1-second interval are here.
Average throughput:
Insert response time histogram: each cell has the percentage of responses that take <= the time in the header and max is the max response time in seconds. For the max column values in the top 25% of the range have a red background and in the bottom 25% of the range have a green background. The red background is not used when the min value is within 80% of the max value.
| dbms | 256us | 1ms | 4ms | 16ms | 64ms | 256ms | 1s | 4s | 16s | gt | max |
|---|---|---|---|---|---|---|---|---|---|---|---|
| pg163_o2nofp.cx9a2a_nojit_c24r64 | 1.027 | 67.061 | 31.898 | 0.011 | 0.002 | 0.001 | 0.177 | ||||
| pg17beta1_o2nofp.cx9a2a_nojit_c24r64 | 1.618 | 69.386 | 28.992 | 0.003 | 0.014 | ||||||
| pg17beta2_o2nofp.cx9a2a_nojit_c24r64 | 0.204 | 66.417 | 33.374 | 0.005 | 0.012 |
Delete response time histogram: each cell has the percentage of responses that take <= the time in the header and max is the max response time in seconds. For the max column values in the top 25% of the range have a red background and in the bottom 25% of the range have a green background. The red background is not used when the min value is within 80% of the max value.
| dbms | 256us | 1ms | 4ms | 16ms | 64ms | 256ms | 1s | 4s | 16s | gt | max |
|---|---|---|---|---|---|---|---|---|---|---|---|
| pg163_o2nofp.cx9a2a_nojit_c24r64 | 0.240 | 3.828 | 0.014 | 46.348 | 49.569 | 0.001 | 0.124 | ||||
| pg17beta1_o2nofp.cx9a2a_nojit_c24r64 | 11.351 | 14.366 | 74.283 | nonzero | 0.124 | ||||||
| pg17beta2_o2nofp.cx9a2a_nojit_c24r64 | 8.799 | 91.200 | 0.001 | 0.125 |
Performance metrics for the DBMS listed above. Some are normalized by throughput, others are not. Legend for results is here.
ips	qps	rps	rmbps	wps	wmbps	rpq	rkbpq	wpi	wkbpi	csps	cpups	cspq	cpupq	dbgb1	dbgb2	rss	maxop	p50	p99	tag
1665	0	958	10.9	2014.1	38.0	0.575	6.701	1.210	23.361	9767	35.7	5.866	3430	203.3	267.3	26.4	0.177	305	275	pg163_o2nofp.cx9a2a_nojit_c24r64
1314	0	710	5.9	1553.6	28.9	0.541	4.586	1.182	22.514	6911	32.1	5.259	3909	203.0	267.1	48.7	0.014	1569	1009	pg17beta1_o2nofp.cx9a2a_nojit_c24r64
1304	0	733	6.1	1604.1	29.8	0.562	4.758	1.230	23.435	6755	43.0	5.181	5276	203.3	267.3	48.7	0.012	140	125	pg17beta2_o2nofp.cx9a2a_nojit_c24r64
qr100.L1
qr100.L1: range queries with 100 insert/s per client. Graphs for performance per 1-second interval are here.
Average throughput:
Query response time histogram: each cell has the percentage of responses that take <= the time in the header and max is the max response time in seconds. For max values in the top 25% of the range have a red background and in the bottom 25% of the range have a green background. The red background is not used when the min value is within 80% of the max value.
| dbms | 256us | 1ms | 4ms | 16ms | 64ms | 256ms | 1s | 4s | 16s | gt | max |
|---|---|---|---|---|---|---|---|---|---|---|---|
| pg163_o2nofp.cx9a2a_nojit_c24r64 | 99.954 | 0.046 | nonzero | nonzero | 0.004 | ||||||
| pg17beta1_o2nofp.cx9a2a_nojit_c24r64 | 99.955 | 0.045 | nonzero | nonzero | 0.004 | ||||||
| pg17beta2_o2nofp.cx9a2a_nojit_c24r64 | 99.956 | 0.044 | nonzero | nonzero | 0.004 |
Insert response time histogram: each cell has the percentage of responses that take <= the time in the header and max is the max response time in seconds. For max values in the top 25% of the range have a red background and in the bottom 25% of the range have a green background. The red background is not used when the min value is within 80% of the max value.
| dbms | 256us | 1ms | 4ms | 16ms | 64ms | 256ms | 1s | 4s | 16s | gt | max |
|---|---|---|---|---|---|---|---|---|---|---|---|
| pg163_o2nofp.cx9a2a_nojit_c24r64 | 99.976 | 0.024 | 0.019 | ||||||||
| pg17beta1_o2nofp.cx9a2a_nojit_c24r64 | 0.014 | 98.538 | 1.448 | 0.030 | |||||||
| pg17beta2_o2nofp.cx9a2a_nojit_c24r64 | 99.969 | 0.031 | 0.018 |
Delete response time histogram: each cell has the percentage of responses that take <= the time in the header and max is the max response time in seconds. For max values in the top 25% of the range have a red background and in the bottom 25% of the range have a green background. The red background is not used when the min value is within 80% of the max value.
| dbms | 256us | 1ms | 4ms | 16ms | 64ms | 256ms | 1s | 4s | 16s | gt | max |
|---|---|---|---|---|---|---|---|---|---|---|---|
| pg163_o2nofp.cx9a2a_nojit_c24r64 | 61.906 | 38.094 | 0.004 | ||||||||
| pg17beta1_o2nofp.cx9a2a_nojit_c24r64 | 57.073 | 42.927 | 0.003 | ||||||||
| pg17beta2_o2nofp.cx9a2a_nojit_c24r64 | 55.865 | 44.135 | 0.004 |
Performance metrics for the DBMS listed above. Some are normalized by throughput, others are not. Legend for results is here.
ips	qps	rps	rmbps	wps	wmbps	rpq	rkbpq	wpi	wkbpi	csps	cpups	cspq	cpupq	dbgb1	dbgb2	rss	maxop	p50	p99	tag
796	98760	540	4.8	458.0	14.5	0.005	0.050	0.575	18.710	371002	48.7	3.757	79	203.3	267.4	48.6	0.004	12438	12019	pg163_o2nofp.cx9a2a_nojit_c24r64
796	99126	534	4.7	458.1	14.6	0.005	0.048	0.575	18.721	371867	48.7	3.751	79	203.1	266.2	48.7	0.004	12483	11976	pg17beta1_o2nofp.cx9a2a_nojit_c24r64
796	99434	541	4.7	452.0	14.5	0.005	0.049	0.568	18.663	372831	48.7	3.750	78	203.3	267.4	48.7	0.004	12578	12147	pg17beta2_o2nofp.cx9a2a_nojit_c24r64
qp100.L2
qp100.L2: point queries with 100 insert/s per client. Graphs for performance per 1-second interval are here.
Average throughput:
Query response time histogram: each cell has the percentage of responses that take <= the time in the header and max is the max response time in seconds. For max values in the top 25% of the range have a red background and in the bottom 25% of the range have a green background. The red background is not used when the min value is within 80% of the max value.
| dbms | 256us | 1ms | 4ms | 16ms | 64ms | 256ms | 1s | 4s | 16s | gt | max |
|---|---|---|---|---|---|---|---|---|---|---|---|
| pg163_o2nofp.cx9a2a_nojit_c24r64 | 0.004 | 6.551 | 93.257 | 0.188 | nonzero | 0.020 | |||||
| pg17beta1_o2nofp.cx9a2a_nojit_c24r64 | 0.003 | 6.329 | 93.462 | 0.206 | nonzero | 0.017 | |||||
| pg17beta2_o2nofp.cx9a2a_nojit_c24r64 | 0.003 | 6.254 | 93.568 | 0.175 | 0.010 |
Insert response time histogram: each cell has the percentage of responses that take <= the time in the header and max is the max response time in seconds. For max values in the top 25% of the range have a red background and in the bottom 25% of the range have a green background. The red background is not used when the min value is within 80% of the max value.
| dbms | 256us | 1ms | 4ms | 16ms | 64ms | 256ms | 1s | 4s | 16s | gt | max |
|---|---|---|---|---|---|---|---|---|---|---|---|
| pg163_o2nofp.cx9a2a_nojit_c24r64 | 3.507 | 96.493 | 0.037 | ||||||||
| pg17beta1_o2nofp.cx9a2a_nojit_c24r64 | 3.587 | 96.413 | 0.032 | ||||||||
| pg17beta2_o2nofp.cx9a2a_nojit_c24r64 | 3.601 | 96.399 | 0.031 |
Delete response time histogram: each cell has the percentage of responses that take <= the time in the header and max is the max response time in seconds. For max values in the top 25% of the range have a red background and in the bottom 25% of the range have a green background. The red background is not used when the min value is within 80% of the max value.
| dbms | 256us | 1ms | 4ms | 16ms | 64ms | 256ms | 1s | 4s | 16s | gt | max |
|---|---|---|---|---|---|---|---|---|---|---|---|
| pg163_o2nofp.cx9a2a_nojit_c24r64 | 0.833 | 99.132 | 0.035 | 0.012 | |||||||
| pg17beta1_o2nofp.cx9a2a_nojit_c24r64 | 0.052 | 99.899 | 0.049 | 0.012 | |||||||
| pg17beta2_o2nofp.cx9a2a_nojit_c24r64 | 0.028 | 99.931 | 0.042 | 0.011 |
Performance metrics for the DBMS listed above. Some are normalized by throughput, others are not. Legend for results is here.
ips	qps	rps	rmbps	wps	wmbps	rpq	rkbpq	wpi	wkbpi	csps	cpups	cspq	cpupq	dbgb1	dbgb2	rss	maxop	p50	p99	tag
796	4801	39615	312.0	2581.4	30.0	8.251	66.538	3.243	38.547	95454	13.9	19.882	463	203.4	266.9	48.6	0.020	639	288	pg163_o2nofp.cx9a2a_nojit_c24r64
796	4790	39608	311.0	2580.4	30.0	8.270	66.497	3.242	38.548	95341	14.1	19.906	471	203.1	266.2	48.7	0.017	624	272	pg17beta1_o2nofp.cx9a2a_nojit_c24r64
796	4783	39535	310.4	2583.4	30.0	8.267	66.470	3.245	38.574	95155	14.1	19.896	472	203.4	264.4	48.7	0.010	623	288	pg17beta2_o2nofp.cx9a2a_nojit_c24r64
qr500.L3
qr500.L3: range queries with 500 insert/s per client. Graphs for performance per 1-second interval are here.
Average throughput:
Query response time histogram: each cell has the percentage of responses that take <= the time in the header and max is the max response time in seconds. For max values in the top 25% of the range have a red background and in the bottom 25% of the range have a green background. The red background is not used when the min value is within 80% of the max value.
| dbms | 256us | 1ms | 4ms | 16ms | 64ms | 256ms | 1s | 4s | 16s | gt | max |
|---|---|---|---|---|---|---|---|---|---|---|---|
| pg163_o2nofp.cx9a2a_nojit_c24r64 | 99.800 | 0.194 | 0.005 | 0.001 | nonzero | nonzero | 0.103 | ||||
| pg17beta1_o2nofp.cx9a2a_nojit_c24r64 | 99.809 | 0.185 | 0.005 | 0.001 | nonzero | nonzero | 0.105 | ||||
| pg17beta2_o2nofp.cx9a2a_nojit_c24r64 | 99.800 | 0.193 | 0.006 | 0.001 | nonzero | nonzero | 0.084 |
Insert response time histogram: each cell has the percentage of responses that take <= the time in the header and max is the max response time in seconds. For max values in the top 25% of the range have a red background and in the bottom 25% of the range have a green background. The red background is not used when the min value is within 80% of the max value.
| dbms | 256us | 1ms | 4ms | 16ms | 64ms | 256ms | 1s | 4s | 16s | gt | max |
|---|---|---|---|---|---|---|---|---|---|---|---|
| pg163_o2nofp.cx9a2a_nojit_c24r64 | 0.001 | 75.533 | 24.460 | 0.007 | 0.092 | ||||||
| pg17beta1_o2nofp.cx9a2a_nojit_c24r64 | 76.226 | 23.762 | 0.011 | 0.084 | |||||||
| pg17beta2_o2nofp.cx9a2a_nojit_c24r64 | 75.311 | 24.674 | 0.015 | 0.087 |
Delete response time histogram: each cell has the percentage of responses that take <= the time in the header and max is the max response time in seconds. For max values in the top 25% of the range have a red background and in the bottom 25% of the range have a green background. The red background is not used when the min value is within 80% of the max value.
| dbms | 256us | 1ms | 4ms | 16ms | 64ms | 256ms | 1s | 4s | 16s | gt | max |
|---|---|---|---|---|---|---|---|---|---|---|---|
| pg163_o2nofp.cx9a2a_nojit_c24r64 | 50.192 | 48.707 | 1.101 | 0.056 | |||||||
| pg17beta1_o2nofp.cx9a2a_nojit_c24r64 | 44.967 | 54.133 | 0.900 | 0.046 | |||||||
| pg17beta2_o2nofp.cx9a2a_nojit_c24r64 | 44.220 | 54.337 | 1.442 | 0.001 | 0.081 |
Performance metrics for the DBMS listed above. Some are normalized by throughput, others are not. Legend for results is here.
ips	qps	rps	rmbps	wps	wmbps	rpq	rkbpq	wpi	wkbpi	csps	cpups	cspq	cpupq	dbgb1	dbgb2	rss	maxop	p50	p99	tag
3980	92471	3982	33.8	3578.6	74.8	0.043	0.374	0.899	19.233	338963	52.3	3.666	90	203.6	267.6	48.6	0.103	11667	10484	pg163_o2nofp.cx9a2a_nojit_c24r64
3980	92497	3976	33.7	3579.0	74.6	0.043	0.373	0.899	19.181	337593	52.4	3.650	91	203.4	267.4	48.7	0.105	11715	10660	pg17beta1_o2nofp.cx9a2a_nojit_c24r64
3978	92557	3975	33.7	3569.5	75.9	0.043	0.372	0.897	19.530	337103	52.4	3.642	91	203.6	267.6	48.7	0.084	11683	10516	pg17beta2_o2nofp.cx9a2a_nojit_c24r64
qp500.L4
qp500.L4: point queries with 500 insert/s per client. Graphs for performance per 1-second interval are here.
Average throughput:
Query response time histogram: each cell has the percentage of responses that take <= the time in the header and max is the max response time in seconds. For max values in the top 25% of the range have a red background and in the bottom 25% of the range have a green background. The red background is not used when the min value is within 80% of the max value.
| dbms | 256us | 1ms | 4ms | 16ms | 64ms | 256ms | 1s | 4s | 16s | gt | max |
|---|---|---|---|---|---|---|---|---|---|---|---|
| pg163_o2nofp.cx9a2a_nojit_c24r64 | 0.001 | 2.402 | 97.161 | 0.435 | 0.002 | 0.044 | |||||
| pg17beta1_o2nofp.cx9a2a_nojit_c24r64 | 0.001 | 2.288 | 97.256 | 0.453 | 0.001 | 0.055 | |||||
| pg17beta2_o2nofp.cx9a2a_nojit_c24r64 | 0.001 | 2.266 | 97.298 | 0.433 | 0.002 | 0.048 |
Insert response time histogram: each cell has the percentage of responses that take <= the time in the header and max is the max response time in seconds. For max values in the top 25% of the range have a red background and in the bottom 25% of the range have a green background. The red background is not used when the min value is within 80% of the max value.
| dbms | 256us | 1ms | 4ms | 16ms | 64ms | 256ms | 1s | 4s | 16s | gt | max |
|---|---|---|---|---|---|---|---|---|---|---|---|
| pg163_o2nofp.cx9a2a_nojit_c24r64 | 3.864 | 96.136 | 0.059 | ||||||||
| pg17beta1_o2nofp.cx9a2a_nojit_c24r64 | 3.933 | 96.067 | 0.059 | ||||||||
| pg17beta2_o2nofp.cx9a2a_nojit_c24r64 | 3.882 | 96.118 | 0.057 |
Delete response time histogram: each cell has the percentage of responses that take <= the time in the header and max is the max response time in seconds. For max values in the top 25% of the range have a red background and in the bottom 25% of the range have a green background. The red background is not used when the min value is within 80% of the max value.
| dbms | 256us | 1ms | 4ms | 16ms | 64ms | 256ms | 1s | 4s | 16s | gt | max |
|---|---|---|---|---|---|---|---|---|---|---|---|
| pg163_o2nofp.cx9a2a_nojit_c24r64 | 7.315 | 92.658 | 0.027 | 0.052 | |||||||
| pg17beta1_o2nofp.cx9a2a_nojit_c24r64 | 5.816 | 94.126 | 0.058 | 0.051 | |||||||
| pg17beta2_o2nofp.cx9a2a_nojit_c24r64 | 7.020 | 92.913 | 0.067 | 0.052 |
Performance metrics for the DBMS listed above. Some are normalized by throughput, others are not. Legend for results is here.
ips	qps	rps	rmbps	wps	wmbps	rpq	rkbpq	wpi	wkbpi	csps	cpups	cspq	cpupq	dbgb1	dbgb2	rss	maxop	p50	p99	tag
3980	4120	43905	346.9	8939.9	111.5	10.657	86.238	2.246	28.683	100988	18.7	24.513	726	203.8	267.8	48.6	0.044	543	272	pg163_o2nofp.cx9a2a_nojit_c24r64
3980	4099	43812	345.3	8931.2	111.4	10.690	86.260	2.244	28.671	100195	19.0	24.446	742	203.7	267.7	48.7	0.055	528	272	pg17beta1_o2nofp.cx9a2a_nojit_c24r64
3978	4096	43697	344.3	8932.0	111.4	10.668	86.077	2.245	28.672	99931	19.0	24.397	742	203.8	267.9	48.7	0.048	527	272	pg17beta2_o2nofp.cx9a2a_nojit_c24r64
qr1000.L5
qr1000.L5: range queries with 1000 insert/s per client. Graphs for performance per 1-second interval are here.
Average throughput:
Query response time histogram: each cell has the percentage of responses that take <= the time in the header and max is the max response time in seconds. For max values in the top 25% of the range have a red background and in the bottom 25% of the range have a green background. The red background is not used when the min value is within 80% of the max value.
| dbms | 256us | 1ms | 4ms | 16ms | 64ms | 256ms | 1s | 4s | 16s | gt | max |
|---|---|---|---|---|---|---|---|---|---|---|---|
| pg163_o2nofp.cx9a2a_nojit_c24r64 | 98.972 | 0.985 | 0.031 | 0.010 | 0.002 | nonzero | nonzero | 0.351 | |||
| pg17beta1_o2nofp.cx9a2a_nojit_c24r64 | 98.895 | 1.057 | 0.035 | 0.011 | 0.002 | nonzero | nonzero | 0.374 | |||
| pg17beta2_o2nofp.cx9a2a_nojit_c24r64 | 98.903 | 1.048 | 0.036 | 0.011 | 0.002 | nonzero | nonzero | 0.357 |
Insert response time histogram: each cell has the percentage of responses that take <= the time in the header and max is the max response time in seconds. For max values in the top 25% of the range have a red background and in the bottom 25% of the range have a green background. The red background is not used when the min value is within 80% of the max value.
| dbms | 256us | 1ms | 4ms | 16ms | 64ms | 256ms | 1s | 4s | 16s | gt | max |
|---|---|---|---|---|---|---|---|---|---|---|---|
| pg163_o2nofp.cx9a2a_nojit_c24r64 | nonzero | 80.063 | 19.869 | 0.067 | 0.142 | ||||||
| pg17beta1_o2nofp.cx9a2a_nojit_c24r64 | 0.002 | 80.362 | 19.536 | 0.100 | 0.146 | ||||||
| pg17beta2_o2nofp.cx9a2a_nojit_c24r64 | 0.001 | 79.926 | 20.006 | 0.067 | 0.200 |
Delete response time histogram: each cell has the percentage of responses that take <= the time in the header and max is the max response time in seconds. For max values in the top 25% of the range have a red background and in the bottom 25% of the range have a green background. The red background is not used when the min value is within 80% of the max value.
| dbms | 256us | 1ms | 4ms | 16ms | 64ms | 256ms | 1s | 4s | 16s | gt | max |
|---|---|---|---|---|---|---|---|---|---|---|---|
| pg163_o2nofp.cx9a2a_nojit_c24r64 | 77.682 | 22.204 | 0.114 | 0.102 | |||||||
| pg17beta1_o2nofp.cx9a2a_nojit_c24r64 | 68.994 | 30.826 | 0.180 | 0.115 | |||||||
| pg17beta2_o2nofp.cx9a2a_nojit_c24r64 | 67.792 | 32.031 | 0.177 | 0.122 |
Performance metrics for the DBMS listed above. Some are normalized by throughput, others are not. Legend for results is here.
ips	qps	rps	rmbps	wps	wmbps	rpq	rkbpq	wpi	wkbpi	csps	cpups	cspq	cpupq	dbgb1	dbgb2	rss	maxop	p50	p99	tag
7960	76385	6217	54.1	8368.9	157.8	0.081	0.725	1.051	20.296	261026	61.9	3.417	130	204.8	268.8	48.6	0.351	9638	7895	pg163_o2nofp.cx9a2a_nojit_c24r64
7960	75057	6213	54.1	8374.4	157.9	0.083	0.738	1.052	20.317	253617	62.7	3.379	134	204.8	268.9	48.7	0.374	9513	7624	pg17beta1_o2nofp.cx9a2a_nojit_c24r64
7960	75527	6222	54.0	8361.7	157.9	0.082	0.732	1.050	20.311	254643	62.8	3.372	133	205.0	269.1	48.7	0.357	9551	7719	pg17beta2_o2nofp.cx9a2a_nojit_c24r64
qp1000.L6
qp1000.L6: point queries with 1000 insert/s per client. Graphs for performance per 1-second interval are here.
Average throughput:
Query response time histogram: each cell has the percentage of responses that take <= the time in the header and max is the max response time in seconds. For max values in the top 25% of the range have a red background and in the bottom 25% of the range have a green background. The red background is not used when the min value is within 80% of the max value.
| dbms | 256us | 1ms | 4ms | 16ms | 64ms | 256ms | 1s | 4s | 16s | gt | max |
|---|---|---|---|---|---|---|---|---|---|---|---|
| pg163_o2nofp.cx9a2a_nojit_c24r64 | nonzero | 0.505 | 97.382 | 2.102 | 0.010 | nonzero | 0.080 | ||||
| pg17beta1_o2nofp.cx9a2a_nojit_c24r64 | nonzero | 0.477 | 97.276 | 2.236 | 0.011 | nonzero | 0.078 | ||||
| pg17beta2_o2nofp.cx9a2a_nojit_c24r64 | nonzero | 0.361 | 91.837 | 7.786 | 0.015 | 0.001 | nonzero | 0.561 |
Insert response time histogram: each cell has the percentage of responses that take <= the time in the header and max is the max response time in seconds. For max values in the top 25% of the range have a red background and in the bottom 25% of the range have a green background. The red background is not used when the min value is within 80% of the max value.
| dbms | 256us | 1ms | 4ms | 16ms | 64ms | 256ms | 1s | 4s | 16s | gt | max |
|---|---|---|---|---|---|---|---|---|---|---|---|
| pg163_o2nofp.cx9a2a_nojit_c24r64 | 3.209 | 96.777 | 0.014 | 0.103 | |||||||
| pg17beta1_o2nofp.cx9a2a_nojit_c24r64 | 3.261 | 96.730 | 0.008 | 0.098 | |||||||
| pg17beta2_o2nofp.cx9a2a_nojit_c24r64 | 3.322 | 96.652 | 0.025 | 0.002 | 0.389 |
Delete response time histogram: each cell has the percentage of responses that take <= the time in the header and max is the max response time in seconds. For max values in the top 25% of the range have a red background and in the bottom 25% of the range have a green background. The red background is not used when the min value is within 80% of the max value.
| dbms | 256us | 1ms | 4ms | 16ms | 64ms | 256ms | 1s | 4s | 16s | gt | max |
|---|---|---|---|---|---|---|---|---|---|---|---|
| pg163_o2nofp.cx9a2a_nojit_c24r64 | 7.368 | 92.629 | 0.003 | 0.118 | |||||||
| pg17beta1_o2nofp.cx9a2a_nojit_c24r64 | 0.357 | 99.640 | 0.003 | 0.121 | |||||||
| pg17beta2_o2nofp.cx9a2a_nojit_c24r64 | 0.497 | 99.489 | 0.011 | 0.003 | 0.001 | 1.066 |
Performance metrics for the DBMS listed above. Some are normalized by throughput, others are not. Legend for results is here.
ips	qps	rps	rmbps	wps	wmbps	rpq	rkbpq	wpi	wkbpi	csps	cpups	cspq	cpupq	dbgb1	dbgb2	rss	maxop	p50	p99	tag
7960	3341	47205	373.2	15317.0	211.8	14.129	114.383	1.924	27.244	99999	37.0	29.930	1772	206.6	270.6	48.7	0.080	432	256	pg163_o2nofp.cx9a2a_nojit_c24r64
7960	3319	47074	371.4	15296.3	211.6	14.183	114.575	1.922	27.225	97463	38.6	29.365	1861	206.7	270.8	48.7	0.078	432	256	pg17beta1_o2nofp.cx9a2a_nojit_c24r64
7960	2962	43827	346.2	15059.7	209.5	14.795	119.659	1.892	26.947	91128	37.6	30.763	2031	206.9	270.9	48.7	0.561	400	240	pg17beta2_o2nofp.cx9a2a_nojit_c24r64
l.i0
l.i0: load without secondary indexes
Performance metrics for all DBMS, not just the ones listed above. Some are normalized by throughput, others are not. Legend for results is here.
ips	qps	rps	rmbps	wps	wmbps	rpq	rkbpq	wpi	wkbpi	csps	cpups	cspq	cpupq	dbgb1	dbgb2	rss	maxop	p50	p99	tag
992248	0	414	3.3	2308.9	410.9	0.000	0.003	0.002	0.424	87101	71.9	0.088	12	98.0	162.0	6.7	0.929	139850	19885	pg163_o2nofp.cx9a2a_nojit_c24r64
955224	0	403	3.2	2286.6	396.3	0.000	0.003	0.002	0.425	86109	68.5	0.090	11	98.0	162.0	46.3	1.165	133456	19079	pg17beta1_o2nofp.cx9a2a_nojit_c24r64
954334	0	400	3.2	2268.3	395.4	0.000	0.003	0.002	0.424	85828	68.6	0.090	12	98.0	162.0	46.7	0.918	132358	19579	pg17beta2_o2nofp.cx9a2a_nojit_c24r64
l.x
l.x: create secondary indexes
Performance metrics for all DBMS, not just the ones listed above. Some are normalized by throughput, others are not. Legend for results is here.
ips	qps	rps	rmbps	wps	wmbps	rpq	rkbpq	wpi	wkbpi	csps	cpups	cspq	cpupq	dbgb1	dbgb2	rss	maxop	p50	p99	tag
1358090	0	2929	607.9	1461.4	402.8	0.002	0.458	0.001	0.304	21532	25.0	0.016	3	196.7	260.8	4.1	0.051	NA	NA	pg163_o2nofp.cx9a2a_nojit_c24r64
1389417	0	2914	609.7	1471.6	412.6	0.002	0.449	0.001	0.304	8564	25.0	0.006	3	196.7	260.8	28.2	0.091	NA	NA	pg17beta1_o2nofp.cx9a2a_nojit_c24r64
1391304	0	2913	609.8	1438.9	413.6	0.002	0.449	0.001	0.304	8637	25.7	0.006	3	196.7	260.8	22.7	0.036	NA	NA	pg17beta2_o2nofp.cx9a2a_nojit_c24r64
l.i1
l.i1: continue load after secondary indexes created with 50 inserts per transaction
Performance metrics for all DBMS, not just the ones listed above. Some are normalized by throughput, others are not. Legend for results is here.
ips	qps	rps	rmbps	wps	wmbps	rpq	rkbpq	wpi	wkbpi	csps	cpups	cspq	cpupq	dbgb1	dbgb2	rss	maxop	p50	p99	tag
26424	0	16358	134.8	24201.7	519.0	0.619	5.224	0.916	20.113	42967	44.7	1.626	271	202.0	266.0	48.6	0.365	3099	1898	pg163_o2nofp.cx9a2a_nojit_c24r64
26936	0	17192	160.4	25988.2	551.3	0.638	6.099	0.965	20.960	43316	43.3	1.608	257	201.9	265.9	48.7	0.326	3846	1948	pg17beta1_o2nofp.cx9a2a_nojit_c24r64
25932	0	16140	133.9	24564.0	518.2	0.622	5.287	0.947	20.461	41795	44.0	1.612	271	202.0	266.0	48.7	0.362	3499	2248	pg17beta2_o2nofp.cx9a2a_nojit_c24r64
l.i2
l.i2: continue load after secondary indexes created with 5 inserts per transaction
Performance metrics for all DBMS, not just the ones listed above. Some are normalized by throughput, others are not. Legend for results is here.
ips	qps	rps	rmbps	wps	wmbps	rpq	rkbpq	wpi	wkbpi	csps	cpups	cspq	cpupq	dbgb1	dbgb2	rss	maxop	p50	p99	tag
1665	0	958	10.9	2014.1	38.0	0.575	6.701	1.210	23.361	9767	35.7	5.866	3430	203.3	267.3	26.4	0.177	305	275	pg163_o2nofp.cx9a2a_nojit_c24r64
1314	0	710	5.9	1553.6	28.9	0.541	4.586	1.182	22.514	6911	32.1	5.259	3909	203.0	267.1	48.7	0.014	1569	1009	pg17beta1_o2nofp.cx9a2a_nojit_c24r64
1304	0	733	6.1	1604.1	29.8	0.562	4.758	1.230	23.435	6755	43.0	5.181	5276	203.3	267.3	48.7	0.012	140	125	pg17beta2_o2nofp.cx9a2a_nojit_c24r64
qr100.L1
qr100.L1: range queries with 100 insert/s per client
Performance metrics for all DBMS, not just the ones listed above. Some are normalized by throughput, others are not. Legend for results is here.
ips	qps	rps	rmbps	wps	wmbps	rpq	rkbpq	wpi	wkbpi	csps	cpups	cspq	cpupq	dbgb1	dbgb2	rss	maxop	p50	p99	tag
796	98760	540	4.8	458.0	14.5	0.005	0.050	0.575	18.710	371002	48.7	3.757	79	203.3	267.4	48.6	0.004	12438	12019	pg163_o2nofp.cx9a2a_nojit_c24r64
796	99126	534	4.7	458.1	14.6	0.005	0.048	0.575	18.721	371867	48.7	3.751	79	203.1	266.2	48.7	0.004	12483	11976	pg17beta1_o2nofp.cx9a2a_nojit_c24r64
796	99434	541	4.7	452.0	14.5	0.005	0.049	0.568	18.663	372831	48.7	3.750	78	203.3	267.4	48.7	0.004	12578	12147	pg17beta2_o2nofp.cx9a2a_nojit_c24r64
qp100.L2
qp100.L2: point queries with 100 insert/s per client
Performance metrics for all DBMS, not just the ones listed above. Some are normalized by throughput, others are not. Legend for results is here.
ips	qps	rps	rmbps	wps	wmbps	rpq	rkbpq	wpi	wkbpi	csps	cpups	cspq	cpupq	dbgb1	dbgb2	rss	maxop	p50	p99	tag
796	4801	39615	312.0	2581.4	30.0	8.251	66.538	3.243	38.547	95454	13.9	19.882	463	203.4	266.9	48.6	0.020	639	288	pg163_o2nofp.cx9a2a_nojit_c24r64
796	4790	39608	311.0	2580.4	30.0	8.270	66.497	3.242	38.548	95341	14.1	19.906	471	203.1	266.2	48.7	0.017	624	272	pg17beta1_o2nofp.cx9a2a_nojit_c24r64
796	4783	39535	310.4	2583.4	30.0	8.267	66.470	3.245	38.574	95155	14.1	19.896	472	203.4	264.4	48.7	0.010	623	288	pg17beta2_o2nofp.cx9a2a_nojit_c24r64
qr500.L3
qr500.L3: range queries with 500 insert/s per client
Performance metrics for all DBMS, not just the ones listed above. Some are normalized by throughput, others are not. Legend for results is here.
ips	qps	rps	rmbps	wps	wmbps	rpq	rkbpq	wpi	wkbpi	csps	cpups	cspq	cpupq	dbgb1	dbgb2	rss	maxop	p50	p99	tag
3980	92471	3982	33.8	3578.6	74.8	0.043	0.374	0.899	19.233	338963	52.3	3.666	90	203.6	267.6	48.6	0.103	11667	10484	pg163_o2nofp.cx9a2a_nojit_c24r64
3980	92497	3976	33.7	3579.0	74.6	0.043	0.373	0.899	19.181	337593	52.4	3.650	91	203.4	267.4	48.7	0.105	11715	10660	pg17beta1_o2nofp.cx9a2a_nojit_c24r64
3978	92557	3975	33.7	3569.5	75.9	0.043	0.372	0.897	19.530	337103	52.4	3.642	91	203.6	267.6	48.7	0.084	11683	10516	pg17beta2_o2nofp.cx9a2a_nojit_c24r64
qp500.L4
qp500.L4: point queries with 500 insert/s per client
Performance metrics for all DBMS, not just the ones listed above. Some are normalized by throughput, others are not. Legend for results is here.
ips	qps	rps	rmbps	wps	wmbps	rpq	rkbpq	wpi	wkbpi	csps	cpups	cspq	cpupq	dbgb1	dbgb2	rss	maxop	p50	p99	tag
3980	4120	43905	346.9	8939.9	111.5	10.657	86.238	2.246	28.683	100988	18.7	24.513	726	203.8	267.8	48.6	0.044	543	272	pg163_o2nofp.cx9a2a_nojit_c24r64
3980	4099	43812	345.3	8931.2	111.4	10.690	86.260	2.244	28.671	100195	19.0	24.446	742	203.7	267.7	48.7	0.055	528	272	pg17beta1_o2nofp.cx9a2a_nojit_c24r64
3978	4096	43697	344.3	8932.0	111.4	10.668	86.077	2.245	28.672	99931	19.0	24.397	742	203.8	267.9	48.7	0.048	527	272	pg17beta2_o2nofp.cx9a2a_nojit_c24r64
qr1000.L5
qr1000.L5: range queries with 1000 insert/s per client
Performance metrics for all DBMS, not just the ones listed above. Some are normalized by throughput, others are not. Legend for results is here.
ips	qps	rps	rmbps	wps	wmbps	rpq	rkbpq	wpi	wkbpi	csps	cpups	cspq	cpupq	dbgb1	dbgb2	rss	maxop	p50	p99	tag
7960	76385	6217	54.1	8368.9	157.8	0.081	0.725	1.051	20.296	261026	61.9	3.417	130	204.8	268.8	48.6	0.351	9638	7895	pg163_o2nofp.cx9a2a_nojit_c24r64
7960	75057	6213	54.1	8374.4	157.9	0.083	0.738	1.052	20.317	253617	62.7	3.379	134	204.8	268.9	48.7	0.374	9513	7624	pg17beta1_o2nofp.cx9a2a_nojit_c24r64
7960	75527	6222	54.0	8361.7	157.9	0.082	0.732	1.050	20.311	254643	62.8	3.372	133	205.0	269.1	48.7	0.357	9551	7719	pg17beta2_o2nofp.cx9a2a_nojit_c24r64
qp1000.L6
qp1000.L6: point queries with 1000 insert/s per client
Performance metrics for all DBMS, not just the ones listed above. Some are normalized by throughput, others are not. Legend for results is here.
ips	qps	rps	rmbps	wps	wmbps	rpq	rkbpq	wpi	wkbpi	csps	cpups	cspq	cpupq	dbgb1	dbgb2	rss	maxop	p50	p99	tag
7960	3341	47205	373.2	15317.0	211.8	14.129	114.383	1.924	27.244	99999	37.0	29.930	1772	206.6	270.6	48.7	0.080	432	256	pg163_o2nofp.cx9a2a_nojit_c24r64
7960	3319	47074	371.4	15296.3	211.6	14.183	114.575	1.922	27.225	97463	38.6	29.365	1861	206.7	270.8	48.7	0.078	432	256	pg17beta1_o2nofp.cx9a2a_nojit_c24r64
7960	2962	43827	346.2	15059.7	209.5	14.795	119.659	1.892	26.947	91128	37.6	30.763	2031	206.9	270.9	48.7	0.561	400	240	pg17beta2_o2nofp.cx9a2a_nojit_c24r64
l.i0
- l.i0: load without secondary indexes
- Legend for results is here.
- Each entry lists the percentage of responses that fit in that bucket (slower than max time for previous bucket, faster than min time for next bucket).
Insert response time histogram
256us	1ms	4ms	16ms	64ms	256ms	1s	4s	16s	gt	max	tag
0.000	97.081	2.825	0.050	0.022	0.006	0.017	0.000	0.000	0.000	0.929	pg163_o2nofp.cx9a2a_nojit_c24r64
0.000	91.631	8.274	0.045	0.027	0.007	0.017	nonzero	0.000	0.000	1.165	pg17beta1_o2nofp.cx9a2a_nojit_c24r64
0.000	91.333	8.577	0.041	0.026	0.007	0.017	0.000	0.000	0.000	0.918	pg17beta2_o2nofp.cx9a2a_nojit_c24r64
l.x
- l.x: create secondary indexes
- Legend for results is here.
- Each entry lists the percentage of responses that fit in that bucket (slower than max time for previous bucket, faster than min time for next bucket).
TODO - determine whether there is data for create index response time
l.i1
- l.i1: continue load after secondary indexes created with 50 inserts per transaction
- Legend for results is here.
- Each entry lists the percentage of responses that fit in that bucket (slower than max time for previous bucket, faster than min time for next bucket).
Insert response time histogram
256us	1ms	4ms	16ms	64ms	256ms	1s	4s	16s	gt	max	tag
0.000	0.000	0.710	84.374	14.762	0.153	0.001	0.000	0.000	0.000	0.365	pg163_o2nofp.cx9a2a_nojit_c24r64
0.000	0.000	0.469	80.419	18.863	0.248	nonzero	0.000	0.000	0.000	0.326	pg17beta1_o2nofp.cx9a2a_nojit_c24r64
0.000	0.000	0.095	83.312	16.416	0.177	nonzero	0.000	0.000	0.000	0.362	pg17beta2_o2nofp.cx9a2a_nojit_c24r64
Delete response time histogram
256us	1ms	4ms	16ms	64ms	256ms	1s	4s	16s	gt	max	tag
0.000	4.085	14.972	65.619	15.287	0.037	0.000	0.000	0.000	0.000	0.203	pg163_o2nofp.cx9a2a_nojit_c24r64
0.000	4.476	16.601	68.533	10.308	0.082	0.000	0.000	0.000	0.000	0.253	pg17beta1_o2nofp.cx9a2a_nojit_c24r64
0.000	3.881	15.418	67.071	13.577	0.054	0.000	0.000	0.000	0.000	0.223	pg17beta2_o2nofp.cx9a2a_nojit_c24r64
l.i2
- l.i2: continue load after secondary indexes created with 5 inserts per transaction
- Legend for results is here.
- Each entry lists the percentage of responses that fit in that bucket (slower than max time for previous bucket, faster than min time for next bucket).
Insert response time histogram
256us	1ms	4ms	16ms	64ms	256ms	1s	4s	16s	gt	max	tag
1.027	67.061	31.898	0.011	0.002	0.001	0.000	0.000	0.000	0.000	0.177	pg163_o2nofp.cx9a2a_nojit_c24r64
1.618	69.386	28.992	0.003	0.000	0.000	0.000	0.000	0.000	0.000	0.014	pg17beta1_o2nofp.cx9a2a_nojit_c24r64
0.204	66.417	33.374	0.005	0.000	0.000	0.000	0.000	0.000	0.000	0.012	pg17beta2_o2nofp.cx9a2a_nojit_c24r64
Delete response time histogram
256us	1ms	4ms	16ms	64ms	256ms	1s	4s	16s	gt	max	tag
0.240	3.828	0.014	46.348	49.569	0.001	0.000	0.000	0.000	0.000	0.124	pg163_o2nofp.cx9a2a_nojit_c24r64
0.000	0.000	11.351	14.366	74.283	nonzero	0.000	0.000	0.000	0.000	0.124	pg17beta1_o2nofp.cx9a2a_nojit_c24r64
0.000	0.000	0.000	8.799	91.200	0.001	0.000	0.000	0.000	0.000	0.125	pg17beta2_o2nofp.cx9a2a_nojit_c24r64
qr100.L1
- qr100.L1: range queries with 100 insert/s per client
- Legend for results is here.
- Each entry lists the percentage of responses that fit in that bucket (slower than max time for previous bucket, faster than min time for next bucket).
Query response time histogram
256us	1ms	4ms	16ms	64ms	256ms	1s	4s	16s	gt	max	tag
99.954	0.046	nonzero	nonzero	0.000	0.000	0.000	0.000	0.000	0.000	0.004	pg163_o2nofp.cx9a2a_nojit_c24r64
99.955	0.045	nonzero	nonzero	0.000	0.000	0.000	0.000	0.000	0.000	0.004	pg17beta1_o2nofp.cx9a2a_nojit_c24r64
99.956	0.044	nonzero	nonzero	0.000	0.000	0.000	0.000	0.000	0.000	0.004	pg17beta2_o2nofp.cx9a2a_nojit_c24r64
Insert response time histogram
256us	1ms	4ms	16ms	64ms	256ms	1s	4s	16s	gt	max	tag
0.000	0.000	0.000	99.976	0.024	0.000	0.000	0.000	0.000	0.000	0.019	pg163_o2nofp.cx9a2a_nojit_c24r64
0.000	0.000	0.014	98.538	1.448	0.000	0.000	0.000	0.000	0.000	0.030	pg17beta1_o2nofp.cx9a2a_nojit_c24r64
0.000	0.000	0.000	99.969	0.031	0.000	0.000	0.000	0.000	0.000	0.018	pg17beta2_o2nofp.cx9a2a_nojit_c24r64
Delete response time histogram
256us	1ms	4ms	16ms	64ms	256ms	1s	4s	16s	gt	max	tag
0.000	61.906	38.094	0.000	0.000	0.000	0.000	0.000	0.000	0.000	0.004	pg163_o2nofp.cx9a2a_nojit_c24r64
0.000	57.073	42.927	0.000	0.000	0.000	0.000	0.000	0.000	0.000	0.003	pg17beta1_o2nofp.cx9a2a_nojit_c24r64
0.000	55.865	44.135	0.000	0.000	0.000	0.000	0.000	0.000	0.000	0.004	pg17beta2_o2nofp.cx9a2a_nojit_c24r64
qp100.L2
- qp100.L2: point queries with 100 insert/s per client
- Legend for results is here.
- Each entry lists the percentage of responses that fit in that bucket (slower than max time for previous bucket, faster than min time for next bucket).
Query response time histogram
256us	1ms	4ms	16ms	64ms	256ms	1s	4s	16s	gt	max	tag
0.004	6.551	93.257	0.188	nonzero	0.000	0.000	0.000	0.000	0.000	0.020	pg163_o2nofp.cx9a2a_nojit_c24r64
0.003	6.329	93.462	0.206	nonzero	0.000	0.000	0.000	0.000	0.000	0.017	pg17beta1_o2nofp.cx9a2a_nojit_c24r64
0.003	6.254	93.568	0.175	0.000	0.000	0.000	0.000	0.000	0.000	0.010	pg17beta2_o2nofp.cx9a2a_nojit_c24r64
Insert response time histogram
256us	1ms	4ms	16ms	64ms	256ms	1s	4s	16s	gt	max	tag
0.000	0.000	0.000	3.507	96.493	0.000	0.000	0.000	0.000	0.000	0.037	pg163_o2nofp.cx9a2a_nojit_c24r64
0.000	0.000	0.000	3.587	96.413	0.000	0.000	0.000	0.000	0.000	0.032	pg17beta1_o2nofp.cx9a2a_nojit_c24r64
0.000	0.000	0.000	3.601	96.399	0.000	0.000	0.000	0.000	0.000	0.031	pg17beta2_o2nofp.cx9a2a_nojit_c24r64
Delete response time histogram
256us	1ms	4ms	16ms	64ms	256ms	1s	4s	16s	gt	max	tag
0.000	0.833	99.132	0.035	0.000	0.000	0.000	0.000	0.000	0.000	0.012	pg163_o2nofp.cx9a2a_nojit_c24r64
0.000	0.052	99.899	0.049	0.000	0.000	0.000	0.000	0.000	0.000	0.012	pg17beta1_o2nofp.cx9a2a_nojit_c24r64
0.000	0.028	99.931	0.042	0.000	0.000	0.000	0.000	0.000	0.000	0.011	pg17beta2_o2nofp.cx9a2a_nojit_c24r64
qr500.L3
- qr500.L3: range queries with 500 insert/s per client
- Legend for results is here.
- Each entry lists the percentage of responses that fit in that bucket (slower than max time for previous bucket, faster than min time for next bucket).
Query response time histogram
256us	1ms	4ms	16ms	64ms	256ms	1s	4s	16s	gt	max	tag
99.800	0.194	0.005	0.001	nonzero	nonzero	0.000	0.000	0.000	0.000	0.103	pg163_o2nofp.cx9a2a_nojit_c24r64
99.809	0.185	0.005	0.001	nonzero	nonzero	0.000	0.000	0.000	0.000	0.105	pg17beta1_o2nofp.cx9a2a_nojit_c24r64
99.800	0.193	0.006	0.001	nonzero	nonzero	0.000	0.000	0.000	0.000	0.084	pg17beta2_o2nofp.cx9a2a_nojit_c24r64
Insert response time histogram
256us	1ms	4ms	16ms	64ms	256ms	1s	4s	16s	gt	max	tag
0.000	0.000	0.001	75.533	24.460	0.007	0.000	0.000	0.000	0.000	0.092	pg163_o2nofp.cx9a2a_nojit_c24r64
0.000	0.000	0.000	76.226	23.762	0.011	0.000	0.000	0.000	0.000	0.084	pg17beta1_o2nofp.cx9a2a_nojit_c24r64
0.000	0.000	0.000	75.311	24.674	0.015	0.000	0.000	0.000	0.000	0.087	pg17beta2_o2nofp.cx9a2a_nojit_c24r64
Delete response time histogram
256us	1ms	4ms	16ms	64ms	256ms	1s	4s	16s	gt	max	tag
0.000	0.000	50.192	48.707	1.101	0.000	0.000	0.000	0.000	0.000	0.056	pg163_o2nofp.cx9a2a_nojit_c24r64
0.000	0.000	44.967	54.133	0.900	0.000	0.000	0.000	0.000	0.000	0.046	pg17beta1_o2nofp.cx9a2a_nojit_c24r64
0.000	0.000	44.220	54.337	1.442	0.001	0.000	0.000	0.000	0.000	0.081	pg17beta2_o2nofp.cx9a2a_nojit_c24r64
qp500.L4
- qp500.L4: point queries with 500 insert/s per client
- Legend for results is here.
- Each entry lists the percentage of responses that fit in that bucket (slower than max time for previous bucket, faster than min time for next bucket).
Query response time histogram
256us	1ms	4ms	16ms	64ms	256ms	1s	4s	16s	gt	max	tag
0.001	2.402	97.161	0.435	0.002	0.000	0.000	0.000	0.000	0.000	0.044	pg163_o2nofp.cx9a2a_nojit_c24r64
0.001	2.288	97.256	0.453	0.001	0.000	0.000	0.000	0.000	0.000	0.055	pg17beta1_o2nofp.cx9a2a_nojit_c24r64
0.001	2.266	97.298	0.433	0.002	0.000	0.000	0.000	0.000	0.000	0.048	pg17beta2_o2nofp.cx9a2a_nojit_c24r64
Insert response time histogram
256us	1ms	4ms	16ms	64ms	256ms	1s	4s	16s	gt	max	tag
0.000	0.000	0.000	3.864	96.136	0.000	0.000	0.000	0.000	0.000	0.059	pg163_o2nofp.cx9a2a_nojit_c24r64
0.000	0.000	0.000	3.933	96.067	0.000	0.000	0.000	0.000	0.000	0.059	pg17beta1_o2nofp.cx9a2a_nojit_c24r64
0.000	0.000	0.000	3.882	96.118	0.000	0.000	0.000	0.000	0.000	0.057	pg17beta2_o2nofp.cx9a2a_nojit_c24r64
Delete response time histogram
256us	1ms	4ms	16ms	64ms	256ms	1s	4s	16s	gt	max	tag
0.000	0.000	7.315	92.658	0.027	0.000	0.000	0.000	0.000	0.000	0.052	pg163_o2nofp.cx9a2a_nojit_c24r64
0.000	0.000	5.816	94.126	0.058	0.000	0.000	0.000	0.000	0.000	0.051	pg17beta1_o2nofp.cx9a2a_nojit_c24r64
0.000	0.000	7.020	92.913	0.067	0.000	0.000	0.000	0.000	0.000	0.052	pg17beta2_o2nofp.cx9a2a_nojit_c24r64
qr1000.L5
- qr1000.L5: range queries with 1000 insert/s per client
- Legend for results is here.
- Each entry lists the percentage of responses that fit in that bucket (slower than max time for previous bucket, faster than min time for next bucket).
Query response time histogram
256us	1ms	4ms	16ms	64ms	256ms	1s	4s	16s	gt	max	tag
98.972	0.985	0.031	0.010	0.002	nonzero	nonzero	0.000	0.000	0.000	0.351	pg163_o2nofp.cx9a2a_nojit_c24r64
98.895	1.057	0.035	0.011	0.002	nonzero	nonzero	0.000	0.000	0.000	0.374	pg17beta1_o2nofp.cx9a2a_nojit_c24r64
98.903	1.048	0.036	0.011	0.002	nonzero	nonzero	0.000	0.000	0.000	0.357	pg17beta2_o2nofp.cx9a2a_nojit_c24r64
Insert response time histogram
256us	1ms	4ms	16ms	64ms	256ms	1s	4s	16s	gt	max	tag
0.000	0.000	nonzero	80.063	19.869	0.067	0.000	0.000	0.000	0.000	0.142	pg163_o2nofp.cx9a2a_nojit_c24r64
0.000	0.000	0.002	80.362	19.536	0.100	0.000	0.000	0.000	0.000	0.146	pg17beta1_o2nofp.cx9a2a_nojit_c24r64
0.000	0.000	0.001	79.926	20.006	0.067	0.000	0.000	0.000	0.000	0.200	pg17beta2_o2nofp.cx9a2a_nojit_c24r64
Delete response time histogram
256us	1ms	4ms	16ms	64ms	256ms	1s	4s	16s	gt	max	tag
0.000	0.000	0.000	77.682	22.204	0.114	0.000	0.000	0.000	0.000	0.102	pg163_o2nofp.cx9a2a_nojit_c24r64
0.000	0.000	0.000	68.994	30.826	0.180	0.000	0.000	0.000	0.000	0.115	pg17beta1_o2nofp.cx9a2a_nojit_c24r64
0.000	0.000	0.000	67.792	32.031	0.177	0.000	0.000	0.000	0.000	0.122	pg17beta2_o2nofp.cx9a2a_nojit_c24r64
qp1000.L6
- qp1000.L6: point queries with 1000 insert/s per client
- Legend for results is here.
- Each entry lists the percentage of responses that fit in that bucket (slower than max time for previous bucket, faster than min time for next bucket).
Query response time histogram
256us	1ms	4ms	16ms	64ms	256ms	1s	4s	16s	gt	max	tag
nonzero	0.505	97.382	2.102	0.010	nonzero	0.000	0.000	0.000	0.000	0.080	pg163_o2nofp.cx9a2a_nojit_c24r64
nonzero	0.477	97.276	2.236	0.011	nonzero	0.000	0.000	0.000	0.000	0.078	pg17beta1_o2nofp.cx9a2a_nojit_c24r64
nonzero	0.361	91.837	7.786	0.015	0.001	nonzero	0.000	0.000	0.000	0.561	pg17beta2_o2nofp.cx9a2a_nojit_c24r64
Insert response time histogram
256us	1ms	4ms	16ms	64ms	256ms	1s	4s	16s	gt	max	tag
0.000	0.000	0.000	3.209	96.777	0.014	0.000	0.000	0.000	0.000	0.103	pg163_o2nofp.cx9a2a_nojit_c24r64
0.000	0.000	0.000	3.261	96.730	0.008	0.000	0.000	0.000	0.000	0.098	pg17beta1_o2nofp.cx9a2a_nojit_c24r64
0.000	0.000	0.000	3.322	96.652	0.025	0.002	0.000	0.000	0.000	0.389	pg17beta2_o2nofp.cx9a2a_nojit_c24r64
Delete response time histogram
256us	1ms	4ms	16ms	64ms	256ms	1s	4s	16s	gt	max	tag
0.000	0.000	0.000	7.368	92.629	0.003	0.000	0.000	0.000	0.000	0.118	pg163_o2nofp.cx9a2a_nojit_c24r64
0.000	0.000	0.000	0.357	99.640	0.003	0.000	0.000	0.000	0.000	0.121	pg17beta1_o2nofp.cx9a2a_nojit_c24r64
0.000	0.000	0.000	0.497	99.489	0.011	0.003	0.001	0.000	0.000	1.066	pg17beta2_o2nofp.cx9a2a_nojit_c24r64