Introduction
This is a report for the insert benchmark with 800M docs and 1 client(s). It is generated by scripts (bash, awk, sed) and Tufte might not be impressed. An overview of the insert benchmark is here and a short update is here. Below, by DBMS, I mean DBMS+version.config. An example is my8020.c10b40 where my means MySQL, 8020 is version 8.0.20 and c10b40 is the name for the configuration file.
The test server has 8 AMD cores, 16G RAM and an NVMe SSD. It is described here as the Beelink. The benchmark was run with 1 client and there were 1 or 3 connections per client (1 for queries or inserts without rate limits, 1+1 for rate limited inserts+deletes). It uses 1 table. It loads 20M rows per table without secondary indexes, creates 3 secondary indexes per table, then inserts 40m+10m rows per table with a delete per insert to avoid growing the table. It then does 6 read+write tests for 1800s each that do queries as fast as possible with 100,100,500,500,1000,1000 inserts/s and the same for deletes/s per client concurrent with the queries. The database is cached in memory. Clients and the DBMS share one server. The per-database configs are in the per-database subdirectories here.
The tested DBMS are:
- my5651_rel.cz11a_bee - MySQL 5.6.51 with the cz11a_bee config
- my5744_rel.cz11a_bee - MySQL 5.7.44 with the cz11a_bee config
- my8028_rel.cz11a_bee - MySQL 8.0.28 with the cz11a_bee config
- my8032_rel.cz11a_bee - MySQL 8.0.32 with the cz11a_bee config
- my8036_rel.cz11a_bee - MySQL 8.0.36 with the cz11a_bee config
- my8037_rel.cz11a_bee - MySQL 8.0.37 with the cz11a_bee config
Contents
- Summary
- l.i0: load without secondary indexes
- l.x: create secondary indexes
- l.i1: continue load after secondary indexes created with 50 inserts per transaction
- l.i2: continue load after secondary indexes created with 5 inserts per transaction
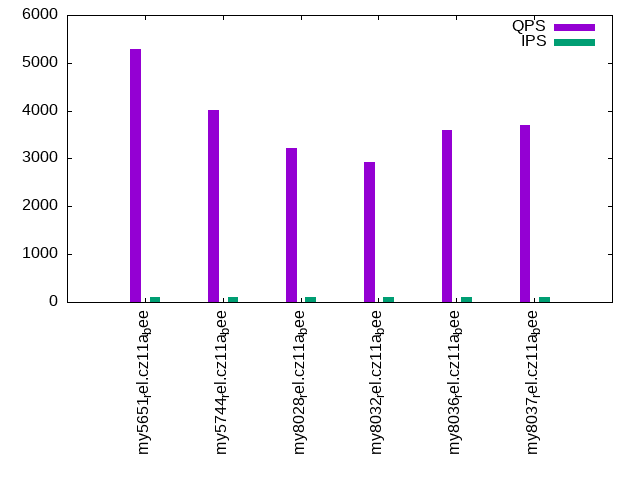
- qr100.L1: range queries with 100 insert/s per client
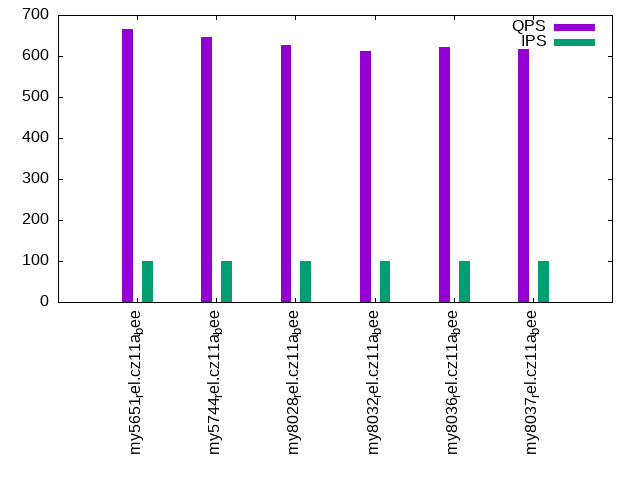
- qp100.L2: point queries with 100 insert/s per client
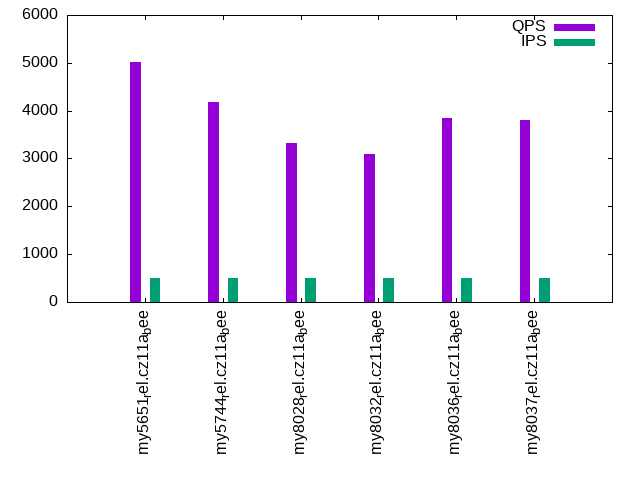
- qr500.L3: range queries with 500 insert/s per client
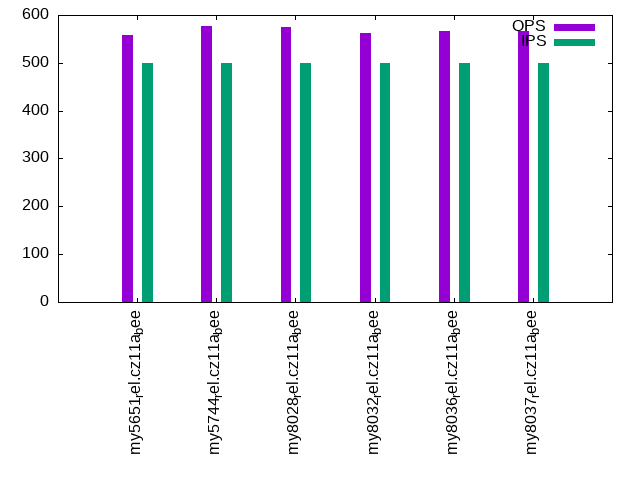
- qp500.L4: point queries with 500 insert/s per client
- qr1000.L5: range queries with 1000 insert/s per client
- qp1000.L6: point queries with 1000 insert/s per client
Summary
The numbers are inserts/s for l.i0, l.i1 and l.i2, indexed docs (or rows) /s for l.x and queries/s for qr100, qp100 thru qr1000, qp1000" The values are the average rate over the entire test for inserts (IPS) and queries (QPS). The range of values for IPS and QPS is split into 3 parts: bottom 25%, middle 50%, top 25%. Values in the bottom 25% have a red background, values in the top 25% have a green background and values in the middle have no color. A gray background is used for values that can be ignored because the DBMS did not sustain the target insert rate. Red backgrounds are not used when the minimum value is within 80% of the max value.
| dbms | l.i0 | l.x | l.i1 | l.i2 | qr100 | qp100 | qr500 | qp500 | qr1000 | qp1000 |
|---|---|---|---|---|---|---|---|---|---|---|
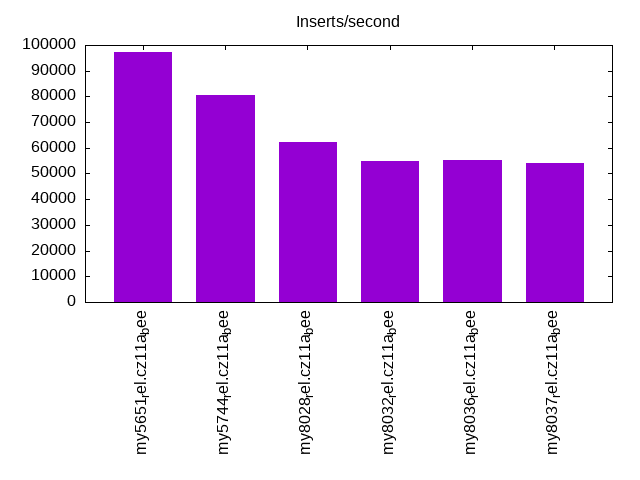
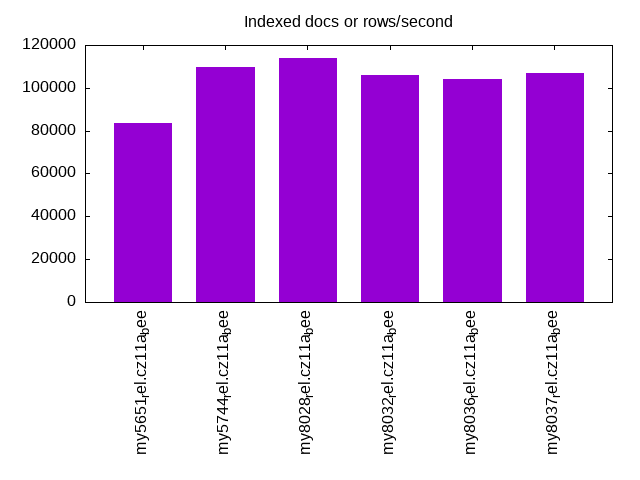
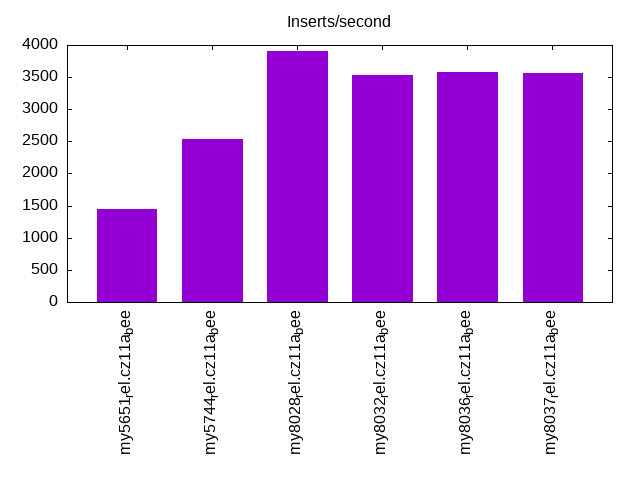
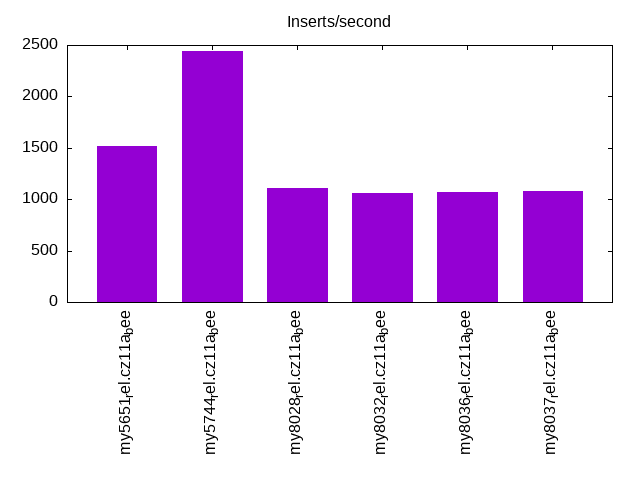
| my5651_rel.cz11a_bee | 97347 | 83647 | 1442 | 1513 | 5279 | 666 | 5022 | 559 | 4525 | 417 |
| my5744_rel.cz11a_bee | 80726 | 109589 | 2530 | 2444 | 4022 | 646 | 4178 | 578 | 4295 | 533 |
| my8028_rel.cz11a_bee | 62276 | 113701 | 3909 | 1111 | 3212 | 627 | 3330 | 574 | 3422 | 535 |
| my8032_rel.cz11a_bee | 54956 | 105848 | 3528 | 1061 | 2928 | 612 | 3102 | 562 | 3212 | 522 |
| my8036_rel.cz11a_bee | 55436 | 104072 | 3576 | 1074 | 3590 | 621 | 3848 | 566 | 3983 | 525 |
| my8037_rel.cz11a_bee | 54021 | 106724 | 3559 | 1076 | 3697 | 618 | 3808 | 567 | 3943 | 526 |
This table has relative throughput, throughput for the DBMS relative to the DBMS in the first line, using the absolute throughput from the previous table. Values less than 0.95 have a yellow background. Values greater than 1.05 have a blue background.
| dbms | l.i0 | l.x | l.i1 | l.i2 | qr100 | qp100 | qr500 | qp500 | qr1000 | qp1000 |
|---|---|---|---|---|---|---|---|---|---|---|
| my5651_rel.cz11a_bee | 1.00 | 1.00 | 1.00 | 1.00 | 1.00 | 1.00 | 1.00 | 1.00 | 1.00 | 1.00 |
| my5744_rel.cz11a_bee | 0.83 | 1.31 | 1.75 | 1.62 | 0.76 | 0.97 | 0.83 | 1.03 | 0.95 | 1.28 |
| my8028_rel.cz11a_bee | 0.64 | 1.36 | 2.71 | 0.73 | 0.61 | 0.94 | 0.66 | 1.03 | 0.76 | 1.28 |
| my8032_rel.cz11a_bee | 0.56 | 1.27 | 2.45 | 0.70 | 0.55 | 0.92 | 0.62 | 1.01 | 0.71 | 1.25 |
| my8036_rel.cz11a_bee | 0.57 | 1.24 | 2.48 | 0.71 | 0.68 | 0.93 | 0.77 | 1.01 | 0.88 | 1.26 |
| my8037_rel.cz11a_bee | 0.55 | 1.28 | 2.47 | 0.71 | 0.70 | 0.93 | 0.76 | 1.01 | 0.87 | 1.26 |
This lists the average rate of inserts/s for the tests that do inserts concurrent with queries. For such tests the query rate is listed in the table above. The read+write tests are setup so that the insert rate should match the target rate every second. Cells that are not at least 95% of the target have a red background to indicate a failure to satisfy the target.
| dbms | qr100.L1 | qp100.L2 | qr500.L3 | qp500.L4 | qr1000.L5 | qp1000.L6 |
|---|---|---|---|---|---|---|
| my5651_rel.cz11a_bee | 100 | 100 | 499 | 499 | 999 | 999 |
| my5744_rel.cz11a_bee | 100 | 100 | 499 | 499 | 998 | 999 |
| my8028_rel.cz11a_bee | 100 | 100 | 499 | 499 | 998 | 998 |
| my8032_rel.cz11a_bee | 100 | 100 | 499 | 499 | 999 | 998 |
| my8036_rel.cz11a_bee | 100 | 100 | 499 | 499 | 998 | 998 |
| my8037_rel.cz11a_bee | 100 | 100 | 499 | 499 | 998 | 998 |
| target | 100 | 100 | 500 | 500 | 1000 | 1000 |
l.i0
l.i0: load without secondary indexes. Graphs for performance per 1-second interval are here.
Average throughput:
Insert response time histogram: each cell has the percentage of responses that take <= the time in the header and max is the max response time in seconds. For the max column values in the top 25% of the range have a red background and in the bottom 25% of the range have a green background. The red background is not used when the min value is within 80% of the max value.
| dbms | 256us | 1ms | 4ms | 16ms | 64ms | 256ms | 1s | 4s | 16s | gt | max |
|---|---|---|---|---|---|---|---|---|---|---|---|
| my5651_rel.cz11a_bee | 86.305 | 13.569 | 0.122 | 0.002 | 0.001 | 0.107 | |||||
| my5744_rel.cz11a_bee | 0.191 | 99.458 | 0.211 | 0.138 | 0.002 | 0.096 | |||||
| my8028_rel.cz11a_bee | 99.471 | 0.385 | 0.142 | 0.002 | 0.126 | ||||||
| my8032_rel.cz11a_bee | 99.400 | 0.458 | 0.142 | 0.001 | 0.104 | ||||||
| my8036_rel.cz11a_bee | 99.422 | 0.435 | 0.142 | 0.001 | 0.103 | ||||||
| my8037_rel.cz11a_bee | 99.411 | 0.446 | 0.142 | 0.001 | nonzero | 0.401 |
Performance metrics for the DBMS listed above. Some are normalized by throughput, others are not. Legend for results is here.
ips	qps	rps	rmbps	wps	wmbps	rpq	rkbpq	wpi	wkbpi	csps	cpups	cspq	cpupq	dbgb1	dbgb2	rss	maxop	p50	p99	tag
97347	0	852	3.3	485.1	35.1	0.009	0.035	0.005	0.369	12201	23.0	0.125	19	52.6	68.1	10.7	0.107	97686	90096	my5651_rel.cz11a_bee
80726	0	0	0.0	412.3	29.2	0.000	0.000	0.005	0.371	8801	21.6	0.109	21	52.6	68.1	10.9	0.096	80989	73597	my5744_rel.cz11a_bee
62276	0	0	0.0	377.8	23.3	0.000	0.000	0.006	0.384	7230	21.4	0.116	27	52.4	68.0	11.1	0.126	62428	57135	my8028_rel.cz11a_bee
54956	0	0	0.0	338.0	20.9	0.000	0.000	0.006	0.389	6869	20.9	0.125	30	52.4	68.0	11.1	0.104	55037	51440	my8032_rel.cz11a_bee
55436	0	0	0.0	338.1	21.0	0.000	0.000	0.006	0.388	6642	20.6	0.120	30	52.4	68.0	11.1	0.103	55536	51841	my8036_rel.cz11a_bee
54021	0	0	0.0	329.2	20.4	0.000	0.000	0.006	0.388	6480	20.4	0.120	30	52.4	68.0	11.1	0.401	54040	50543	my8037_rel.cz11a_bee
l.x
l.x: create secondary indexes.
Average throughput:
Performance metrics for the DBMS listed above. Some are normalized by throughput, others are not. Legend for results is here.
ips	qps	rps	rmbps	wps	wmbps	rpq	rkbpq	wpi	wkbpi	csps	cpups	cspq	cpupq	dbgb1	dbgb2	rss	maxop	p50	p99	tag
83647	0	555	84.5	707.4	107.2	0.007	1.035	0.008	1.312	1892	11.3	0.023	11	111.4	126.9	10.8	0.002	NA	NA	my5651_rel.cz11a_bee
109589	0	685	110.1	967.9	130.6	0.006	1.029	0.009	1.221	6268	12.0	0.057	9	121.1	136.7	11.0	0.002	NA	NA	my5744_rel.cz11a_bee
113701	0	1908	180.9	2322.7	162.7	0.017	1.629	0.020	1.465	8986	44.0	0.079	31	120.7	136.3	11.2	0.004	NA	NA	my8028_rel.cz11a_bee
105848	0	1776	168.4	2203.0	151.4	0.017	1.629	0.021	1.464	8770	44.1	0.083	33	120.7	136.3	11.2	0.004	NA	NA	my8032_rel.cz11a_bee
104072	0	1746	165.6	2124.8	148.9	0.017	1.629	0.020	1.465	8548	44.1	0.082	34	120.7	136.3	11.2	0.004	NA	NA	my8036_rel.cz11a_bee
106724	0	1790	169.7	2177.8	152.7	0.017	1.628	0.020	1.465	8627	43.7	0.081	33	120.7	136.3	11.2	0.004	NA	NA	my8037_rel.cz11a_bee
l.i1
l.i1: continue load after secondary indexes created with 50 inserts per transaction. Graphs for performance per 1-second interval are here.
Average throughput:
Insert response time histogram: each cell has the percentage of responses that take <= the time in the header and max is the max response time in seconds. For the max column values in the top 25% of the range have a red background and in the bottom 25% of the range have a green background. The red background is not used when the min value is within 80% of the max value.
| dbms | 256us | 1ms | 4ms | 16ms | 64ms | 256ms | 1s | 4s | 16s | gt | max |
|---|---|---|---|---|---|---|---|---|---|---|---|
| my5651_rel.cz11a_bee | 0.887 | 93.932 | 5.181 | nonzero | 0.791 | ||||||
| my5744_rel.cz11a_bee | 59.251 | 39.833 | 0.915 | 0.255 | |||||||
| my8028_rel.cz11a_bee | 0.092 | 85.573 | 13.494 | 0.841 | 0.244 | ||||||
| my8032_rel.cz11a_bee | 0.009 | 83.883 | 15.230 | 0.875 | 0.003 | 0.403 | |||||
| my8036_rel.cz11a_bee | 0.018 | 84.339 | 14.834 | 0.804 | 0.004 | 0.427 | |||||
| my8037_rel.cz11a_bee | 0.011 | 84.186 | 14.908 | 0.888 | 0.006 | 0.433 |
Delete response time histogram: each cell has the percentage of responses that take <= the time in the header and max is the max response time in seconds. For the max column values in the top 25% of the range have a red background and in the bottom 25% of the range have a green background. The red background is not used when the min value is within 80% of the max value.
| dbms | 256us | 1ms | 4ms | 16ms | 64ms | 256ms | 1s | 4s | 16s | gt | max |
|---|---|---|---|---|---|---|---|---|---|---|---|
| my5651_rel.cz11a_bee | 85.111 | 14.557 | 0.330 | 0.001 | nonzero | 0.629 | |||||
| my5744_rel.cz11a_bee | 97.196 | 2.552 | 0.251 | 0.001 | 0.090 | ||||||
| my8028_rel.cz11a_bee | 7.694 | 89.363 | 2.630 | 0.313 | 0.234 | ||||||
| my8032_rel.cz11a_bee | 4.174 | 92.279 | 3.252 | 0.292 | 0.003 | 0.403 | |||||
| my8036_rel.cz11a_bee | 5.259 | 91.372 | 3.141 | 0.224 | 0.004 | 0.417 | |||||
| my8037_rel.cz11a_bee | 4.915 | 91.544 | 3.207 | 0.329 | 0.005 | 0.431 |
Performance metrics for the DBMS listed above. Some are normalized by throughput, others are not. Legend for results is here.
ips	qps	rps	rmbps	wps	wmbps	rpq	rkbpq	wpi	wkbpi	csps	cpups	cspq	cpupq	dbgb1	dbgb2	rss	maxop	p50	p99	tag
1442	0	7713	119.9	11189.6	272.6	5.348	85.122	7.758	193.564	49122	20.0	34.058	1109	144.1	159.6	10.5	0.791	1498	849	my5651_rel.cz11a_bee
2530	0	13399	209.4	15414.5	478.0	5.295	84.721	6.091	193.437	82503	29.5	32.603	933	144.5	160.0	10.7	0.255	2647	949	my5744_rel.cz11a_bee
3909	0	8197	128.1	12542.1	329.1	2.097	33.551	3.209	86.217	75924	32.2	19.423	659	167.3	187.4	10.7	0.244	4245	50	my8028_rel.cz11a_bee
3528	0	7783	121.6	11868.1	316.0	2.206	35.297	3.364	91.710	72207	33.1	20.467	751	167.1	186.7	10.8	0.403	3848	0	my8032_rel.cz11a_bee
3576	0	7850	122.7	11981.3	319.0	2.195	35.119	3.350	91.342	71548	33.4	20.005	747	167.0	186.3	10.8	0.427	3946	0	my8036_rel.cz11a_bee
3559	0	7870	123.0	11985.4	319.3	2.211	35.379	3.367	91.863	71691	33.4	20.142	751	167.0	186.5	10.8	0.433	3899	0	my8037_rel.cz11a_bee
l.i2
l.i2: continue load after secondary indexes created with 5 inserts per transaction. Graphs for performance per 1-second interval are here.
Average throughput:
Insert response time histogram: each cell has the percentage of responses that take <= the time in the header and max is the max response time in seconds. For the max column values in the top 25% of the range have a red background and in the bottom 25% of the range have a green background. The red background is not used when the min value is within 80% of the max value.
| dbms | 256us | 1ms | 4ms | 16ms | 64ms | 256ms | 1s | 4s | 16s | gt | max |
|---|---|---|---|---|---|---|---|---|---|---|---|
| my5651_rel.cz11a_bee | nonzero | 5.429 | 70.010 | 24.257 | 0.304 | nonzero | 0.084 | ||||
| my5744_rel.cz11a_bee | 12.562 | 80.173 | 7.091 | 0.174 | nonzero | 0.078 | |||||
| my8028_rel.cz11a_bee | 7.116 | 66.314 | 23.860 | 2.701 | 0.010 | 0.212 | |||||
| my8032_rel.cz11a_bee | 5.135 | 68.452 | 23.720 | 2.683 | 0.011 | 0.187 | |||||
| my8036_rel.cz11a_bee | 5.926 | 68.464 | 23.036 | 2.565 | 0.008 | 0.125 | |||||
| my8037_rel.cz11a_bee | 5.667 | 68.304 | 23.367 | 2.649 | 0.012 | nonzero | 0.562 |
Delete response time histogram: each cell has the percentage of responses that take <= the time in the header and max is the max response time in seconds. For the max column values in the top 25% of the range have a red background and in the bottom 25% of the range have a green background. The red background is not used when the min value is within 80% of the max value.
| dbms | 256us | 1ms | 4ms | 16ms | 64ms | 256ms | 1s | 4s | 16s | gt | max |
|---|---|---|---|---|---|---|---|---|---|---|---|
| my5651_rel.cz11a_bee | nonzero | 52.742 | 44.315 | 2.907 | 0.036 | nonzero | 0.083 | ||||
| my5744_rel.cz11a_bee | 98.503 | 1.063 | 0.425 | 0.008 | nonzero | 0.078 | |||||
| my8028_rel.cz11a_bee | 32.696 | 44.408 | 21.588 | 1.304 | 0.004 | 0.220 | |||||
| my8032_rel.cz11a_bee | 21.040 | 56.500 | 21.203 | 1.252 | 0.005 | 0.197 | |||||
| my8036_rel.cz11a_bee | 24.080 | 54.262 | 20.514 | 1.141 | 0.003 | 0.124 | |||||
| my8037_rel.cz11a_bee | 23.909 | 53.972 | 20.894 | 1.219 | 0.006 | nonzero | 0.418 |
Performance metrics for the DBMS listed above. Some are normalized by throughput, others are not. Legend for results is here.
ips	qps	rps	rmbps	wps	wmbps	rpq	rkbpq	wpi	wkbpi	csps	cpups	cspq	cpupq	dbgb1	dbgb2	rss	maxop	p50	p99	tag
1513	0	7842	117.7	10592.5	256.8	5.183	79.683	7.001	173.814	55631	27.2	36.769	1438	144.1	159.6	10.5	0.084	1528	1254	my5651_rel.cz11a_bee
2444	0	12026	187.9	13586.2	417.3	4.921	78.739	5.560	174.861	82026	34.2	33.566	1120	144.5	160.0	10.7	0.078	2427	2038	my5744_rel.cz11a_bee
1111	0	13363	208.8	17944.4	454.1	12.026	192.412	16.149	418.509	91698	36.5	82.522	2628	167.3	185.9	10.8	0.212	554	0	my8028_rel.cz11a_bee
1061	0	12876	201.2	17318.1	439.5	12.139	194.231	16.327	424.299	87266	37.5	82.272	2828	167.1	186.7	10.8	0.187	564	0	my8032_rel.cz11a_bee
1074	0	12966	202.6	17459.6	442.4	12.072	193.150	16.255	421.783	86142	38.1	80.199	2838	167.0	186.3	10.8	0.125	565	0	my8036_rel.cz11a_bee
1076	0	12990	203.0	17462.5	443.5	12.073	193.174	16.231	422.091	86625	38.1	80.514	2833	167.0	186.5	10.8	0.562	564	0	my8037_rel.cz11a_bee
qr100.L1
qr100.L1: range queries with 100 insert/s per client. Graphs for performance per 1-second interval are here.
Average throughput:
Query response time histogram: each cell has the percentage of responses that take <= the time in the header and max is the max response time in seconds. For max values in the top 25% of the range have a red background and in the bottom 25% of the range have a green background. The red background is not used when the min value is within 80% of the max value.
| dbms | 256us | 1ms | 4ms | 16ms | 64ms | 256ms | 1s | 4s | 16s | gt | max |
|---|---|---|---|---|---|---|---|---|---|---|---|
| my5651_rel.cz11a_bee | 95.642 | 4.120 | 0.227 | 0.011 | nonzero | 0.031 | |||||
| my5744_rel.cz11a_bee | 72.162 | 27.685 | 0.147 | 0.007 | 0.014 | ||||||
| my8028_rel.cz11a_bee | 35.740 | 63.948 | 0.295 | 0.016 | 0.001 | 0.047 | |||||
| my8032_rel.cz11a_bee | 17.750 | 81.875 | 0.356 | 0.018 | 0.001 | 0.041 | |||||
| my8036_rel.cz11a_bee | 55.010 | 44.904 | 0.084 | 0.002 | nonzero | 0.048 | |||||
| my8037_rel.cz11a_bee | 60.339 | 39.572 | 0.086 | 0.002 | nonzero | 0.060 |
Insert response time histogram: each cell has the percentage of responses that take <= the time in the header and max is the max response time in seconds. For max values in the top 25% of the range have a red background and in the bottom 25% of the range have a green background. The red background is not used when the min value is within 80% of the max value.
| dbms | 256us | 1ms | 4ms | 16ms | 64ms | 256ms | 1s | 4s | 16s | gt | max |
|---|---|---|---|---|---|---|---|---|---|---|---|
| my5651_rel.cz11a_bee | 46.222 | 53.139 | 0.639 | 0.102 | |||||||
| my5744_rel.cz11a_bee | 63.694 | 36.306 | 0.027 | ||||||||
| my8028_rel.cz11a_bee | 68.750 | 31.194 | 0.056 | 0.090 | |||||||
| my8032_rel.cz11a_bee | 61.583 | 37.333 | 1.083 | 0.132 | |||||||
| my8036_rel.cz11a_bee | 66.750 | 33.194 | 0.056 | 0.080 | |||||||
| my8037_rel.cz11a_bee | 68.028 | 31.778 | 0.194 | 0.094 |
Delete response time histogram: each cell has the percentage of responses that take <= the time in the header and max is the max response time in seconds. For max values in the top 25% of the range have a red background and in the bottom 25% of the range have a green background. The red background is not used when the min value is within 80% of the max value.
| dbms | 256us | 1ms | 4ms | 16ms | 64ms | 256ms | 1s | 4s | 16s | gt | max |
|---|---|---|---|---|---|---|---|---|---|---|---|
| my5651_rel.cz11a_bee | 14.944 | 63.528 | 21.417 | 0.111 | 0.081 | ||||||
| my5744_rel.cz11a_bee | 99.361 | 0.639 | 0.012 | ||||||||
| my8028_rel.cz11a_bee | 89.361 | 10.639 | 0.014 | ||||||||
| my8032_rel.cz11a_bee | 81.833 | 17.611 | 0.556 | 0.047 | |||||||
| my8036_rel.cz11a_bee | 84.472 | 15.472 | 0.056 | 0.024 | |||||||
| my8037_rel.cz11a_bee | 83.111 | 16.889 | 0.013 |
Performance metrics for the DBMS listed above. Some are normalized by throughput, others are not. Legend for results is here.
ips	qps	rps	rmbps	wps	wmbps	rpq	rkbpq	wpi	wkbpi	csps	cpups	cspq	cpupq	dbgb1	dbgb2	rss	maxop	p50	p99	tag
100	5279	549	8.5	451.5	13.8	0.104	1.654	4.524	141.438	23037	13.4	4.364	203	144.1	159.6	10.5	0.031	5274	3660	my5651_rel.cz11a_bee
100	4022	546	8.5	372.7	11.3	0.136	2.174	3.734	116.106	17563	14.0	4.367	278	144.5	160.0	10.7	0.014	3979	3006	my5744_rel.cz11a_bee
100	3212	2219	34.7	2985.1	75.2	0.691	11.052	29.911	771.455	31794	16.1	9.899	401	167.3	185.9	10.7	0.047	3196	1710	my8028_rel.cz11a_bee
100	2928	2272	35.5	3068.1	77.7	0.776	12.414	30.743	796.804	31479	16.5	10.750	451	167.1	186.7	10.7	0.041	2956	1486	my8032_rel.cz11a_bee
100	3590	2169	33.9	3000.2	76.0	0.604	9.665	30.063	779.373	33138	16.9	9.229	377	167.0	186.3	10.8	0.048	3596	2479	my8036_rel.cz11a_bee
100	3697	2179	34.1	3033.2	76.8	0.590	9.432	30.393	787.879	34042	17.1	9.208	370	167.0	186.5	10.8	0.060	3692	2605	my8037_rel.cz11a_bee
qp100.L2
qp100.L2: point queries with 100 insert/s per client. Graphs for performance per 1-second interval are here.
Average throughput:
Query response time histogram: each cell has the percentage of responses that take <= the time in the header and max is the max response time in seconds. For max values in the top 25% of the range have a red background and in the bottom 25% of the range have a green background. The red background is not used when the min value is within 80% of the max value.
| dbms | 256us | 1ms | 4ms | 16ms | 64ms | 256ms | 1s | 4s | 16s | gt | max |
|---|---|---|---|---|---|---|---|---|---|---|---|
| my5651_rel.cz11a_bee | 0.858 | 98.800 | 0.341 | 0.001 | 0.038 | ||||||
| my5744_rel.cz11a_bee | 0.408 | 99.382 | 0.210 | 0.001 | 0.039 | ||||||
| my8028_rel.cz11a_bee | 0.181 | 99.646 | 0.172 | 0.001 | 0.039 | ||||||
| my8032_rel.cz11a_bee | 0.106 | 99.714 | 0.179 | 0.001 | 0.041 | ||||||
| my8036_rel.cz11a_bee | 0.141 | 99.682 | 0.176 | 0.001 | 0.042 | ||||||
| my8037_rel.cz11a_bee | 0.133 | 99.691 | 0.175 | 0.001 | 0.041 |
Insert response time histogram: each cell has the percentage of responses that take <= the time in the header and max is the max response time in seconds. For max values in the top 25% of the range have a red background and in the bottom 25% of the range have a green background. The red background is not used when the min value is within 80% of the max value.
| dbms | 256us | 1ms | 4ms | 16ms | 64ms | 256ms | 1s | 4s | 16s | gt | max |
|---|---|---|---|---|---|---|---|---|---|---|---|
| my5651_rel.cz11a_bee | 29.750 | 70.167 | 0.083 | 0.071 | |||||||
| my5744_rel.cz11a_bee | 88.250 | 11.750 | 0.048 | ||||||||
| my8028_rel.cz11a_bee | 93.528 | 6.472 | 0.030 | ||||||||
| my8032_rel.cz11a_bee | 90.361 | 9.639 | 0.026 | ||||||||
| my8036_rel.cz11a_bee | 89.250 | 10.750 | 0.030 | ||||||||
| my8037_rel.cz11a_bee | 90.306 | 9.694 | 0.029 |
Delete response time histogram: each cell has the percentage of responses that take <= the time in the header and max is the max response time in seconds. For max values in the top 25% of the range have a red background and in the bottom 25% of the range have a green background. The red background is not used when the min value is within 80% of the max value.
| dbms | 256us | 1ms | 4ms | 16ms | 64ms | 256ms | 1s | 4s | 16s | gt | max |
|---|---|---|---|---|---|---|---|---|---|---|---|
| my5651_rel.cz11a_bee | 59.222 | 29.278 | 11.500 | 0.045 | |||||||
| my5744_rel.cz11a_bee | 98.944 | 1.056 | 0.013 | ||||||||
| my8028_rel.cz11a_bee | 98.778 | 1.222 | 0.014 | ||||||||
| my8032_rel.cz11a_bee | 98.167 | 1.806 | 0.028 | 0.022 | |||||||
| my8036_rel.cz11a_bee | 98.444 | 1.528 | 0.028 | 0.021 | |||||||
| my8037_rel.cz11a_bee | 98.472 | 1.500 | 0.028 | 0.018 |
Performance metrics for the DBMS listed above. Some are normalized by throughput, others are not. Legend for results is here.
ips	qps	rps	rmbps	wps	wmbps	rpq	rkbpq	wpi	wkbpi	csps	cpups	cspq	cpupq	dbgb1	dbgb2	rss	maxop	p50	p99	tag
100	666	6388	99.8	798.6	24.0	9.591	153.385	8.002	246.480	17593	5.2	26.416	625	144.1	159.6	10.5	0.038	671	575	my5651_rel.cz11a_bee
100	646	6230	97.3	824.9	24.2	9.644	154.299	8.266	247.840	17298	5.3	26.777	656	144.5	160.0	10.7	0.039	655	591	my5744_rel.cz11a_bee
100	627	6073	94.9	961.1	24.1	9.689	155.023	9.630	247.477	18142	5.4	28.944	689	167.3	185.9	10.7	0.039	639	575	my8028_rel.cz11a_bee
100	612	5957	93.1	954.6	24.1	9.732	155.714	9.565	247.471	18001	5.7	29.408	745	167.1	186.7	10.7	0.041	623	559	my8032_rel.cz11a_bee
100	621	6018	94.0	961.5	24.3	9.696	155.136	9.634	249.303	18137	5.7	29.221	735	167.0	186.3	10.8	0.042	623	575	my8036_rel.cz11a_bee
100	618	6004	93.8	952.6	24.1	9.707	155.306	9.545	247.035	18352	5.8	29.671	750	167.0	186.5	10.8	0.041	623	575	my8037_rel.cz11a_bee
qr500.L3
qr500.L3: range queries with 500 insert/s per client. Graphs for performance per 1-second interval are here.
Average throughput:
Query response time histogram: each cell has the percentage of responses that take <= the time in the header and max is the max response time in seconds. For max values in the top 25% of the range have a red background and in the bottom 25% of the range have a green background. The red background is not used when the min value is within 80% of the max value.
| dbms | 256us | 1ms | 4ms | 16ms | 64ms | 256ms | 1s | 4s | 16s | gt | max |
|---|---|---|---|---|---|---|---|---|---|---|---|
| my5651_rel.cz11a_bee | 93.186 | 6.123 | 0.668 | 0.022 | nonzero | 0.026 | |||||
| my5744_rel.cz11a_bee | 76.102 | 23.721 | 0.159 | 0.018 | 0.010 | ||||||
| my8028_rel.cz11a_bee | 42.441 | 57.338 | 0.202 | 0.019 | nonzero | 0.048 | |||||
| my8032_rel.cz11a_bee | 27.064 | 72.696 | 0.220 | 0.020 | 0.011 | ||||||
| my8036_rel.cz11a_bee | 63.789 | 36.202 | 0.008 | 0.001 | 0.010 | ||||||
| my8037_rel.cz11a_bee | 62.251 | 37.740 | 0.008 | 0.001 | 0.014 |
Insert response time histogram: each cell has the percentage of responses that take <= the time in the header and max is the max response time in seconds. For max values in the top 25% of the range have a red background and in the bottom 25% of the range have a green background. The red background is not used when the min value is within 80% of the max value.
| dbms | 256us | 1ms | 4ms | 16ms | 64ms | 256ms | 1s | 4s | 16s | gt | max |
|---|---|---|---|---|---|---|---|---|---|---|---|
| my5651_rel.cz11a_bee | 49.444 | 50.478 | 0.078 | 0.108 | |||||||
| my5744_rel.cz11a_bee | 94.200 | 5.800 | 0.031 | ||||||||
| my8028_rel.cz11a_bee | 92.489 | 7.511 | 0.036 | ||||||||
| my8032_rel.cz11a_bee | 91.228 | 8.772 | 0.047 | ||||||||
| my8036_rel.cz11a_bee | 90.283 | 9.717 | 0.037 | ||||||||
| my8037_rel.cz11a_bee | 90.239 | 9.756 | 0.006 | 0.305 |
Delete response time histogram: each cell has the percentage of responses that take <= the time in the header and max is the max response time in seconds. For max values in the top 25% of the range have a red background and in the bottom 25% of the range have a green background. The red background is not used when the min value is within 80% of the max value.
| dbms | 256us | 1ms | 4ms | 16ms | 64ms | 256ms | 1s | 4s | 16s | gt | max |
|---|---|---|---|---|---|---|---|---|---|---|---|
| my5651_rel.cz11a_bee | 12.117 | 70.044 | 17.833 | 0.006 | 0.069 | ||||||
| my5744_rel.cz11a_bee | 99.156 | 0.839 | 0.006 | 0.019 | |||||||
| my8028_rel.cz11a_bee | 98.717 | 1.283 | 0.016 | ||||||||
| my8032_rel.cz11a_bee | 95.522 | 4.461 | 0.017 | 0.017 | |||||||
| my8036_rel.cz11a_bee | 97.483 | 2.500 | 0.017 | 0.023 | |||||||
| my8037_rel.cz11a_bee | 97.028 | 2.956 | 0.011 | 0.006 | 0.279 |
Performance metrics for the DBMS listed above. Some are normalized by throughput, others are not. Legend for results is here.
ips	qps	rps	rmbps	wps	wmbps	rpq	rkbpq	wpi	wkbpi	csps	cpups	cspq	cpupq	dbgb1	dbgb2	rss	maxop	p50	p99	tag
499	5022	2572	40.0	2528.7	77.4	0.512	8.151	5.066	158.736	33669	17.9	6.705	285	144.1	159.6	10.5	0.026	5034	2909	my5651_rel.cz11a_bee
499	4178	2549	39.8	2547.9	78.2	0.610	9.763	5.105	160.462	29459	17.2	7.051	329	144.5	160.0	10.7	0.010	4155	2861	my5744_rel.cz11a_bee
499	3330	2595	40.6	3175.4	80.8	0.779	12.470	6.362	165.771	31698	17.2	9.519	413	167.3	185.9	10.7	0.048	3324	2222	my8028_rel.cz11a_bee
499	3102	2595	40.5	3179.9	81.8	0.837	13.384	6.371	167.732	31117	17.4	10.030	449	167.1	186.7	10.7	0.011	3100	2046	my8032_rel.cz11a_bee
499	3848	2541	39.7	3174.4	81.6	0.660	10.567	6.360	167.451	33723	17.9	8.764	372	167.0	186.3	10.8	0.010	3836	3404	my8036_rel.cz11a_bee
499	3808	2540	39.7	3172.7	81.6	0.667	10.676	6.361	167.452	33672	18.0	8.843	378	167.0	186.5	10.8	0.014	3788	3420	my8037_rel.cz11a_bee
qp500.L4
qp500.L4: point queries with 500 insert/s per client. Graphs for performance per 1-second interval are here.
Average throughput:
Query response time histogram: each cell has the percentage of responses that take <= the time in the header and max is the max response time in seconds. For max values in the top 25% of the range have a red background and in the bottom 25% of the range have a green background. The red background is not used when the min value is within 80% of the max value.
| dbms | 256us | 1ms | 4ms | 16ms | 64ms | 256ms | 1s | 4s | 16s | gt | max |
|---|---|---|---|---|---|---|---|---|---|---|---|
| my5651_rel.cz11a_bee | 0.055 | 97.898 | 2.042 | 0.005 | 0.041 | ||||||
| my5744_rel.cz11a_bee | 0.037 | 98.095 | 1.862 | 0.006 | 0.043 | ||||||
| my8028_rel.cz11a_bee | 0.013 | 99.027 | 0.935 | 0.025 | 0.050 | ||||||
| my8032_rel.cz11a_bee | 0.007 | 98.919 | 1.051 | 0.023 | 0.048 | ||||||
| my8036_rel.cz11a_bee | 0.008 | 98.966 | 0.999 | 0.027 | 0.048 | ||||||
| my8037_rel.cz11a_bee | 0.009 | 98.987 | 0.974 | 0.030 | 0.049 |
Insert response time histogram: each cell has the percentage of responses that take <= the time in the header and max is the max response time in seconds. For max values in the top 25% of the range have a red background and in the bottom 25% of the range have a green background. The red background is not used when the min value is within 80% of the max value.
| dbms | 256us | 1ms | 4ms | 16ms | 64ms | 256ms | 1s | 4s | 16s | gt | max |
|---|---|---|---|---|---|---|---|---|---|---|---|
| my5651_rel.cz11a_bee | 50.028 | 45.533 | 4.439 | 0.127 | |||||||
| my5744_rel.cz11a_bee | 88.922 | 11.078 | 0.063 | ||||||||
| my8028_rel.cz11a_bee | 95.689 | 4.283 | 0.028 | 0.071 | |||||||
| my8032_rel.cz11a_bee | 91.844 | 8.106 | 0.050 | 0.071 | |||||||
| my8036_rel.cz11a_bee | 92.606 | 7.339 | 0.056 | 0.079 | |||||||
| my8037_rel.cz11a_bee | 94.522 | 5.461 | 0.017 | 0.077 |
Delete response time histogram: each cell has the percentage of responses that take <= the time in the header and max is the max response time in seconds. For max values in the top 25% of the range have a red background and in the bottom 25% of the range have a green background. The red background is not used when the min value is within 80% of the max value.
| dbms | 256us | 1ms | 4ms | 16ms | 64ms | 256ms | 1s | 4s | 16s | gt | max |
|---|---|---|---|---|---|---|---|---|---|---|---|
| my5651_rel.cz11a_bee | 19.628 | 50.739 | 29.511 | 0.122 | 0.092 | ||||||
| my5744_rel.cz11a_bee | 98.211 | 1.783 | 0.006 | 0.019 | |||||||
| my8028_rel.cz11a_bee | 98.261 | 1.728 | 0.011 | 0.018 | |||||||
| my8032_rel.cz11a_bee | 92.544 | 7.378 | 0.078 | 0.040 | |||||||
| my8036_rel.cz11a_bee | 95.972 | 3.933 | 0.094 | 0.030 | |||||||
| my8037_rel.cz11a_bee | 95.911 | 4.033 | 0.056 | 0.029 |
Performance metrics for the DBMS listed above. Some are normalized by throughput, others are not. Legend for results is here.
ips	qps	rps	rmbps	wps	wmbps	rpq	rkbpq	wpi	wkbpi	csps	cpups	cspq	cpupq	dbgb1	dbgb2	rss	maxop	p50	p99	tag
499	559	7897	123.2	2989.2	89.9	14.125	225.605	5.989	184.441	27856	10.4	49.823	1488	144.1	159.6	10.5	0.041	559	496	my5651_rel.cz11a_bee
499	578	8056	125.9	3082.1	89.8	13.939	223.016	6.175	184.192	28371	8.7	49.085	1204	144.5	160.0	10.7	0.043	575	527	my5744_rel.cz11a_bee
499	574	8025	125.4	3601.2	91.4	13.968	223.494	7.215	187.470	33350	9.3	58.050	1295	167.3	185.9	10.7	0.050	575	543	my8028_rel.cz11a_bee
499	562	7915	123.7	3618.8	92.6	14.071	225.131	7.251	189.924	33315	10.2	59.226	1451	167.1	186.7	10.7	0.048	559	543	my8032_rel.cz11a_bee
499	566	7947	124.2	3614.9	92.5	14.035	224.560	7.243	189.755	33094	10.0	58.449	1413	167.0	186.3	10.8	0.048	560	543	my8036_rel.cz11a_bee
499	567	7956	124.3	3615.4	92.5	14.025	224.392	7.244	189.804	33165	10.1	58.460	1424	167.0	186.5	10.8	0.049	575	543	my8037_rel.cz11a_bee
qr1000.L5
qr1000.L5: range queries with 1000 insert/s per client. Graphs for performance per 1-second interval are here.
Average throughput:
Query response time histogram: each cell has the percentage of responses that take <= the time in the header and max is the max response time in seconds. For max values in the top 25% of the range have a red background and in the bottom 25% of the range have a green background. The red background is not used when the min value is within 80% of the max value.
| dbms | 256us | 1ms | 4ms | 16ms | 64ms | 256ms | 1s | 4s | 16s | gt | max |
|---|---|---|---|---|---|---|---|---|---|---|---|
| my5651_rel.cz11a_bee | 89.007 | 9.570 | 1.367 | 0.056 | nonzero | 0.039 | |||||
| my5744_rel.cz11a_bee | 79.022 | 20.785 | 0.173 | 0.020 | nonzero | 0.026 | |||||
| my8028_rel.cz11a_bee | 47.978 | 51.785 | 0.214 | 0.023 | nonzero | 0.041 | |||||
| my8032_rel.cz11a_bee | 36.570 | 63.175 | 0.234 | 0.021 | nonzero | 0.051 | |||||
| my8036_rel.cz11a_bee | 67.766 | 32.220 | 0.013 | 0.001 | nonzero | 0.024 | |||||
| my8037_rel.cz11a_bee | 66.595 | 33.387 | 0.017 | 0.001 | nonzero | 0.031 |
Insert response time histogram: each cell has the percentage of responses that take <= the time in the header and max is the max response time in seconds. For max values in the top 25% of the range have a red background and in the bottom 25% of the range have a green background. The red background is not used when the min value is within 80% of the max value.
| dbms | 256us | 1ms | 4ms | 16ms | 64ms | 256ms | 1s | 4s | 16s | gt | max |
|---|---|---|---|---|---|---|---|---|---|---|---|
| my5651_rel.cz11a_bee | 51.219 | 48.322 | 0.458 | 0.144 | |||||||
| my5744_rel.cz11a_bee | 96.647 | 3.353 | 0.045 | ||||||||
| my8028_rel.cz11a_bee | 94.194 | 5.803 | 0.003 | 0.071 | |||||||
| my8032_rel.cz11a_bee | 95.508 | 4.489 | 0.003 | 0.113 | |||||||
| my8036_rel.cz11a_bee | 94.342 | 5.658 | 0.032 | ||||||||
| my8037_rel.cz11a_bee | 93.919 | 6.078 | 0.003 | 0.211 |
Delete response time histogram: each cell has the percentage of responses that take <= the time in the header and max is the max response time in seconds. For max values in the top 25% of the range have a red background and in the bottom 25% of the range have a green background. The red background is not used when the min value is within 80% of the max value.
| dbms | 256us | 1ms | 4ms | 16ms | 64ms | 256ms | 1s | 4s | 16s | gt | max |
|---|---|---|---|---|---|---|---|---|---|---|---|
| my5651_rel.cz11a_bee | 25.233 | 52.286 | 22.461 | 0.019 | 0.102 | ||||||
| my5744_rel.cz11a_bee | 98.308 | 1.686 | 0.006 | 0.018 | |||||||
| my8028_rel.cz11a_bee | 98.794 | 1.206 | 0.014 | ||||||||
| my8032_rel.cz11a_bee | 94.619 | 5.364 | 0.014 | 0.003 | 0.104 | ||||||
| my8036_rel.cz11a_bee | 97.342 | 2.644 | 0.014 | 0.018 | |||||||
| my8037_rel.cz11a_bee | 96.517 | 3.464 | 0.017 | 0.003 | 0.211 |
Performance metrics for the DBMS listed above. Some are normalized by throughput, others are not. Legend for results is here.
ips	qps	rps	rmbps	wps	wmbps	rpq	rkbpq	wpi	wkbpi	csps	cpups	cspq	cpupq	dbgb1	dbgb2	rss	maxop	p50	p99	tag
999	4525	5001	77.7	5587.7	164.5	1.105	17.588	5.594	168.636	47700	23.1	10.542	408	144.1	159.6	10.5	0.039	4555	2175	my5651_rel.cz11a_bee
998	4295	4961	77.5	5411.8	165.3	1.155	18.480	5.421	169.597	44593	21.4	10.382	399	144.5	160.0	10.7	0.026	4299	2621	my5744_rel.cz11a_bee
998	3422	4922	76.9	6450.6	163.8	1.438	23.015	6.462	168.033	50124	21.6	14.648	505	167.3	185.9	10.7	0.041	3436	2078	my8028_rel.cz11a_bee
999	3212	4924	76.9	6455.3	165.3	1.533	24.524	6.463	169.504	50025	22.4	15.572	558	167.1	186.7	10.7	0.051	3212	1919	my8032_rel.cz11a_bee
998	3983	4840	75.6	6449.7	165.2	1.215	19.444	6.461	169.449	52690	22.5	13.230	452	167.0	186.3	10.8	0.024	3980	3486	my8036_rel.cz11a_bee
998	3943	4837	75.6	6446.1	165.1	1.227	19.627	6.457	169.369	52494	22.6	13.312	458	167.0	186.5	10.8	0.031	3933	3520	my8037_rel.cz11a_bee
qp1000.L6
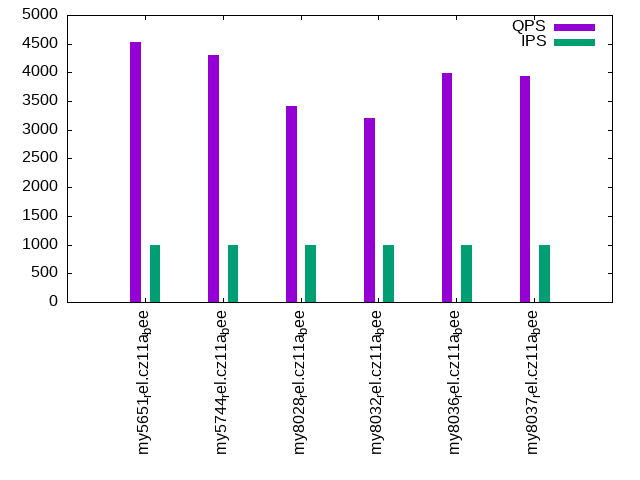
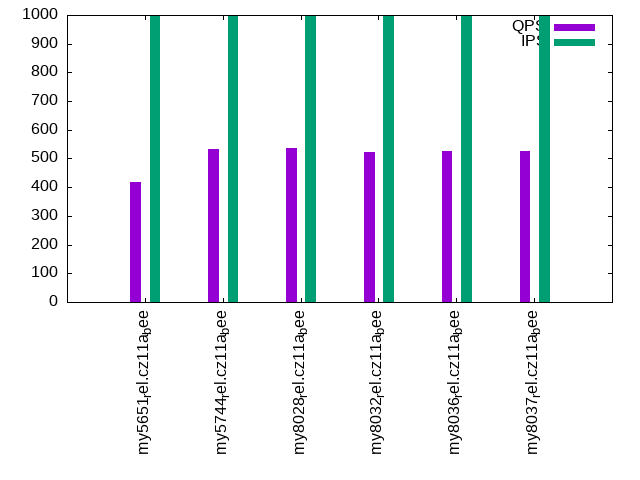
qp1000.L6: point queries with 1000 insert/s per client. Graphs for performance per 1-second interval are here.
Average throughput:
Query response time histogram: each cell has the percentage of responses that take <= the time in the header and max is the max response time in seconds. For max values in the top 25% of the range have a red background and in the bottom 25% of the range have a green background. The red background is not used when the min value is within 80% of the max value.
| dbms | 256us | 1ms | 4ms | 16ms | 64ms | 256ms | 1s | 4s | 16s | gt | max |
|---|---|---|---|---|---|---|---|---|---|---|---|
| my5651_rel.cz11a_bee | 0.003 | 93.746 | 6.235 | 0.015 | 0.043 | ||||||
| my5744_rel.cz11a_bee | 0.006 | 95.808 | 4.174 | 0.011 | 0.055 | ||||||
| my8028_rel.cz11a_bee | 0.002 | 98.026 | 1.886 | 0.086 | 0.054 | ||||||
| my8032_rel.cz11a_bee | 0.001 | 97.904 | 2.006 | 0.090 | 0.052 | ||||||
| my8036_rel.cz11a_bee | 0.001 | 97.967 | 1.936 | 0.096 | 0.054 | ||||||
| my8037_rel.cz11a_bee | 0.001 | 97.991 | 1.907 | 0.101 | 0.052 |
Insert response time histogram: each cell has the percentage of responses that take <= the time in the header and max is the max response time in seconds. For max values in the top 25% of the range have a red background and in the bottom 25% of the range have a green background. The red background is not used when the min value is within 80% of the max value.
| dbms | 256us | 1ms | 4ms | 16ms | 64ms | 256ms | 1s | 4s | 16s | gt | max |
|---|---|---|---|---|---|---|---|---|---|---|---|
| my5651_rel.cz11a_bee | 29.072 | 66.267 | 4.661 | 0.167 | |||||||
| my5744_rel.cz11a_bee | 88.247 | 11.728 | 0.025 | 0.084 | |||||||
| my8028_rel.cz11a_bee | 89.325 | 10.578 | 0.097 | 0.094 | |||||||
| my8032_rel.cz11a_bee | 91.372 | 8.575 | 0.053 | 0.110 | |||||||
| my8036_rel.cz11a_bee | 90.578 | 9.369 | 0.053 | 0.087 | |||||||
| my8037_rel.cz11a_bee | 91.122 | 8.803 | 0.075 | 0.091 |
Delete response time histogram: each cell has the percentage of responses that take <= the time in the header and max is the max response time in seconds. For max values in the top 25% of the range have a red background and in the bottom 25% of the range have a green background. The red background is not used when the min value is within 80% of the max value.
| dbms | 256us | 1ms | 4ms | 16ms | 64ms | 256ms | 1s | 4s | 16s | gt | max |
|---|---|---|---|---|---|---|---|---|---|---|---|
| my5651_rel.cz11a_bee | 23.858 | 50.914 | 24.961 | 0.267 | 0.112 | ||||||
| my5744_rel.cz11a_bee | 97.739 | 2.250 | 0.011 | 0.025 | |||||||
| my8028_rel.cz11a_bee | 96.750 | 3.153 | 0.097 | 0.033 | |||||||
| my8032_rel.cz11a_bee | 91.758 | 8.161 | 0.081 | 0.040 | |||||||
| my8036_rel.cz11a_bee | 95.425 | 4.506 | 0.069 | 0.045 | |||||||
| my8037_rel.cz11a_bee | 94.547 | 5.333 | 0.119 | 0.046 |
Performance metrics for the DBMS listed above. Some are normalized by throughput, others are not. Legend for results is here.
ips	qps	rps	rmbps	wps	wmbps	rpq	rkbpq	wpi	wkbpi	csps	cpups	cspq	cpupq	dbgb1	dbgb2	rss	maxop	p50	p99	tag
999	417	9164	142.8	7445.7	168.1	21.976	350.591	7.455	172.331	41045	16.4	98.429	3146	144.1	159.6	10.5	0.043	416	384	my5651_rel.cz11a_bee
999	533	10250	160.2	5585.4	169.7	19.241	307.858	5.592	173.966	41639	13.3	78.165	1997	144.5	160.0	10.7	0.055	527	495	my5744_rel.cz11a_bee
998	535	10199	159.4	6629.1	168.1	19.067	305.068	6.640	172.401	52640	14.0	98.412	2094	167.3	185.9	10.7	0.054	528	496	my8028_rel.cz11a_bee
998	522	10078	157.5	6676.4	170.6	19.291	308.661	6.688	174.954	52558	14.8	100.609	2267	167.1	186.7	10.7	0.052	527	495	my8032_rel.cz11a_bee
998	525	10104	157.9	6670.2	170.4	19.230	307.687	6.682	174.784	52207	14.6	99.366	2223	167.0	186.3	10.8	0.054	527	495	my8036_rel.cz11a_bee
998	526	10115	158.0	6671.4	170.4	19.211	307.378	6.683	174.821	52339	14.7	99.408	2234	167.0	186.5	10.8	0.052	527	495	my8037_rel.cz11a_bee
l.i0
l.i0: load without secondary indexes
Performance metrics for all DBMS, not just the ones listed above. Some are normalized by throughput, others are not. Legend for results is here.
ips	qps	rps	rmbps	wps	wmbps	rpq	rkbpq	wpi	wkbpi	csps	cpups	cspq	cpupq	dbgb1	dbgb2	rss	maxop	p50	p99	tag
97347	0	852	3.3	485.1	35.1	0.009	0.035	0.005	0.369	12201	23.0	0.125	19	52.6	68.1	10.7	0.107	97686	90096	my5651_rel.cz11a_bee
80726	0	0	0.0	412.3	29.2	0.000	0.000	0.005	0.371	8801	21.6	0.109	21	52.6	68.1	10.9	0.096	80989	73597	my5744_rel.cz11a_bee
62276	0	0	0.0	377.8	23.3	0.000	0.000	0.006	0.384	7230	21.4	0.116	27	52.4	68.0	11.1	0.126	62428	57135	my8028_rel.cz11a_bee
54956	0	0	0.0	338.0	20.9	0.000	0.000	0.006	0.389	6869	20.9	0.125	30	52.4	68.0	11.1	0.104	55037	51440	my8032_rel.cz11a_bee
55436	0	0	0.0	338.1	21.0	0.000	0.000	0.006	0.388	6642	20.6	0.120	30	52.4	68.0	11.1	0.103	55536	51841	my8036_rel.cz11a_bee
54021	0	0	0.0	329.2	20.4	0.000	0.000	0.006	0.388	6480	20.4	0.120	30	52.4	68.0	11.1	0.401	54040	50543	my8037_rel.cz11a_bee
l.x
l.x: create secondary indexes
Performance metrics for all DBMS, not just the ones listed above. Some are normalized by throughput, others are not. Legend for results is here.
ips	qps	rps	rmbps	wps	wmbps	rpq	rkbpq	wpi	wkbpi	csps	cpups	cspq	cpupq	dbgb1	dbgb2	rss	maxop	p50	p99	tag
83647	0	555	84.5	707.4	107.2	0.007	1.035	0.008	1.312	1892	11.3	0.023	11	111.4	126.9	10.8	0.002	NA	NA	my5651_rel.cz11a_bee
109589	0	685	110.1	967.9	130.6	0.006	1.029	0.009	1.221	6268	12.0	0.057	9	121.1	136.7	11.0	0.002	NA	NA	my5744_rel.cz11a_bee
113701	0	1908	180.9	2322.7	162.7	0.017	1.629	0.020	1.465	8986	44.0	0.079	31	120.7	136.3	11.2	0.004	NA	NA	my8028_rel.cz11a_bee
105848	0	1776	168.4	2203.0	151.4	0.017	1.629	0.021	1.464	8770	44.1	0.083	33	120.7	136.3	11.2	0.004	NA	NA	my8032_rel.cz11a_bee
104072	0	1746	165.6	2124.8	148.9	0.017	1.629	0.020	1.465	8548	44.1	0.082	34	120.7	136.3	11.2	0.004	NA	NA	my8036_rel.cz11a_bee
106724	0	1790	169.7	2177.8	152.7	0.017	1.628	0.020	1.465	8627	43.7	0.081	33	120.7	136.3	11.2	0.004	NA	NA	my8037_rel.cz11a_bee
l.i1
l.i1: continue load after secondary indexes created with 50 inserts per transaction
Performance metrics for all DBMS, not just the ones listed above. Some are normalized by throughput, others are not. Legend for results is here.
ips	qps	rps	rmbps	wps	wmbps	rpq	rkbpq	wpi	wkbpi	csps	cpups	cspq	cpupq	dbgb1	dbgb2	rss	maxop	p50	p99	tag
1442	0	7713	119.9	11189.6	272.6	5.348	85.122	7.758	193.564	49122	20.0	34.058	1109	144.1	159.6	10.5	0.791	1498	849	my5651_rel.cz11a_bee
2530	0	13399	209.4	15414.5	478.0	5.295	84.721	6.091	193.437	82503	29.5	32.603	933	144.5	160.0	10.7	0.255	2647	949	my5744_rel.cz11a_bee
3909	0	8197	128.1	12542.1	329.1	2.097	33.551	3.209	86.217	75924	32.2	19.423	659	167.3	187.4	10.7	0.244	4245	50	my8028_rel.cz11a_bee
3528	0	7783	121.6	11868.1	316.0	2.206	35.297	3.364	91.710	72207	33.1	20.467	751	167.1	186.7	10.8	0.403	3848	0	my8032_rel.cz11a_bee
3576	0	7850	122.7	11981.3	319.0	2.195	35.119	3.350	91.342	71548	33.4	20.005	747	167.0	186.3	10.8	0.427	3946	0	my8036_rel.cz11a_bee
3559	0	7870	123.0	11985.4	319.3	2.211	35.379	3.367	91.863	71691	33.4	20.142	751	167.0	186.5	10.8	0.433	3899	0	my8037_rel.cz11a_bee
l.i2
l.i2: continue load after secondary indexes created with 5 inserts per transaction
Performance metrics for all DBMS, not just the ones listed above. Some are normalized by throughput, others are not. Legend for results is here.
ips	qps	rps	rmbps	wps	wmbps	rpq	rkbpq	wpi	wkbpi	csps	cpups	cspq	cpupq	dbgb1	dbgb2	rss	maxop	p50	p99	tag
1513	0	7842	117.7	10592.5	256.8	5.183	79.683	7.001	173.814	55631	27.2	36.769	1438	144.1	159.6	10.5	0.084	1528	1254	my5651_rel.cz11a_bee
2444	0	12026	187.9	13586.2	417.3	4.921	78.739	5.560	174.861	82026	34.2	33.566	1120	144.5	160.0	10.7	0.078	2427	2038	my5744_rel.cz11a_bee
1111	0	13363	208.8	17944.4	454.1	12.026	192.412	16.149	418.509	91698	36.5	82.522	2628	167.3	185.9	10.8	0.212	554	0	my8028_rel.cz11a_bee
1061	0	12876	201.2	17318.1	439.5	12.139	194.231	16.327	424.299	87266	37.5	82.272	2828	167.1	186.7	10.8	0.187	564	0	my8032_rel.cz11a_bee
1074	0	12966	202.6	17459.6	442.4	12.072	193.150	16.255	421.783	86142	38.1	80.199	2838	167.0	186.3	10.8	0.125	565	0	my8036_rel.cz11a_bee
1076	0	12990	203.0	17462.5	443.5	12.073	193.174	16.231	422.091	86625	38.1	80.514	2833	167.0	186.5	10.8	0.562	564	0	my8037_rel.cz11a_bee
qr100.L1
qr100.L1: range queries with 100 insert/s per client
Performance metrics for all DBMS, not just the ones listed above. Some are normalized by throughput, others are not. Legend for results is here.
ips	qps	rps	rmbps	wps	wmbps	rpq	rkbpq	wpi	wkbpi	csps	cpups	cspq	cpupq	dbgb1	dbgb2	rss	maxop	p50	p99	tag
100	5279	549	8.5	451.5	13.8	0.104	1.654	4.524	141.438	23037	13.4	4.364	203	144.1	159.6	10.5	0.031	5274	3660	my5651_rel.cz11a_bee
100	4022	546	8.5	372.7	11.3	0.136	2.174	3.734	116.106	17563	14.0	4.367	278	144.5	160.0	10.7	0.014	3979	3006	my5744_rel.cz11a_bee
100	3212	2219	34.7	2985.1	75.2	0.691	11.052	29.911	771.455	31794	16.1	9.899	401	167.3	185.9	10.7	0.047	3196	1710	my8028_rel.cz11a_bee
100	2928	2272	35.5	3068.1	77.7	0.776	12.414	30.743	796.804	31479	16.5	10.750	451	167.1	186.7	10.7	0.041	2956	1486	my8032_rel.cz11a_bee
100	3590	2169	33.9	3000.2	76.0	0.604	9.665	30.063	779.373	33138	16.9	9.229	377	167.0	186.3	10.8	0.048	3596	2479	my8036_rel.cz11a_bee
100	3697	2179	34.1	3033.2	76.8	0.590	9.432	30.393	787.879	34042	17.1	9.208	370	167.0	186.5	10.8	0.060	3692	2605	my8037_rel.cz11a_bee
qp100.L2
qp100.L2: point queries with 100 insert/s per client
Performance metrics for all DBMS, not just the ones listed above. Some are normalized by throughput, others are not. Legend for results is here.
ips	qps	rps	rmbps	wps	wmbps	rpq	rkbpq	wpi	wkbpi	csps	cpups	cspq	cpupq	dbgb1	dbgb2	rss	maxop	p50	p99	tag
100	666	6388	99.8	798.6	24.0	9.591	153.385	8.002	246.480	17593	5.2	26.416	625	144.1	159.6	10.5	0.038	671	575	my5651_rel.cz11a_bee
100	646	6230	97.3	824.9	24.2	9.644	154.299	8.266	247.840	17298	5.3	26.777	656	144.5	160.0	10.7	0.039	655	591	my5744_rel.cz11a_bee
100	627	6073	94.9	961.1	24.1	9.689	155.023	9.630	247.477	18142	5.4	28.944	689	167.3	185.9	10.7	0.039	639	575	my8028_rel.cz11a_bee
100	612	5957	93.1	954.6	24.1	9.732	155.714	9.565	247.471	18001	5.7	29.408	745	167.1	186.7	10.7	0.041	623	559	my8032_rel.cz11a_bee
100	621	6018	94.0	961.5	24.3	9.696	155.136	9.634	249.303	18137	5.7	29.221	735	167.0	186.3	10.8	0.042	623	575	my8036_rel.cz11a_bee
100	618	6004	93.8	952.6	24.1	9.707	155.306	9.545	247.035	18352	5.8	29.671	750	167.0	186.5	10.8	0.041	623	575	my8037_rel.cz11a_bee
qr500.L3
qr500.L3: range queries with 500 insert/s per client
Performance metrics for all DBMS, not just the ones listed above. Some are normalized by throughput, others are not. Legend for results is here.
ips	qps	rps	rmbps	wps	wmbps	rpq	rkbpq	wpi	wkbpi	csps	cpups	cspq	cpupq	dbgb1	dbgb2	rss	maxop	p50	p99	tag
499	5022	2572	40.0	2528.7	77.4	0.512	8.151	5.066	158.736	33669	17.9	6.705	285	144.1	159.6	10.5	0.026	5034	2909	my5651_rel.cz11a_bee
499	4178	2549	39.8	2547.9	78.2	0.610	9.763	5.105	160.462	29459	17.2	7.051	329	144.5	160.0	10.7	0.010	4155	2861	my5744_rel.cz11a_bee
499	3330	2595	40.6	3175.4	80.8	0.779	12.470	6.362	165.771	31698	17.2	9.519	413	167.3	185.9	10.7	0.048	3324	2222	my8028_rel.cz11a_bee
499	3102	2595	40.5	3179.9	81.8	0.837	13.384	6.371	167.732	31117	17.4	10.030	449	167.1	186.7	10.7	0.011	3100	2046	my8032_rel.cz11a_bee
499	3848	2541	39.7	3174.4	81.6	0.660	10.567	6.360	167.451	33723	17.9	8.764	372	167.0	186.3	10.8	0.010	3836	3404	my8036_rel.cz11a_bee
499	3808	2540	39.7	3172.7	81.6	0.667	10.676	6.361	167.452	33672	18.0	8.843	378	167.0	186.5	10.8	0.014	3788	3420	my8037_rel.cz11a_bee
qp500.L4
qp500.L4: point queries with 500 insert/s per client
Performance metrics for all DBMS, not just the ones listed above. Some are normalized by throughput, others are not. Legend for results is here.
ips	qps	rps	rmbps	wps	wmbps	rpq	rkbpq	wpi	wkbpi	csps	cpups	cspq	cpupq	dbgb1	dbgb2	rss	maxop	p50	p99	tag
499	559	7897	123.2	2989.2	89.9	14.125	225.605	5.989	184.441	27856	10.4	49.823	1488	144.1	159.6	10.5	0.041	559	496	my5651_rel.cz11a_bee
499	578	8056	125.9	3082.1	89.8	13.939	223.016	6.175	184.192	28371	8.7	49.085	1204	144.5	160.0	10.7	0.043	575	527	my5744_rel.cz11a_bee
499	574	8025	125.4	3601.2	91.4	13.968	223.494	7.215	187.470	33350	9.3	58.050	1295	167.3	185.9	10.7	0.050	575	543	my8028_rel.cz11a_bee
499	562	7915	123.7	3618.8	92.6	14.071	225.131	7.251	189.924	33315	10.2	59.226	1451	167.1	186.7	10.7	0.048	559	543	my8032_rel.cz11a_bee
499	566	7947	124.2	3614.9	92.5	14.035	224.560	7.243	189.755	33094	10.0	58.449	1413	167.0	186.3	10.8	0.048	560	543	my8036_rel.cz11a_bee
499	567	7956	124.3	3615.4	92.5	14.025	224.392	7.244	189.804	33165	10.1	58.460	1424	167.0	186.5	10.8	0.049	575	543	my8037_rel.cz11a_bee
qr1000.L5
qr1000.L5: range queries with 1000 insert/s per client
Performance metrics for all DBMS, not just the ones listed above. Some are normalized by throughput, others are not. Legend for results is here.
ips	qps	rps	rmbps	wps	wmbps	rpq	rkbpq	wpi	wkbpi	csps	cpups	cspq	cpupq	dbgb1	dbgb2	rss	maxop	p50	p99	tag
999	4525	5001	77.7	5587.7	164.5	1.105	17.588	5.594	168.636	47700	23.1	10.542	408	144.1	159.6	10.5	0.039	4555	2175	my5651_rel.cz11a_bee
998	4295	4961	77.5	5411.8	165.3	1.155	18.480	5.421	169.597	44593	21.4	10.382	399	144.5	160.0	10.7	0.026	4299	2621	my5744_rel.cz11a_bee
998	3422	4922	76.9	6450.6	163.8	1.438	23.015	6.462	168.033	50124	21.6	14.648	505	167.3	185.9	10.7	0.041	3436	2078	my8028_rel.cz11a_bee
999	3212	4924	76.9	6455.3	165.3	1.533	24.524	6.463	169.504	50025	22.4	15.572	558	167.1	186.7	10.7	0.051	3212	1919	my8032_rel.cz11a_bee
998	3983	4840	75.6	6449.7	165.2	1.215	19.444	6.461	169.449	52690	22.5	13.230	452	167.0	186.3	10.8	0.024	3980	3486	my8036_rel.cz11a_bee
998	3943	4837	75.6	6446.1	165.1	1.227	19.627	6.457	169.369	52494	22.6	13.312	458	167.0	186.5	10.8	0.031	3933	3520	my8037_rel.cz11a_bee
qp1000.L6
qp1000.L6: point queries with 1000 insert/s per client
Performance metrics for all DBMS, not just the ones listed above. Some are normalized by throughput, others are not. Legend for results is here.
ips	qps	rps	rmbps	wps	wmbps	rpq	rkbpq	wpi	wkbpi	csps	cpups	cspq	cpupq	dbgb1	dbgb2	rss	maxop	p50	p99	tag
999	417	9164	142.8	7445.7	168.1	21.976	350.591	7.455	172.331	41045	16.4	98.429	3146	144.1	159.6	10.5	0.043	416	384	my5651_rel.cz11a_bee
999	533	10250	160.2	5585.4	169.7	19.241	307.858	5.592	173.966	41639	13.3	78.165	1997	144.5	160.0	10.7	0.055	527	495	my5744_rel.cz11a_bee
998	535	10199	159.4	6629.1	168.1	19.067	305.068	6.640	172.401	52640	14.0	98.412	2094	167.3	185.9	10.7	0.054	528	496	my8028_rel.cz11a_bee
998	522	10078	157.5	6676.4	170.6	19.291	308.661	6.688	174.954	52558	14.8	100.609	2267	167.1	186.7	10.7	0.052	527	495	my8032_rel.cz11a_bee
998	525	10104	157.9	6670.2	170.4	19.230	307.687	6.682	174.784	52207	14.6	99.366	2223	167.0	186.3	10.8	0.054	527	495	my8036_rel.cz11a_bee
998	526	10115	158.0	6671.4	170.4	19.211	307.378	6.683	174.821	52339	14.7	99.408	2234	167.0	186.5	10.8	0.052	527	495	my8037_rel.cz11a_bee
l.i0
- l.i0: load without secondary indexes
- Legend for results is here.
- Each entry lists the percentage of responses that fit in that bucket (slower than max time for previous bucket, faster than min time for next bucket).
Insert response time histogram
256us	1ms	4ms	16ms	64ms	256ms	1s	4s	16s	gt	max	tag
0.000	86.305	13.569	0.122	0.002	0.001	0.000	0.000	0.000	0.000	0.107	my5651_rel.cz11a_bee
0.000	0.191	99.458	0.211	0.138	0.002	0.000	0.000	0.000	0.000	0.096	my5744_rel.cz11a_bee
0.000	0.000	99.471	0.385	0.142	0.002	0.000	0.000	0.000	0.000	0.126	my8028_rel.cz11a_bee
0.000	0.000	99.400	0.458	0.142	0.001	0.000	0.000	0.000	0.000	0.104	my8032_rel.cz11a_bee
0.000	0.000	99.422	0.435	0.142	0.001	0.000	0.000	0.000	0.000	0.103	my8036_rel.cz11a_bee
0.000	0.000	99.411	0.446	0.142	0.001	nonzero	0.000	0.000	0.000	0.401	my8037_rel.cz11a_bee
l.x
- l.x: create secondary indexes
- Legend for results is here.
- Each entry lists the percentage of responses that fit in that bucket (slower than max time for previous bucket, faster than min time for next bucket).
TODO - determine whether there is data for create index response time
l.i1
- l.i1: continue load after secondary indexes created with 50 inserts per transaction
- Legend for results is here.
- Each entry lists the percentage of responses that fit in that bucket (slower than max time for previous bucket, faster than min time for next bucket).
Insert response time histogram
256us	1ms	4ms	16ms	64ms	256ms	1s	4s	16s	gt	max	tag
0.000	0.000	0.000	0.887	93.932	5.181	nonzero	0.000	0.000	0.000	0.791	my5651_rel.cz11a_bee
0.000	0.000	0.000	59.251	39.833	0.915	0.000	0.000	0.000	0.000	0.255	my5744_rel.cz11a_bee
0.000	0.000	0.092	85.573	13.494	0.841	0.000	0.000	0.000	0.000	0.244	my8028_rel.cz11a_bee
0.000	0.000	0.009	83.883	15.230	0.875	0.003	0.000	0.000	0.000	0.403	my8032_rel.cz11a_bee
0.000	0.000	0.018	84.339	14.834	0.804	0.004	0.000	0.000	0.000	0.427	my8036_rel.cz11a_bee
0.000	0.000	0.011	84.186	14.908	0.888	0.006	0.000	0.000	0.000	0.433	my8037_rel.cz11a_bee
Delete response time histogram
256us	1ms	4ms	16ms	64ms	256ms	1s	4s	16s	gt	max	tag
0.000	0.000	85.111	14.557	0.330	0.001	nonzero	0.000	0.000	0.000	0.629	my5651_rel.cz11a_bee
0.000	0.000	97.196	2.552	0.251	0.001	0.000	0.000	0.000	0.000	0.090	my5744_rel.cz11a_bee
0.000	0.000	7.694	89.363	2.630	0.313	0.000	0.000	0.000	0.000	0.234	my8028_rel.cz11a_bee
0.000	0.000	4.174	92.279	3.252	0.292	0.003	0.000	0.000	0.000	0.403	my8032_rel.cz11a_bee
0.000	0.000	5.259	91.372	3.141	0.224	0.004	0.000	0.000	0.000	0.417	my8036_rel.cz11a_bee
0.000	0.000	4.915	91.544	3.207	0.329	0.005	0.000	0.000	0.000	0.431	my8037_rel.cz11a_bee
l.i2
- l.i2: continue load after secondary indexes created with 5 inserts per transaction
- Legend for results is here.
- Each entry lists the percentage of responses that fit in that bucket (slower than max time for previous bucket, faster than min time for next bucket).
Insert response time histogram
256us	1ms	4ms	16ms	64ms	256ms	1s	4s	16s	gt	max	tag
nonzero	5.429	70.010	24.257	0.304	nonzero	0.000	0.000	0.000	0.000	0.084	my5651_rel.cz11a_bee
0.000	12.562	80.173	7.091	0.174	nonzero	0.000	0.000	0.000	0.000	0.078	my5744_rel.cz11a_bee
0.000	7.116	66.314	23.860	2.701	0.010	0.000	0.000	0.000	0.000	0.212	my8028_rel.cz11a_bee
0.000	5.135	68.452	23.720	2.683	0.011	0.000	0.000	0.000	0.000	0.187	my8032_rel.cz11a_bee
0.000	5.926	68.464	23.036	2.565	0.008	0.000	0.000	0.000	0.000	0.125	my8036_rel.cz11a_bee
0.000	5.667	68.304	23.367	2.649	0.012	nonzero	0.000	0.000	0.000	0.562	my8037_rel.cz11a_bee
Delete response time histogram
256us	1ms	4ms	16ms	64ms	256ms	1s	4s	16s	gt	max	tag
nonzero	52.742	44.315	2.907	0.036	nonzero	0.000	0.000	0.000	0.000	0.083	my5651_rel.cz11a_bee
0.000	98.503	1.063	0.425	0.008	nonzero	0.000	0.000	0.000	0.000	0.078	my5744_rel.cz11a_bee
0.000	32.696	44.408	21.588	1.304	0.004	0.000	0.000	0.000	0.000	0.220	my8028_rel.cz11a_bee
0.000	21.040	56.500	21.203	1.252	0.005	0.000	0.000	0.000	0.000	0.197	my8032_rel.cz11a_bee
0.000	24.080	54.262	20.514	1.141	0.003	0.000	0.000	0.000	0.000	0.124	my8036_rel.cz11a_bee
0.000	23.909	53.972	20.894	1.219	0.006	nonzero	0.000	0.000	0.000	0.418	my8037_rel.cz11a_bee
qr100.L1
- qr100.L1: range queries with 100 insert/s per client
- Legend for results is here.
- Each entry lists the percentage of responses that fit in that bucket (slower than max time for previous bucket, faster than min time for next bucket).
Query response time histogram
256us	1ms	4ms	16ms	64ms	256ms	1s	4s	16s	gt	max	tag
95.642	4.120	0.227	0.011	nonzero	0.000	0.000	0.000	0.000	0.000	0.031	my5651_rel.cz11a_bee
72.162	27.685	0.147	0.007	0.000	0.000	0.000	0.000	0.000	0.000	0.014	my5744_rel.cz11a_bee
35.740	63.948	0.295	0.016	0.001	0.000	0.000	0.000	0.000	0.000	0.047	my8028_rel.cz11a_bee
17.750	81.875	0.356	0.018	0.001	0.000	0.000	0.000	0.000	0.000	0.041	my8032_rel.cz11a_bee
55.010	44.904	0.084	0.002	nonzero	0.000	0.000	0.000	0.000	0.000	0.048	my8036_rel.cz11a_bee
60.339	39.572	0.086	0.002	nonzero	0.000	0.000	0.000	0.000	0.000	0.060	my8037_rel.cz11a_bee
Insert response time histogram
256us	1ms	4ms	16ms	64ms	256ms	1s	4s	16s	gt	max	tag
0.000	0.000	0.000	46.222	53.139	0.639	0.000	0.000	0.000	0.000	0.102	my5651_rel.cz11a_bee
0.000	0.000	0.000	63.694	36.306	0.000	0.000	0.000	0.000	0.000	0.027	my5744_rel.cz11a_bee
0.000	0.000	0.000	68.750	31.194	0.056	0.000	0.000	0.000	0.000	0.090	my8028_rel.cz11a_bee
0.000	0.000	0.000	61.583	37.333	1.083	0.000	0.000	0.000	0.000	0.132	my8032_rel.cz11a_bee
0.000	0.000	0.000	66.750	33.194	0.056	0.000	0.000	0.000	0.000	0.080	my8036_rel.cz11a_bee
0.000	0.000	0.000	68.028	31.778	0.194	0.000	0.000	0.000	0.000	0.094	my8037_rel.cz11a_bee
Delete response time histogram
256us	1ms	4ms	16ms	64ms	256ms	1s	4s	16s	gt	max	tag
0.000	0.000	14.944	63.528	21.417	0.111	0.000	0.000	0.000	0.000	0.081	my5651_rel.cz11a_bee
0.000	0.000	99.361	0.639	0.000	0.000	0.000	0.000	0.000	0.000	0.012	my5744_rel.cz11a_bee
0.000	0.000	89.361	10.639	0.000	0.000	0.000	0.000	0.000	0.000	0.014	my8028_rel.cz11a_bee
0.000	0.000	81.833	17.611	0.556	0.000	0.000	0.000	0.000	0.000	0.047	my8032_rel.cz11a_bee
0.000	0.000	84.472	15.472	0.056	0.000	0.000	0.000	0.000	0.000	0.024	my8036_rel.cz11a_bee
0.000	0.000	83.111	16.889	0.000	0.000	0.000	0.000	0.000	0.000	0.013	my8037_rel.cz11a_bee
qp100.L2
- qp100.L2: point queries with 100 insert/s per client
- Legend for results is here.
- Each entry lists the percentage of responses that fit in that bucket (slower than max time for previous bucket, faster than min time for next bucket).
Query response time histogram
256us	1ms	4ms	16ms	64ms	256ms	1s	4s	16s	gt	max	tag
0.000	0.858	98.800	0.341	0.001	0.000	0.000	0.000	0.000	0.000	0.038	my5651_rel.cz11a_bee
0.000	0.408	99.382	0.210	0.001	0.000	0.000	0.000	0.000	0.000	0.039	my5744_rel.cz11a_bee
0.000	0.181	99.646	0.172	0.001	0.000	0.000	0.000	0.000	0.000	0.039	my8028_rel.cz11a_bee
0.000	0.106	99.714	0.179	0.001	0.000	0.000	0.000	0.000	0.000	0.041	my8032_rel.cz11a_bee
0.000	0.141	99.682	0.176	0.001	0.000	0.000	0.000	0.000	0.000	0.042	my8036_rel.cz11a_bee
0.000	0.133	99.691	0.175	0.001	0.000	0.000	0.000	0.000	0.000	0.041	my8037_rel.cz11a_bee
Insert response time histogram
256us	1ms	4ms	16ms	64ms	256ms	1s	4s	16s	gt	max	tag
0.000	0.000	0.000	29.750	70.167	0.083	0.000	0.000	0.000	0.000	0.071	my5651_rel.cz11a_bee
0.000	0.000	0.000	88.250	11.750	0.000	0.000	0.000	0.000	0.000	0.048	my5744_rel.cz11a_bee
0.000	0.000	0.000	93.528	6.472	0.000	0.000	0.000	0.000	0.000	0.030	my8028_rel.cz11a_bee
0.000	0.000	0.000	90.361	9.639	0.000	0.000	0.000	0.000	0.000	0.026	my8032_rel.cz11a_bee
0.000	0.000	0.000	89.250	10.750	0.000	0.000	0.000	0.000	0.000	0.030	my8036_rel.cz11a_bee
0.000	0.000	0.000	90.306	9.694	0.000	0.000	0.000	0.000	0.000	0.029	my8037_rel.cz11a_bee
Delete response time histogram
256us	1ms	4ms	16ms	64ms	256ms	1s	4s	16s	gt	max	tag
0.000	0.000	59.222	29.278	11.500	0.000	0.000	0.000	0.000	0.000	0.045	my5651_rel.cz11a_bee
0.000	0.000	98.944	1.056	0.000	0.000	0.000	0.000	0.000	0.000	0.013	my5744_rel.cz11a_bee
0.000	0.000	98.778	1.222	0.000	0.000	0.000	0.000	0.000	0.000	0.014	my8028_rel.cz11a_bee
0.000	0.000	98.167	1.806	0.028	0.000	0.000	0.000	0.000	0.000	0.022	my8032_rel.cz11a_bee
0.000	0.000	98.444	1.528	0.028	0.000	0.000	0.000	0.000	0.000	0.021	my8036_rel.cz11a_bee
0.000	0.000	98.472	1.500	0.028	0.000	0.000	0.000	0.000	0.000	0.018	my8037_rel.cz11a_bee
qr500.L3
- qr500.L3: range queries with 500 insert/s per client
- Legend for results is here.
- Each entry lists the percentage of responses that fit in that bucket (slower than max time for previous bucket, faster than min time for next bucket).
Query response time histogram
256us	1ms	4ms	16ms	64ms	256ms	1s	4s	16s	gt	max	tag
93.186	6.123	0.668	0.022	nonzero	0.000	0.000	0.000	0.000	0.000	0.026	my5651_rel.cz11a_bee
76.102	23.721	0.159	0.018	0.000	0.000	0.000	0.000	0.000	0.000	0.010	my5744_rel.cz11a_bee
42.441	57.338	0.202	0.019	nonzero	0.000	0.000	0.000	0.000	0.000	0.048	my8028_rel.cz11a_bee
27.064	72.696	0.220	0.020	0.000	0.000	0.000	0.000	0.000	0.000	0.011	my8032_rel.cz11a_bee
63.789	36.202	0.008	0.001	0.000	0.000	0.000	0.000	0.000	0.000	0.010	my8036_rel.cz11a_bee
62.251	37.740	0.008	0.001	0.000	0.000	0.000	0.000	0.000	0.000	0.014	my8037_rel.cz11a_bee
Insert response time histogram
256us	1ms	4ms	16ms	64ms	256ms	1s	4s	16s	gt	max	tag
0.000	0.000	0.000	49.444	50.478	0.078	0.000	0.000	0.000	0.000	0.108	my5651_rel.cz11a_bee
0.000	0.000	0.000	94.200	5.800	0.000	0.000	0.000	0.000	0.000	0.031	my5744_rel.cz11a_bee
0.000	0.000	0.000	92.489	7.511	0.000	0.000	0.000	0.000	0.000	0.036	my8028_rel.cz11a_bee
0.000	0.000	0.000	91.228	8.772	0.000	0.000	0.000	0.000	0.000	0.047	my8032_rel.cz11a_bee
0.000	0.000	0.000	90.283	9.717	0.000	0.000	0.000	0.000	0.000	0.037	my8036_rel.cz11a_bee
0.000	0.000	0.000	90.239	9.756	0.000	0.006	0.000	0.000	0.000	0.305	my8037_rel.cz11a_bee
Delete response time histogram
256us	1ms	4ms	16ms	64ms	256ms	1s	4s	16s	gt	max	tag
0.000	0.000	12.117	70.044	17.833	0.006	0.000	0.000	0.000	0.000	0.069	my5651_rel.cz11a_bee
0.000	0.000	99.156	0.839	0.006	0.000	0.000	0.000	0.000	0.000	0.019	my5744_rel.cz11a_bee
0.000	0.000	98.717	1.283	0.000	0.000	0.000	0.000	0.000	0.000	0.016	my8028_rel.cz11a_bee
0.000	0.000	95.522	4.461	0.017	0.000	0.000	0.000	0.000	0.000	0.017	my8032_rel.cz11a_bee
0.000	0.000	97.483	2.500	0.017	0.000	0.000	0.000	0.000	0.000	0.023	my8036_rel.cz11a_bee
0.000	0.000	97.028	2.956	0.011	0.000	0.006	0.000	0.000	0.000	0.279	my8037_rel.cz11a_bee
qp500.L4
- qp500.L4: point queries with 500 insert/s per client
- Legend for results is here.
- Each entry lists the percentage of responses that fit in that bucket (slower than max time for previous bucket, faster than min time for next bucket).
Query response time histogram
256us	1ms	4ms	16ms	64ms	256ms	1s	4s	16s	gt	max	tag
0.000	0.055	97.898	2.042	0.005	0.000	0.000	0.000	0.000	0.000	0.041	my5651_rel.cz11a_bee
0.000	0.037	98.095	1.862	0.006	0.000	0.000	0.000	0.000	0.000	0.043	my5744_rel.cz11a_bee
0.000	0.013	99.027	0.935	0.025	0.000	0.000	0.000	0.000	0.000	0.050	my8028_rel.cz11a_bee
0.000	0.007	98.919	1.051	0.023	0.000	0.000	0.000	0.000	0.000	0.048	my8032_rel.cz11a_bee
0.000	0.008	98.966	0.999	0.027	0.000	0.000	0.000	0.000	0.000	0.048	my8036_rel.cz11a_bee
0.000	0.009	98.987	0.974	0.030	0.000	0.000	0.000	0.000	0.000	0.049	my8037_rel.cz11a_bee
Insert response time histogram
256us	1ms	4ms	16ms	64ms	256ms	1s	4s	16s	gt	max	tag
0.000	0.000	0.000	50.028	45.533	4.439	0.000	0.000	0.000	0.000	0.127	my5651_rel.cz11a_bee
0.000	0.000	0.000	88.922	11.078	0.000	0.000	0.000	0.000	0.000	0.063	my5744_rel.cz11a_bee
0.000	0.000	0.000	95.689	4.283	0.028	0.000	0.000	0.000	0.000	0.071	my8028_rel.cz11a_bee
0.000	0.000	0.000	91.844	8.106	0.050	0.000	0.000	0.000	0.000	0.071	my8032_rel.cz11a_bee
0.000	0.000	0.000	92.606	7.339	0.056	0.000	0.000	0.000	0.000	0.079	my8036_rel.cz11a_bee
0.000	0.000	0.000	94.522	5.461	0.017	0.000	0.000	0.000	0.000	0.077	my8037_rel.cz11a_bee
Delete response time histogram
256us	1ms	4ms	16ms	64ms	256ms	1s	4s	16s	gt	max	tag
0.000	0.000	19.628	50.739	29.511	0.122	0.000	0.000	0.000	0.000	0.092	my5651_rel.cz11a_bee
0.000	0.000	98.211	1.783	0.006	0.000	0.000	0.000	0.000	0.000	0.019	my5744_rel.cz11a_bee
0.000	0.000	98.261	1.728	0.011	0.000	0.000	0.000	0.000	0.000	0.018	my8028_rel.cz11a_bee
0.000	0.000	92.544	7.378	0.078	0.000	0.000	0.000	0.000	0.000	0.040	my8032_rel.cz11a_bee
0.000	0.000	95.972	3.933	0.094	0.000	0.000	0.000	0.000	0.000	0.030	my8036_rel.cz11a_bee
0.000	0.000	95.911	4.033	0.056	0.000	0.000	0.000	0.000	0.000	0.029	my8037_rel.cz11a_bee
qr1000.L5
- qr1000.L5: range queries with 1000 insert/s per client
- Legend for results is here.
- Each entry lists the percentage of responses that fit in that bucket (slower than max time for previous bucket, faster than min time for next bucket).
Query response time histogram
256us	1ms	4ms	16ms	64ms	256ms	1s	4s	16s	gt	max	tag
89.007	9.570	1.367	0.056	nonzero	0.000	0.000	0.000	0.000	0.000	0.039	my5651_rel.cz11a_bee
79.022	20.785	0.173	0.020	nonzero	0.000	0.000	0.000	0.000	0.000	0.026	my5744_rel.cz11a_bee
47.978	51.785	0.214	0.023	nonzero	0.000	0.000	0.000	0.000	0.000	0.041	my8028_rel.cz11a_bee
36.570	63.175	0.234	0.021	nonzero	0.000	0.000	0.000	0.000	0.000	0.051	my8032_rel.cz11a_bee
67.766	32.220	0.013	0.001	nonzero	0.000	0.000	0.000	0.000	0.000	0.024	my8036_rel.cz11a_bee
66.595	33.387	0.017	0.001	nonzero	0.000	0.000	0.000	0.000	0.000	0.031	my8037_rel.cz11a_bee
Insert response time histogram
256us	1ms	4ms	16ms	64ms	256ms	1s	4s	16s	gt	max	tag
0.000	0.000	0.000	51.219	48.322	0.458	0.000	0.000	0.000	0.000	0.144	my5651_rel.cz11a_bee
0.000	0.000	0.000	96.647	3.353	0.000	0.000	0.000	0.000	0.000	0.045	my5744_rel.cz11a_bee
0.000	0.000	0.000	94.194	5.803	0.003	0.000	0.000	0.000	0.000	0.071	my8028_rel.cz11a_bee
0.000	0.000	0.000	95.508	4.489	0.003	0.000	0.000	0.000	0.000	0.113	my8032_rel.cz11a_bee
0.000	0.000	0.000	94.342	5.658	0.000	0.000	0.000	0.000	0.000	0.032	my8036_rel.cz11a_bee
0.000	0.000	0.000	93.919	6.078	0.003	0.000	0.000	0.000	0.000	0.211	my8037_rel.cz11a_bee
Delete response time histogram
256us	1ms	4ms	16ms	64ms	256ms	1s	4s	16s	gt	max	tag
0.000	0.000	25.233	52.286	22.461	0.019	0.000	0.000	0.000	0.000	0.102	my5651_rel.cz11a_bee
0.000	0.000	98.308	1.686	0.006	0.000	0.000	0.000	0.000	0.000	0.018	my5744_rel.cz11a_bee
0.000	0.000	98.794	1.206	0.000	0.000	0.000	0.000	0.000	0.000	0.014	my8028_rel.cz11a_bee
0.000	0.000	94.619	5.364	0.014	0.003	0.000	0.000	0.000	0.000	0.104	my8032_rel.cz11a_bee
0.000	0.000	97.342	2.644	0.014	0.000	0.000	0.000	0.000	0.000	0.018	my8036_rel.cz11a_bee
0.000	0.000	96.517	3.464	0.017	0.003	0.000	0.000	0.000	0.000	0.211	my8037_rel.cz11a_bee
qp1000.L6
- qp1000.L6: point queries with 1000 insert/s per client
- Legend for results is here.
- Each entry lists the percentage of responses that fit in that bucket (slower than max time for previous bucket, faster than min time for next bucket).
Query response time histogram
256us	1ms	4ms	16ms	64ms	256ms	1s	4s	16s	gt	max	tag
0.000	0.003	93.746	6.235	0.015	0.000	0.000	0.000	0.000	0.000	0.043	my5651_rel.cz11a_bee
0.000	0.006	95.808	4.174	0.011	0.000	0.000	0.000	0.000	0.000	0.055	my5744_rel.cz11a_bee
0.000	0.002	98.026	1.886	0.086	0.000	0.000	0.000	0.000	0.000	0.054	my8028_rel.cz11a_bee
0.000	0.001	97.904	2.006	0.090	0.000	0.000	0.000	0.000	0.000	0.052	my8032_rel.cz11a_bee
0.000	0.001	97.967	1.936	0.096	0.000	0.000	0.000	0.000	0.000	0.054	my8036_rel.cz11a_bee
0.000	0.001	97.991	1.907	0.101	0.000	0.000	0.000	0.000	0.000	0.052	my8037_rel.cz11a_bee
Insert response time histogram
256us	1ms	4ms	16ms	64ms	256ms	1s	4s	16s	gt	max	tag
0.000	0.000	0.000	29.072	66.267	4.661	0.000	0.000	0.000	0.000	0.167	my5651_rel.cz11a_bee
0.000	0.000	0.000	88.247	11.728	0.025	0.000	0.000	0.000	0.000	0.084	my5744_rel.cz11a_bee
0.000	0.000	0.000	89.325	10.578	0.097	0.000	0.000	0.000	0.000	0.094	my8028_rel.cz11a_bee
0.000	0.000	0.000	91.372	8.575	0.053	0.000	0.000	0.000	0.000	0.110	my8032_rel.cz11a_bee
0.000	0.000	0.000	90.578	9.369	0.053	0.000	0.000	0.000	0.000	0.087	my8036_rel.cz11a_bee
0.000	0.000	0.000	91.122	8.803	0.075	0.000	0.000	0.000	0.000	0.091	my8037_rel.cz11a_bee
Delete response time histogram
256us	1ms	4ms	16ms	64ms	256ms	1s	4s	16s	gt	max	tag
0.000	0.000	23.858	50.914	24.961	0.267	0.000	0.000	0.000	0.000	0.112	my5651_rel.cz11a_bee
0.000	0.000	97.739	2.250	0.011	0.000	0.000	0.000	0.000	0.000	0.025	my5744_rel.cz11a_bee
0.000	0.000	96.750	3.153	0.097	0.000	0.000	0.000	0.000	0.000	0.033	my8028_rel.cz11a_bee
0.000	0.000	91.758	8.161	0.081	0.000	0.000	0.000	0.000	0.000	0.040	my8032_rel.cz11a_bee
0.000	0.000	95.425	4.506	0.069	0.000	0.000	0.000	0.000	0.000	0.045	my8036_rel.cz11a_bee
0.000	0.000	94.547	5.333	0.119	0.000	0.000	0.000	0.000	0.000	0.046	my8037_rel.cz11a_bee