Introduction
This is a report for the insert benchmark with 800M docs and 1 client(s). It is generated by scripts (bash, awk, sed) and Tufte might not be impressed. An overview of the insert benchmark is here and a short update is here. Below, by DBMS, I mean DBMS+version.config. An example is my8020.c10b40 where my means MySQL, 8020 is version 8.0.20 and c10b40 is the name for the configuration file.
The test server has 8 AMD cores, 16G RAM and an NVMe SSD. It is described here as the Beelink. The benchmark was run with 1 client and there were 1 or 3 connections per client (1 for queries or inserts without rate limits, 1+1 for rate limited inserts+deletes). It uses 1 table. It loads 20M rows per table without secondary indexes, creates 3 secondary indexes per table, then inserts 40m+10m rows per table with a delete per insert to avoid growing the table. It then does 6 read+write tests for 1800s each that do queries as fast as possible with 100,100,500,500,1000,1000 inserts/s and the same for deletes/s per client concurrent with the queries. The database is cached in memory. Clients and the DBMS share one server. The per-database configs are in the per-database subdirectories here.
The tested DBMS are:
- fbmy5635_rel_240606_4f3a57a1.cza1_bee - MyRocks 5.6.35 with the cza1_bee config compiled at git sha 4f3a57a1 on 240606 using RocksDB 8.7.0
- fbmy8028_rel_240606_c6c83b18.cza1_bee - MyRocks 8.0.28 with the cza1_bee config compiled at git sha c6c83b18 on 240606 using RocksDB 8.7.0
- fbmy8032_rel_240606_59f03d5a.cza1_bee - MyRocks 8.0.36 with the cza1_bee config compiled at git sha 59f03d5a on 240606 using RocksDB 9.3.1
Contents
- Summary
- l.i0: load without secondary indexes
- l.x: create secondary indexes
- l.i1: continue load after secondary indexes created with 50 inserts per transaction
- l.i2: continue load after secondary indexes created with 5 inserts per transaction
- qr100.L1: range queries with 100 insert/s per client
- qp100.L2: point queries with 100 insert/s per client
- qr500.L3: range queries with 500 insert/s per client
- qp500.L4: point queries with 500 insert/s per client
- qr1000.L5: range queries with 1000 insert/s per client
- qp1000.L6: point queries with 1000 insert/s per client
Summary
The numbers are inserts/s for l.i0, l.i1 and l.i2, indexed docs (or rows) /s for l.x and queries/s for qr100, qp100 thru qr1000, qp1000" The values are the average rate over the entire test for inserts (IPS) and queries (QPS). The range of values for IPS and QPS is split into 3 parts: bottom 25%, middle 50%, top 25%. Values in the bottom 25% have a red background, values in the top 25% have a green background and values in the middle have no color. A gray background is used for values that can be ignored because the DBMS did not sustain the target insert rate. Red backgrounds are not used when the minimum value is within 80% of the max value.
| dbms | l.i0 | l.x | l.i1 | l.i2 | qr100 | qp100 | qr500 | qp500 | qr1000 | qp1000 |
|---|---|---|---|---|---|---|---|---|---|---|
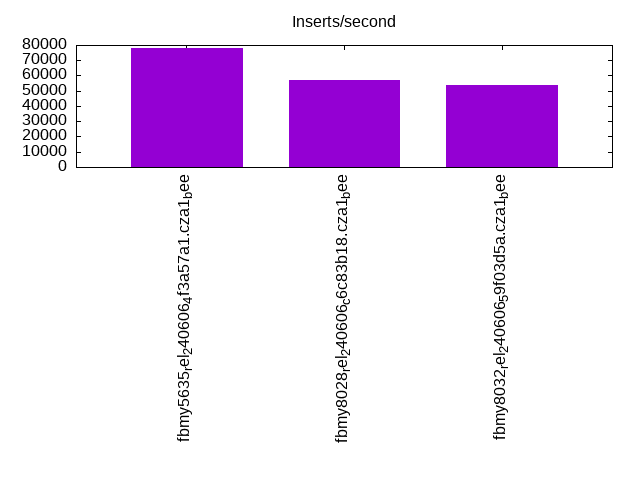
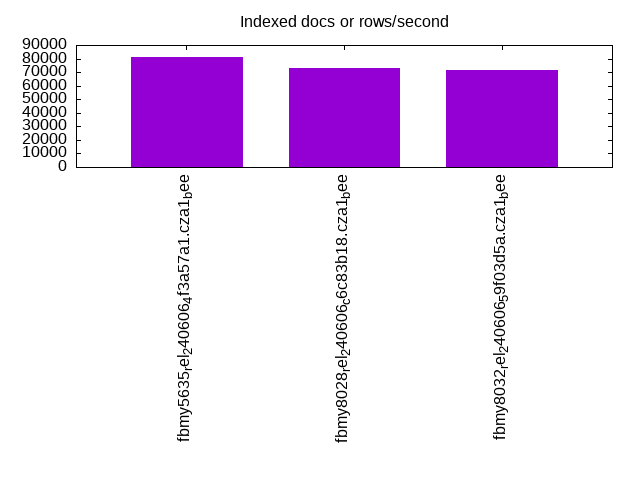
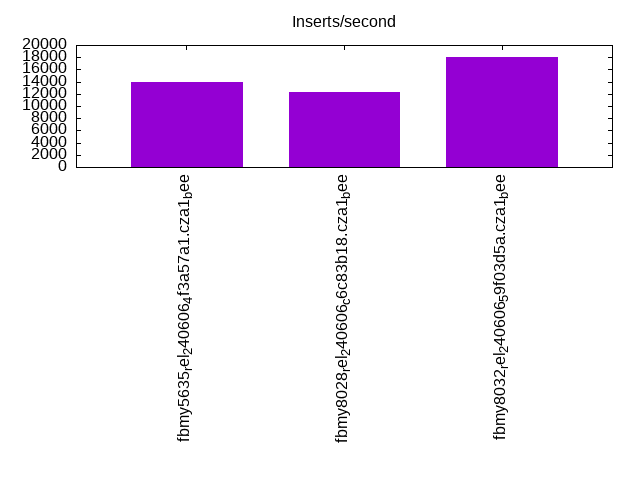
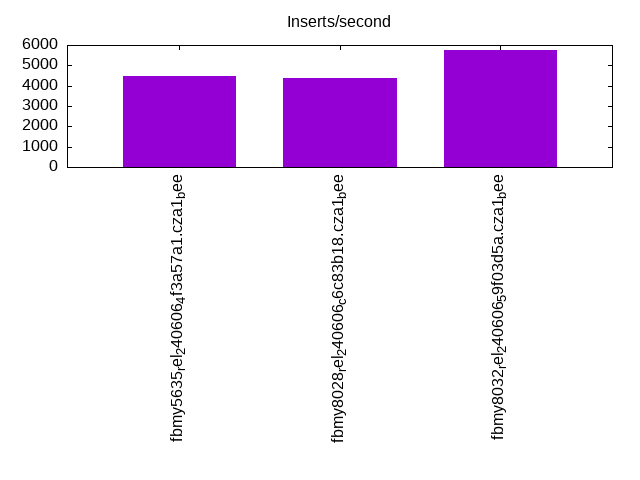
| fbmy5635_rel_240606_4f3a57a1.cza1_bee | 78301 | 80808 | 14001 | 4474 | 867 | 819 | 1494 | 796 | 825 | 791 |
| fbmy8028_rel_240606_c6c83b18.cza1_bee | 57021 | 72886 | 12304 | 4372 | 622 | 713 | 540 | 706 | 592 | 702 |
| fbmy8032_rel_240606_59f03d5a.cza1_bee | 53544 | 71736 | 18026 | 5777 | 457 | 748 | 980 | 736 | 808 | 726 |
This table has relative throughput, throughput for the DBMS relative to the DBMS in the first line, using the absolute throughput from the previous table. Values less than 0.95 have a yellow background. Values greater than 1.05 have a blue background.
| dbms | l.i0 | l.x | l.i1 | l.i2 | qr100 | qp100 | qr500 | qp500 | qr1000 | qp1000 |
|---|---|---|---|---|---|---|---|---|---|---|
| fbmy5635_rel_240606_4f3a57a1.cza1_bee | 1.00 | 1.00 | 1.00 | 1.00 | 1.00 | 1.00 | 1.00 | 1.00 | 1.00 | 1.00 |
| fbmy8028_rel_240606_c6c83b18.cza1_bee | 0.73 | 0.90 | 0.88 | 0.98 | 0.72 | 0.87 | 0.36 | 0.89 | 0.72 | 0.89 |
| fbmy8032_rel_240606_59f03d5a.cza1_bee | 0.68 | 0.89 | 1.29 | 1.29 | 0.53 | 0.91 | 0.66 | 0.92 | 0.98 | 0.92 |
This lists the average rate of inserts/s for the tests that do inserts concurrent with queries. For such tests the query rate is listed in the table above. The read+write tests are setup so that the insert rate should match the target rate every second. Cells that are not at least 95% of the target have a red background to indicate a failure to satisfy the target.
| dbms | qr100.L1 | qp100.L2 | qr500.L3 | qp500.L4 | qr1000.L5 | qp1000.L6 |
|---|---|---|---|---|---|---|
| fbmy5635_rel_240606_4f3a57a1.cza1_bee | 100 | 100 | 499 | 499 | 998 | 998 |
| fbmy8028_rel_240606_c6c83b18.cza1_bee | 100 | 100 | 499 | 499 | 998 | 998 |
| fbmy8032_rel_240606_59f03d5a.cza1_bee | 100 | 100 | 499 | 499 | 998 | 998 |
| target | 100 | 100 | 500 | 500 | 1000 | 1000 |
l.i0
l.i0: load without secondary indexes. Graphs for performance per 1-second interval are here.
Average throughput:
Insert response time histogram: each cell has the percentage of responses that take <= the time in the header and max is the max response time in seconds. For the max column values in the top 25% of the range have a red background and in the bottom 25% of the range have a green background. The red background is not used when the min value is within 80% of the max value.
| dbms | 256us | 1ms | 4ms | 16ms | 64ms | 256ms | 1s | 4s | 16s | gt | max |
|---|---|---|---|---|---|---|---|---|---|---|---|
| fbmy5635_rel_240606_4f3a57a1.cza1_bee | 99.869 | 0.127 | 0.002 | 0.002 | 0.227 | ||||||
| fbmy8028_rel_240606_c6c83b18.cza1_bee | 99.722 | 0.201 | 0.074 | 0.004 | 0.116 | ||||||
| fbmy8032_rel_240606_59f03d5a.cza1_bee | 99.710 | 0.209 | 0.078 | 0.003 | 0.091 |
Performance metrics for the DBMS listed above. Some are normalized by throughput, others are not. Legend for results is here.
ips	qps	rps	rmbps	wps	wmbps	rpq	rkbpq	wpi	wkbpi	csps	cpups	cspq	cpupq	dbgb1	dbgb2	rss	maxop	p50	p99	tag
78301	0	0	0.0	43.1	13.9	0.000	0.000	0.001	0.182	7721	23.1	0.099	24	23.0	23.6	1.5	0.227	78510	71518	fbmy5635_rel_240606_4f3a57a1.cza1_bee
57021	0	0	0.0	44.9	13.0	0.000	0.000	0.001	0.233	5998	22.9	0.105	32	23.0	23.8	2.0	0.116	57135	50544	fbmy8028_rel_240606_c6c83b18.cza1_bee
53544	0	0	0.0	42.7	12.2	0.000	0.000	0.001	0.233	5844	22.3	0.109	33	23.0	23.8	2.0	0.091	53538	48447	fbmy8032_rel_240606_59f03d5a.cza1_bee
l.x
l.x: create secondary indexes.
Average throughput:
Performance metrics for the DBMS listed above. Some are normalized by throughput, others are not. Legend for results is here.
ips	qps	rps	rmbps	wps	wmbps	rpq	rkbpq	wpi	wkbpi	csps	cpups	cspq	cpupq	dbgb1	dbgb2	rss	maxop	p50	p99	tag
80808	0	107	16.6	35.4	12.6	0.001	0.210	0.000	0.159	265	11.7	0.003	12	51.0	51.6	8.8	0.002	NA	NA	fbmy5635_rel_240606_4f3a57a1.cza1_bee
72886	0	96	14.9	31.4	11.1	0.001	0.210	0.000	0.156	389	11.7	0.005	13	50.9	51.7	10.3	0.003	NA	NA	fbmy8028_rel_240606_c6c83b18.cza1_bee
71736	0	95	14.7	30.8	10.9	0.001	0.210	0.000	0.156	604	11.7	0.008	13	50.9	51.7	10.4	0.004	NA	NA	fbmy8032_rel_240606_59f03d5a.cza1_bee
l.i1
l.i1: continue load after secondary indexes created with 50 inserts per transaction. Graphs for performance per 1-second interval are here.
Average throughput:
Insert response time histogram: each cell has the percentage of responses that take <= the time in the header and max is the max response time in seconds. For the max column values in the top 25% of the range have a red background and in the bottom 25% of the range have a green background. The red background is not used when the min value is within 80% of the max value.
| dbms | 256us | 1ms | 4ms | 16ms | 64ms | 256ms | 1s | 4s | 16s | gt | max |
|---|---|---|---|---|---|---|---|---|---|---|---|
| fbmy5635_rel_240606_4f3a57a1.cza1_bee | 99.759 | 0.236 | 0.005 | 0.001 | 0.070 | ||||||
| fbmy8028_rel_240606_c6c83b18.cza1_bee | 99.606 | 0.384 | 0.009 | 0.001 | 0.084 | ||||||
| fbmy8032_rel_240606_59f03d5a.cza1_bee | 99.553 | 0.438 | 0.009 | nonzero | 0.084 |
Delete response time histogram: each cell has the percentage of responses that take <= the time in the header and max is the max response time in seconds. For the max column values in the top 25% of the range have a red background and in the bottom 25% of the range have a green background. The red background is not used when the min value is within 80% of the max value.
| dbms | 256us | 1ms | 4ms | 16ms | 64ms | 256ms | 1s | 4s | 16s | gt | max |
|---|---|---|---|---|---|---|---|---|---|---|---|
| fbmy5635_rel_240606_4f3a57a1.cza1_bee | 99.430 | 0.559 | 0.010 | 0.001 | 0.129 | ||||||
| fbmy8028_rel_240606_c6c83b18.cza1_bee | 99.472 | 0.513 | 0.013 | 0.002 | 0.087 | ||||||
| fbmy8032_rel_240606_59f03d5a.cza1_bee | 99.237 | 0.747 | 0.016 | 0.001 | 0.068 |
Performance metrics for the DBMS listed above. Some are normalized by throughput, others are not. Legend for results is here.
ips	qps	rps	rmbps	wps	wmbps	rpq	rkbpq	wpi	wkbpi	csps	cpups	cspq	cpupq	dbgb1	dbgb2	rss	maxop	p50	p99	tag
14001	0	2380	15.7	111.0	41.1	0.170	1.150	0.008	3.009	10972	41.7	0.784	238	55.2	56.7	8.0	0.070	16690	0	fbmy5635_rel_240606_4f3a57a1.cza1_bee
12304	0	2018	13.2	102.3	36.7	0.164	1.099	0.008	3.057	9760	40.4	0.793	263	55.3	56.9	8.0	0.084	14983	0	fbmy8028_rel_240606_c6c83b18.cza1_bee
18026	0	3522	22.0	167.0	60.9	0.195	1.249	0.009	3.461	15262	58.3	0.847	259	62.1	63.8	8.1	0.084	19429	5931	fbmy8032_rel_240606_59f03d5a.cza1_bee
l.i2
l.i2: continue load after secondary indexes created with 5 inserts per transaction. Graphs for performance per 1-second interval are here.
Average throughput:
Insert response time histogram: each cell has the percentage of responses that take <= the time in the header and max is the max response time in seconds. For the max column values in the top 25% of the range have a red background and in the bottom 25% of the range have a green background. The red background is not used when the min value is within 80% of the max value.
| dbms | 256us | 1ms | 4ms | 16ms | 64ms | 256ms | 1s | 4s | 16s | gt | max |
|---|---|---|---|---|---|---|---|---|---|---|---|
| fbmy5635_rel_240606_4f3a57a1.cza1_bee | 0.021 | 99.863 | 0.054 | 0.061 | 0.001 | nonzero | 0.080 | ||||
| fbmy8028_rel_240606_c6c83b18.cza1_bee | 99.796 | 0.110 | 0.093 | 0.001 | nonzero | 0.083 | |||||
| fbmy8032_rel_240606_59f03d5a.cza1_bee | 99.644 | 0.256 | 0.098 | 0.002 | nonzero | 0.070 |
Delete response time histogram: each cell has the percentage of responses that take <= the time in the header and max is the max response time in seconds. For the max column values in the top 25% of the range have a red background and in the bottom 25% of the range have a green background. The red background is not used when the min value is within 80% of the max value.
| dbms | 256us | 1ms | 4ms | 16ms | 64ms | 256ms | 1s | 4s | 16s | gt | max |
|---|---|---|---|---|---|---|---|---|---|---|---|
| fbmy5635_rel_240606_4f3a57a1.cza1_bee | 99.591 | 0.282 | 0.126 | 0.001 | nonzero | 0.080 | |||||
| fbmy8028_rel_240606_c6c83b18.cza1_bee | 98.405 | 1.436 | 0.158 | 0.002 | nonzero | 0.067 | |||||
| fbmy8032_rel_240606_59f03d5a.cza1_bee | 98.006 | 1.849 | 0.143 | 0.003 | nonzero | 0.080 |
Performance metrics for the DBMS listed above. Some are normalized by throughput, others are not. Legend for results is here.
ips	qps	rps	rmbps	wps	wmbps	rpq	rkbpq	wpi	wkbpi	csps	cpups	cspq	cpupq	dbgb1	dbgb2	rss	maxop	p50	p99	tag
4474	0	1467	10.0	63.6	23.3	0.328	2.286	0.014	5.342	22101	32.9	4.940	588	56.4	56.7	7.6	0.080	4998	20	fbmy5635_rel_240606_4f3a57a1.cza1_bee
4372	0	1613	10.7	63.6	23.2	0.369	2.501	0.015	5.433	22021	34.6	5.036	633	55.3	55.7	8.0	0.083	4998	0	fbmy8028_rel_240606_c6c83b18.cza1_bee
5777	0	1988	13.7	99.4	35.9	0.344	2.434	0.017	6.368	28782	43.6	4.982	604	55.1	55.5	8.0	0.070	5779	3966	fbmy8032_rel_240606_59f03d5a.cza1_bee
qr100.L1
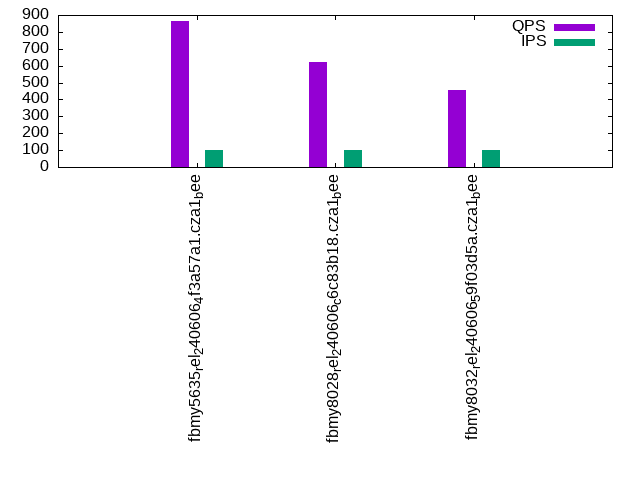
qr100.L1: range queries with 100 insert/s per client. Graphs for performance per 1-second interval are here.
Average throughput:
Query response time histogram: each cell has the percentage of responses that take <= the time in the header and max is the max response time in seconds. For max values in the top 25% of the range have a red background and in the bottom 25% of the range have a green background. The red background is not used when the min value is within 80% of the max value.
| dbms | 256us | 1ms | 4ms | 16ms | 64ms | 256ms | 1s | 4s | 16s | gt | max |
|---|---|---|---|---|---|---|---|---|---|---|---|
| fbmy5635_rel_240606_4f3a57a1.cza1_bee | 7.410 | 72.945 | 8.099 | 11.545 | 0.002 | nonzero | 0.179 | ||||
| fbmy8028_rel_240606_c6c83b18.cza1_bee | 0.515 | 65.942 | 20.199 | 13.343 | 0.002 | 0.060 | |||||
| fbmy8032_rel_240606_59f03d5a.cza1_bee | 1.022 | 65.236 | 6.714 | 27.027 | 0.001 | 0.063 |
Insert response time histogram: each cell has the percentage of responses that take <= the time in the header and max is the max response time in seconds. For max values in the top 25% of the range have a red background and in the bottom 25% of the range have a green background. The red background is not used when the min value is within 80% of the max value.
| dbms | 256us | 1ms | 4ms | 16ms | 64ms | 256ms | 1s | 4s | 16s | gt | max |
|---|---|---|---|---|---|---|---|---|---|---|---|
| fbmy5635_rel_240606_4f3a57a1.cza1_bee | 99.111 | 0.861 | 0.028 | 0.017 | |||||||
| fbmy8028_rel_240606_c6c83b18.cza1_bee | 98.833 | 1.111 | 0.056 | 0.018 | |||||||
| fbmy8032_rel_240606_59f03d5a.cza1_bee | 95.194 | 4.778 | 0.028 | 0.018 |
Delete response time histogram: each cell has the percentage of responses that take <= the time in the header and max is the max response time in seconds. For max values in the top 25% of the range have a red background and in the bottom 25% of the range have a green background. The red background is not used when the min value is within 80% of the max value.
| dbms | 256us | 1ms | 4ms | 16ms | 64ms | 256ms | 1s | 4s | 16s | gt | max |
|---|---|---|---|---|---|---|---|---|---|---|---|
| fbmy5635_rel_240606_4f3a57a1.cza1_bee | 82.111 | 13.611 | 4.278 | 0.018 | |||||||
| fbmy8028_rel_240606_c6c83b18.cza1_bee | 90.417 | 8.944 | 0.639 | 0.022 | |||||||
| fbmy8032_rel_240606_59f03d5a.cza1_bee | 87.417 | 11.750 | 0.833 | 0.018 |
Performance metrics for the DBMS listed above. Some are normalized by throughput, others are not. Legend for results is here.
ips	qps	rps	rmbps	wps	wmbps	rpq	rkbpq	wpi	wkbpi	csps	cpups	cspq	cpupq	dbgb1	dbgb2	rss	maxop	p50	p99	tag
100	867	510	3.3	12.1	3.5	0.588	3.901	0.121	35.415	4490	14.9	5.179	1375	54.9	55.0	7.9	0.179	688	527	fbmy5635_rel_240606_4f3a57a1.cza1_bee
100	622	16	0.2	5.1	0.7	0.025	0.380	0.051	7.471	2728	12.5	4.388	1608	55.0	55.3	8.1	0.060	623	527	fbmy8028_rel_240606_c6c83b18.cza1_bee
100	457	14	0.2	5.0	0.7	0.031	0.482	0.050	6.769	2262	12.1	4.950	2118	55.1	55.3	8.5	0.063	463	384	fbmy8032_rel_240606_59f03d5a.cza1_bee
qp100.L2
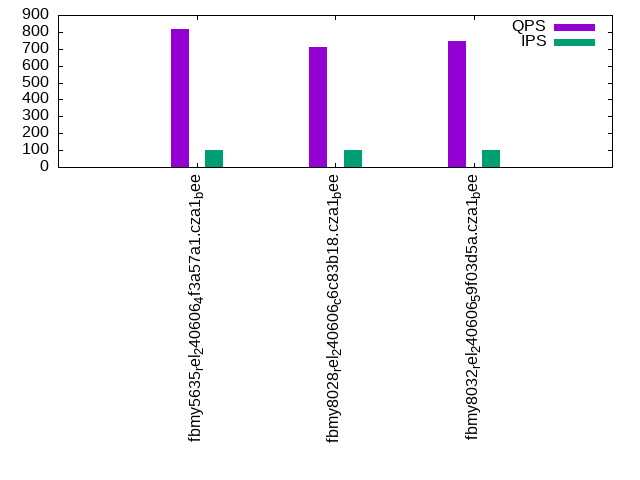
qp100.L2: point queries with 100 insert/s per client. Graphs for performance per 1-second interval are here.
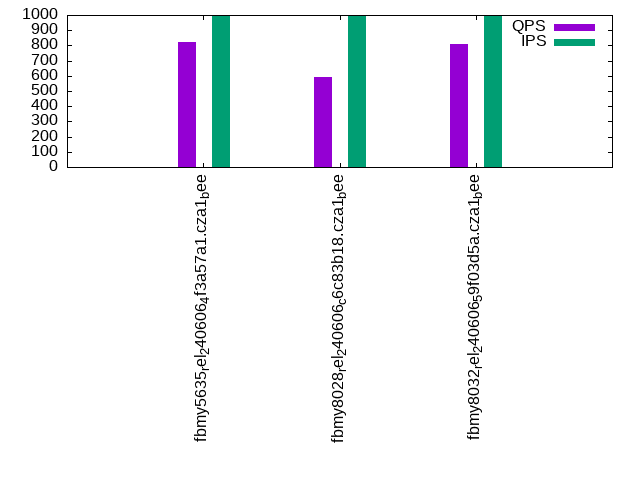
Average throughput:
Query response time histogram: each cell has the percentage of responses that take <= the time in the header and max is the max response time in seconds. For max values in the top 25% of the range have a red background and in the bottom 25% of the range have a green background. The red background is not used when the min value is within 80% of the max value.
| dbms | 256us | 1ms | 4ms | 16ms | 64ms | 256ms | 1s | 4s | 16s | gt | max |
|---|---|---|---|---|---|---|---|---|---|---|---|
| fbmy5635_rel_240606_4f3a57a1.cza1_bee | 14.178 | 85.765 | 0.056 | 0.001 | 0.043 | ||||||
| fbmy8028_rel_240606_c6c83b18.cza1_bee | 2.306 | 97.627 | 0.067 | 0.001 | 0.025 | ||||||
| fbmy8032_rel_240606_59f03d5a.cza1_bee | 3.770 | 96.157 | 0.073 | nonzero | 0.027 |
Insert response time histogram: each cell has the percentage of responses that take <= the time in the header and max is the max response time in seconds. For max values in the top 25% of the range have a red background and in the bottom 25% of the range have a green background. The red background is not used when the min value is within 80% of the max value.
| dbms | 256us | 1ms | 4ms | 16ms | 64ms | 256ms | 1s | 4s | 16s | gt | max |
|---|---|---|---|---|---|---|---|---|---|---|---|
| fbmy5635_rel_240606_4f3a57a1.cza1_bee | 98.722 | 1.250 | 0.028 | 0.319 | |||||||
| fbmy8028_rel_240606_c6c83b18.cza1_bee | 98.139 | 1.861 | 0.015 | ||||||||
| fbmy8032_rel_240606_59f03d5a.cza1_bee | 99.222 | 0.778 | 0.012 |
Delete response time histogram: each cell has the percentage of responses that take <= the time in the header and max is the max response time in seconds. For max values in the top 25% of the range have a red background and in the bottom 25% of the range have a green background. The red background is not used when the min value is within 80% of the max value.
| dbms | 256us | 1ms | 4ms | 16ms | 64ms | 256ms | 1s | 4s | 16s | gt | max |
|---|---|---|---|---|---|---|---|---|---|---|---|
| fbmy5635_rel_240606_4f3a57a1.cza1_bee | 98.306 | 1.639 | 0.028 | 0.028 | 0.320 | ||||||
| fbmy8028_rel_240606_c6c83b18.cza1_bee | 98.528 | 1.472 | 0.015 | ||||||||
| fbmy8032_rel_240606_59f03d5a.cza1_bee | 98.722 | 1.278 | 0.012 |
Performance metrics for the DBMS listed above. Some are normalized by throughput, others are not. Legend for results is here.
ips	qps	rps	rmbps	wps	wmbps	rpq	rkbpq	wpi	wkbpi	csps	cpups	cspq	cpupq	dbgb1	dbgb2	rss	maxop	p50	p99	tag
100	819	6720	51.6	4.9	0.6	8.205	64.513	0.049	6.053	17168	7.3	20.962	713	55.0	55.0	9.1	0.043	815	640	fbmy5635_rel_240606_4f3a57a1.cza1_bee
100	713	5913	45.6	5.7	0.9	8.289	65.390	0.057	8.806	15363	7.1	21.535	796	55.0	55.3	9.3	0.025	719	559	fbmy8028_rel_240606_c6c83b18.cza1_bee
100	748	6748	50.9	13.8	3.6	9.027	69.670	0.139	37.413	17495	10.8	23.401	1156	54.9	55.1	9.5	0.027	751	655	fbmy8032_rel_240606_59f03d5a.cza1_bee
qr500.L3
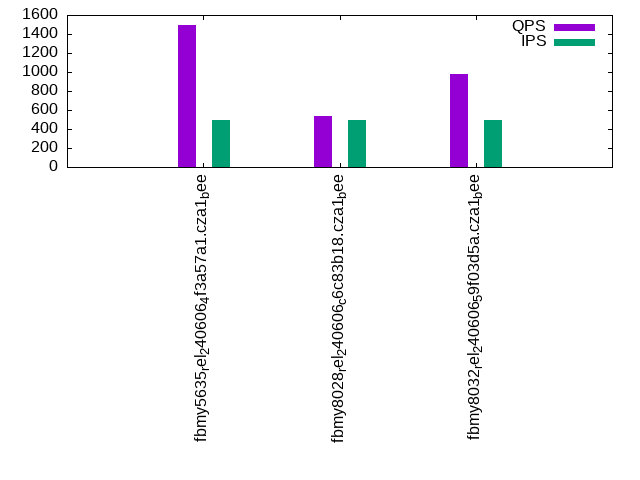
qr500.L3: range queries with 500 insert/s per client. Graphs for performance per 1-second interval are here.
Average throughput:
Query response time histogram: each cell has the percentage of responses that take <= the time in the header and max is the max response time in seconds. For max values in the top 25% of the range have a red background and in the bottom 25% of the range have a green background. The red background is not used when the min value is within 80% of the max value.
| dbms | 256us | 1ms | 4ms | 16ms | 64ms | 256ms | 1s | 4s | 16s | gt | max |
|---|---|---|---|---|---|---|---|---|---|---|---|
| fbmy5635_rel_240606_4f3a57a1.cza1_bee | 6.149 | 75.567 | 17.359 | 0.923 | 0.001 | nonzero | 0.204 | ||||
| fbmy8028_rel_240606_c6c83b18.cza1_bee | 0.193 | 66.338 | 17.601 | 15.864 | 0.004 | nonzero | 0.155 | ||||
| fbmy8032_rel_240606_59f03d5a.cza1_bee | 2.279 | 79.813 | 11.214 | 6.693 | 0.001 | nonzero | 0.129 |
Insert response time histogram: each cell has the percentage of responses that take <= the time in the header and max is the max response time in seconds. For max values in the top 25% of the range have a red background and in the bottom 25% of the range have a green background. The red background is not used when the min value is within 80% of the max value.
| dbms | 256us | 1ms | 4ms | 16ms | 64ms | 256ms | 1s | 4s | 16s | gt | max |
|---|---|---|---|---|---|---|---|---|---|---|---|
| fbmy5635_rel_240606_4f3a57a1.cza1_bee | 98.750 | 1.244 | 0.006 | 0.020 | |||||||
| fbmy8028_rel_240606_c6c83b18.cza1_bee | 97.456 | 2.489 | 0.056 | 0.018 | |||||||
| fbmy8032_rel_240606_59f03d5a.cza1_bee | 98.978 | 0.956 | 0.067 | 0.023 |
Delete response time histogram: each cell has the percentage of responses that take <= the time in the header and max is the max response time in seconds. For max values in the top 25% of the range have a red background and in the bottom 25% of the range have a green background. The red background is not used when the min value is within 80% of the max value.
| dbms | 256us | 1ms | 4ms | 16ms | 64ms | 256ms | 1s | 4s | 16s | gt | max |
|---|---|---|---|---|---|---|---|---|---|---|---|
| fbmy5635_rel_240606_4f3a57a1.cza1_bee | 97.217 | 2.728 | 0.056 | 0.039 | |||||||
| fbmy8028_rel_240606_c6c83b18.cza1_bee | 94.889 | 4.967 | 0.144 | 0.018 | |||||||
| fbmy8032_rel_240606_59f03d5a.cza1_bee | 97.117 | 2.756 | 0.128 | 0.028 |
Performance metrics for the DBMS listed above. Some are normalized by throughput, others are not. Legend for results is here.
ips	qps	rps	rmbps	wps	wmbps	rpq	rkbpq	wpi	wkbpi	csps	cpups	cspq	cpupq	dbgb1	dbgb2	rss	maxop	p50	p99	tag
499	1494	426	2.9	18.5	5.9	0.285	1.958	0.037	12.047	6877	15.9	4.602	851	55.0	55.3	7.9	0.204	1550	943	fbmy5635_rel_240606_4f3a57a1.cza1_bee
499	540	273	2.2	16.4	5.0	0.505	4.075	0.033	10.348	3107	15.6	5.750	2309	55.0	55.5	8.2	0.155	543	448	fbmy8028_rel_240606_c6c83b18.cza1_bee
499	980	172	1.3	16.2	4.5	0.175	1.323	0.032	9.287	4735	14.9	4.833	1217	55.0	55.5	8.1	0.129	975	800	fbmy8032_rel_240606_59f03d5a.cza1_bee
qp500.L4
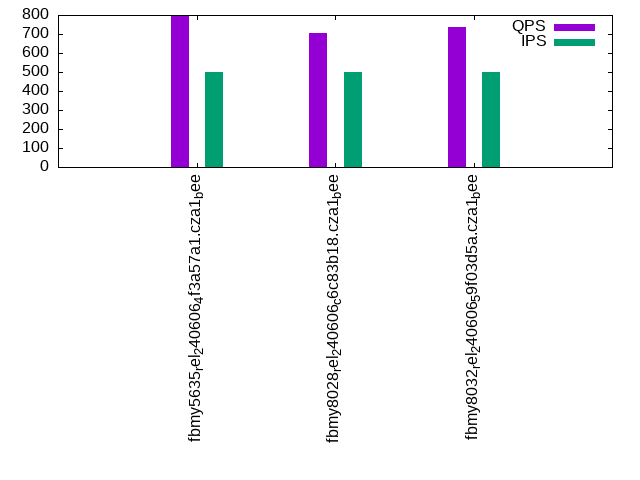
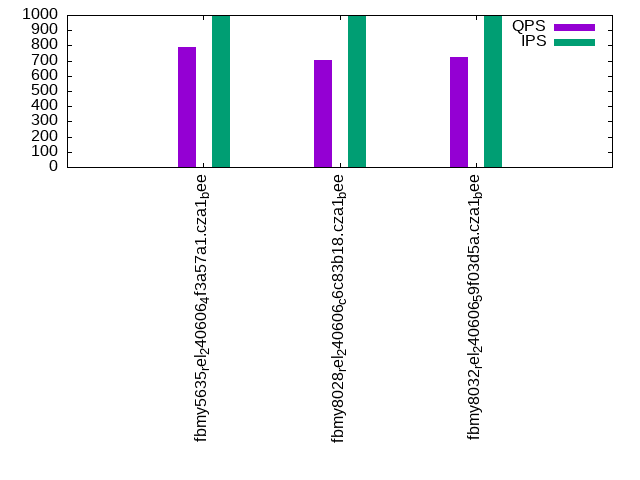
qp500.L4: point queries with 500 insert/s per client. Graphs for performance per 1-second interval are here.
Average throughput:
Query response time histogram: each cell has the percentage of responses that take <= the time in the header and max is the max response time in seconds. For max values in the top 25% of the range have a red background and in the bottom 25% of the range have a green background. The red background is not used when the min value is within 80% of the max value.
| dbms | 256us | 1ms | 4ms | 16ms | 64ms | 256ms | 1s | 4s | 16s | gt | max |
|---|---|---|---|---|---|---|---|---|---|---|---|
| fbmy5635_rel_240606_4f3a57a1.cza1_bee | 12.308 | 87.608 | 0.084 | nonzero | 0.025 | ||||||
| fbmy8028_rel_240606_c6c83b18.cza1_bee | 2.300 | 97.599 | 0.100 | nonzero | 0.021 | ||||||
| fbmy8032_rel_240606_59f03d5a.cza1_bee | 3.461 | 96.445 | 0.094 | 0.001 | 0.061 |
Insert response time histogram: each cell has the percentage of responses that take <= the time in the header and max is the max response time in seconds. For max values in the top 25% of the range have a red background and in the bottom 25% of the range have a green background. The red background is not used when the min value is within 80% of the max value.
| dbms | 256us | 1ms | 4ms | 16ms | 64ms | 256ms | 1s | 4s | 16s | gt | max |
|---|---|---|---|---|---|---|---|---|---|---|---|
| fbmy5635_rel_240606_4f3a57a1.cza1_bee | 99.656 | 0.344 | 0.013 | ||||||||
| fbmy8028_rel_240606_c6c83b18.cza1_bee | 99.439 | 0.561 | 0.012 | ||||||||
| fbmy8032_rel_240606_59f03d5a.cza1_bee | 98.844 | 1.150 | 0.006 | 0.019 |
Delete response time histogram: each cell has the percentage of responses that take <= the time in the header and max is the max response time in seconds. For max values in the top 25% of the range have a red background and in the bottom 25% of the range have a green background. The red background is not used when the min value is within 80% of the max value.
| dbms | 256us | 1ms | 4ms | 16ms | 64ms | 256ms | 1s | 4s | 16s | gt | max |
|---|---|---|---|---|---|---|---|---|---|---|---|
| fbmy5635_rel_240606_4f3a57a1.cza1_bee | 99.483 | 0.511 | 0.006 | 0.027 | |||||||
| fbmy8028_rel_240606_c6c83b18.cza1_bee | 99.344 | 0.650 | 0.006 | 0.078 | |||||||
| fbmy8032_rel_240606_59f03d5a.cza1_bee | 98.128 | 1.872 | 0.016 |
Performance metrics for the DBMS listed above. Some are normalized by throughput, others are not. Legend for results is here.
ips	qps	rps	rmbps	wps	wmbps	rpq	rkbpq	wpi	wkbpi	csps	cpups	cspq	cpupq	dbgb1	dbgb2	rss	maxop	p50	p99	tag
499	796	6744	52.6	14.4	3.8	8.474	67.676	0.029	7.893	17548	9.1	22.048	915	55.1	55.6	8.5	0.025	799	592	fbmy5635_rel_240606_4f3a57a1.cza1_bee
499	706	6204	48.2	16.5	4.6	8.784	69.920	0.033	9.332	16204	9.7	22.942	1099	55.1	55.8	8.6	0.021	703	543	fbmy8028_rel_240606_c6c83b18.cza1_bee
499	736	6372	49.7	16.1	4.3	8.653	69.054	0.032	8.850	16836	10.2	22.862	1108	55.0	55.7	8.7	0.061	735	623	fbmy8032_rel_240606_59f03d5a.cza1_bee
qr1000.L5
qr1000.L5: range queries with 1000 insert/s per client. Graphs for performance per 1-second interval are here.
Average throughput:
Query response time histogram: each cell has the percentage of responses that take <= the time in the header and max is the max response time in seconds. For max values in the top 25% of the range have a red background and in the bottom 25% of the range have a green background. The red background is not used when the min value is within 80% of the max value.
| dbms | 256us | 1ms | 4ms | 16ms | 64ms | 256ms | 1s | 4s | 16s | gt | max |
|---|---|---|---|---|---|---|---|---|---|---|---|
| fbmy5635_rel_240606_4f3a57a1.cza1_bee | 3.119 | 63.066 | 32.668 | 1.145 | 0.002 | 0.062 | |||||
| fbmy8028_rel_240606_c6c83b18.cza1_bee | 0.095 | 67.653 | 12.616 | 19.633 | 0.003 | nonzero | 0.065 | ||||
| fbmy8032_rel_240606_59f03d5a.cza1_bee | 0.948 | 66.411 | 26.886 | 5.754 | 0.001 | nonzero | 0.065 |
Insert response time histogram: each cell has the percentage of responses that take <= the time in the header and max is the max response time in seconds. For max values in the top 25% of the range have a red background and in the bottom 25% of the range have a green background. The red background is not used when the min value is within 80% of the max value.
| dbms | 256us | 1ms | 4ms | 16ms | 64ms | 256ms | 1s | 4s | 16s | gt | max |
|---|---|---|---|---|---|---|---|---|---|---|---|
| fbmy5635_rel_240606_4f3a57a1.cza1_bee | 99.467 | 0.528 | 0.006 | 0.064 | |||||||
| fbmy8028_rel_240606_c6c83b18.cza1_bee | 99.681 | 0.264 | 0.056 | 0.055 | |||||||
| fbmy8032_rel_240606_59f03d5a.cza1_bee | 99.494 | 0.447 | 0.058 | 0.053 |
Delete response time histogram: each cell has the percentage of responses that take <= the time in the header and max is the max response time in seconds. For max values in the top 25% of the range have a red background and in the bottom 25% of the range have a green background. The red background is not used when the min value is within 80% of the max value.
| dbms | 256us | 1ms | 4ms | 16ms | 64ms | 256ms | 1s | 4s | 16s | gt | max |
|---|---|---|---|---|---|---|---|---|---|---|---|
| fbmy5635_rel_240606_4f3a57a1.cza1_bee | 98.381 | 1.592 | 0.025 | 0.003 | 0.081 | ||||||
| fbmy8028_rel_240606_c6c83b18.cza1_bee | 98.367 | 1.569 | 0.064 | 0.041 | |||||||
| fbmy8032_rel_240606_59f03d5a.cza1_bee | 98.436 | 1.503 | 0.061 | 0.044 |
Performance metrics for the DBMS listed above. Some are normalized by throughput, others are not. Legend for results is here.
ips	qps	rps	rmbps	wps	wmbps	rpq	rkbpq	wpi	wkbpi	csps	cpups	cspq	cpupq	dbgb1	dbgb2	rss	maxop	p50	p99	tag
998	825	137	1.5	23.1	8.4	0.167	1.849	0.023	8.583	4008	16.4	4.858	1590	55.7	56.6	7.9	0.062	815	623	fbmy5635_rel_240606_4f3a57a1.cza1_bee
998	592	134	1.4	25.2	8.3	0.226	2.452	0.025	8.475	3260	16.7	5.506	2256	55.7	56.7	7.9	0.065	591	463	fbmy8028_rel_240606_c6c83b18.cza1_bee
998	808	135	1.5	27.3	8.4	0.167	1.883	0.027	8.578	4269	16.7	5.283	1653	55.6	56.7	8.1	0.065	799	608	fbmy8032_rel_240606_59f03d5a.cza1_bee
qp1000.L6
qp1000.L6: point queries with 1000 insert/s per client. Graphs for performance per 1-second interval are here.
Average throughput:
Query response time histogram: each cell has the percentage of responses that take <= the time in the header and max is the max response time in seconds. For max values in the top 25% of the range have a red background and in the bottom 25% of the range have a green background. The red background is not used when the min value is within 80% of the max value.
| dbms | 256us | 1ms | 4ms | 16ms | 64ms | 256ms | 1s | 4s | 16s | gt | max |
|---|---|---|---|---|---|---|---|---|---|---|---|
| fbmy5635_rel_240606_4f3a57a1.cza1_bee | 11.592 | 88.319 | 0.089 | nonzero | 0.043 | ||||||
| fbmy8028_rel_240606_c6c83b18.cza1_bee | 1.939 | 97.906 | 0.154 | 0.001 | 0.034 | ||||||
| fbmy8032_rel_240606_59f03d5a.cza1_bee | 2.952 | 96.914 | 0.134 | nonzero | 0.017 |
Insert response time histogram: each cell has the percentage of responses that take <= the time in the header and max is the max response time in seconds. For max values in the top 25% of the range have a red background and in the bottom 25% of the range have a green background. The red background is not used when the min value is within 80% of the max value.
| dbms | 256us | 1ms | 4ms | 16ms | 64ms | 256ms | 1s | 4s | 16s | gt | max |
|---|---|---|---|---|---|---|---|---|---|---|---|
| fbmy5635_rel_240606_4f3a57a1.cza1_bee | 99.656 | 0.342 | 0.003 | 0.060 | |||||||
| fbmy8028_rel_240606_c6c83b18.cza1_bee | 99.506 | 0.492 | 0.003 | 0.069 | |||||||
| fbmy8032_rel_240606_59f03d5a.cza1_bee | 99.072 | 0.925 | 0.003 | 0.075 |
Delete response time histogram: each cell has the percentage of responses that take <= the time in the header and max is the max response time in seconds. For max values in the top 25% of the range have a red background and in the bottom 25% of the range have a green background. The red background is not used when the min value is within 80% of the max value.
| dbms | 256us | 1ms | 4ms | 16ms | 64ms | 256ms | 1s | 4s | 16s | gt | max |
|---|---|---|---|---|---|---|---|---|---|---|---|
| fbmy5635_rel_240606_4f3a57a1.cza1_bee | 99.542 | 0.453 | 0.006 | 0.059 | |||||||
| fbmy8028_rel_240606_c6c83b18.cza1_bee | 99.356 | 0.642 | 0.003 | 0.076 | |||||||
| fbmy8032_rel_240606_59f03d5a.cza1_bee | 99.017 | 0.981 | 0.003 | 0.041 |
Performance metrics for the DBMS listed above. Some are normalized by throughput, others are not. Legend for results is here.
ips	qps	rps	rmbps	wps	wmbps	rpq	rkbpq	wpi	wkbpi	csps	cpups	cspq	cpupq	dbgb1	dbgb2	rss	maxop	p50	p99	tag
998	791	7130	56.5	26.5	8.1	9.017	73.164	0.027	8.340	18621	11.6	23.550	1174	55.8	57.1	8.6	0.043	799	607	fbmy5635_rel_240606_4f3a57a1.cza1_bee
998	702	7340	60.9	52.0	17.2	10.463	88.900	0.052	17.605	18938	16.5	26.997	1882	56.4	57.8	8.8	0.034	703	511	fbmy8028_rel_240606_c6c83b18.cza1_bee
998	726	7321	60.4	46.0	14.9	10.081	85.170	0.046	15.302	19166	15.7	26.392	1730	55.7	57.2	8.8	0.017	735	543	fbmy8032_rel_240606_59f03d5a.cza1_bee
l.i0
l.i0: load without secondary indexes
Performance metrics for all DBMS, not just the ones listed above. Some are normalized by throughput, others are not. Legend for results is here.
ips	qps	rps	rmbps	wps	wmbps	rpq	rkbpq	wpi	wkbpi	csps	cpups	cspq	cpupq	dbgb1	dbgb2	rss	maxop	p50	p99	tag
78301	0	0	0.0	43.1	13.9	0.000	0.000	0.001	0.182	7721	23.1	0.099	24	23.0	23.6	1.5	0.227	78510	71518	fbmy5635_rel_240606_4f3a57a1.cza1_bee
57021	0	0	0.0	44.9	13.0	0.000	0.000	0.001	0.233	5998	22.9	0.105	32	23.0	23.8	2.0	0.116	57135	50544	fbmy8028_rel_240606_c6c83b18.cza1_bee
53544	0	0	0.0	42.7	12.2	0.000	0.000	0.001	0.233	5844	22.3	0.109	33	23.0	23.8	2.0	0.091	53538	48447	fbmy8032_rel_240606_59f03d5a.cza1_bee
l.x
l.x: create secondary indexes
Performance metrics for all DBMS, not just the ones listed above. Some are normalized by throughput, others are not. Legend for results is here.
ips	qps	rps	rmbps	wps	wmbps	rpq	rkbpq	wpi	wkbpi	csps	cpups	cspq	cpupq	dbgb1	dbgb2	rss	maxop	p50	p99	tag
80808	0	107	16.6	35.4	12.6	0.001	0.210	0.000	0.159	265	11.7	0.003	12	51.0	51.6	8.8	0.002	NA	NA	fbmy5635_rel_240606_4f3a57a1.cza1_bee
72886	0	96	14.9	31.4	11.1	0.001	0.210	0.000	0.156	389	11.7	0.005	13	50.9	51.7	10.3	0.003	NA	NA	fbmy8028_rel_240606_c6c83b18.cza1_bee
71736	0	95	14.7	30.8	10.9	0.001	0.210	0.000	0.156	604	11.7	0.008	13	50.9	51.7	10.4	0.004	NA	NA	fbmy8032_rel_240606_59f03d5a.cza1_bee
l.i1
l.i1: continue load after secondary indexes created with 50 inserts per transaction
Performance metrics for all DBMS, not just the ones listed above. Some are normalized by throughput, others are not. Legend for results is here.
ips	qps	rps	rmbps	wps	wmbps	rpq	rkbpq	wpi	wkbpi	csps	cpups	cspq	cpupq	dbgb1	dbgb2	rss	maxop	p50	p99	tag
14001	0	2380	15.7	111.0	41.1	0.170	1.150	0.008	3.009	10972	41.7	0.784	238	55.2	56.7	8.0	0.070	16690	0	fbmy5635_rel_240606_4f3a57a1.cza1_bee
12304	0	2018	13.2	102.3	36.7	0.164	1.099	0.008	3.057	9760	40.4	0.793	263	55.3	56.9	8.0	0.084	14983	0	fbmy8028_rel_240606_c6c83b18.cza1_bee
18026	0	3522	22.0	167.0	60.9	0.195	1.249	0.009	3.461	15262	58.3	0.847	259	62.1	63.8	8.1	0.084	19429	5931	fbmy8032_rel_240606_59f03d5a.cza1_bee
l.i2
l.i2: continue load after secondary indexes created with 5 inserts per transaction
Performance metrics for all DBMS, not just the ones listed above. Some are normalized by throughput, others are not. Legend for results is here.
ips	qps	rps	rmbps	wps	wmbps	rpq	rkbpq	wpi	wkbpi	csps	cpups	cspq	cpupq	dbgb1	dbgb2	rss	maxop	p50	p99	tag
4474	0	1467	10.0	63.6	23.3	0.328	2.286	0.014	5.342	22101	32.9	4.940	588	56.4	56.7	7.6	0.080	4998	20	fbmy5635_rel_240606_4f3a57a1.cza1_bee
4372	0	1613	10.7	63.6	23.2	0.369	2.501	0.015	5.433	22021	34.6	5.036	633	55.3	55.7	8.0	0.083	4998	0	fbmy8028_rel_240606_c6c83b18.cza1_bee
5777	0	1988	13.7	99.4	35.9	0.344	2.434	0.017	6.368	28782	43.6	4.982	604	55.1	55.5	8.0	0.070	5779	3966	fbmy8032_rel_240606_59f03d5a.cza1_bee
qr100.L1
qr100.L1: range queries with 100 insert/s per client
Performance metrics for all DBMS, not just the ones listed above. Some are normalized by throughput, others are not. Legend for results is here.
ips	qps	rps	rmbps	wps	wmbps	rpq	rkbpq	wpi	wkbpi	csps	cpups	cspq	cpupq	dbgb1	dbgb2	rss	maxop	p50	p99	tag
100	867	510	3.3	12.1	3.5	0.588	3.901	0.121	35.415	4490	14.9	5.179	1375	54.9	55.0	7.9	0.179	688	527	fbmy5635_rel_240606_4f3a57a1.cza1_bee
100	622	16	0.2	5.1	0.7	0.025	0.380	0.051	7.471	2728	12.5	4.388	1608	55.0	55.3	8.1	0.060	623	527	fbmy8028_rel_240606_c6c83b18.cza1_bee
100	457	14	0.2	5.0	0.7	0.031	0.482	0.050	6.769	2262	12.1	4.950	2118	55.1	55.3	8.5	0.063	463	384	fbmy8032_rel_240606_59f03d5a.cza1_bee
qp100.L2
qp100.L2: point queries with 100 insert/s per client
Performance metrics for all DBMS, not just the ones listed above. Some are normalized by throughput, others are not. Legend for results is here.
ips	qps	rps	rmbps	wps	wmbps	rpq	rkbpq	wpi	wkbpi	csps	cpups	cspq	cpupq	dbgb1	dbgb2	rss	maxop	p50	p99	tag
100	819	6720	51.6	4.9	0.6	8.205	64.513	0.049	6.053	17168	7.3	20.962	713	55.0	55.0	9.1	0.043	815	640	fbmy5635_rel_240606_4f3a57a1.cza1_bee
100	713	5913	45.6	5.7	0.9	8.289	65.390	0.057	8.806	15363	7.1	21.535	796	55.0	55.3	9.3	0.025	719	559	fbmy8028_rel_240606_c6c83b18.cza1_bee
100	748	6748	50.9	13.8	3.6	9.027	69.670	0.139	37.413	17495	10.8	23.401	1156	54.9	55.1	9.5	0.027	751	655	fbmy8032_rel_240606_59f03d5a.cza1_bee
qr500.L3
qr500.L3: range queries with 500 insert/s per client
Performance metrics for all DBMS, not just the ones listed above. Some are normalized by throughput, others are not. Legend for results is here.
ips	qps	rps	rmbps	wps	wmbps	rpq	rkbpq	wpi	wkbpi	csps	cpups	cspq	cpupq	dbgb1	dbgb2	rss	maxop	p50	p99	tag
499	1494	426	2.9	18.5	5.9	0.285	1.958	0.037	12.047	6877	15.9	4.602	851	55.0	55.3	7.9	0.204	1550	943	fbmy5635_rel_240606_4f3a57a1.cza1_bee
499	540	273	2.2	16.4	5.0	0.505	4.075	0.033	10.348	3107	15.6	5.750	2309	55.0	55.5	8.2	0.155	543	448	fbmy8028_rel_240606_c6c83b18.cza1_bee
499	980	172	1.3	16.2	4.5	0.175	1.323	0.032	9.287	4735	14.9	4.833	1217	55.0	55.5	8.1	0.129	975	800	fbmy8032_rel_240606_59f03d5a.cza1_bee
qp500.L4
qp500.L4: point queries with 500 insert/s per client
Performance metrics for all DBMS, not just the ones listed above. Some are normalized by throughput, others are not. Legend for results is here.
ips	qps	rps	rmbps	wps	wmbps	rpq	rkbpq	wpi	wkbpi	csps	cpups	cspq	cpupq	dbgb1	dbgb2	rss	maxop	p50	p99	tag
499	796	6744	52.6	14.4	3.8	8.474	67.676	0.029	7.893	17548	9.1	22.048	915	55.1	55.6	8.5	0.025	799	592	fbmy5635_rel_240606_4f3a57a1.cza1_bee
499	706	6204	48.2	16.5	4.6	8.784	69.920	0.033	9.332	16204	9.7	22.942	1099	55.1	55.8	8.6	0.021	703	543	fbmy8028_rel_240606_c6c83b18.cza1_bee
499	736	6372	49.7	16.1	4.3	8.653	69.054	0.032	8.850	16836	10.2	22.862	1108	55.0	55.7	8.7	0.061	735	623	fbmy8032_rel_240606_59f03d5a.cza1_bee
qr1000.L5
qr1000.L5: range queries with 1000 insert/s per client
Performance metrics for all DBMS, not just the ones listed above. Some are normalized by throughput, others are not. Legend for results is here.
ips	qps	rps	rmbps	wps	wmbps	rpq	rkbpq	wpi	wkbpi	csps	cpups	cspq	cpupq	dbgb1	dbgb2	rss	maxop	p50	p99	tag
998	825	137	1.5	23.1	8.4	0.167	1.849	0.023	8.583	4008	16.4	4.858	1590	55.7	56.6	7.9	0.062	815	623	fbmy5635_rel_240606_4f3a57a1.cza1_bee
998	592	134	1.4	25.2	8.3	0.226	2.452	0.025	8.475	3260	16.7	5.506	2256	55.7	56.7	7.9	0.065	591	463	fbmy8028_rel_240606_c6c83b18.cza1_bee
998	808	135	1.5	27.3	8.4	0.167	1.883	0.027	8.578	4269	16.7	5.283	1653	55.6	56.7	8.1	0.065	799	608	fbmy8032_rel_240606_59f03d5a.cza1_bee
qp1000.L6
qp1000.L6: point queries with 1000 insert/s per client
Performance metrics for all DBMS, not just the ones listed above. Some are normalized by throughput, others are not. Legend for results is here.
ips	qps	rps	rmbps	wps	wmbps	rpq	rkbpq	wpi	wkbpi	csps	cpups	cspq	cpupq	dbgb1	dbgb2	rss	maxop	p50	p99	tag
998	791	7130	56.5	26.5	8.1	9.017	73.164	0.027	8.340	18621	11.6	23.550	1174	55.8	57.1	8.6	0.043	799	607	fbmy5635_rel_240606_4f3a57a1.cza1_bee
998	702	7340	60.9	52.0	17.2	10.463	88.900	0.052	17.605	18938	16.5	26.997	1882	56.4	57.8	8.8	0.034	703	511	fbmy8028_rel_240606_c6c83b18.cza1_bee
998	726	7321	60.4	46.0	14.9	10.081	85.170	0.046	15.302	19166	15.7	26.392	1730	55.7	57.2	8.8	0.017	735	543	fbmy8032_rel_240606_59f03d5a.cza1_bee
l.i0
- l.i0: load without secondary indexes
- Legend for results is here.
- Each entry lists the percentage of responses that fit in that bucket (slower than max time for previous bucket, faster than min time for next bucket).
Insert response time histogram
256us	1ms	4ms	16ms	64ms	256ms	1s	4s	16s	gt	max	tag
0.000	0.000	99.869	0.127	0.002	0.002	0.000	0.000	0.000	0.000	0.227	fbmy5635_rel_240606_4f3a57a1.cza1_bee
0.000	0.000	99.722	0.201	0.074	0.004	0.000	0.000	0.000	0.000	0.116	fbmy8028_rel_240606_c6c83b18.cza1_bee
0.000	0.000	99.710	0.209	0.078	0.003	0.000	0.000	0.000	0.000	0.091	fbmy8032_rel_240606_59f03d5a.cza1_bee
l.x
- l.x: create secondary indexes
- Legend for results is here.
- Each entry lists the percentage of responses that fit in that bucket (slower than max time for previous bucket, faster than min time for next bucket).
TODO - determine whether there is data for create index response time
l.i1
- l.i1: continue load after secondary indexes created with 50 inserts per transaction
- Legend for results is here.
- Each entry lists the percentage of responses that fit in that bucket (slower than max time for previous bucket, faster than min time for next bucket).
Insert response time histogram
256us	1ms	4ms	16ms	64ms	256ms	1s	4s	16s	gt	max	tag
0.000	0.000	99.759	0.236	0.005	0.001	0.000	0.000	0.000	0.000	0.070	fbmy5635_rel_240606_4f3a57a1.cza1_bee
0.000	0.000	99.606	0.384	0.009	0.001	0.000	0.000	0.000	0.000	0.084	fbmy8028_rel_240606_c6c83b18.cza1_bee
0.000	0.000	99.553	0.438	0.009	nonzero	0.000	0.000	0.000	0.000	0.084	fbmy8032_rel_240606_59f03d5a.cza1_bee
Delete response time histogram
256us	1ms	4ms	16ms	64ms	256ms	1s	4s	16s	gt	max	tag
0.000	0.000	99.430	0.559	0.010	0.001	0.000	0.000	0.000	0.000	0.129	fbmy5635_rel_240606_4f3a57a1.cza1_bee
0.000	0.000	99.472	0.513	0.013	0.002	0.000	0.000	0.000	0.000	0.087	fbmy8028_rel_240606_c6c83b18.cza1_bee
0.000	0.000	99.237	0.747	0.016	0.001	0.000	0.000	0.000	0.000	0.068	fbmy8032_rel_240606_59f03d5a.cza1_bee
l.i2
- l.i2: continue load after secondary indexes created with 5 inserts per transaction
- Legend for results is here.
- Each entry lists the percentage of responses that fit in that bucket (slower than max time for previous bucket, faster than min time for next bucket).
Insert response time histogram
256us	1ms	4ms	16ms	64ms	256ms	1s	4s	16s	gt	max	tag
0.021	99.863	0.054	0.061	0.001	nonzero	0.000	0.000	0.000	0.000	0.080	fbmy5635_rel_240606_4f3a57a1.cza1_bee
0.000	99.796	0.110	0.093	0.001	nonzero	0.000	0.000	0.000	0.000	0.083	fbmy8028_rel_240606_c6c83b18.cza1_bee
0.000	99.644	0.256	0.098	0.002	nonzero	0.000	0.000	0.000	0.000	0.070	fbmy8032_rel_240606_59f03d5a.cza1_bee
Delete response time histogram
256us	1ms	4ms	16ms	64ms	256ms	1s	4s	16s	gt	max	tag
0.000	99.591	0.282	0.126	0.001	nonzero	0.000	0.000	0.000	0.000	0.080	fbmy5635_rel_240606_4f3a57a1.cza1_bee
0.000	98.405	1.436	0.158	0.002	nonzero	0.000	0.000	0.000	0.000	0.067	fbmy8028_rel_240606_c6c83b18.cza1_bee
0.000	98.006	1.849	0.143	0.003	nonzero	0.000	0.000	0.000	0.000	0.080	fbmy8032_rel_240606_59f03d5a.cza1_bee
qr100.L1
- qr100.L1: range queries with 100 insert/s per client
- Legend for results is here.
- Each entry lists the percentage of responses that fit in that bucket (slower than max time for previous bucket, faster than min time for next bucket).
Query response time histogram
256us	1ms	4ms	16ms	64ms	256ms	1s	4s	16s	gt	max	tag
7.410	72.945	8.099	11.545	0.002	nonzero	0.000	0.000	0.000	0.000	0.179	fbmy5635_rel_240606_4f3a57a1.cza1_bee
0.515	65.942	20.199	13.343	0.002	0.000	0.000	0.000	0.000	0.000	0.060	fbmy8028_rel_240606_c6c83b18.cza1_bee
1.022	65.236	6.714	27.027	0.001	0.000	0.000	0.000	0.000	0.000	0.063	fbmy8032_rel_240606_59f03d5a.cza1_bee
Insert response time histogram
256us	1ms	4ms	16ms	64ms	256ms	1s	4s	16s	gt	max	tag
0.000	0.000	99.111	0.861	0.028	0.000	0.000	0.000	0.000	0.000	0.017	fbmy5635_rel_240606_4f3a57a1.cza1_bee
0.000	0.000	98.833	1.111	0.056	0.000	0.000	0.000	0.000	0.000	0.018	fbmy8028_rel_240606_c6c83b18.cza1_bee
0.000	0.000	95.194	4.778	0.028	0.000	0.000	0.000	0.000	0.000	0.018	fbmy8032_rel_240606_59f03d5a.cza1_bee
Delete response time histogram
256us	1ms	4ms	16ms	64ms	256ms	1s	4s	16s	gt	max	tag
0.000	0.000	82.111	13.611	4.278	0.000	0.000	0.000	0.000	0.000	0.018	fbmy5635_rel_240606_4f3a57a1.cza1_bee
0.000	0.000	90.417	8.944	0.639	0.000	0.000	0.000	0.000	0.000	0.022	fbmy8028_rel_240606_c6c83b18.cza1_bee
0.000	0.000	87.417	11.750	0.833	0.000	0.000	0.000	0.000	0.000	0.018	fbmy8032_rel_240606_59f03d5a.cza1_bee
qp100.L2
- qp100.L2: point queries with 100 insert/s per client
- Legend for results is here.
- Each entry lists the percentage of responses that fit in that bucket (slower than max time for previous bucket, faster than min time for next bucket).
Query response time histogram
256us	1ms	4ms	16ms	64ms	256ms	1s	4s	16s	gt	max	tag
0.000	14.178	85.765	0.056	0.001	0.000	0.000	0.000	0.000	0.000	0.043	fbmy5635_rel_240606_4f3a57a1.cza1_bee
0.000	2.306	97.627	0.067	0.001	0.000	0.000	0.000	0.000	0.000	0.025	fbmy8028_rel_240606_c6c83b18.cza1_bee
0.000	3.770	96.157	0.073	nonzero	0.000	0.000	0.000	0.000	0.000	0.027	fbmy8032_rel_240606_59f03d5a.cza1_bee
Insert response time histogram
256us	1ms	4ms	16ms	64ms	256ms	1s	4s	16s	gt	max	tag
0.000	0.000	98.722	1.250	0.000	0.000	0.028	0.000	0.000	0.000	0.319	fbmy5635_rel_240606_4f3a57a1.cza1_bee
0.000	0.000	98.139	1.861	0.000	0.000	0.000	0.000	0.000	0.000	0.015	fbmy8028_rel_240606_c6c83b18.cza1_bee
0.000	0.000	99.222	0.778	0.000	0.000	0.000	0.000	0.000	0.000	0.012	fbmy8032_rel_240606_59f03d5a.cza1_bee
Delete response time histogram
256us	1ms	4ms	16ms	64ms	256ms	1s	4s	16s	gt	max	tag
0.000	0.000	98.306	1.639	0.028	0.000	0.028	0.000	0.000	0.000	0.320	fbmy5635_rel_240606_4f3a57a1.cza1_bee
0.000	0.000	98.528	1.472	0.000	0.000	0.000	0.000	0.000	0.000	0.015	fbmy8028_rel_240606_c6c83b18.cza1_bee
0.000	0.000	98.722	1.278	0.000	0.000	0.000	0.000	0.000	0.000	0.012	fbmy8032_rel_240606_59f03d5a.cza1_bee
qr500.L3
- qr500.L3: range queries with 500 insert/s per client
- Legend for results is here.
- Each entry lists the percentage of responses that fit in that bucket (slower than max time for previous bucket, faster than min time for next bucket).
Query response time histogram
256us	1ms	4ms	16ms	64ms	256ms	1s	4s	16s	gt	max	tag
6.149	75.567	17.359	0.923	0.001	nonzero	0.000	0.000	0.000	0.000	0.204	fbmy5635_rel_240606_4f3a57a1.cza1_bee
0.193	66.338	17.601	15.864	0.004	nonzero	0.000	0.000	0.000	0.000	0.155	fbmy8028_rel_240606_c6c83b18.cza1_bee
2.279	79.813	11.214	6.693	0.001	nonzero	0.000	0.000	0.000	0.000	0.129	fbmy8032_rel_240606_59f03d5a.cza1_bee
Insert response time histogram
256us	1ms	4ms	16ms	64ms	256ms	1s	4s	16s	gt	max	tag
0.000	0.000	98.750	1.244	0.006	0.000	0.000	0.000	0.000	0.000	0.020	fbmy5635_rel_240606_4f3a57a1.cza1_bee
0.000	0.000	97.456	2.489	0.056	0.000	0.000	0.000	0.000	0.000	0.018	fbmy8028_rel_240606_c6c83b18.cza1_bee
0.000	0.000	98.978	0.956	0.067	0.000	0.000	0.000	0.000	0.000	0.023	fbmy8032_rel_240606_59f03d5a.cza1_bee
Delete response time histogram
256us	1ms	4ms	16ms	64ms	256ms	1s	4s	16s	gt	max	tag
0.000	0.000	97.217	2.728	0.056	0.000	0.000	0.000	0.000	0.000	0.039	fbmy5635_rel_240606_4f3a57a1.cza1_bee
0.000	0.000	94.889	4.967	0.144	0.000	0.000	0.000	0.000	0.000	0.018	fbmy8028_rel_240606_c6c83b18.cza1_bee
0.000	0.000	97.117	2.756	0.128	0.000	0.000	0.000	0.000	0.000	0.028	fbmy8032_rel_240606_59f03d5a.cza1_bee
qp500.L4
- qp500.L4: point queries with 500 insert/s per client
- Legend for results is here.
- Each entry lists the percentage of responses that fit in that bucket (slower than max time for previous bucket, faster than min time for next bucket).
Query response time histogram
256us	1ms	4ms	16ms	64ms	256ms	1s	4s	16s	gt	max	tag
0.000	12.308	87.608	0.084	nonzero	0.000	0.000	0.000	0.000	0.000	0.025	fbmy5635_rel_240606_4f3a57a1.cza1_bee
0.000	2.300	97.599	0.100	nonzero	0.000	0.000	0.000	0.000	0.000	0.021	fbmy8028_rel_240606_c6c83b18.cza1_bee
0.000	3.461	96.445	0.094	0.001	0.000	0.000	0.000	0.000	0.000	0.061	fbmy8032_rel_240606_59f03d5a.cza1_bee
Insert response time histogram
256us	1ms	4ms	16ms	64ms	256ms	1s	4s	16s	gt	max	tag
0.000	0.000	99.656	0.344	0.000	0.000	0.000	0.000	0.000	0.000	0.013	fbmy5635_rel_240606_4f3a57a1.cza1_bee
0.000	0.000	99.439	0.561	0.000	0.000	0.000	0.000	0.000	0.000	0.012	fbmy8028_rel_240606_c6c83b18.cza1_bee
0.000	0.000	98.844	1.150	0.006	0.000	0.000	0.000	0.000	0.000	0.019	fbmy8032_rel_240606_59f03d5a.cza1_bee
Delete response time histogram
256us	1ms	4ms	16ms	64ms	256ms	1s	4s	16s	gt	max	tag
0.000	0.000	99.483	0.511	0.006	0.000	0.000	0.000	0.000	0.000	0.027	fbmy5635_rel_240606_4f3a57a1.cza1_bee
0.000	0.000	99.344	0.650	0.000	0.006	0.000	0.000	0.000	0.000	0.078	fbmy8028_rel_240606_c6c83b18.cza1_bee
0.000	0.000	98.128	1.872	0.000	0.000	0.000	0.000	0.000	0.000	0.016	fbmy8032_rel_240606_59f03d5a.cza1_bee
qr1000.L5
- qr1000.L5: range queries with 1000 insert/s per client
- Legend for results is here.
- Each entry lists the percentage of responses that fit in that bucket (slower than max time for previous bucket, faster than min time for next bucket).
Query response time histogram
256us	1ms	4ms	16ms	64ms	256ms	1s	4s	16s	gt	max	tag
3.119	63.066	32.668	1.145	0.002	0.000	0.000	0.000	0.000	0.000	0.062	fbmy5635_rel_240606_4f3a57a1.cza1_bee
0.095	67.653	12.616	19.633	0.003	nonzero	0.000	0.000	0.000	0.000	0.065	fbmy8028_rel_240606_c6c83b18.cza1_bee
0.948	66.411	26.886	5.754	0.001	nonzero	0.000	0.000	0.000	0.000	0.065	fbmy8032_rel_240606_59f03d5a.cza1_bee
Insert response time histogram
256us	1ms	4ms	16ms	64ms	256ms	1s	4s	16s	gt	max	tag
0.000	0.000	99.467	0.528	0.006	0.000	0.000	0.000	0.000	0.000	0.064	fbmy5635_rel_240606_4f3a57a1.cza1_bee
0.000	0.000	99.681	0.264	0.056	0.000	0.000	0.000	0.000	0.000	0.055	fbmy8028_rel_240606_c6c83b18.cza1_bee
0.000	0.000	99.494	0.447	0.058	0.000	0.000	0.000	0.000	0.000	0.053	fbmy8032_rel_240606_59f03d5a.cza1_bee
Delete response time histogram
256us	1ms	4ms	16ms	64ms	256ms	1s	4s	16s	gt	max	tag
0.000	0.000	98.381	1.592	0.025	0.003	0.000	0.000	0.000	0.000	0.081	fbmy5635_rel_240606_4f3a57a1.cza1_bee
0.000	0.000	98.367	1.569	0.064	0.000	0.000	0.000	0.000	0.000	0.041	fbmy8028_rel_240606_c6c83b18.cza1_bee
0.000	0.000	98.436	1.503	0.061	0.000	0.000	0.000	0.000	0.000	0.044	fbmy8032_rel_240606_59f03d5a.cza1_bee
qp1000.L6
- qp1000.L6: point queries with 1000 insert/s per client
- Legend for results is here.
- Each entry lists the percentage of responses that fit in that bucket (slower than max time for previous bucket, faster than min time for next bucket).
Query response time histogram
256us	1ms	4ms	16ms	64ms	256ms	1s	4s	16s	gt	max	tag
0.000	11.592	88.319	0.089	nonzero	0.000	0.000	0.000	0.000	0.000	0.043	fbmy5635_rel_240606_4f3a57a1.cza1_bee
0.000	1.939	97.906	0.154	0.001	0.000	0.000	0.000	0.000	0.000	0.034	fbmy8028_rel_240606_c6c83b18.cza1_bee
0.000	2.952	96.914	0.134	nonzero	0.000	0.000	0.000	0.000	0.000	0.017	fbmy8032_rel_240606_59f03d5a.cza1_bee
Insert response time histogram
256us	1ms	4ms	16ms	64ms	256ms	1s	4s	16s	gt	max	tag
0.000	0.000	99.656	0.342	0.003	0.000	0.000	0.000	0.000	0.000	0.060	fbmy5635_rel_240606_4f3a57a1.cza1_bee
0.000	0.000	99.506	0.492	0.000	0.003	0.000	0.000	0.000	0.000	0.069	fbmy8028_rel_240606_c6c83b18.cza1_bee
0.000	0.000	99.072	0.925	0.000	0.003	0.000	0.000	0.000	0.000	0.075	fbmy8032_rel_240606_59f03d5a.cza1_bee
Delete response time histogram
256us	1ms	4ms	16ms	64ms	256ms	1s	4s	16s	gt	max	tag
0.000	0.000	99.542	0.453	0.006	0.000	0.000	0.000	0.000	0.000	0.059	fbmy5635_rel_240606_4f3a57a1.cza1_bee
0.000	0.000	99.356	0.642	0.000	0.003	0.000	0.000	0.000	0.000	0.076	fbmy8028_rel_240606_c6c83b18.cza1_bee
0.000	0.000	99.017	0.981	0.003	0.000	0.000	0.000	0.000	0.000	0.041	fbmy8032_rel_240606_59f03d5a.cza1_bee