Introduction
This is a report for the insert benchmark with 30M docs and 1 client(s). It is generated by scripts (bash, awk, sed) and Tufte might not be impressed. An overview of the insert benchmark is here and a short update is here. Below, by DBMS, I mean DBMS+version.config. An example is my8020.c10b40 where my means MySQL, 8020 is version 8.0.20 and c10b40 is the name for the configuration file.
The test server has 8 AMD cores, 16G RAM and an NVMe SSD. It is described here as the Beelink. The benchmark was run with 1 client and there were 1 or 3 connections per client (1 for queries or inserts without rate limits, 1+1 for rate limited inserts+deletes). It uses 1 table. It loads 30M rows per table without secondary indexes, creates 3 secondary indexes per table, then inserts 40m+10m rows per table with a delete per insert to avoid growing the table. It then does 6 read+write tests for 1800s each that do queries as fast as possible with 100,100,500,500,1000,1000 inserts/s and the same for deletes/s per client concurrent with the queries. The database is cached in memory. Clients and the DBMS share one server. The per-database configs are in the per-database subdirectories here.
The tested DBMS are:
- my5651_rel.cz11a_c8r32 - MySQL 5.6.51 with the cz11a_c8r32 config
- my5744_rel.cz11a_c8r32 - MySQL 5.7.44 with the cz11a_c8r32 config
- my8028_rel.cz11a_c8r32 - MySQL 8.0.28 with the cz11a_c8r32 config
- my8032_rel.cz11a_c8r32 - MySQL 8.0.32 with the cz11a_c8r32 config
- my8036_rel.cz11a_c8r32 - MySQL 8.0.36 with the cz11a_c8r32 config
- my8037_rel.cz11a_c8r32 - MySQL 8.0.37 with the cz11a_c8r32 config
Contents
- Summary
- l.i0: load without secondary indexes
- l.x: create secondary indexes
- l.i1: continue load after secondary indexes created with 50 inserts per transaction
- l.i2: continue load after secondary indexes created with 5 inserts per transaction
- qr100.L1: range queries with 100 insert/s per client
- qp100.L2: point queries with 100 insert/s per client
- qr500.L3: range queries with 500 insert/s per client
- qp500.L4: point queries with 500 insert/s per client
- qr1000.L5: range queries with 1000 insert/s per client
- qp1000.L6: point queries with 1000 insert/s per client
Summary
The numbers are inserts/s for l.i0, l.i1 and l.i2, indexed docs (or rows) /s for l.x and queries/s for qr100, qp100 thru qr1000, qp1000" The values are the average rate over the entire test for inserts (IPS) and queries (QPS). The range of values for IPS and QPS is split into 3 parts: bottom 25%, middle 50%, top 25%. Values in the bottom 25% have a red background, values in the top 25% have a green background and values in the middle have no color. A gray background is used for values that can be ignored because the DBMS did not sustain the target insert rate. Red backgrounds are not used when the minimum value is within 80% of the max value.
| dbms | l.i0 | l.x | l.i1 | l.i2 | qr100 | qp100 | qr500 | qp500 | qr1000 | qp1000 |
|---|---|---|---|---|---|---|---|---|---|---|
| my5651_rel.cz11a_c8r32 | 172414 | 143541 | 32949 | 21739 | 10749 | 8804 | 10647 | 8778 | 10843 | 8833 |
| my5744_rel.cz11a_c8r32 | 153061 | 223881 | 34843 | 21882 | 8954 | 7627 | 9040 | 7575 | 8975 | 7553 |
| my8028_rel.cz11a_c8r32 | 119048 | 300001 | 35971 | 20000 | 7731 | 6547 | 7729 | 6567 | 7764 | 6505 |
| my8032_rel.cz11a_c8r32 | 104895 | 277779 | 31898 | 18248 | 7235 | 6051 | 7207 | 6018 | 7176 | 6024 |
| my8036_rel.cz11a_c8r32 | 103093 | 260870 | 32128 | 18248 | 8177 | 6080 | 8159 | 6105 | 8110 | 6108 |
| my8037_rel.cz11a_c8r32 | 105263 | 280375 | 32284 | 18349 | 8056 | 6133 | 8084 | 6058 | 8075 | 6075 |
This table has relative throughput, throughput for the DBMS relative to the DBMS in the first line, using the absolute throughput from the previous table. Values less than 0.95 have a yellow background. Values greater than 1.05 have a blue background.
| dbms | l.i0 | l.x | l.i1 | l.i2 | qr100 | qp100 | qr500 | qp500 | qr1000 | qp1000 |
|---|---|---|---|---|---|---|---|---|---|---|
| my5651_rel.cz11a_c8r32 | 1.00 | 1.00 | 1.00 | 1.00 | 1.00 | 1.00 | 1.00 | 1.00 | 1.00 | 1.00 |
| my5744_rel.cz11a_c8r32 | 0.89 | 1.56 | 1.06 | 1.01 | 0.83 | 0.87 | 0.85 | 0.86 | 0.83 | 0.86 |
| my8028_rel.cz11a_c8r32 | 0.69 | 2.09 | 1.09 | 0.92 | 0.72 | 0.74 | 0.73 | 0.75 | 0.72 | 0.74 |
| my8032_rel.cz11a_c8r32 | 0.61 | 1.94 | 0.97 | 0.84 | 0.67 | 0.69 | 0.68 | 0.69 | 0.66 | 0.68 |
| my8036_rel.cz11a_c8r32 | 0.60 | 1.82 | 0.98 | 0.84 | 0.76 | 0.69 | 0.77 | 0.70 | 0.75 | 0.69 |
| my8037_rel.cz11a_c8r32 | 0.61 | 1.95 | 0.98 | 0.84 | 0.75 | 0.70 | 0.76 | 0.69 | 0.74 | 0.69 |
This lists the average rate of inserts/s for the tests that do inserts concurrent with queries. For such tests the query rate is listed in the table above. The read+write tests are setup so that the insert rate should match the target rate every second. Cells that are not at least 95% of the target have a red background to indicate a failure to satisfy the target.
| dbms | qr100.L1 | qp100.L2 | qr500.L3 | qp500.L4 | qr1000.L5 | qp1000.L6 |
|---|---|---|---|---|---|---|
| my5651_rel.cz11a_c8r32 | 100 | 100 | 499 | 499 | 999 | 999 |
| my5744_rel.cz11a_c8r32 | 100 | 100 | 499 | 499 | 999 | 999 |
| my8028_rel.cz11a_c8r32 | 100 | 100 | 499 | 499 | 999 | 999 |
| my8032_rel.cz11a_c8r32 | 100 | 100 | 499 | 499 | 999 | 999 |
| my8036_rel.cz11a_c8r32 | 100 | 100 | 499 | 499 | 999 | 999 |
| my8037_rel.cz11a_c8r32 | 100 | 100 | 499 | 499 | 999 | 999 |
| target | 100 | 100 | 500 | 500 | 1000 | 1000 |
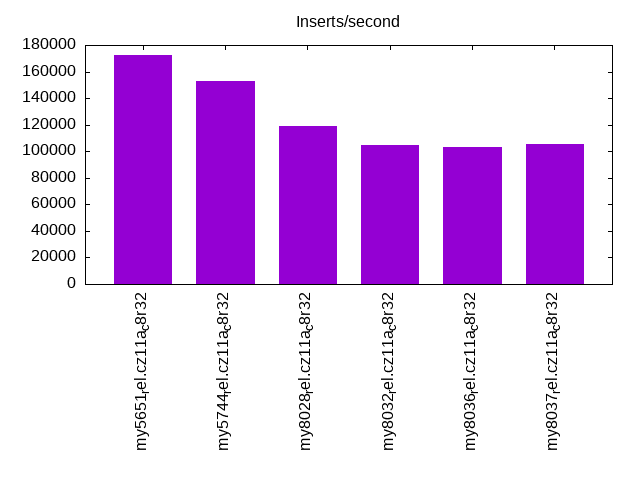
l.i0
l.i0: load without secondary indexes. Graphs for performance per 1-second interval are here.
Average throughput:
Insert response time histogram: each cell has the percentage of responses that take <= the time in the header and max is the max response time in seconds. For the max column values in the top 25% of the range have a red background and in the bottom 25% of the range have a green background. The red background is not used when the min value is within 80% of the max value.
| dbms | 256us | 1ms | 4ms | 16ms | 64ms | 256ms | 1s | 4s | 16s | gt | max |
|---|---|---|---|---|---|---|---|---|---|---|---|
| my5651_rel.cz11a_c8r32 | 99.264 | 0.673 | 0.048 | 0.014 | 0.001 | 0.152 | |||||
| my5744_rel.cz11a_c8r32 | 99.535 | 0.198 | 0.137 | 0.130 | 0.001 | 0.090 | |||||
| my8028_rel.cz11a_c8r32 | 99.285 | 0.344 | 0.239 | 0.131 | 0.002 | 0.091 | |||||
| my8032_rel.cz11a_c8r32 | 98.608 | 0.995 | 0.263 | 0.133 | 0.002 | 0.082 | |||||
| my8036_rel.cz11a_c8r32 | 96.662 | 2.937 | 0.263 | 0.137 | 0.002 | 0.082 | |||||
| my8037_rel.cz11a_c8r32 | 98.545 | 1.059 | 0.255 | 0.139 | 0.002 | 0.082 |
Performance metrics for the DBMS listed above. Some are normalized by throughput, others are not. Legend for results is here.
ips	qps	rps	rmbps	wps	wmbps	rpq	rkbpq	wpi	wkbpi	csps	cpups	cspq	cpupq	dbgb1	dbgb2	rss	maxop	p50	p99	tag
172414	0	0	0.0	2.1	0.0	0.000	0.000	0.000	0.000	19696	20.8	0.114	10	2.0	32.5	3.3	0.152	176105	110068	my5651_rel.cz11a_c8r32
153061	0	0	0.0	1.8	0.0	0.000	0.000	0.000	0.000	15336	20.6	0.100	11	2.0	32.5	3.8	0.090	154033	140650	my5744_rel.cz11a_c8r32
119048	0	0	0.0	1.6	0.0	0.000	0.000	0.000	0.000	12868	18.7	0.108	13	2.0	32.6	4.0	0.091	120071	103986	my8028_rel.cz11a_c8r32
104895	0	0	0.0	1.6	0.0	0.000	0.000	0.000	0.000	11765	17.8	0.112	14	2.0	32.6	4.1	0.082	106384	93698	my8032_rel.cz11a_c8r32
103093	0	0	0.0	1.9	0.0	0.000	0.000	0.000	0.000	11557	17.8	0.112	14	2.0	32.6	4.0	0.082	103886	87911	my8036_rel.cz11a_c8r32
105263	0	0	0.0	1.4	0.0	0.000	0.000	0.000	0.000	11762	17.9	0.112	14	2.0	32.6	4.1	0.082	106084	94099	my8037_rel.cz11a_c8r32
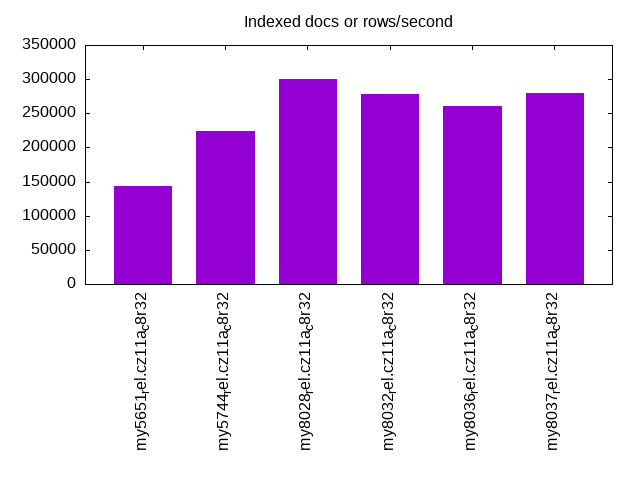
l.x
l.x: create secondary indexes.
Average throughput:
Performance metrics for the DBMS listed above. Some are normalized by throughput, others are not. Legend for results is here.
ips	qps	rps	rmbps	wps	wmbps	rpq	rkbpq	wpi	wkbpi	csps	cpups	cspq	cpupq	dbgb1	dbgb2	rss	maxop	p50	p99	tag
143541	0	0	0.0	1.6	0.0	0.000	0.000	0.000	0.000	4319	9.7	0.030	5	4.2	34.7	5.2	0.001	NA	NA	my5651_rel.cz11a_c8r32
223881	0	0	0.0	1.4	0.0	0.000	0.000	0.000	0.000	12782	12.1	0.057	4	4.6	35.1	5.5	0.001	NA	NA	my5744_rel.cz11a_c8r32
300001	0	0	0.0	1.2	0.0	0.000	0.000	0.000	0.000	22256	39.5	0.074	11	4.5	35.1	6.1	0.001	NA	NA	my8028_rel.cz11a_c8r32
277779	0	0	0.0	1.2	0.0	0.000	0.000	0.000	0.000	18397	39.1	0.066	11	4.5	35.1	5.3	0.002	NA	NA	my8032_rel.cz11a_c8r32
260870	0	0	0.0	1.6	0.0	0.000	0.000	0.000	0.000	17205	39.7	0.066	12	4.5	35.1	4.8	0.002	NA	NA	my8036_rel.cz11a_c8r32
280375	0	0	0.0	1.8	0.0	0.000	0.000	0.000	0.000	19419	38.8	0.069	11	4.5	35.1	5.5	0.002	NA	NA	my8037_rel.cz11a_c8r32
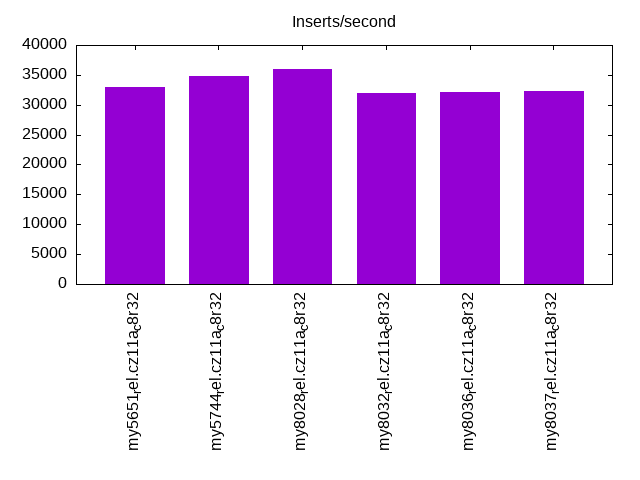
l.i1
l.i1: continue load after secondary indexes created with 50 inserts per transaction. Graphs for performance per 1-second interval are here.
Average throughput:
Insert response time histogram: each cell has the percentage of responses that take <= the time in the header and max is the max response time in seconds. For the max column values in the top 25% of the range have a red background and in the bottom 25% of the range have a green background. The red background is not used when the min value is within 80% of the max value.
| dbms | 256us | 1ms | 4ms | 16ms | 64ms | 256ms | 1s | 4s | 16s | gt | max |
|---|---|---|---|---|---|---|---|---|---|---|---|
| my5651_rel.cz11a_c8r32 | 10.339 | 87.672 | 1.813 | 0.175 | 0.001 | 0.081 | |||||
| my5744_rel.cz11a_c8r32 | 3.927 | 94.388 | 1.644 | 0.041 | 0.001 | 0.093 | |||||
| my8028_rel.cz11a_c8r32 | nonzero | 98.636 | 1.294 | 0.069 | 0.001 | 0.094 | |||||
| my8032_rel.cz11a_c8r32 | 98.280 | 1.623 | 0.095 | 0.001 | 0.102 | ||||||
| my8036_rel.cz11a_c8r32 | 98.317 | 1.593 | 0.089 | 0.001 | 0.102 | ||||||
| my8037_rel.cz11a_c8r32 | 98.339 | 1.575 | 0.085 | 0.001 | nonzero | 0.278 |
Delete response time histogram: each cell has the percentage of responses that take <= the time in the header and max is the max response time in seconds. For the max column values in the top 25% of the range have a red background and in the bottom 25% of the range have a green background. The red background is not used when the min value is within 80% of the max value.
| dbms | 256us | 1ms | 4ms | 16ms | 64ms | 256ms | 1s | 4s | 16s | gt | max |
|---|---|---|---|---|---|---|---|---|---|---|---|
| my5651_rel.cz11a_c8r32 | 77.275 | 21.465 | 1.121 | 0.138 | 0.001 | 0.080 | |||||
| my5744_rel.cz11a_c8r32 | 66.862 | 31.856 | 1.267 | 0.015 | 0.001 | 0.093 | |||||
| my8028_rel.cz11a_c8r32 | 93.557 | 5.391 | 1.035 | 0.016 | 0.001 | 0.078 | |||||
| my8032_rel.cz11a_c8r32 | 51.503 | 47.191 | 1.277 | 0.029 | 0.001 | 0.108 | |||||
| my8036_rel.cz11a_c8r32 | 64.976 | 33.737 | 1.264 | 0.022 | 0.001 | 0.101 | |||||
| my8037_rel.cz11a_c8r32 | 65.264 | 33.476 | 1.234 | 0.026 | 0.001 | nonzero | 0.284 |
Performance metrics for the DBMS listed above. Some are normalized by throughput, others are not. Legend for results is here.
ips	qps	rps	rmbps	wps	wmbps	rpq	rkbpq	wpi	wkbpi	csps	cpups	cspq	cpupq	dbgb1	dbgb2	rss	maxop	p50	p99	tag
32949	0	0	0.0	1.8	0.0	0.000	0.000	0.000	0.000	36108	40.0	1.096	97	6.2	36.7	7.8	0.081	35012	8990	my5651_rel.cz11a_c8r32
34843	0	0	0.0	1.2	0.0	0.000	0.000	0.000	0.000	25133	45.0	0.721	103	6.3	36.8	8.3	0.093	36261	10439	my5744_rel.cz11a_c8r32
35971	0	0	0.0	1.6	0.0	0.000	0.000	0.000	0.000	45838	35.1	1.274	78	6.7	37.4	9.0	0.094	37708	7941	my8028_rel.cz11a_c8r32
31898	0	0	0.0	1.6	0.0	0.000	0.000	0.000	0.000	45595	35.7	1.429	90	6.6	37.5	9.1	0.102	33614	7299	my8032_rel.cz11a_c8r32
32128	0	0	0.0	1.9	0.0	0.000	0.000	0.000	0.000	45161	35.0	1.406	87	6.6	37.4	9.0	0.102	33896	6643	my8036_rel.cz11a_c8r32
32284	0	0	0.0	1.4	0.0	0.000	0.000	0.000	0.000	45847	35.3	1.420	87	6.6	37.5	9.1	0.278	34013	6642	my8037_rel.cz11a_c8r32
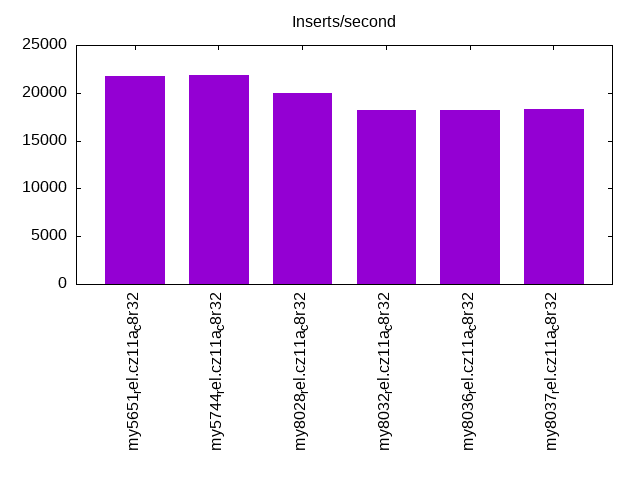
l.i2
l.i2: continue load after secondary indexes created with 5 inserts per transaction. Graphs for performance per 1-second interval are here.
Average throughput:
Insert response time histogram: each cell has the percentage of responses that take <= the time in the header and max is the max response time in seconds. For the max column values in the top 25% of the range have a red background and in the bottom 25% of the range have a green background. The red background is not used when the min value is within 80% of the max value.
| dbms | 256us | 1ms | 4ms | 16ms | 64ms | 256ms | 1s | 4s | 16s | gt | max |
|---|---|---|---|---|---|---|---|---|---|---|---|
| my5651_rel.cz11a_c8r32 | 86.693 | 13.177 | 0.014 | 0.112 | 0.004 | nonzero | 0.067 | ||||
| my5744_rel.cz11a_c8r32 | 88.626 | 11.193 | 0.054 | 0.126 | 0.001 | nonzero | 0.113 | ||||
| my8028_rel.cz11a_c8r32 | 84.660 | 15.226 | 0.003 | 0.111 | nonzero | nonzero | 0.099 | ||||
| my8032_rel.cz11a_c8r32 | 75.291 | 24.577 | 0.004 | 0.127 | 0.001 | nonzero | 0.101 | ||||
| my8036_rel.cz11a_c8r32 | 75.338 | 24.528 | 0.004 | 0.129 | 0.001 | 0.059 | |||||
| my8037_rel.cz11a_c8r32 | 76.605 | 23.258 | 0.004 | 0.131 | 0.001 | nonzero | 0.101 |
Delete response time histogram: each cell has the percentage of responses that take <= the time in the header and max is the max response time in seconds. For the max column values in the top 25% of the range have a red background and in the bottom 25% of the range have a green background. The red background is not used when the min value is within 80% of the max value.
| dbms | 256us | 1ms | 4ms | 16ms | 64ms | 256ms | 1s | 4s | 16s | gt | max |
|---|---|---|---|---|---|---|---|---|---|---|---|
| my5651_rel.cz11a_c8r32 | 96.933 | 2.937 | 0.015 | 0.112 | 0.004 | nonzero | 0.068 | ||||
| my5744_rel.cz11a_c8r32 | 92.118 | 7.750 | 0.009 | 0.122 | 0.001 | nonzero | 0.113 | ||||
| my8028_rel.cz11a_c8r32 | 95.358 | 4.535 | 0.001 | 0.105 | nonzero | nonzero | 0.106 | ||||
| my8032_rel.cz11a_c8r32 | 86.679 | 13.199 | 0.001 | 0.119 | 0.001 | nonzero | 0.101 | ||||
| my8036_rel.cz11a_c8r32 | 87.530 | 12.345 | 0.001 | 0.122 | 0.001 | 0.060 | |||||
| my8037_rel.cz11a_c8r32 | 89.495 | 10.379 | 0.001 | 0.124 | 0.001 | nonzero | 0.101 |
Performance metrics for the DBMS listed above. Some are normalized by throughput, others are not. Legend for results is here.
ips	qps	rps	rmbps	wps	wmbps	rpq	rkbpq	wpi	wkbpi	csps	cpups	cspq	cpupq	dbgb1	dbgb2	rss	maxop	p50	p99	tag
21739	0	0	0.0	2.0	0.0	0.000	0.000	0.000	0.001	177487	39.7	8.164	146	6.2	36.7	7.8	0.067	21802	20623	my5651_rel.cz11a_c8r32
21882	0	0	0.0	1.7	0.0	0.000	0.000	0.000	0.001	86924	38.8	3.972	142	6.3	36.8	8.3	0.113	21976	20619	my5744_rel.cz11a_c8r32
20000	0	0	0.0	1.1	0.0	0.000	0.000	0.000	0.000	92176	33.4	4.609	134	6.7	37.4	9.0	0.099	20091	18810	my8028_rel.cz11a_c8r32
18248	0	0	0.0	0.9	0.0	0.000	0.000	0.000	0.000	86263	33.2	4.727	146	6.6	37.5	9.2	0.101	18267	17156	my8032_rel.cz11a_c8r32
18248	0	0	0.0	1.1	0.0	0.000	0.000	0.000	0.000	86169	33.2	4.722	146	6.6	37.4	9.0	0.059	18295	17466	my8036_rel.cz11a_c8r32
18349	0	0	0.0	1.0	0.0	0.000	0.000	0.000	0.000	87349	33.3	4.761	145	6.6	37.5	9.1	0.101	18406	17081	my8037_rel.cz11a_c8r32
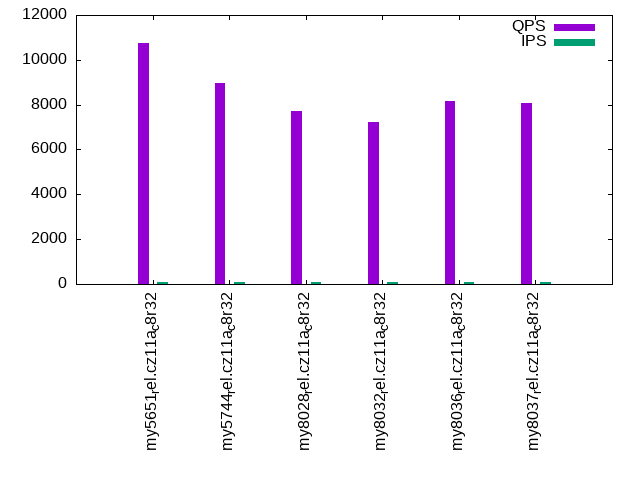
qr100.L1
qr100.L1: range queries with 100 insert/s per client. Graphs for performance per 1-second interval are here.
Average throughput:
Query response time histogram: each cell has the percentage of responses that take <= the time in the header and max is the max response time in seconds. For max values in the top 25% of the range have a red background and in the bottom 25% of the range have a green background. The red background is not used when the min value is within 80% of the max value.
| dbms | 256us | 1ms | 4ms | 16ms | 64ms | 256ms | 1s | 4s | 16s | gt | max |
|---|---|---|---|---|---|---|---|---|---|---|---|
| my5651_rel.cz11a_c8r32 | 99.968 | 0.028 | 0.002 | 0.003 | nonzero | 0.020 | |||||
| my5744_rel.cz11a_c8r32 | 99.981 | 0.019 | nonzero | nonzero | 0.010 | ||||||
| my8028_rel.cz11a_c8r32 | 99.946 | 0.054 | nonzero | 0.001 | |||||||
| my8032_rel.cz11a_c8r32 | 99.924 | 0.076 | nonzero | 0.002 | |||||||
| my8036_rel.cz11a_c8r32 | 99.961 | 0.039 | nonzero | nonzero | 0.012 | ||||||
| my8037_rel.cz11a_c8r32 | 99.966 | 0.034 | nonzero | 0.002 |
Insert response time histogram: each cell has the percentage of responses that take <= the time in the header and max is the max response time in seconds. For max values in the top 25% of the range have a red background and in the bottom 25% of the range have a green background. The red background is not used when the min value is within 80% of the max value.
| dbms | 256us | 1ms | 4ms | 16ms | 64ms | 256ms | 1s | 4s | 16s | gt | max |
|---|---|---|---|---|---|---|---|---|---|---|---|
| my5651_rel.cz11a_c8r32 | 0.500 | 49.194 | 47.250 | 3.056 | 0.033 | ||||||
| my5744_rel.cz11a_c8r32 | 0.694 | 98.833 | 0.472 | 0.015 | |||||||
| my8028_rel.cz11a_c8r32 | 99.861 | 0.139 | 0.013 | ||||||||
| my8032_rel.cz11a_c8r32 | 99.944 | 0.056 | 0.012 | ||||||||
| my8036_rel.cz11a_c8r32 | 99.583 | 0.417 | 0.014 | ||||||||
| my8037_rel.cz11a_c8r32 | 99.722 | 0.278 | 0.013 |
Delete response time histogram: each cell has the percentage of responses that take <= the time in the header and max is the max response time in seconds. For max values in the top 25% of the range have a red background and in the bottom 25% of the range have a green background. The red background is not used when the min value is within 80% of the max value.
| dbms | 256us | 1ms | 4ms | 16ms | 64ms | 256ms | 1s | 4s | 16s | gt | max |
|---|---|---|---|---|---|---|---|---|---|---|---|
| my5651_rel.cz11a_c8r32 | 3.361 | 46.167 | 48.556 | 1.917 | 0.034 | ||||||
| my5744_rel.cz11a_c8r32 | 51.333 | 48.250 | 0.417 | 0.013 | |||||||
| my8028_rel.cz11a_c8r32 | 52.222 | 47.611 | 0.167 | 0.010 | |||||||
| my8032_rel.cz11a_c8r32 | 31.250 | 68.667 | 0.083 | 0.008 | |||||||
| my8036_rel.cz11a_c8r32 | 37.389 | 62.139 | 0.472 | 0.014 | |||||||
| my8037_rel.cz11a_c8r32 | 46.806 | 52.917 | 0.278 | 0.008 |
Performance metrics for the DBMS listed above. Some are normalized by throughput, others are not. Legend for results is here.
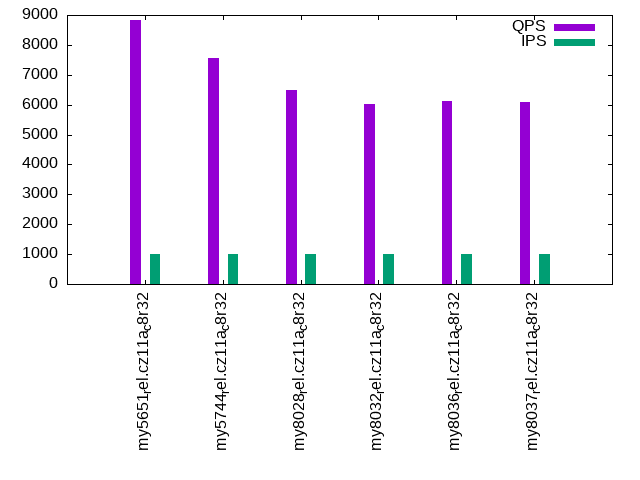
ips	qps	rps	rmbps	wps	wmbps	rpq	rkbpq	wpi	wkbpi	csps	cpups	cspq	cpupq	dbgb1	dbgb2	rss	maxop	p50	p99	tag
100	10749	0	0.0	1.8	0.0	0.000	0.000	0.018	0.118	41738	11.6	3.883	86	6.2	36.7	7.8	0.020	10744	10536	my5651_rel.cz11a_c8r32
100	8954	0	0.0	1.8	0.0	0.000	0.000	0.018	0.118	34866	11.7	3.894	105	6.3	36.8	8.3	0.010	8950	8870	my5744_rel.cz11a_c8r32
100	7731	0	0.0	1.5	0.0	0.000	0.000	0.015	0.091	30347	11.9	3.926	123	6.7	37.4	9.0	0.001	7735	7672	my8028_rel.cz11a_c8r32
100	7235	0	0.0	1.5	0.0	0.000	0.000	0.015	0.092	28664	12.0	3.962	133	6.6	37.5	9.2	0.002	7240	7179	my8032_rel.cz11a_c8r32
100	8177	0	0.0	1.9	0.0	0.000	0.000	0.019	0.125	32205	11.7	3.938	114	6.6	37.4	9.1	0.012	8183	8103	my8036_rel.cz11a_c8r32
100	8056	0	0.0	1.0	0.0	0.000	0.000	0.010	0.067	31716	11.7	3.937	116	6.6	37.5	9.1	0.002	8055	7991	my8037_rel.cz11a_c8r32
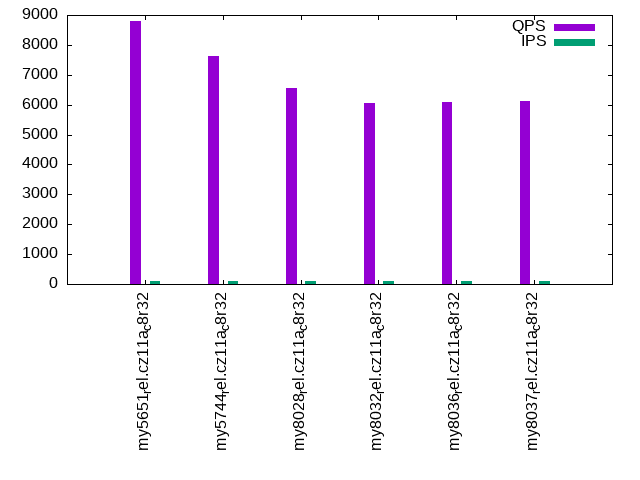
qp100.L2
qp100.L2: point queries with 100 insert/s per client. Graphs for performance per 1-second interval are here.
Average throughput:
Query response time histogram: each cell has the percentage of responses that take <= the time in the header and max is the max response time in seconds. For max values in the top 25% of the range have a red background and in the bottom 25% of the range have a green background. The red background is not used when the min value is within 80% of the max value.
| dbms | 256us | 1ms | 4ms | 16ms | 64ms | 256ms | 1s | 4s | 16s | gt | max |
|---|---|---|---|---|---|---|---|---|---|---|---|
| my5651_rel.cz11a_c8r32 | 99.950 | 0.046 | 0.001 | 0.002 | 0.009 | ||||||
| my5744_rel.cz11a_c8r32 | 99.923 | 0.077 | nonzero | 0.002 | |||||||
| my8028_rel.cz11a_c8r32 | 99.840 | 0.160 | nonzero | 0.002 | |||||||
| my8032_rel.cz11a_c8r32 | 99.827 | 0.173 | nonzero | 0.002 | |||||||
| my8036_rel.cz11a_c8r32 | 99.777 | 0.223 | nonzero | 0.002 | |||||||
| my8037_rel.cz11a_c8r32 | 99.831 | 0.169 | nonzero | 0.001 |
Insert response time histogram: each cell has the percentage of responses that take <= the time in the header and max is the max response time in seconds. For max values in the top 25% of the range have a red background and in the bottom 25% of the range have a green background. The red background is not used when the min value is within 80% of the max value.
| dbms | 256us | 1ms | 4ms | 16ms | 64ms | 256ms | 1s | 4s | 16s | gt | max |
|---|---|---|---|---|---|---|---|---|---|---|---|
| my5651_rel.cz11a_c8r32 | 55.000 | 44.611 | 0.389 | 0.022 | |||||||
| my5744_rel.cz11a_c8r32 | 99.639 | 0.361 | 0.013 | ||||||||
| my8028_rel.cz11a_c8r32 | 99.833 | 0.167 | 0.014 | ||||||||
| my8032_rel.cz11a_c8r32 | 99.861 | 0.111 | 0.028 | 0.023 | |||||||
| my8036_rel.cz11a_c8r32 | 99.722 | 0.278 | 0.011 | ||||||||
| my8037_rel.cz11a_c8r32 | 99.556 | 0.444 | 0.014 |
Delete response time histogram: each cell has the percentage of responses that take <= the time in the header and max is the max response time in seconds. For max values in the top 25% of the range have a red background and in the bottom 25% of the range have a green background. The red background is not used when the min value is within 80% of the max value.
| dbms | 256us | 1ms | 4ms | 16ms | 64ms | 256ms | 1s | 4s | 16s | gt | max |
|---|---|---|---|---|---|---|---|---|---|---|---|
| my5651_rel.cz11a_c8r32 | 1.611 | 53.417 | 44.722 | 0.250 | 0.022 | ||||||
| my5744_rel.cz11a_c8r32 | 37.194 | 62.472 | 0.333 | 0.013 | |||||||
| my8028_rel.cz11a_c8r32 | 33.722 | 66.139 | 0.139 | 0.012 | |||||||
| my8032_rel.cz11a_c8r32 | 0.056 | 99.778 | 0.139 | 0.028 | 0.023 | ||||||
| my8036_rel.cz11a_c8r32 | 5.667 | 94.028 | 0.306 | 0.007 | |||||||
| my8037_rel.cz11a_c8r32 | 3.611 | 95.917 | 0.472 | 0.007 |
Performance metrics for the DBMS listed above. Some are normalized by throughput, others are not. Legend for results is here.
ips	qps	rps	rmbps	wps	wmbps	rpq	rkbpq	wpi	wkbpi	csps	cpups	cspq	cpupq	dbgb1	dbgb2	rss	maxop	p50	p99	tag
100	8804	0	0.0	1.9	0.0	0.000	0.000	0.019	0.118	35334	12.3	4.013	112	6.2	36.7	7.8	0.009	8838	8327	my5651_rel.cz11a_c8r32
100	7627	0	0.0	1.8	0.0	0.000	0.000	0.018	0.115	30771	12.2	4.035	128	6.3	36.8	8.3	0.002	7639	7304	my5744_rel.cz11a_c8r32
100	6547	0	0.0	1.5	0.0	0.000	0.000	0.015	0.096	26505	12.6	4.048	154	6.7	37.4	9.0	0.002	6553	6380	my8028_rel.cz11a_c8r32
100	6051	0	0.0	1.6	0.0	0.000	0.000	0.016	0.098	24691	12.9	4.081	171	6.6	37.5	9.2	0.002	6057	5945	my8032_rel.cz11a_c8r32
100	6080	0	0.0	1.4	0.0	0.000	0.000	0.014	0.098	24798	12.6	4.078	166	6.6	37.5	9.1	0.002	6089	5897	my8036_rel.cz11a_c8r32
100	6133	0	0.0	1.8	0.0	0.000	0.001	0.018	0.122	25015	12.7	4.079	166	6.6	37.5	9.1	0.001	6137	5945	my8037_rel.cz11a_c8r32
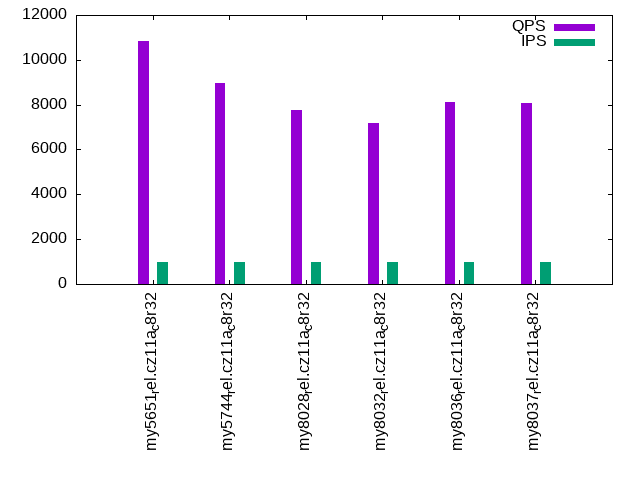
qr500.L3
qr500.L3: range queries with 500 insert/s per client. Graphs for performance per 1-second interval are here.
Average throughput:

Query response time histogram: each cell has the percentage of responses that take <= the time in the header and max is the max response time in seconds. For max values in the top 25% of the range have a red background and in the bottom 25% of the range have a green background. The red background is not used when the min value is within 80% of the max value.
| dbms | 256us | 1ms | 4ms | 16ms | 64ms | 256ms | 1s | 4s | 16s | gt | max |
|---|---|---|---|---|---|---|---|---|---|---|---|
| my5651_rel.cz11a_c8r32 | 99.964 | 0.033 | 0.001 | 0.002 | 0.009 | ||||||
| my5744_rel.cz11a_c8r32 | 99.974 | 0.026 | nonzero | nonzero | 0.005 | ||||||
| my8028_rel.cz11a_c8r32 | 99.936 | 0.064 | nonzero | nonzero | 0.006 | ||||||
| my8032_rel.cz11a_c8r32 | 99.910 | 0.090 | nonzero | 0.002 | |||||||
| my8036_rel.cz11a_c8r32 | 99.958 | 0.041 | nonzero | 0.002 | |||||||
| my8037_rel.cz11a_c8r32 | 99.960 | 0.040 | nonzero | 0.002 |
Insert response time histogram: each cell has the percentage of responses that take <= the time in the header and max is the max response time in seconds. For max values in the top 25% of the range have a red background and in the bottom 25% of the range have a green background. The red background is not used when the min value is within 80% of the max value.
| dbms | 256us | 1ms | 4ms | 16ms | 64ms | 256ms | 1s | 4s | 16s | gt | max |
|---|---|---|---|---|---|---|---|---|---|---|---|
| my5651_rel.cz11a_c8r32 | 13.989 | 76.783 | 9.139 | 0.089 | 0.022 | ||||||
| my5744_rel.cz11a_c8r32 | 7.589 | 92.139 | 0.272 | 0.012 | |||||||
| my8028_rel.cz11a_c8r32 | 0.017 | 99.844 | 0.139 | 0.015 | |||||||
| my8032_rel.cz11a_c8r32 | 99.872 | 0.122 | 0.006 | 0.023 | |||||||
| my8036_rel.cz11a_c8r32 | 99.817 | 0.183 | 0.014 | ||||||||
| my8037_rel.cz11a_c8r32 | 99.850 | 0.150 | 0.014 |
Delete response time histogram: each cell has the percentage of responses that take <= the time in the header and max is the max response time in seconds. For max values in the top 25% of the range have a red background and in the bottom 25% of the range have a green background. The red background is not used when the min value is within 80% of the max value.
| dbms | 256us | 1ms | 4ms | 16ms | 64ms | 256ms | 1s | 4s | 16s | gt | max |
|---|---|---|---|---|---|---|---|---|---|---|---|
| my5651_rel.cz11a_c8r32 | 23.772 | 67.028 | 9.156 | 0.044 | 0.022 | ||||||
| my5744_rel.cz11a_c8r32 | 88.289 | 11.506 | 0.206 | 0.012 | |||||||
| my8028_rel.cz11a_c8r32 | 89.339 | 10.606 | 0.056 | 0.008 | |||||||
| my8032_rel.cz11a_c8r32 | 55.050 | 44.878 | 0.067 | 0.006 | 0.023 | ||||||
| my8036_rel.cz11a_c8r32 | 81.017 | 18.822 | 0.161 | 0.007 | |||||||
| my8037_rel.cz11a_c8r32 | 78.561 | 21.333 | 0.106 | 0.008 |
Performance metrics for the DBMS listed above. Some are normalized by throughput, others are not. Legend for results is here.
ips	qps	rps	rmbps	wps	wmbps	rpq	rkbpq	wpi	wkbpi	csps	cpups	cspq	cpupq	dbgb1	dbgb2	rss	maxop	p50	p99	tag
499	10647	0	0.0	1.9	0.0	0.000	0.000	0.004	0.025	41130	12.2	3.863	92	6.2	36.7	7.8	0.009	10660	10516	my5651_rel.cz11a_c8r32
499	9040	0	0.0	1.1	0.0	0.000	0.000	0.002	0.017	35004	12.2	3.872	108	6.3	36.8	8.3	0.005	9046	8966	my5744_rel.cz11a_c8r32
499	7729	0	0.0	1.6	0.0	0.000	0.000	0.003	0.020	30348	12.4	3.927	128	6.7	37.4	9.0	0.006	7735	7687	my8028_rel.cz11a_c8r32
499	7207	0	0.0	0.9	0.0	0.000	0.000	0.002	0.013	28513	12.4	3.957	138	6.6	37.5	9.2	0.002	7208	7160	my8032_rel.cz11a_c8r32
499	8159	0	0.0	1.3	0.0	0.000	0.003	0.003	0.019	32106	12.3	3.935	121	6.6	37.5	9.1	0.002	8167	8087	my8036_rel.cz11a_c8r32
499	8084	0	0.0	1.4	0.0	0.000	0.000	0.003	0.019	31829	12.3	3.937	122	6.6	37.5	9.1	0.002	8087	8039	my8037_rel.cz11a_c8r32
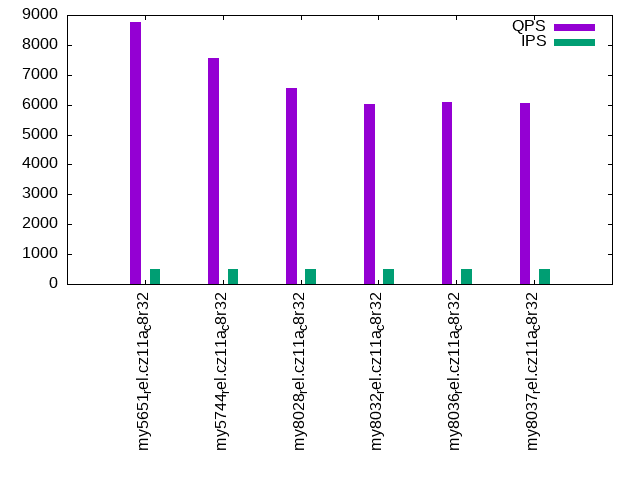
qp500.L4
qp500.L4: point queries with 500 insert/s per client. Graphs for performance per 1-second interval are here.
Average throughput:
Query response time histogram: each cell has the percentage of responses that take <= the time in the header and max is the max response time in seconds. For max values in the top 25% of the range have a red background and in the bottom 25% of the range have a green background. The red background is not used when the min value is within 80% of the max value.
| dbms | 256us | 1ms | 4ms | 16ms | 64ms | 256ms | 1s | 4s | 16s | gt | max |
|---|---|---|---|---|---|---|---|---|---|---|---|
| my5651_rel.cz11a_c8r32 | 99.921 | 0.076 | 0.001 | 0.001 | 0.010 | ||||||
| my5744_rel.cz11a_c8r32 | 99.885 | 0.115 | nonzero | nonzero | 0.005 | ||||||
| my8028_rel.cz11a_c8r32 | 99.803 | 0.197 | nonzero | nonzero | 0.011 | ||||||
| my8032_rel.cz11a_c8r32 | 99.796 | 0.204 | nonzero | 0.002 | |||||||
| my8036_rel.cz11a_c8r32 | 99.762 | 0.238 | nonzero | 0.002 | |||||||
| my8037_rel.cz11a_c8r32 | 99.795 | 0.205 | nonzero | 0.002 |
Insert response time histogram: each cell has the percentage of responses that take <= the time in the header and max is the max response time in seconds. For max values in the top 25% of the range have a red background and in the bottom 25% of the range have a green background. The red background is not used when the min value is within 80% of the max value.
| dbms | 256us | 1ms | 4ms | 16ms | 64ms | 256ms | 1s | 4s | 16s | gt | max |
|---|---|---|---|---|---|---|---|---|---|---|---|
| my5651_rel.cz11a_c8r32 | 12.794 | 77.939 | 9.194 | 0.072 | 0.023 | ||||||
| my5744_rel.cz11a_c8r32 | 0.561 | 99.194 | 0.244 | 0.013 | |||||||
| my8028_rel.cz11a_c8r32 | 99.883 | 0.117 | 0.014 | ||||||||
| my8032_rel.cz11a_c8r32 | 99.833 | 0.161 | 0.006 | 0.017 | |||||||
| my8036_rel.cz11a_c8r32 | 99.933 | 0.050 | 0.017 | 0.023 | |||||||
| my8037_rel.cz11a_c8r32 | 99.822 | 0.172 | 0.006 | 0.028 |
Delete response time histogram: each cell has the percentage of responses that take <= the time in the header and max is the max response time in seconds. For max values in the top 25% of the range have a red background and in the bottom 25% of the range have a green background. The red background is not used when the min value is within 80% of the max value.
| dbms | 256us | 1ms | 4ms | 16ms | 64ms | 256ms | 1s | 4s | 16s | gt | max |
|---|---|---|---|---|---|---|---|---|---|---|---|
| my5651_rel.cz11a_c8r32 | 22.833 | 67.978 | 9.128 | 0.061 | 0.022 | ||||||
| my5744_rel.cz11a_c8r32 | 79.628 | 20.150 | 0.222 | 0.013 | |||||||
| my8028_rel.cz11a_c8r32 | 85.489 | 14.428 | 0.083 | 0.014 | |||||||
| my8032_rel.cz11a_c8r32 | 29.822 | 70.033 | 0.144 | 0.010 | |||||||
| my8036_rel.cz11a_c8r32 | 46.589 | 53.344 | 0.056 | 0.011 | 0.023 | ||||||
| my8037_rel.cz11a_c8r32 | 44.000 | 55.894 | 0.100 | 0.006 | 0.028 |
Performance metrics for the DBMS listed above. Some are normalized by throughput, others are not. Legend for results is here.
ips	qps	rps	rmbps	wps	wmbps	rpq	rkbpq	wpi	wkbpi	csps	cpups	cspq	cpupq	dbgb1	dbgb2	rss	maxop	p50	p99	tag
499	8778	0	0.0	1.2	0.0	0.000	0.000	0.002	0.017	35531	12.4	4.048	113	6.2	36.7	7.8	0.010	8806	8279	my5651_rel.cz11a_c8r32
499	7575	0	0.0	1.9	0.0	0.000	0.000	0.004	0.024	30629	12.9	4.043	136	6.3	36.8	8.3	0.005	7592	7128	my5744_rel.cz11a_c8r32
499	6567	1	0.1	2.4	0.2	0.000	0.015	0.005	0.323	26852	12.9	4.089	157	6.7	37.4	9.0	0.011	6572	6361	my8028_rel.cz11a_c8r32
499	6018	0	0.0	1.3	0.0	0.000	0.000	0.003	0.017	24867	12.8	4.132	170	6.6	37.5	9.2	0.002	6025	5868	my8032_rel.cz11a_c8r32
499	6105	0	0.0	1.6	0.0	0.000	0.000	0.003	0.023	25188	12.6	4.126	165	6.6	37.5	9.1	0.002	6105	5930	my8036_rel.cz11a_c8r32
499	6058	0	0.0	1.5	0.0	0.000	0.000	0.003	0.020	25008	12.8	4.128	169	6.6	37.5	9.1	0.002	6059	5898	my8037_rel.cz11a_c8r32
qr1000.L5
qr1000.L5: range queries with 1000 insert/s per client. Graphs for performance per 1-second interval are here.
Average throughput:
Query response time histogram: each cell has the percentage of responses that take <= the time in the header and max is the max response time in seconds. For max values in the top 25% of the range have a red background and in the bottom 25% of the range have a green background. The red background is not used when the min value is within 80% of the max value.
| dbms | 256us | 1ms | 4ms | 16ms | 64ms | 256ms | 1s | 4s | 16s | gt | max |
|---|---|---|---|---|---|---|---|---|---|---|---|
| my5651_rel.cz11a_c8r32 | 99.959 | 0.037 | 0.001 | 0.002 | 0.014 | ||||||
| my5744_rel.cz11a_c8r32 | 99.965 | 0.035 | nonzero | 0.004 | |||||||
| my8028_rel.cz11a_c8r32 | 99.929 | 0.071 | nonzero | 0.002 | |||||||
| my8032_rel.cz11a_c8r32 | 99.889 | 0.111 | nonzero | 0.002 | |||||||
| my8036_rel.cz11a_c8r32 | 99.950 | 0.049 | nonzero | 0.002 | |||||||
| my8037_rel.cz11a_c8r32 | 99.949 | 0.051 | nonzero | 0.002 |
Insert response time histogram: each cell has the percentage of responses that take <= the time in the header and max is the max response time in seconds. For max values in the top 25% of the range have a red background and in the bottom 25% of the range have a green background. The red background is not used when the min value is within 80% of the max value.
| dbms | 256us | 1ms | 4ms | 16ms | 64ms | 256ms | 1s | 4s | 16s | gt | max |
|---|---|---|---|---|---|---|---|---|---|---|---|
| my5651_rel.cz11a_c8r32 | 17.550 | 76.542 | 5.836 | 0.072 | 0.025 | ||||||
| my5744_rel.cz11a_c8r32 | 11.481 | 88.283 | 0.231 | 0.006 | 0.019 | ||||||
| my8028_rel.cz11a_c8r32 | 0.036 | 99.769 | 0.194 | 0.015 | |||||||
| my8032_rel.cz11a_c8r32 | 99.856 | 0.142 | 0.003 | 0.023 | |||||||
| my8036_rel.cz11a_c8r32 | 99.758 | 0.239 | 0.003 | 0.023 | |||||||
| my8037_rel.cz11a_c8r32 | 99.881 | 0.117 | 0.003 | 0.019 |
Delete response time histogram: each cell has the percentage of responses that take <= the time in the header and max is the max response time in seconds. For max values in the top 25% of the range have a red background and in the bottom 25% of the range have a green background. The red background is not used when the min value is within 80% of the max value.
| dbms | 256us | 1ms | 4ms | 16ms | 64ms | 256ms | 1s | 4s | 16s | gt | max |
|---|---|---|---|---|---|---|---|---|---|---|---|
| my5651_rel.cz11a_c8r32 | 32.400 | 61.889 | 5.661 | 0.050 | 0.026 | ||||||
| my5744_rel.cz11a_c8r32 | 92.669 | 7.139 | 0.192 | 0.014 | |||||||
| my8028_rel.cz11a_c8r32 | 93.206 | 6.653 | 0.142 | 0.014 | |||||||
| my8032_rel.cz11a_c8r32 | 59.206 | 40.675 | 0.117 | 0.003 | 0.022 | ||||||
| my8036_rel.cz11a_c8r32 | 84.367 | 15.472 | 0.158 | 0.003 | 0.023 | ||||||
| my8037_rel.cz11a_c8r32 | 84.203 | 15.703 | 0.092 | 0.003 | 0.019 |
Performance metrics for the DBMS listed above. Some are normalized by throughput, others are not. Legend for results is here.
ips	qps	rps	rmbps	wps	wmbps	rpq	rkbpq	wpi	wkbpi	csps	cpups	cspq	cpupq	dbgb1	dbgb2	rss	maxop	p50	p99	tag
999	10843	0	0.0	1.1	0.0	0.000	0.000	0.001	0.008	43349	12.6	3.998	93	6.2	36.7	7.8	0.014	10852	10633	my5651_rel.cz11a_c8r32
999	8975	0	0.0	1.2	0.0	0.000	0.000	0.001	0.010	34989	12.7	3.898	113	6.3	36.8	8.3	0.004	8982	8906	my5744_rel.cz11a_c8r32
999	7764	0	0.0	1.0	0.0	0.000	0.000	0.001	0.007	30893	12.4	3.979	128	6.7	37.4	9.0	0.002	7767	7706	my8028_rel.cz11a_c8r32
999	7176	0	0.0	1.7	0.0	0.000	0.004	0.002	0.011	29005	12.9	4.042	144	6.6	37.5	9.2	0.002	7176	7128	my8032_rel.cz11a_c8r32
999	8110	0	0.0	1.2	0.0	0.000	0.000	0.001	0.009	32515	12.9	4.009	127	6.6	37.5	9.1	0.002	8110	8039	my8036_rel.cz11a_c8r32
999	8075	0	0.0	1.0	0.0	0.000	0.000	0.001	0.007	32390	12.7	4.011	126	6.6	37.5	9.1	0.002	8071	8023	my8037_rel.cz11a_c8r32
qp1000.L6
qp1000.L6: point queries with 1000 insert/s per client. Graphs for performance per 1-second interval are here.
Average throughput:
Query response time histogram: each cell has the percentage of responses that take <= the time in the header and max is the max response time in seconds. For max values in the top 25% of the range have a red background and in the bottom 25% of the range have a green background. The red background is not used when the min value is within 80% of the max value.
| dbms | 256us | 1ms | 4ms | 16ms | 64ms | 256ms | 1s | 4s | 16s | gt | max |
|---|---|---|---|---|---|---|---|---|---|---|---|
| my5651_rel.cz11a_c8r32 | 99.855 | 0.140 | 0.003 | 0.002 | 0.010 | ||||||
| my5744_rel.cz11a_c8r32 | 99.856 | 0.144 | nonzero | 0.002 | |||||||
| my8028_rel.cz11a_c8r32 | 99.748 | 0.252 | nonzero | 0.002 | |||||||
| my8032_rel.cz11a_c8r32 | 99.711 | 0.289 | nonzero | 0.002 | |||||||
| my8036_rel.cz11a_c8r32 | 99.660 | 0.340 | nonzero | 0.001 | |||||||
| my8037_rel.cz11a_c8r32 | 99.620 | 0.380 | nonzero | 0.002 |
Insert response time histogram: each cell has the percentage of responses that take <= the time in the header and max is the max response time in seconds. For max values in the top 25% of the range have a red background and in the bottom 25% of the range have a green background. The red background is not used when the min value is within 80% of the max value.
| dbms | 256us | 1ms | 4ms | 16ms | 64ms | 256ms | 1s | 4s | 16s | gt | max |
|---|---|---|---|---|---|---|---|---|---|---|---|
| my5651_rel.cz11a_c8r32 | 17.981 | 77.272 | 4.711 | 0.036 | 0.022 | ||||||
| my5744_rel.cz11a_c8r32 | 4.814 | 95.014 | 0.172 | 0.016 | |||||||
| my8028_rel.cz11a_c8r32 | 0.003 | 99.900 | 0.097 | 0.015 | |||||||
| my8032_rel.cz11a_c8r32 | 99.764 | 0.233 | 0.003 | 0.026 | |||||||
| my8036_rel.cz11a_c8r32 | 99.753 | 0.244 | 0.003 | 0.018 | |||||||
| my8037_rel.cz11a_c8r32 | 99.758 | 0.233 | 0.006 | 0.003 | 0.272 |
Delete response time histogram: each cell has the percentage of responses that take <= the time in the header and max is the max response time in seconds. For max values in the top 25% of the range have a red background and in the bottom 25% of the range have a green background. The red background is not used when the min value is within 80% of the max value.
| dbms | 256us | 1ms | 4ms | 16ms | 64ms | 256ms | 1s | 4s | 16s | gt | max |
|---|---|---|---|---|---|---|---|---|---|---|---|
| my5651_rel.cz11a_c8r32 | 32.139 | 63.150 | 4.686 | 0.025 | 0.022 | ||||||
| my5744_rel.cz11a_c8r32 | 89.797 | 10.069 | 0.131 | 0.003 | 0.017 | ||||||
| my8028_rel.cz11a_c8r32 | 90.683 | 9.239 | 0.078 | 0.013 | |||||||
| my8032_rel.cz11a_c8r32 | 45.061 | 54.775 | 0.161 | 0.003 | 0.026 | ||||||
| my8036_rel.cz11a_c8r32 | 59.783 | 40.064 | 0.150 | 0.003 | 0.018 | ||||||
| my8037_rel.cz11a_c8r32 | 58.772 | 41.089 | 0.136 | 0.003 | 0.290 |
Performance metrics for the DBMS listed above. Some are normalized by throughput, others are not. Legend for results is here.
ips	qps	rps	rmbps	wps	wmbps	rpq	rkbpq	wpi	wkbpi	csps	cpups	cspq	cpupq	dbgb1	dbgb2	rss	maxop	p50	p99	tag
999	8833	0	0.0	1.5	0.0	0.000	0.000	0.001	0.010	36152	13.3	4.093	120	6.2	36.7	7.8	0.010	8854	8263	my5651_rel.cz11a_c8r32
999	7553	1	0.0	1.5	0.0	0.000	0.000	0.002	0.010	30879	13.1	4.088	139	6.3	36.8	8.3	0.002	7575	7227	my5744_rel.cz11a_c8r32
999	6505	0	0.0	1.3	0.0	0.000	0.000	0.001	0.009	27140	13.5	4.172	166	6.7	37.4	9.0	0.002	6521	6284	my8028_rel.cz11a_c8r32
999	6024	0	0.0	1.0	0.0	0.000	0.000	0.001	0.007	25628	13.7	4.254	182	6.6	37.5	9.2	0.002	6028	5849	my8032_rel.cz11a_c8r32
999	6108	0	0.0	1.7	0.0	0.000	0.000	0.002	0.012	25909	13.6	4.242	178	6.6	37.5	9.1	0.001	6121	5929	my8036_rel.cz11a_c8r32
999	6075	0	0.0	1.0	0.0	0.000	0.000	0.001	0.007	25790	13.6	4.245	179	6.6	37.6	9.1	0.002	6089	5913	my8037_rel.cz11a_c8r32
l.i0
l.i0: load without secondary indexes
Performance metrics for all DBMS, not just the ones listed above. Some are normalized by throughput, others are not. Legend for results is here.
ips	qps	rps	rmbps	wps	wmbps	rpq	rkbpq	wpi	wkbpi	csps	cpups	cspq	cpupq	dbgb1	dbgb2	rss	maxop	p50	p99	tag
172414	0	0	0.0	2.1	0.0	0.000	0.000	0.000	0.000	19696	20.8	0.114	10	2.0	32.5	3.3	0.152	176105	110068	my5651_rel.cz11a_c8r32
153061	0	0	0.0	1.8	0.0	0.000	0.000	0.000	0.000	15336	20.6	0.100	11	2.0	32.5	3.8	0.090	154033	140650	my5744_rel.cz11a_c8r32
119048	0	0	0.0	1.6	0.0	0.000	0.000	0.000	0.000	12868	18.7	0.108	13	2.0	32.6	4.0	0.091	120071	103986	my8028_rel.cz11a_c8r32
104895	0	0	0.0	1.6	0.0	0.000	0.000	0.000	0.000	11765	17.8	0.112	14	2.0	32.6	4.1	0.082	106384	93698	my8032_rel.cz11a_c8r32
103093	0	0	0.0	1.9	0.0	0.000	0.000	0.000	0.000	11557	17.8	0.112	14	2.0	32.6	4.0	0.082	103886	87911	my8036_rel.cz11a_c8r32
105263	0	0	0.0	1.4	0.0	0.000	0.000	0.000	0.000	11762	17.9	0.112	14	2.0	32.6	4.1	0.082	106084	94099	my8037_rel.cz11a_c8r32
l.x
l.x: create secondary indexes
Performance metrics for all DBMS, not just the ones listed above. Some are normalized by throughput, others are not. Legend for results is here.
ips	qps	rps	rmbps	wps	wmbps	rpq	rkbpq	wpi	wkbpi	csps	cpups	cspq	cpupq	dbgb1	dbgb2	rss	maxop	p50	p99	tag
143541	0	0	0.0	1.6	0.0	0.000	0.000	0.000	0.000	4319	9.7	0.030	5	4.2	34.7	5.2	0.001	NA	NA	my5651_rel.cz11a_c8r32
223881	0	0	0.0	1.4	0.0	0.000	0.000	0.000	0.000	12782	12.1	0.057	4	4.6	35.1	5.5	0.001	NA	NA	my5744_rel.cz11a_c8r32
300001	0	0	0.0	1.2	0.0	0.000	0.000	0.000	0.000	22256	39.5	0.074	11	4.5	35.1	6.1	0.001	NA	NA	my8028_rel.cz11a_c8r32
277779	0	0	0.0	1.2	0.0	0.000	0.000	0.000	0.000	18397	39.1	0.066	11	4.5	35.1	5.3	0.002	NA	NA	my8032_rel.cz11a_c8r32
260870	0	0	0.0	1.6	0.0	0.000	0.000	0.000	0.000	17205	39.7	0.066	12	4.5	35.1	4.8	0.002	NA	NA	my8036_rel.cz11a_c8r32
280375	0	0	0.0	1.8	0.0	0.000	0.000	0.000	0.000	19419	38.8	0.069	11	4.5	35.1	5.5	0.002	NA	NA	my8037_rel.cz11a_c8r32
l.i1
l.i1: continue load after secondary indexes created with 50 inserts per transaction
Performance metrics for all DBMS, not just the ones listed above. Some are normalized by throughput, others are not. Legend for results is here.
ips	qps	rps	rmbps	wps	wmbps	rpq	rkbpq	wpi	wkbpi	csps	cpups	cspq	cpupq	dbgb1	dbgb2	rss	maxop	p50	p99	tag
32949	0	0	0.0	1.8	0.0	0.000	0.000	0.000	0.000	36108	40.0	1.096	97	6.2	36.7	7.8	0.081	35012	8990	my5651_rel.cz11a_c8r32
34843	0	0	0.0	1.2	0.0	0.000	0.000	0.000	0.000	25133	45.0	0.721	103	6.3	36.8	8.3	0.093	36261	10439	my5744_rel.cz11a_c8r32
35971	0	0	0.0	1.6	0.0	0.000	0.000	0.000	0.000	45838	35.1	1.274	78	6.7	37.4	9.0	0.094	37708	7941	my8028_rel.cz11a_c8r32
31898	0	0	0.0	1.6	0.0	0.000	0.000	0.000	0.000	45595	35.7	1.429	90	6.6	37.5	9.1	0.102	33614	7299	my8032_rel.cz11a_c8r32
32128	0	0	0.0	1.9	0.0	0.000	0.000	0.000	0.000	45161	35.0	1.406	87	6.6	37.4	9.0	0.102	33896	6643	my8036_rel.cz11a_c8r32
32284	0	0	0.0	1.4	0.0	0.000	0.000	0.000	0.000	45847	35.3	1.420	87	6.6	37.5	9.1	0.278	34013	6642	my8037_rel.cz11a_c8r32
l.i2
l.i2: continue load after secondary indexes created with 5 inserts per transaction
Performance metrics for all DBMS, not just the ones listed above. Some are normalized by throughput, others are not. Legend for results is here.
ips	qps	rps	rmbps	wps	wmbps	rpq	rkbpq	wpi	wkbpi	csps	cpups	cspq	cpupq	dbgb1	dbgb2	rss	maxop	p50	p99	tag
21739	0	0	0.0	2.0	0.0	0.000	0.000	0.000	0.001	177487	39.7	8.164	146	6.2	36.7	7.8	0.067	21802	20623	my5651_rel.cz11a_c8r32
21882	0	0	0.0	1.7	0.0	0.000	0.000	0.000	0.001	86924	38.8	3.972	142	6.3	36.8	8.3	0.113	21976	20619	my5744_rel.cz11a_c8r32
20000	0	0	0.0	1.1	0.0	0.000	0.000	0.000	0.000	92176	33.4	4.609	134	6.7	37.4	9.0	0.099	20091	18810	my8028_rel.cz11a_c8r32
18248	0	0	0.0	0.9	0.0	0.000	0.000	0.000	0.000	86263	33.2	4.727	146	6.6	37.5	9.2	0.101	18267	17156	my8032_rel.cz11a_c8r32
18248	0	0	0.0	1.1	0.0	0.000	0.000	0.000	0.000	86169	33.2	4.722	146	6.6	37.4	9.0	0.059	18295	17466	my8036_rel.cz11a_c8r32
18349	0	0	0.0	1.0	0.0	0.000	0.000	0.000	0.000	87349	33.3	4.761	145	6.6	37.5	9.1	0.101	18406	17081	my8037_rel.cz11a_c8r32
qr100.L1
qr100.L1: range queries with 100 insert/s per client
Performance metrics for all DBMS, not just the ones listed above. Some are normalized by throughput, others are not. Legend for results is here.
ips	qps	rps	rmbps	wps	wmbps	rpq	rkbpq	wpi	wkbpi	csps	cpups	cspq	cpupq	dbgb1	dbgb2	rss	maxop	p50	p99	tag
100	10749	0	0.0	1.8	0.0	0.000	0.000	0.018	0.118	41738	11.6	3.883	86	6.2	36.7	7.8	0.020	10744	10536	my5651_rel.cz11a_c8r32
100	8954	0	0.0	1.8	0.0	0.000	0.000	0.018	0.118	34866	11.7	3.894	105	6.3	36.8	8.3	0.010	8950	8870	my5744_rel.cz11a_c8r32
100	7731	0	0.0	1.5	0.0	0.000	0.000	0.015	0.091	30347	11.9	3.926	123	6.7	37.4	9.0	0.001	7735	7672	my8028_rel.cz11a_c8r32
100	7235	0	0.0	1.5	0.0	0.000	0.000	0.015	0.092	28664	12.0	3.962	133	6.6	37.5	9.2	0.002	7240	7179	my8032_rel.cz11a_c8r32
100	8177	0	0.0	1.9	0.0	0.000	0.000	0.019	0.125	32205	11.7	3.938	114	6.6	37.4	9.1	0.012	8183	8103	my8036_rel.cz11a_c8r32
100	8056	0	0.0	1.0	0.0	0.000	0.000	0.010	0.067	31716	11.7	3.937	116	6.6	37.5	9.1	0.002	8055	7991	my8037_rel.cz11a_c8r32
qp100.L2
qp100.L2: point queries with 100 insert/s per client
Performance metrics for all DBMS, not just the ones listed above. Some are normalized by throughput, others are not. Legend for results is here.
ips	qps	rps	rmbps	wps	wmbps	rpq	rkbpq	wpi	wkbpi	csps	cpups	cspq	cpupq	dbgb1	dbgb2	rss	maxop	p50	p99	tag
100	8804	0	0.0	1.9	0.0	0.000	0.000	0.019	0.118	35334	12.3	4.013	112	6.2	36.7	7.8	0.009	8838	8327	my5651_rel.cz11a_c8r32
100	7627	0	0.0	1.8	0.0	0.000	0.000	0.018	0.115	30771	12.2	4.035	128	6.3	36.8	8.3	0.002	7639	7304	my5744_rel.cz11a_c8r32
100	6547	0	0.0	1.5	0.0	0.000	0.000	0.015	0.096	26505	12.6	4.048	154	6.7	37.4	9.0	0.002	6553	6380	my8028_rel.cz11a_c8r32
100	6051	0	0.0	1.6	0.0	0.000	0.000	0.016	0.098	24691	12.9	4.081	171	6.6	37.5	9.2	0.002	6057	5945	my8032_rel.cz11a_c8r32
100	6080	0	0.0	1.4	0.0	0.000	0.000	0.014	0.098	24798	12.6	4.078	166	6.6	37.5	9.1	0.002	6089	5897	my8036_rel.cz11a_c8r32
100	6133	0	0.0	1.8	0.0	0.000	0.001	0.018	0.122	25015	12.7	4.079	166	6.6	37.5	9.1	0.001	6137	5945	my8037_rel.cz11a_c8r32
qr500.L3
qr500.L3: range queries with 500 insert/s per client
Performance metrics for all DBMS, not just the ones listed above. Some are normalized by throughput, others are not. Legend for results is here.
ips	qps	rps	rmbps	wps	wmbps	rpq	rkbpq	wpi	wkbpi	csps	cpups	cspq	cpupq	dbgb1	dbgb2	rss	maxop	p50	p99	tag
499	10647	0	0.0	1.9	0.0	0.000	0.000	0.004	0.025	41130	12.2	3.863	92	6.2	36.7	7.8	0.009	10660	10516	my5651_rel.cz11a_c8r32
499	9040	0	0.0	1.1	0.0	0.000	0.000	0.002	0.017	35004	12.2	3.872	108	6.3	36.8	8.3	0.005	9046	8966	my5744_rel.cz11a_c8r32
499	7729	0	0.0	1.6	0.0	0.000	0.000	0.003	0.020	30348	12.4	3.927	128	6.7	37.4	9.0	0.006	7735	7687	my8028_rel.cz11a_c8r32
499	7207	0	0.0	0.9	0.0	0.000	0.000	0.002	0.013	28513	12.4	3.957	138	6.6	37.5	9.2	0.002	7208	7160	my8032_rel.cz11a_c8r32
499	8159	0	0.0	1.3	0.0	0.000	0.003	0.003	0.019	32106	12.3	3.935	121	6.6	37.5	9.1	0.002	8167	8087	my8036_rel.cz11a_c8r32
499	8084	0	0.0	1.4	0.0	0.000	0.000	0.003	0.019	31829	12.3	3.937	122	6.6	37.5	9.1	0.002	8087	8039	my8037_rel.cz11a_c8r32
qp500.L4
qp500.L4: point queries with 500 insert/s per client
Performance metrics for all DBMS, not just the ones listed above. Some are normalized by throughput, others are not. Legend for results is here.
ips	qps	rps	rmbps	wps	wmbps	rpq	rkbpq	wpi	wkbpi	csps	cpups	cspq	cpupq	dbgb1	dbgb2	rss	maxop	p50	p99	tag
499	8778	0	0.0	1.2	0.0	0.000	0.000	0.002	0.017	35531	12.4	4.048	113	6.2	36.7	7.8	0.010	8806	8279	my5651_rel.cz11a_c8r32
499	7575	0	0.0	1.9	0.0	0.000	0.000	0.004	0.024	30629	12.9	4.043	136	6.3	36.8	8.3	0.005	7592	7128	my5744_rel.cz11a_c8r32
499	6567	1	0.1	2.4	0.2	0.000	0.015	0.005	0.323	26852	12.9	4.089	157	6.7	37.4	9.0	0.011	6572	6361	my8028_rel.cz11a_c8r32
499	6018	0	0.0	1.3	0.0	0.000	0.000	0.003	0.017	24867	12.8	4.132	170	6.6	37.5	9.2	0.002	6025	5868	my8032_rel.cz11a_c8r32
499	6105	0	0.0	1.6	0.0	0.000	0.000	0.003	0.023	25188	12.6	4.126	165	6.6	37.5	9.1	0.002	6105	5930	my8036_rel.cz11a_c8r32
499	6058	0	0.0	1.5	0.0	0.000	0.000	0.003	0.020	25008	12.8	4.128	169	6.6	37.5	9.1	0.002	6059	5898	my8037_rel.cz11a_c8r32
qr1000.L5
qr1000.L5: range queries with 1000 insert/s per client
Performance metrics for all DBMS, not just the ones listed above. Some are normalized by throughput, others are not. Legend for results is here.
ips	qps	rps	rmbps	wps	wmbps	rpq	rkbpq	wpi	wkbpi	csps	cpups	cspq	cpupq	dbgb1	dbgb2	rss	maxop	p50	p99	tag
999	10843	0	0.0	1.1	0.0	0.000	0.000	0.001	0.008	43349	12.6	3.998	93	6.2	36.7	7.8	0.014	10852	10633	my5651_rel.cz11a_c8r32
999	8975	0	0.0	1.2	0.0	0.000	0.000	0.001	0.010	34989	12.7	3.898	113	6.3	36.8	8.3	0.004	8982	8906	my5744_rel.cz11a_c8r32
999	7764	0	0.0	1.0	0.0	0.000	0.000	0.001	0.007	30893	12.4	3.979	128	6.7	37.4	9.0	0.002	7767	7706	my8028_rel.cz11a_c8r32
999	7176	0	0.0	1.7	0.0	0.000	0.004	0.002	0.011	29005	12.9	4.042	144	6.6	37.5	9.2	0.002	7176	7128	my8032_rel.cz11a_c8r32
999	8110	0	0.0	1.2	0.0	0.000	0.000	0.001	0.009	32515	12.9	4.009	127	6.6	37.5	9.1	0.002	8110	8039	my8036_rel.cz11a_c8r32
999	8075	0	0.0	1.0	0.0	0.000	0.000	0.001	0.007	32390	12.7	4.011	126	6.6	37.5	9.1	0.002	8071	8023	my8037_rel.cz11a_c8r32
qp1000.L6
qp1000.L6: point queries with 1000 insert/s per client
Performance metrics for all DBMS, not just the ones listed above. Some are normalized by throughput, others are not. Legend for results is here.
ips	qps	rps	rmbps	wps	wmbps	rpq	rkbpq	wpi	wkbpi	csps	cpups	cspq	cpupq	dbgb1	dbgb2	rss	maxop	p50	p99	tag
999	8833	0	0.0	1.5	0.0	0.000	0.000	0.001	0.010	36152	13.3	4.093	120	6.2	36.7	7.8	0.010	8854	8263	my5651_rel.cz11a_c8r32
999	7553	1	0.0	1.5	0.0	0.000	0.000	0.002	0.010	30879	13.1	4.088	139	6.3	36.8	8.3	0.002	7575	7227	my5744_rel.cz11a_c8r32
999	6505	0	0.0	1.3	0.0	0.000	0.000	0.001	0.009	27140	13.5	4.172	166	6.7	37.4	9.0	0.002	6521	6284	my8028_rel.cz11a_c8r32
999	6024	0	0.0	1.0	0.0	0.000	0.000	0.001	0.007	25628	13.7	4.254	182	6.6	37.5	9.2	0.002	6028	5849	my8032_rel.cz11a_c8r32
999	6108	0	0.0	1.7	0.0	0.000	0.000	0.002	0.012	25909	13.6	4.242	178	6.6	37.5	9.1	0.001	6121	5929	my8036_rel.cz11a_c8r32
999	6075	0	0.0	1.0	0.0	0.000	0.000	0.001	0.007	25790	13.6	4.245	179	6.6	37.6	9.1	0.002	6089	5913	my8037_rel.cz11a_c8r32
l.i0
- l.i0: load without secondary indexes
- Legend for results is here.
- Each entry lists the percentage of responses that fit in that bucket (slower than max time for previous bucket, faster than min time for next bucket).
Insert response time histogram
256us	1ms	4ms	16ms	64ms	256ms	1s	4s	16s	gt	max	tag
0.000	99.264	0.673	0.048	0.014	0.001	0.000	0.000	0.000	0.000	0.152	my5651_rel.cz11a_c8r32
0.000	99.535	0.198	0.137	0.130	0.001	0.000	0.000	0.000	0.000	0.090	my5744_rel.cz11a_c8r32
0.000	99.285	0.344	0.239	0.131	0.002	0.000	0.000	0.000	0.000	0.091	my8028_rel.cz11a_c8r32
0.000	98.608	0.995	0.263	0.133	0.002	0.000	0.000	0.000	0.000	0.082	my8032_rel.cz11a_c8r32
0.000	96.662	2.937	0.263	0.137	0.002	0.000	0.000	0.000	0.000	0.082	my8036_rel.cz11a_c8r32
0.000	98.545	1.059	0.255	0.139	0.002	0.000	0.000	0.000	0.000	0.082	my8037_rel.cz11a_c8r32
l.x
- l.x: create secondary indexes
- Legend for results is here.
- Each entry lists the percentage of responses that fit in that bucket (slower than max time for previous bucket, faster than min time for next bucket).
TODO - determine whether there is data for create index response time
l.i1
- l.i1: continue load after secondary indexes created with 50 inserts per transaction
- Legend for results is here.
- Each entry lists the percentage of responses that fit in that bucket (slower than max time for previous bucket, faster than min time for next bucket).
Insert response time histogram
256us	1ms	4ms	16ms	64ms	256ms	1s	4s	16s	gt	max	tag
0.000	10.339	87.672	1.813	0.175	0.001	0.000	0.000	0.000	0.000	0.081	my5651_rel.cz11a_c8r32
0.000	3.927	94.388	1.644	0.041	0.001	0.000	0.000	0.000	0.000	0.093	my5744_rel.cz11a_c8r32
0.000	nonzero	98.636	1.294	0.069	0.001	0.000	0.000	0.000	0.000	0.094	my8028_rel.cz11a_c8r32
0.000	0.000	98.280	1.623	0.095	0.001	0.000	0.000	0.000	0.000	0.102	my8032_rel.cz11a_c8r32
0.000	0.000	98.317	1.593	0.089	0.001	0.000	0.000	0.000	0.000	0.102	my8036_rel.cz11a_c8r32
0.000	0.000	98.339	1.575	0.085	0.001	nonzero	0.000	0.000	0.000	0.278	my8037_rel.cz11a_c8r32
Delete response time histogram
256us	1ms	4ms	16ms	64ms	256ms	1s	4s	16s	gt	max	tag
0.000	77.275	21.465	1.121	0.138	0.001	0.000	0.000	0.000	0.000	0.080	my5651_rel.cz11a_c8r32
0.000	66.862	31.856	1.267	0.015	0.001	0.000	0.000	0.000	0.000	0.093	my5744_rel.cz11a_c8r32
0.000	93.557	5.391	1.035	0.016	0.001	0.000	0.000	0.000	0.000	0.078	my8028_rel.cz11a_c8r32
0.000	51.503	47.191	1.277	0.029	0.001	0.000	0.000	0.000	0.000	0.108	my8032_rel.cz11a_c8r32
0.000	64.976	33.737	1.264	0.022	0.001	0.000	0.000	0.000	0.000	0.101	my8036_rel.cz11a_c8r32
0.000	65.264	33.476	1.234	0.026	0.001	nonzero	0.000	0.000	0.000	0.284	my8037_rel.cz11a_c8r32
l.i2
- l.i2: continue load after secondary indexes created with 5 inserts per transaction
- Legend for results is here.
- Each entry lists the percentage of responses that fit in that bucket (slower than max time for previous bucket, faster than min time for next bucket).
Insert response time histogram
256us	1ms	4ms	16ms	64ms	256ms	1s	4s	16s	gt	max	tag
86.693	13.177	0.014	0.112	0.004	nonzero	0.000	0.000	0.000	0.000	0.067	my5651_rel.cz11a_c8r32
88.626	11.193	0.054	0.126	0.001	nonzero	0.000	0.000	0.000	0.000	0.113	my5744_rel.cz11a_c8r32
84.660	15.226	0.003	0.111	nonzero	nonzero	0.000	0.000	0.000	0.000	0.099	my8028_rel.cz11a_c8r32
75.291	24.577	0.004	0.127	0.001	nonzero	0.000	0.000	0.000	0.000	0.101	my8032_rel.cz11a_c8r32
75.338	24.528	0.004	0.129	0.001	0.000	0.000	0.000	0.000	0.000	0.059	my8036_rel.cz11a_c8r32
76.605	23.258	0.004	0.131	0.001	nonzero	0.000	0.000	0.000	0.000	0.101	my8037_rel.cz11a_c8r32
Delete response time histogram
256us	1ms	4ms	16ms	64ms	256ms	1s	4s	16s	gt	max	tag
96.933	2.937	0.015	0.112	0.004	nonzero	0.000	0.000	0.000	0.000	0.068	my5651_rel.cz11a_c8r32
92.118	7.750	0.009	0.122	0.001	nonzero	0.000	0.000	0.000	0.000	0.113	my5744_rel.cz11a_c8r32
95.358	4.535	0.001	0.105	nonzero	nonzero	0.000	0.000	0.000	0.000	0.106	my8028_rel.cz11a_c8r32
86.679	13.199	0.001	0.119	0.001	nonzero	0.000	0.000	0.000	0.000	0.101	my8032_rel.cz11a_c8r32
87.530	12.345	0.001	0.122	0.001	0.000	0.000	0.000	0.000	0.000	0.060	my8036_rel.cz11a_c8r32
89.495	10.379	0.001	0.124	0.001	nonzero	0.000	0.000	0.000	0.000	0.101	my8037_rel.cz11a_c8r32
qr100.L1
- qr100.L1: range queries with 100 insert/s per client
- Legend for results is here.
- Each entry lists the percentage of responses that fit in that bucket (slower than max time for previous bucket, faster than min time for next bucket).
Query response time histogram
256us	1ms	4ms	16ms	64ms	256ms	1s	4s	16s	gt	max	tag
99.968	0.028	0.002	0.003	nonzero	0.000	0.000	0.000	0.000	0.000	0.020	my5651_rel.cz11a_c8r32
99.981	0.019	nonzero	nonzero	0.000	0.000	0.000	0.000	0.000	0.000	0.010	my5744_rel.cz11a_c8r32
99.946	0.054	nonzero	0.000	0.000	0.000	0.000	0.000	0.000	0.000	0.001	my8028_rel.cz11a_c8r32
99.924	0.076	nonzero	0.000	0.000	0.000	0.000	0.000	0.000	0.000	0.002	my8032_rel.cz11a_c8r32
99.961	0.039	nonzero	nonzero	0.000	0.000	0.000	0.000	0.000	0.000	0.012	my8036_rel.cz11a_c8r32
99.966	0.034	nonzero	0.000	0.000	0.000	0.000	0.000	0.000	0.000	0.002	my8037_rel.cz11a_c8r32
Insert response time histogram
256us	1ms	4ms	16ms	64ms	256ms	1s	4s	16s	gt	max	tag
0.000	0.500	49.194	47.250	3.056	0.000	0.000	0.000	0.000	0.000	0.033	my5651_rel.cz11a_c8r32
0.000	0.694	98.833	0.472	0.000	0.000	0.000	0.000	0.000	0.000	0.015	my5744_rel.cz11a_c8r32
0.000	0.000	99.861	0.139	0.000	0.000	0.000	0.000	0.000	0.000	0.013	my8028_rel.cz11a_c8r32
0.000	0.000	99.944	0.056	0.000	0.000	0.000	0.000	0.000	0.000	0.012	my8032_rel.cz11a_c8r32
0.000	0.000	99.583	0.417	0.000	0.000	0.000	0.000	0.000	0.000	0.014	my8036_rel.cz11a_c8r32
0.000	0.000	99.722	0.278	0.000	0.000	0.000	0.000	0.000	0.000	0.013	my8037_rel.cz11a_c8r32
Delete response time histogram
256us	1ms	4ms	16ms	64ms	256ms	1s	4s	16s	gt	max	tag
0.000	3.361	46.167	48.556	1.917	0.000	0.000	0.000	0.000	0.000	0.034	my5651_rel.cz11a_c8r32
0.000	51.333	48.250	0.417	0.000	0.000	0.000	0.000	0.000	0.000	0.013	my5744_rel.cz11a_c8r32
0.000	52.222	47.611	0.167	0.000	0.000	0.000	0.000	0.000	0.000	0.010	my8028_rel.cz11a_c8r32
0.000	31.250	68.667	0.083	0.000	0.000	0.000	0.000	0.000	0.000	0.008	my8032_rel.cz11a_c8r32
0.000	37.389	62.139	0.472	0.000	0.000	0.000	0.000	0.000	0.000	0.014	my8036_rel.cz11a_c8r32
0.000	46.806	52.917	0.278	0.000	0.000	0.000	0.000	0.000	0.000	0.008	my8037_rel.cz11a_c8r32
qp100.L2
- qp100.L2: point queries with 100 insert/s per client
- Legend for results is here.
- Each entry lists the percentage of responses that fit in that bucket (slower than max time for previous bucket, faster than min time for next bucket).
Query response time histogram
256us	1ms	4ms	16ms	64ms	256ms	1s	4s	16s	gt	max	tag
99.950	0.046	0.001	0.002	0.000	0.000	0.000	0.000	0.000	0.000	0.009	my5651_rel.cz11a_c8r32
99.923	0.077	nonzero	0.000	0.000	0.000	0.000	0.000	0.000	0.000	0.002	my5744_rel.cz11a_c8r32
99.840	0.160	nonzero	0.000	0.000	0.000	0.000	0.000	0.000	0.000	0.002	my8028_rel.cz11a_c8r32
99.827	0.173	nonzero	0.000	0.000	0.000	0.000	0.000	0.000	0.000	0.002	my8032_rel.cz11a_c8r32
99.777	0.223	nonzero	0.000	0.000	0.000	0.000	0.000	0.000	0.000	0.002	my8036_rel.cz11a_c8r32
99.831	0.169	nonzero	0.000	0.000	0.000	0.000	0.000	0.000	0.000	0.001	my8037_rel.cz11a_c8r32
Insert response time histogram
256us	1ms	4ms	16ms	64ms	256ms	1s	4s	16s	gt	max	tag
0.000	0.000	55.000	44.611	0.389	0.000	0.000	0.000	0.000	0.000	0.022	my5651_rel.cz11a_c8r32
0.000	0.000	99.639	0.361	0.000	0.000	0.000	0.000	0.000	0.000	0.013	my5744_rel.cz11a_c8r32
0.000	0.000	99.833	0.167	0.000	0.000	0.000	0.000	0.000	0.000	0.014	my8028_rel.cz11a_c8r32
0.000	0.000	99.861	0.111	0.028	0.000	0.000	0.000	0.000	0.000	0.023	my8032_rel.cz11a_c8r32
0.000	0.000	99.722	0.278	0.000	0.000	0.000	0.000	0.000	0.000	0.011	my8036_rel.cz11a_c8r32
0.000	0.000	99.556	0.444	0.000	0.000	0.000	0.000	0.000	0.000	0.014	my8037_rel.cz11a_c8r32
Delete response time histogram
256us	1ms	4ms	16ms	64ms	256ms	1s	4s	16s	gt	max	tag
0.000	1.611	53.417	44.722	0.250	0.000	0.000	0.000	0.000	0.000	0.022	my5651_rel.cz11a_c8r32
0.000	37.194	62.472	0.333	0.000	0.000	0.000	0.000	0.000	0.000	0.013	my5744_rel.cz11a_c8r32
0.000	33.722	66.139	0.139	0.000	0.000	0.000	0.000	0.000	0.000	0.012	my8028_rel.cz11a_c8r32
0.000	0.056	99.778	0.139	0.028	0.000	0.000	0.000	0.000	0.000	0.023	my8032_rel.cz11a_c8r32
0.000	5.667	94.028	0.306	0.000	0.000	0.000	0.000	0.000	0.000	0.007	my8036_rel.cz11a_c8r32
0.000	3.611	95.917	0.472	0.000	0.000	0.000	0.000	0.000	0.000	0.007	my8037_rel.cz11a_c8r32
qr500.L3
- qr500.L3: range queries with 500 insert/s per client
- Legend for results is here.
- Each entry lists the percentage of responses that fit in that bucket (slower than max time for previous bucket, faster than min time for next bucket).
Query response time histogram
256us	1ms	4ms	16ms	64ms	256ms	1s	4s	16s	gt	max	tag
99.964	0.033	0.001	0.002	0.000	0.000	0.000	0.000	0.000	0.000	0.009	my5651_rel.cz11a_c8r32
99.974	0.026	nonzero	nonzero	0.000	0.000	0.000	0.000	0.000	0.000	0.005	my5744_rel.cz11a_c8r32
99.936	0.064	nonzero	nonzero	0.000	0.000	0.000	0.000	0.000	0.000	0.006	my8028_rel.cz11a_c8r32
99.910	0.090	nonzero	0.000	0.000	0.000	0.000	0.000	0.000	0.000	0.002	my8032_rel.cz11a_c8r32
99.958	0.041	nonzero	0.000	0.000	0.000	0.000	0.000	0.000	0.000	0.002	my8036_rel.cz11a_c8r32
99.960	0.040	nonzero	0.000	0.000	0.000	0.000	0.000	0.000	0.000	0.002	my8037_rel.cz11a_c8r32
Insert response time histogram
256us	1ms	4ms	16ms	64ms	256ms	1s	4s	16s	gt	max	tag
0.000	13.989	76.783	9.139	0.089	0.000	0.000	0.000	0.000	0.000	0.022	my5651_rel.cz11a_c8r32
0.000	7.589	92.139	0.272	0.000	0.000	0.000	0.000	0.000	0.000	0.012	my5744_rel.cz11a_c8r32
0.000	0.017	99.844	0.139	0.000	0.000	0.000	0.000	0.000	0.000	0.015	my8028_rel.cz11a_c8r32
0.000	0.000	99.872	0.122	0.006	0.000	0.000	0.000	0.000	0.000	0.023	my8032_rel.cz11a_c8r32
0.000	0.000	99.817	0.183	0.000	0.000	0.000	0.000	0.000	0.000	0.014	my8036_rel.cz11a_c8r32
0.000	0.000	99.850	0.150	0.000	0.000	0.000	0.000	0.000	0.000	0.014	my8037_rel.cz11a_c8r32
Delete response time histogram
256us	1ms	4ms	16ms	64ms	256ms	1s	4s	16s	gt	max	tag
0.000	23.772	67.028	9.156	0.044	0.000	0.000	0.000	0.000	0.000	0.022	my5651_rel.cz11a_c8r32
0.000	88.289	11.506	0.206	0.000	0.000	0.000	0.000	0.000	0.000	0.012	my5744_rel.cz11a_c8r32
0.000	89.339	10.606	0.056	0.000	0.000	0.000	0.000	0.000	0.000	0.008	my8028_rel.cz11a_c8r32
0.000	55.050	44.878	0.067	0.006	0.000	0.000	0.000	0.000	0.000	0.023	my8032_rel.cz11a_c8r32
0.000	81.017	18.822	0.161	0.000	0.000	0.000	0.000	0.000	0.000	0.007	my8036_rel.cz11a_c8r32
0.000	78.561	21.333	0.106	0.000	0.000	0.000	0.000	0.000	0.000	0.008	my8037_rel.cz11a_c8r32
qp500.L4
- qp500.L4: point queries with 500 insert/s per client
- Legend for results is here.
- Each entry lists the percentage of responses that fit in that bucket (slower than max time for previous bucket, faster than min time for next bucket).
Query response time histogram
256us	1ms	4ms	16ms	64ms	256ms	1s	4s	16s	gt	max	tag
99.921	0.076	0.001	0.001	0.000	0.000	0.000	0.000	0.000	0.000	0.010	my5651_rel.cz11a_c8r32
99.885	0.115	nonzero	nonzero	0.000	0.000	0.000	0.000	0.000	0.000	0.005	my5744_rel.cz11a_c8r32
99.803	0.197	nonzero	nonzero	0.000	0.000	0.000	0.000	0.000	0.000	0.011	my8028_rel.cz11a_c8r32
99.796	0.204	nonzero	0.000	0.000	0.000	0.000	0.000	0.000	0.000	0.002	my8032_rel.cz11a_c8r32
99.762	0.238	nonzero	0.000	0.000	0.000	0.000	0.000	0.000	0.000	0.002	my8036_rel.cz11a_c8r32
99.795	0.205	nonzero	0.000	0.000	0.000	0.000	0.000	0.000	0.000	0.002	my8037_rel.cz11a_c8r32
Insert response time histogram
256us	1ms	4ms	16ms	64ms	256ms	1s	4s	16s	gt	max	tag
0.000	12.794	77.939	9.194	0.072	0.000	0.000	0.000	0.000	0.000	0.023	my5651_rel.cz11a_c8r32
0.000	0.561	99.194	0.244	0.000	0.000	0.000	0.000	0.000	0.000	0.013	my5744_rel.cz11a_c8r32
0.000	0.000	99.883	0.117	0.000	0.000	0.000	0.000	0.000	0.000	0.014	my8028_rel.cz11a_c8r32
0.000	0.000	99.833	0.161	0.006	0.000	0.000	0.000	0.000	0.000	0.017	my8032_rel.cz11a_c8r32
0.000	0.000	99.933	0.050	0.017	0.000	0.000	0.000	0.000	0.000	0.023	my8036_rel.cz11a_c8r32
0.000	0.000	99.822	0.172	0.006	0.000	0.000	0.000	0.000	0.000	0.028	my8037_rel.cz11a_c8r32
Delete response time histogram
256us	1ms	4ms	16ms	64ms	256ms	1s	4s	16s	gt	max	tag
0.000	22.833	67.978	9.128	0.061	0.000	0.000	0.000	0.000	0.000	0.022	my5651_rel.cz11a_c8r32
0.000	79.628	20.150	0.222	0.000	0.000	0.000	0.000	0.000	0.000	0.013	my5744_rel.cz11a_c8r32
0.000	85.489	14.428	0.083	0.000	0.000	0.000	0.000	0.000	0.000	0.014	my8028_rel.cz11a_c8r32
0.000	29.822	70.033	0.144	0.000	0.000	0.000	0.000	0.000	0.000	0.010	my8032_rel.cz11a_c8r32
0.000	46.589	53.344	0.056	0.011	0.000	0.000	0.000	0.000	0.000	0.023	my8036_rel.cz11a_c8r32
0.000	44.000	55.894	0.100	0.006	0.000	0.000	0.000	0.000	0.000	0.028	my8037_rel.cz11a_c8r32
qr1000.L5
- qr1000.L5: range queries with 1000 insert/s per client
- Legend for results is here.
- Each entry lists the percentage of responses that fit in that bucket (slower than max time for previous bucket, faster than min time for next bucket).
Query response time histogram
256us	1ms	4ms	16ms	64ms	256ms	1s	4s	16s	gt	max	tag
99.959	0.037	0.001	0.002	0.000	0.000	0.000	0.000	0.000	0.000	0.014	my5651_rel.cz11a_c8r32
99.965	0.035	nonzero	0.000	0.000	0.000	0.000	0.000	0.000	0.000	0.004	my5744_rel.cz11a_c8r32
99.929	0.071	nonzero	0.000	0.000	0.000	0.000	0.000	0.000	0.000	0.002	my8028_rel.cz11a_c8r32
99.889	0.111	nonzero	0.000	0.000	0.000	0.000	0.000	0.000	0.000	0.002	my8032_rel.cz11a_c8r32
99.950	0.049	nonzero	0.000	0.000	0.000	0.000	0.000	0.000	0.000	0.002	my8036_rel.cz11a_c8r32
99.949	0.051	nonzero	0.000	0.000	0.000	0.000	0.000	0.000	0.000	0.002	my8037_rel.cz11a_c8r32
Insert response time histogram
256us	1ms	4ms	16ms	64ms	256ms	1s	4s	16s	gt	max	tag
0.000	17.550	76.542	5.836	0.072	0.000	0.000	0.000	0.000	0.000	0.025	my5651_rel.cz11a_c8r32
0.000	11.481	88.283	0.231	0.006	0.000	0.000	0.000	0.000	0.000	0.019	my5744_rel.cz11a_c8r32
0.000	0.036	99.769	0.194	0.000	0.000	0.000	0.000	0.000	0.000	0.015	my8028_rel.cz11a_c8r32
0.000	0.000	99.856	0.142	0.003	0.000	0.000	0.000	0.000	0.000	0.023	my8032_rel.cz11a_c8r32
0.000	0.000	99.758	0.239	0.003	0.000	0.000	0.000	0.000	0.000	0.023	my8036_rel.cz11a_c8r32
0.000	0.000	99.881	0.117	0.003	0.000	0.000	0.000	0.000	0.000	0.019	my8037_rel.cz11a_c8r32
Delete response time histogram
256us	1ms	4ms	16ms	64ms	256ms	1s	4s	16s	gt	max	tag
0.000	32.400	61.889	5.661	0.050	0.000	0.000	0.000	0.000	0.000	0.026	my5651_rel.cz11a_c8r32
0.000	92.669	7.139	0.192	0.000	0.000	0.000	0.000	0.000	0.000	0.014	my5744_rel.cz11a_c8r32
0.000	93.206	6.653	0.142	0.000	0.000	0.000	0.000	0.000	0.000	0.014	my8028_rel.cz11a_c8r32
0.000	59.206	40.675	0.117	0.003	0.000	0.000	0.000	0.000	0.000	0.022	my8032_rel.cz11a_c8r32
0.000	84.367	15.472	0.158	0.003	0.000	0.000	0.000	0.000	0.000	0.023	my8036_rel.cz11a_c8r32
0.000	84.203	15.703	0.092	0.003	0.000	0.000	0.000	0.000	0.000	0.019	my8037_rel.cz11a_c8r32
qp1000.L6
- qp1000.L6: point queries with 1000 insert/s per client
- Legend for results is here.
- Each entry lists the percentage of responses that fit in that bucket (slower than max time for previous bucket, faster than min time for next bucket).
Query response time histogram
256us	1ms	4ms	16ms	64ms	256ms	1s	4s	16s	gt	max	tag
99.855	0.140	0.003	0.002	0.000	0.000	0.000	0.000	0.000	0.000	0.010	my5651_rel.cz11a_c8r32
99.856	0.144	nonzero	0.000	0.000	0.000	0.000	0.000	0.000	0.000	0.002	my5744_rel.cz11a_c8r32
99.748	0.252	nonzero	0.000	0.000	0.000	0.000	0.000	0.000	0.000	0.002	my8028_rel.cz11a_c8r32
99.711	0.289	nonzero	0.000	0.000	0.000	0.000	0.000	0.000	0.000	0.002	my8032_rel.cz11a_c8r32
99.660	0.340	nonzero	0.000	0.000	0.000	0.000	0.000	0.000	0.000	0.001	my8036_rel.cz11a_c8r32
99.620	0.380	nonzero	0.000	0.000	0.000	0.000	0.000	0.000	0.000	0.002	my8037_rel.cz11a_c8r32
Insert response time histogram
256us	1ms	4ms	16ms	64ms	256ms	1s	4s	16s	gt	max	tag
0.000	17.981	77.272	4.711	0.036	0.000	0.000	0.000	0.000	0.000	0.022	my5651_rel.cz11a_c8r32
0.000	4.814	95.014	0.172	0.000	0.000	0.000	0.000	0.000	0.000	0.016	my5744_rel.cz11a_c8r32
0.000	0.003	99.900	0.097	0.000	0.000	0.000	0.000	0.000	0.000	0.015	my8028_rel.cz11a_c8r32
0.000	0.000	99.764	0.233	0.003	0.000	0.000	0.000	0.000	0.000	0.026	my8032_rel.cz11a_c8r32
0.000	0.000	99.753	0.244	0.003	0.000	0.000	0.000	0.000	0.000	0.018	my8036_rel.cz11a_c8r32
0.000	0.000	99.758	0.233	0.006	0.000	0.003	0.000	0.000	0.000	0.272	my8037_rel.cz11a_c8r32
Delete response time histogram
256us	1ms	4ms	16ms	64ms	256ms	1s	4s	16s	gt	max	tag
0.000	32.139	63.150	4.686	0.025	0.000	0.000	0.000	0.000	0.000	0.022	my5651_rel.cz11a_c8r32
0.000	89.797	10.069	0.131	0.003	0.000	0.000	0.000	0.000	0.000	0.017	my5744_rel.cz11a_c8r32
0.000	90.683	9.239	0.078	0.000	0.000	0.000	0.000	0.000	0.000	0.013	my8028_rel.cz11a_c8r32
0.000	45.061	54.775	0.161	0.003	0.000	0.000	0.000	0.000	0.000	0.026	my8032_rel.cz11a_c8r32
0.000	59.783	40.064	0.150	0.003	0.000	0.000	0.000	0.000	0.000	0.018	my8036_rel.cz11a_c8r32
0.000	58.772	41.089	0.136	0.000	0.000	0.003	0.000	0.000	0.000	0.290	my8037_rel.cz11a_c8r32