Introduction
This is a report for the insert benchmark with 30M docs and 1 client(s). It is generated by scripts (bash, awk, sed) and Tufte might not be impressed. An overview of the insert benchmark is here and a short update is here. Below, by DBMS, I mean DBMS+version.config. An example is my8020.c10b40 where my means MySQL, 8020 is version 8.0.20 and c10b40 is the name for the configuration file.
The test server has 8 AMD cores, 16G RAM and an NVMe SSD. It is described here as the Beelink. The benchmark was run with 1 client and there were 1 or 3 connections per client (1 for queries or inserts without rate limits, 1+1 for rate limited inserts+deletes). It uses 1 table. It loads 30M rows per table without secondary indexes, creates 3 secondary indexes per table, then inserts 40m+10m rows per table with a delete per insert to avoid growing the table. It then does 6 read+write tests for 1800s each that do queries as fast as possible with 100,100,500,500,1000,1000 inserts/s and the same for deletes/s per client concurrent with the queries. The database is cached in memory. Clients and the DBMS share one server. The per-database configs are in the per-database subdirectories here.
The tested DBMS are:
- fbmy5635_rel_240606_4f3a57a1.cza1_c8r32 - MyRocks 5.6.35 with the cza1_c8r32 config compiled at git sha 4f3a57a1 on 240606 using RocksDB 8.7.0
- fbmy8028_rel_240606_c6c83b18.cza1_c8r32 - MyRocks 8.0.28 with the cza1_c8r32 config compiled at git sha c6c83b18 on 240606 using RocksDB 8.7.0
- fbmy8032_rel_240606_59f03d5a.cza1_c8r32 - MyRocks 8.0.36 with the cza1_c8r32 config compiled at git sha 59f03d5a on 240606 using RocksDB 9.3.1
Contents
- Summary
- l.i0: load without secondary indexes
- l.x: create secondary indexes
- l.i1: continue load after secondary indexes created with 50 inserts per transaction
- l.i2: continue load after secondary indexes created with 5 inserts per transaction
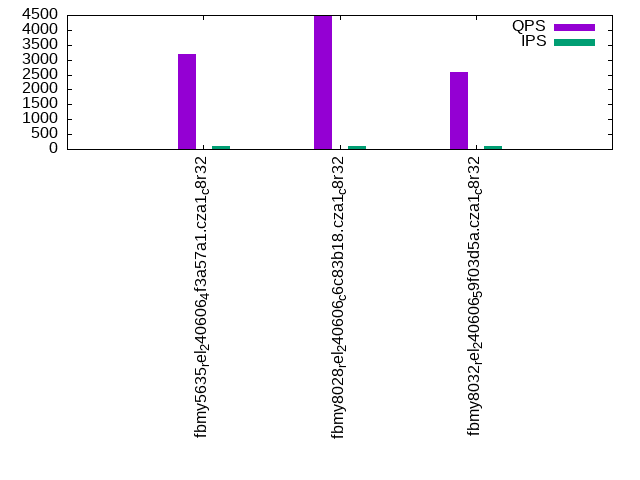
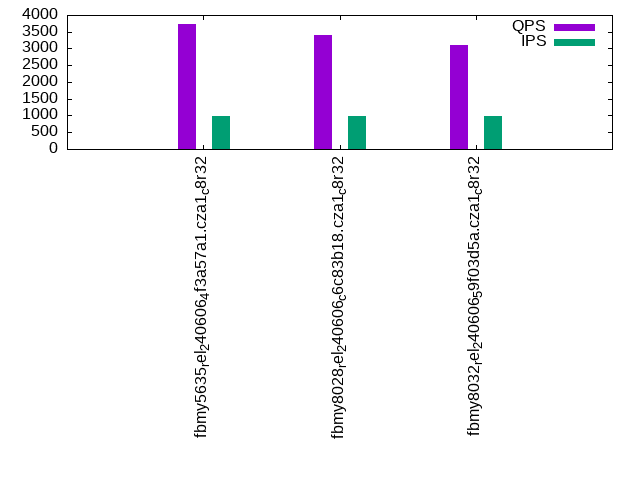
- qr100.L1: range queries with 100 insert/s per client
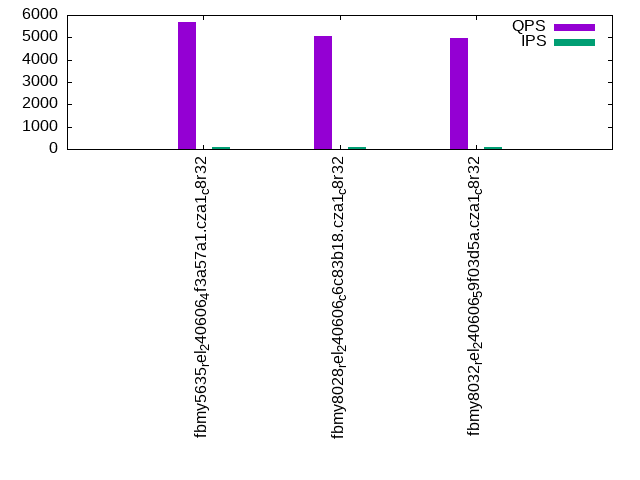
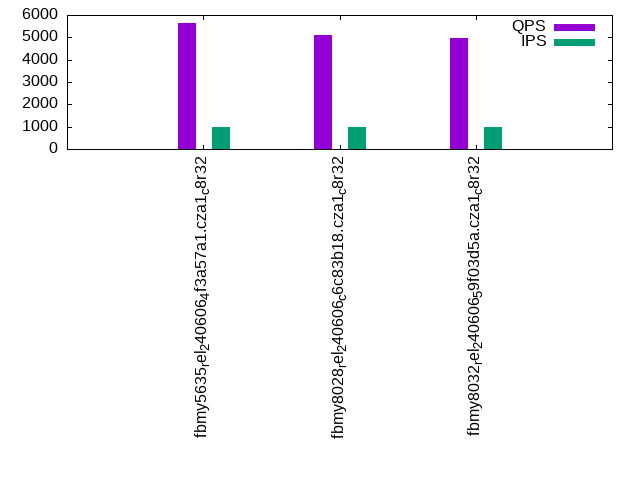
- qp100.L2: point queries with 100 insert/s per client
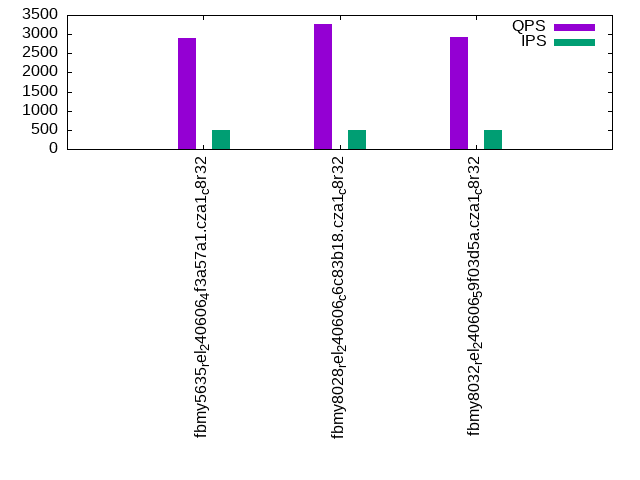
- qr500.L3: range queries with 500 insert/s per client
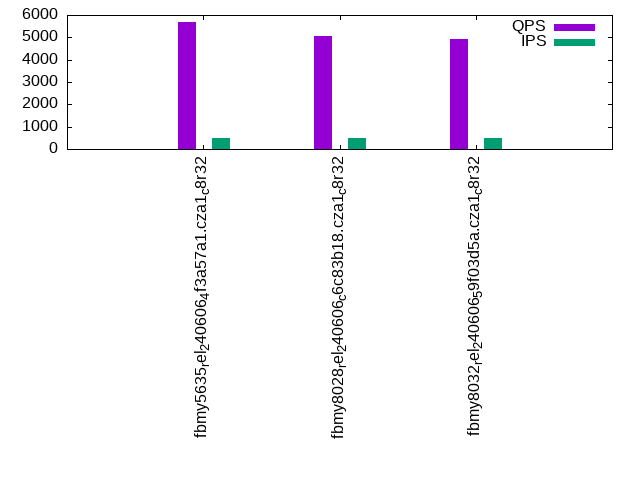
- qp500.L4: point queries with 500 insert/s per client
- qr1000.L5: range queries with 1000 insert/s per client
- qp1000.L6: point queries with 1000 insert/s per client
Summary
The numbers are inserts/s for l.i0, l.i1 and l.i2, indexed docs (or rows) /s for l.x and queries/s for qr100, qp100 thru qr1000, qp1000" The values are the average rate over the entire test for inserts (IPS) and queries (QPS). The range of values for IPS and QPS is split into 3 parts: bottom 25%, middle 50%, top 25%. Values in the bottom 25% have a red background, values in the top 25% have a green background and values in the middle have no color. A gray background is used for values that can be ignored because the DBMS did not sustain the target insert rate. Red backgrounds are not used when the minimum value is within 80% of the max value.
| dbms | l.i0 | l.x | l.i1 | l.i2 | qr100 | qp100 | qr500 | qp500 | qr1000 | qp1000 |
|---|---|---|---|---|---|---|---|---|---|---|
| fbmy5635_rel_240606_4f3a57a1.cza1_c8r32 | 145631 | 156250 | 45045 | 17575 | 3204 | 5682 | 2902 | 5691 | 3740 | 5637 |
| fbmy8028_rel_240606_c6c83b18.cza1_c8r32 | 102389 | 136364 | 39331 | 15873 | 4477 | 5059 | 3258 | 5074 | 3401 | 5085 |
| fbmy8032_rel_240606_59f03d5a.cza1_c8r32 | 96463 | 133929 | 41408 | 15504 | 2586 | 4961 | 2913 | 4925 | 3111 | 4960 |
This table has relative throughput, throughput for the DBMS relative to the DBMS in the first line, using the absolute throughput from the previous table. Values less than 0.95 have a yellow background. Values greater than 1.05 have a blue background.
| dbms | l.i0 | l.x | l.i1 | l.i2 | qr100 | qp100 | qr500 | qp500 | qr1000 | qp1000 |
|---|---|---|---|---|---|---|---|---|---|---|
| fbmy5635_rel_240606_4f3a57a1.cza1_c8r32 | 1.00 | 1.00 | 1.00 | 1.00 | 1.00 | 1.00 | 1.00 | 1.00 | 1.00 | 1.00 |
| fbmy8028_rel_240606_c6c83b18.cza1_c8r32 | 0.70 | 0.87 | 0.87 | 0.90 | 1.40 | 0.89 | 1.12 | 0.89 | 0.91 | 0.90 |
| fbmy8032_rel_240606_59f03d5a.cza1_c8r32 | 0.66 | 0.86 | 0.92 | 0.88 | 0.81 | 0.87 | 1.00 | 0.87 | 0.83 | 0.88 |
This lists the average rate of inserts/s for the tests that do inserts concurrent with queries. For such tests the query rate is listed in the table above. The read+write tests are setup so that the insert rate should match the target rate every second. Cells that are not at least 95% of the target have a red background to indicate a failure to satisfy the target.
| dbms | qr100.L1 | qp100.L2 | qr500.L3 | qp500.L4 | qr1000.L5 | qp1000.L6 |
|---|---|---|---|---|---|---|
| fbmy5635_rel_240606_4f3a57a1.cza1_c8r32 | 100 | 100 | 499 | 499 | 999 | 999 |
| fbmy8028_rel_240606_c6c83b18.cza1_c8r32 | 100 | 100 | 499 | 499 | 999 | 999 |
| fbmy8032_rel_240606_59f03d5a.cza1_c8r32 | 100 | 100 | 499 | 499 | 999 | 999 |
| target | 100 | 100 | 500 | 500 | 1000 | 1000 |
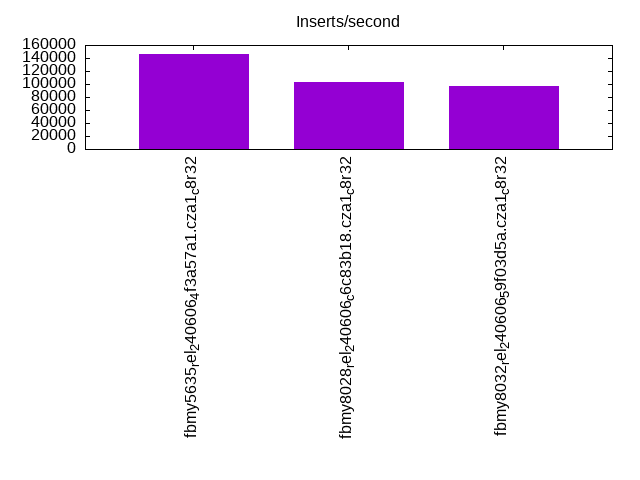
l.i0
l.i0: load without secondary indexes. Graphs for performance per 1-second interval are here.
Average throughput:
Insert response time histogram: each cell has the percentage of responses that take <= the time in the header and max is the max response time in seconds. For the max column values in the top 25% of the range have a red background and in the bottom 25% of the range have a green background. The red background is not used when the min value is within 80% of the max value.
| dbms | 256us | 1ms | 4ms | 16ms | 64ms | 256ms | 1s | 4s | 16s | gt | max |
|---|---|---|---|---|---|---|---|---|---|---|---|
| fbmy5635_rel_240606_4f3a57a1.cza1_c8r32 | 99.808 | 0.120 | 0.069 | 0.003 | 0.115 | ||||||
| fbmy8028_rel_240606_c6c83b18.cza1_c8r32 | 95.754 | 4.045 | 0.145 | 0.052 | 0.004 | 0.147 | |||||
| fbmy8032_rel_240606_59f03d5a.cza1_c8r32 | 78.877 | 20.915 | 0.148 | 0.056 | 0.004 | 0.106 |
Performance metrics for the DBMS listed above. Some are normalized by throughput, others are not. Legend for results is here.
ips	qps	rps	rmbps	wps	wmbps	rpq	rkbpq	wpi	wkbpi	csps	cpups	cspq	cpupq	dbgb1	dbgb2	rss	maxop	p50	p99	tag
145631	0	1	0.0	1.0	0.0	0.000	0.000	0.000	0.000	15051	21.9	0.103	12	1.0	2.5	0.3	0.115	61038	0	fbmy5635_rel_240606_4f3a57a1.cza1_c8r32
102389	0	2	0.2	1.3	0.0	0.000	0.002	0.000	0.000	11144	19.0	0.109	15	0.9	2.7	0.6	0.147	102887	86308	fbmy8028_rel_240606_c6c83b18.cza1_c8r32
96463	0	0	0.0	2.0	0.0	0.000	0.000	0.000	0.000	10672	18.8	0.111	16	0.9	2.7	0.6	0.106	96442	83210	fbmy8032_rel_240606_59f03d5a.cza1_c8r32
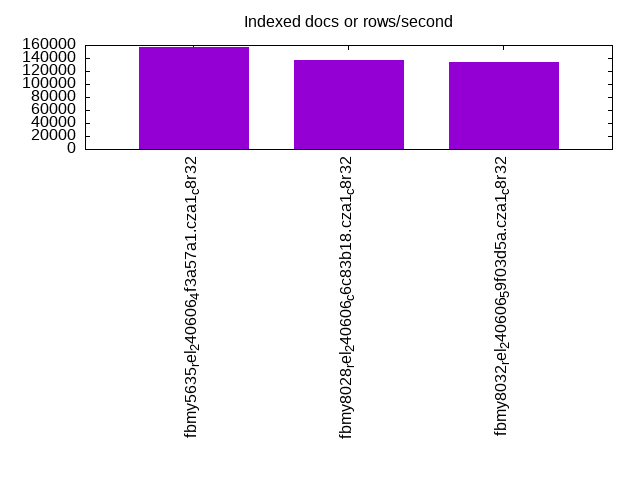
l.x
l.x: create secondary indexes.
Average throughput:
Performance metrics for the DBMS listed above. Some are normalized by throughput, others are not. Legend for results is here.
ips	qps	rps	rmbps	wps	wmbps	rpq	rkbpq	wpi	wkbpi	csps	cpups	cspq	cpupq	dbgb1	dbgb2	rss	maxop	p50	p99	tag
156250	0	0	0.0	1.1	0.0	0.000	0.000	0.000	0.000	173	12.2	0.001	6	2.0	3.6	2.3	0.001	NA	NA	fbmy5635_rel_240606_4f3a57a1.cza1_c8r32
136364	0	0	0.0	1.0	0.0	0.000	0.000	0.000	0.000	316	11.6	0.002	7	2.0	3.8	2.7	0.002	NA	NA	fbmy8028_rel_240606_c6c83b18.cza1_c8r32
133929	0	0	0.0	1.6	0.0	0.000	0.000	0.000	0.000	515	11.6	0.004	7	2.0	3.8	2.6	0.009	NA	NA	fbmy8032_rel_240606_59f03d5a.cza1_c8r32
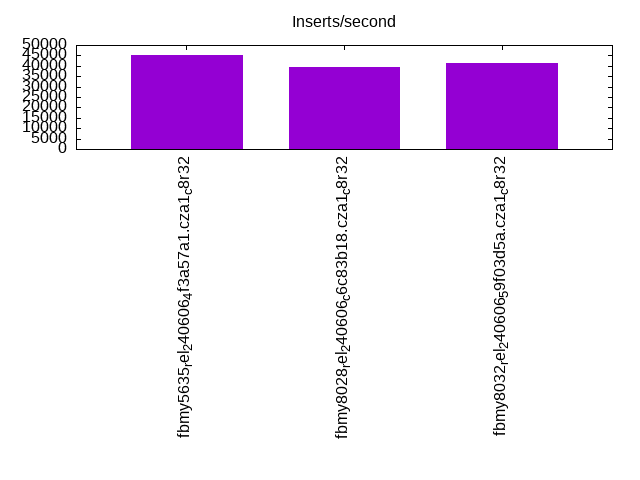
l.i1
l.i1: continue load after secondary indexes created with 50 inserts per transaction. Graphs for performance per 1-second interval are here.
Average throughput:
Insert response time histogram: each cell has the percentage of responses that take <= the time in the header and max is the max response time in seconds. For the max column values in the top 25% of the range have a red background and in the bottom 25% of the range have a green background. The red background is not used when the min value is within 80% of the max value.
| dbms | 256us | 1ms | 4ms | 16ms | 64ms | 256ms | 1s | 4s | 16s | gt | max |
|---|---|---|---|---|---|---|---|---|---|---|---|
| fbmy5635_rel_240606_4f3a57a1.cza1_c8r32 | 86.919 | 12.983 | 0.093 | 0.001 | 0.004 | 0.125 | |||||
| fbmy8028_rel_240606_c6c83b18.cza1_c8r32 | 27.809 | 71.973 | 0.165 | 0.051 | 0.003 | 0.147 | |||||
| fbmy8032_rel_240606_59f03d5a.cza1_c8r32 | 15.724 | 84.054 | 0.171 | 0.047 | 0.004 | 0.119 |
Delete response time histogram: each cell has the percentage of responses that take <= the time in the header and max is the max response time in seconds. For the max column values in the top 25% of the range have a red background and in the bottom 25% of the range have a green background. The red background is not used when the min value is within 80% of the max value.
| dbms | 256us | 1ms | 4ms | 16ms | 64ms | 256ms | 1s | 4s | 16s | gt | max |
|---|---|---|---|---|---|---|---|---|---|---|---|
| fbmy5635_rel_240606_4f3a57a1.cza1_c8r32 | 85.878 | 14.015 | 0.097 | 0.007 | 0.003 | 0.125 | |||||
| fbmy8028_rel_240606_c6c83b18.cza1_c8r32 | 32.708 | 67.065 | 0.163 | 0.061 | 0.003 | 0.133 | |||||
| fbmy8032_rel_240606_59f03d5a.cza1_c8r32 | 21.754 | 78.017 | 0.168 | 0.057 | 0.004 | 0.126 |
Performance metrics for the DBMS listed above. Some are normalized by throughput, others are not. Legend for results is here.
ips	qps	rps	rmbps	wps	wmbps	rpq	rkbpq	wpi	wkbpi	csps	cpups	cspq	cpupq	dbgb1	dbgb2	rss	maxop	p50	p99	tag
45045	0	1	0.0	1.2	0.0	0.000	0.000	0.000	0.000	20136	42.8	0.447	76	2.3	3.0	7.1	0.125	45749	29130	fbmy5635_rel_240606_4f3a57a1.cza1_c8r32
39331	0	0	0.0	1.8	0.0	0.000	0.000	0.000	0.000	18123	41.6	0.461	85	2.5	3.3	7.0	0.147	40605	22225	fbmy8028_rel_240606_c6c83b18.cza1_c8r32
41408	0	0	0.0	1.9	0.0	0.000	0.000	0.000	0.000	19367	44.2	0.468	85	2.3	3.1	7.6	0.119	41505	35312	fbmy8032_rel_240606_59f03d5a.cza1_c8r32
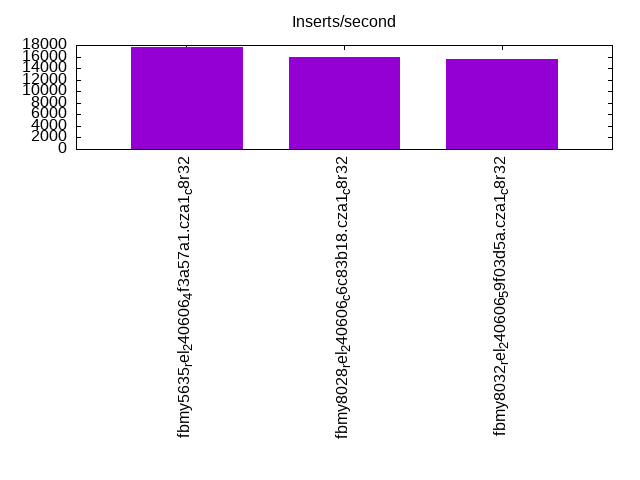
l.i2
l.i2: continue load after secondary indexes created with 5 inserts per transaction. Graphs for performance per 1-second interval are here.
Average throughput:
Insert response time histogram: each cell has the percentage of responses that take <= the time in the header and max is the max response time in seconds. For the max column values in the top 25% of the range have a red background and in the bottom 25% of the range have a green background. The red background is not used when the min value is within 80% of the max value.
| dbms | 256us | 1ms | 4ms | 16ms | 64ms | 256ms | 1s | 4s | 16s | gt | max |
|---|---|---|---|---|---|---|---|---|---|---|---|
| fbmy5635_rel_240606_4f3a57a1.cza1_c8r32 | 98.746 | 1.222 | 0.006 | 0.025 | nonzero | 0.001 | 0.079 | ||||
| fbmy8028_rel_240606_c6c83b18.cza1_c8r32 | 69.098 | 30.847 | 0.007 | 0.040 | 0.007 | 0.001 | 0.109 | ||||
| fbmy8032_rel_240606_59f03d5a.cza1_c8r32 | 47.310 | 52.633 | 0.006 | 0.043 | 0.007 | nonzero | 0.078 |
Delete response time histogram: each cell has the percentage of responses that take <= the time in the header and max is the max response time in seconds. For the max column values in the top 25% of the range have a red background and in the bottom 25% of the range have a green background. The red background is not used when the min value is within 80% of the max value.
| dbms | 256us | 1ms | 4ms | 16ms | 64ms | 256ms | 1s | 4s | 16s | gt | max |
|---|---|---|---|---|---|---|---|---|---|---|---|
| fbmy5635_rel_240606_4f3a57a1.cza1_c8r32 | 95.187 | 4.781 | 0.006 | 0.026 | nonzero | 0.001 | 0.079 | ||||
| fbmy8028_rel_240606_c6c83b18.cza1_c8r32 | 25.125 | 74.817 | 0.008 | 0.042 | 0.008 | nonzero | 0.089 | ||||
| fbmy8032_rel_240606_59f03d5a.cza1_c8r32 | 0.831 | 99.109 | 0.008 | 0.045 | 0.007 | nonzero | 0.079 |
Performance metrics for the DBMS listed above. Some are normalized by throughput, others are not. Legend for results is here.
ips	qps	rps	rmbps	wps	wmbps	rpq	rkbpq	wpi	wkbpi	csps	cpups	cspq	cpupq	dbgb1	dbgb2	rss	maxop	p50	p99	tag
17575	0	0	0.0	1.8	0.0	0.000	0.000	0.000	0.001	76727	40.7	4.366	185	2.1	2.3	9.7	0.079	18076	7547	fbmy5635_rel_240606_4f3a57a1.cza1_c8r32
15873	0	0	0.0	1.6	0.0	0.000	0.000	0.000	0.001	66510	40.9	4.190	206	2.3	2.7	10.0	0.109	16198	5876	fbmy8028_rel_240606_c6c83b18.cza1_c8r32
15504	0	0	0.0	1.9	0.0	0.000	0.000	0.000	0.001	64822	40.6	4.181	210	2.1	2.5	10.4	0.078	15598	13795	fbmy8032_rel_240606_59f03d5a.cza1_c8r32
qr100.L1
qr100.L1: range queries with 100 insert/s per client. Graphs for performance per 1-second interval are here.
Average throughput:
Query response time histogram: each cell has the percentage of responses that take <= the time in the header and max is the max response time in seconds. For max values in the top 25% of the range have a red background and in the bottom 25% of the range have a green background. The red background is not used when the min value is within 80% of the max value.
| dbms | 256us | 1ms | 4ms | 16ms | 64ms | 256ms | 1s | 4s | 16s | gt | max |
|---|---|---|---|---|---|---|---|---|---|---|---|
| fbmy5635_rel_240606_4f3a57a1.cza1_c8r32 | 80.751 | 14.310 | 4.939 | nonzero | nonzero | 0.036 | |||||
| fbmy8028_rel_240606_c6c83b18.cza1_c8r32 | 80.279 | 19.721 | 0.001 | 0.002 | |||||||
| fbmy8032_rel_240606_59f03d5a.cza1_c8r32 | 66.570 | 23.063 | 10.366 | nonzero | 0.034 |
Insert response time histogram: each cell has the percentage of responses that take <= the time in the header and max is the max response time in seconds. For max values in the top 25% of the range have a red background and in the bottom 25% of the range have a green background. The red background is not used when the min value is within 80% of the max value.
| dbms | 256us | 1ms | 4ms | 16ms | 64ms | 256ms | 1s | 4s | 16s | gt | max |
|---|---|---|---|---|---|---|---|---|---|---|---|
| fbmy5635_rel_240606_4f3a57a1.cza1_c8r32 | 38.722 | 60.917 | 0.361 | 0.013 | |||||||
| fbmy8028_rel_240606_c6c83b18.cza1_c8r32 | 7.944 | 91.500 | 0.500 | 0.056 | 0.017 | ||||||
| fbmy8032_rel_240606_59f03d5a.cza1_c8r32 | 2.972 | 96.667 | 0.333 | 0.028 | 0.023 |
Delete response time histogram: each cell has the percentage of responses that take <= the time in the header and max is the max response time in seconds. For max values in the top 25% of the range have a red background and in the bottom 25% of the range have a green background. The red background is not used when the min value is within 80% of the max value.
| dbms | 256us | 1ms | 4ms | 16ms | 64ms | 256ms | 1s | 4s | 16s | gt | max |
|---|---|---|---|---|---|---|---|---|---|---|---|
| fbmy5635_rel_240606_4f3a57a1.cza1_c8r32 | 47.583 | 52.056 | 0.361 | 0.013 | |||||||
| fbmy8028_rel_240606_c6c83b18.cza1_c8r32 | 30.917 | 68.556 | 0.472 | 0.056 | 0.016 | ||||||
| fbmy8032_rel_240606_59f03d5a.cza1_c8r32 | 18.000 | 81.667 | 0.306 | 0.028 | 0.022 |
Performance metrics for the DBMS listed above. Some are normalized by throughput, others are not. Legend for results is here.
ips	qps	rps	rmbps	wps	wmbps	rpq	rkbpq	wpi	wkbpi	csps	cpups	cspq	cpupq	dbgb1	dbgb2	rss	maxop	p50	p99	tag
100	3204	0	0.0	1.0	0.0	0.000	0.000	0.010	0.073	12375	12.2	3.862	305	2.1	2.2	10.4	0.036	3596	2317	fbmy5635_rel_240606_4f3a57a1.cza1_c8r32
100	4477	0	0.0	1.1	0.0	0.000	0.000	0.011	0.081	17358	12.3	3.877	220	2.1	2.3	10.5	0.002	4475	4203	fbmy8028_rel_240606_c6c83b18.cza1_c8r32
100	2586	0	0.0	1.6	0.0	0.000	0.000	0.016	0.104	10336	12.4	3.997	384	2.1	2.4	11.0	0.034	2589	2397	fbmy8032_rel_240606_59f03d5a.cza1_c8r32
qp100.L2
qp100.L2: point queries with 100 insert/s per client. Graphs for performance per 1-second interval are here.
Average throughput:
Query response time histogram: each cell has the percentage of responses that take <= the time in the header and max is the max response time in seconds. For max values in the top 25% of the range have a red background and in the bottom 25% of the range have a green background. The red background is not used when the min value is within 80% of the max value.
| dbms | 256us | 1ms | 4ms | 16ms | 64ms | 256ms | 1s | 4s | 16s | gt | max |
|---|---|---|---|---|---|---|---|---|---|---|---|
| fbmy5635_rel_240606_4f3a57a1.cza1_c8r32 | 99.706 | 0.294 | nonzero | 0.002 | |||||||
| fbmy8028_rel_240606_c6c83b18.cza1_c8r32 | 99.623 | 0.377 | nonzero | 0.004 | |||||||
| fbmy8032_rel_240606_59f03d5a.cza1_c8r32 | 99.573 | 0.426 | nonzero | 0.002 |
Insert response time histogram: each cell has the percentage of responses that take <= the time in the header and max is the max response time in seconds. For max values in the top 25% of the range have a red background and in the bottom 25% of the range have a green background. The red background is not used when the min value is within 80% of the max value.
| dbms | 256us | 1ms | 4ms | 16ms | 64ms | 256ms | 1s | 4s | 16s | gt | max |
|---|---|---|---|---|---|---|---|---|---|---|---|
| fbmy5635_rel_240606_4f3a57a1.cza1_c8r32 | 27.972 | 71.417 | 0.611 | 0.014 | |||||||
| fbmy8028_rel_240606_c6c83b18.cza1_c8r32 | 1.306 | 98.361 | 0.278 | 0.056 | 0.022 | ||||||
| fbmy8032_rel_240606_59f03d5a.cza1_c8r32 | 1.056 | 98.667 | 0.222 | 0.056 | 0.022 |
Delete response time histogram: each cell has the percentage of responses that take <= the time in the header and max is the max response time in seconds. For max values in the top 25% of the range have a red background and in the bottom 25% of the range have a green background. The red background is not used when the min value is within 80% of the max value.
| dbms | 256us | 1ms | 4ms | 16ms | 64ms | 256ms | 1s | 4s | 16s | gt | max |
|---|---|---|---|---|---|---|---|---|---|---|---|
| fbmy5635_rel_240606_4f3a57a1.cza1_c8r32 | 43.278 | 56.139 | 0.583 | 0.013 | |||||||
| fbmy8028_rel_240606_c6c83b18.cza1_c8r32 | 12.861 | 86.833 | 0.278 | 0.028 | 0.022 | ||||||
| fbmy8032_rel_240606_59f03d5a.cza1_c8r32 | 10.194 | 89.583 | 0.194 | 0.028 | 0.022 |
Performance metrics for the DBMS listed above. Some are normalized by throughput, others are not. Legend for results is here.
ips	qps	rps	rmbps	wps	wmbps	rpq	rkbpq	wpi	wkbpi	csps	cpups	cspq	cpupq	dbgb1	dbgb2	rss	maxop	p50	p99	tag
100	5682	0	0.0	1.1	0.0	0.000	0.000	0.011	0.082	22869	12.6	4.025	177	2.1	2.2	12.1	0.002	5705	5354	fbmy5635_rel_240606_4f3a57a1.cza1_c8r32
100	5059	0	0.0	1.2	0.0	0.000	0.000	0.012	0.102	20457	12.6	4.044	199	2.2	2.4	12.2	0.004	5067	4795	fbmy8028_rel_240606_c6c83b18.cza1_c8r32
100	4961	0	0.0	1.7	0.0	0.000	0.000	0.017	0.115	20233	12.8	4.078	206	2.1	2.4	12.7	0.002	4971	4715	fbmy8032_rel_240606_59f03d5a.cza1_c8r32
qr500.L3
qr500.L3: range queries with 500 insert/s per client. Graphs for performance per 1-second interval are here.
Average throughput:
Query response time histogram: each cell has the percentage of responses that take <= the time in the header and max is the max response time in seconds. For max values in the top 25% of the range have a red background and in the bottom 25% of the range have a green background. The red background is not used when the min value is within 80% of the max value.
| dbms | 256us | 1ms | 4ms | 16ms | 64ms | 256ms | 1s | 4s | 16s | gt | max |
|---|---|---|---|---|---|---|---|---|---|---|---|
| fbmy5635_rel_240606_4f3a57a1.cza1_c8r32 | 67.208 | 24.004 | 8.787 | nonzero | nonzero | 0.033 | |||||
| fbmy8028_rel_240606_c6c83b18.cza1_c8r32 | 66.520 | 31.012 | 2.468 | nonzero | 0.028 | ||||||
| fbmy8032_rel_240606_59f03d5a.cza1_c8r32 | 68.518 | 24.512 | 6.970 | nonzero | nonzero | 0.032 |
Insert response time histogram: each cell has the percentage of responses that take <= the time in the header and max is the max response time in seconds. For max values in the top 25% of the range have a red background and in the bottom 25% of the range have a green background. The red background is not used when the min value is within 80% of the max value.
| dbms | 256us | 1ms | 4ms | 16ms | 64ms | 256ms | 1s | 4s | 16s | gt | max |
|---|---|---|---|---|---|---|---|---|---|---|---|
| fbmy5635_rel_240606_4f3a57a1.cza1_c8r32 | 83.806 | 16.000 | 0.189 | 0.006 | 0.017 | ||||||
| fbmy8028_rel_240606_c6c83b18.cza1_c8r32 | 18.083 | 81.739 | 0.094 | 0.083 | 0.022 | ||||||
| fbmy8032_rel_240606_59f03d5a.cza1_c8r32 | 9.739 | 90.072 | 0.100 | 0.089 | 0.024 |
Delete response time histogram: each cell has the percentage of responses that take <= the time in the header and max is the max response time in seconds. For max values in the top 25% of the range have a red background and in the bottom 25% of the range have a green background. The red background is not used when the min value is within 80% of the max value.
| dbms | 256us | 1ms | 4ms | 16ms | 64ms | 256ms | 1s | 4s | 16s | gt | max |
|---|---|---|---|---|---|---|---|---|---|---|---|
| fbmy5635_rel_240606_4f3a57a1.cza1_c8r32 | 84.361 | 15.450 | 0.183 | 0.006 | 0.017 | ||||||
| fbmy8028_rel_240606_c6c83b18.cza1_c8r32 | 31.383 | 68.433 | 0.100 | 0.083 | 0.023 | ||||||
| fbmy8032_rel_240606_59f03d5a.cza1_c8r32 | 19.650 | 80.178 | 0.089 | 0.083 | 0.024 |
Performance metrics for the DBMS listed above. Some are normalized by throughput, others are not. Legend for results is here.
ips	qps	rps	rmbps	wps	wmbps	rpq	rkbpq	wpi	wkbpi	csps	cpups	cspq	cpupq	dbgb1	dbgb2	rss	maxop	p50	p99	tag
499	2902	0	0.0	1.0	0.0	0.000	0.000	0.002	0.015	11425	12.7	3.936	350	2.1	2.4	13.9	0.033	2893	2397	fbmy5635_rel_240606_4f3a57a1.cza1_c8r32
499	3258	0	0.0	1.8	0.0	0.000	0.000	0.004	0.024	12912	12.9	3.964	317	2.1	2.6	13.8	0.028	3230	2717	fbmy8028_rel_240606_c6c83b18.cza1_c8r32
499	2913	0	0.0	1.0	0.0	0.000	0.000	0.002	0.016	11807	13.0	4.053	357	2.1	2.6	14.4	0.032	2893	2541	fbmy8032_rel_240606_59f03d5a.cza1_c8r32
qp500.L4
qp500.L4: point queries with 500 insert/s per client. Graphs for performance per 1-second interval are here.
Average throughput:
Query response time histogram: each cell has the percentage of responses that take <= the time in the header and max is the max response time in seconds. For max values in the top 25% of the range have a red background and in the bottom 25% of the range have a green background. The red background is not used when the min value is within 80% of the max value.
| dbms | 256us | 1ms | 4ms | 16ms | 64ms | 256ms | 1s | 4s | 16s | gt | max |
|---|---|---|---|---|---|---|---|---|---|---|---|
| fbmy5635_rel_240606_4f3a57a1.cza1_c8r32 | 99.720 | 0.280 | nonzero | 0.002 | |||||||
| fbmy8028_rel_240606_c6c83b18.cza1_c8r32 | 99.535 | 0.465 | nonzero | 0.003 | |||||||
| fbmy8032_rel_240606_59f03d5a.cza1_c8r32 | 99.566 | 0.434 | nonzero | 0.001 |
Insert response time histogram: each cell has the percentage of responses that take <= the time in the header and max is the max response time in seconds. For max values in the top 25% of the range have a red background and in the bottom 25% of the range have a green background. The red background is not used when the min value is within 80% of the max value.
| dbms | 256us | 1ms | 4ms | 16ms | 64ms | 256ms | 1s | 4s | 16s | gt | max |
|---|---|---|---|---|---|---|---|---|---|---|---|
| fbmy5635_rel_240606_4f3a57a1.cza1_c8r32 | 78.300 | 21.500 | 0.200 | 0.014 | |||||||
| fbmy8028_rel_240606_c6c83b18.cza1_c8r32 | 10.794 | 88.994 | 0.133 | 0.078 | 0.022 | ||||||
| fbmy8032_rel_240606_59f03d5a.cza1_c8r32 | 7.417 | 92.372 | 0.128 | 0.083 | 0.022 |
Delete response time histogram: each cell has the percentage of responses that take <= the time in the header and max is the max response time in seconds. For max values in the top 25% of the range have a red background and in the bottom 25% of the range have a green background. The red background is not used when the min value is within 80% of the max value.
| dbms | 256us | 1ms | 4ms | 16ms | 64ms | 256ms | 1s | 4s | 16s | gt | max |
|---|---|---|---|---|---|---|---|---|---|---|---|
| fbmy5635_rel_240606_4f3a57a1.cza1_c8r32 | 78.506 | 21.306 | 0.189 | 0.014 | |||||||
| fbmy8028_rel_240606_c6c83b18.cza1_c8r32 | 21.761 | 78.028 | 0.133 | 0.078 | 0.022 | ||||||
| fbmy8032_rel_240606_59f03d5a.cza1_c8r32 | 14.511 | 85.278 | 0.133 | 0.078 | 0.023 |
Performance metrics for the DBMS listed above. Some are normalized by throughput, others are not. Legend for results is here.
ips	qps	rps	rmbps	wps	wmbps	rpq	rkbpq	wpi	wkbpi	csps	cpups	cspq	cpupq	dbgb1	dbgb2	rss	maxop	p50	p99	tag
499	5691	1	0.0	1.6	0.0	0.000	0.002	0.003	0.021	23106	13.0	4.060	183	2.1	2.6	15.3	0.002	5706	5434	fbmy5635_rel_240606_4f3a57a1.cza1_c8r32
499	5074	0	0.0	1.9	0.0	0.000	0.000	0.004	0.029	20743	13.2	4.088	208	2.1	2.8	15.1	0.003	5084	4827	fbmy8028_rel_240606_c6c83b18.cza1_c8r32
499	4925	0	0.0	1.0	0.0	0.000	0.000	0.002	0.016	20291	13.2	4.120	214	2.1	2.8	15.9	0.001	4938	4683	fbmy8032_rel_240606_59f03d5a.cza1_c8r32
qr1000.L5
qr1000.L5: range queries with 1000 insert/s per client. Graphs for performance per 1-second interval are here.
Average throughput:
Query response time histogram: each cell has the percentage of responses that take <= the time in the header and max is the max response time in seconds. For max values in the top 25% of the range have a red background and in the bottom 25% of the range have a green background. The red background is not used when the min value is within 80% of the max value.
| dbms | 256us | 1ms | 4ms | 16ms | 64ms | 256ms | 1s | 4s | 16s | gt | max |
|---|---|---|---|---|---|---|---|---|---|---|---|
| fbmy5635_rel_240606_4f3a57a1.cza1_c8r32 | 71.006 | 28.132 | 0.862 | nonzero | nonzero | 0.044 | |||||
| fbmy8028_rel_240606_c6c83b18.cza1_c8r32 | 67.546 | 32.441 | 0.013 | nonzero | 0.031 | ||||||
| fbmy8032_rel_240606_59f03d5a.cza1_c8r32 | 69.841 | 25.652 | 4.507 | nonzero | nonzero | 0.043 |
Insert response time histogram: each cell has the percentage of responses that take <= the time in the header and max is the max response time in seconds. For max values in the top 25% of the range have a red background and in the bottom 25% of the range have a green background. The red background is not used when the min value is within 80% of the max value.
| dbms | 256us | 1ms | 4ms | 16ms | 64ms | 256ms | 1s | 4s | 16s | gt | max |
|---|---|---|---|---|---|---|---|---|---|---|---|
| fbmy5635_rel_240606_4f3a57a1.cza1_c8r32 | 90.361 | 9.494 | 0.142 | 0.003 | 0.062 | ||||||
| fbmy8028_rel_240606_c6c83b18.cza1_c8r32 | 24.744 | 75.053 | 0.111 | 0.089 | 0.003 | 0.067 | |||||
| fbmy8032_rel_240606_59f03d5a.cza1_c8r32 | 13.656 | 86.089 | 0.175 | 0.081 | 0.051 |
Delete response time histogram: each cell has the percentage of responses that take <= the time in the header and max is the max response time in seconds. For max values in the top 25% of the range have a red background and in the bottom 25% of the range have a green background. The red background is not used when the min value is within 80% of the max value.
| dbms | 256us | 1ms | 4ms | 16ms | 64ms | 256ms | 1s | 4s | 16s | gt | max |
|---|---|---|---|---|---|---|---|---|---|---|---|
| fbmy5635_rel_240606_4f3a57a1.cza1_c8r32 | 89.992 | 9.861 | 0.144 | 0.003 | 0.062 | ||||||
| fbmy8028_rel_240606_c6c83b18.cza1_c8r32 | 32.022 | 67.778 | 0.111 | 0.089 | 0.048 | ||||||
| fbmy8032_rel_240606_59f03d5a.cza1_c8r32 | 19.294 | 80.458 | 0.169 | 0.075 | 0.003 | 0.073 |
Performance metrics for the DBMS listed above. Some are normalized by throughput, others are not. Legend for results is here.
ips	qps	rps	rmbps	wps	wmbps	rpq	rkbpq	wpi	wkbpi	csps	cpups	cspq	cpupq	dbgb1	dbgb2	rss	maxop	p50	p99	tag
999	3740	0	0.0	1.8	0.0	0.000	0.000	0.002	0.012	14913	13.4	3.987	287	2.1	3.0	17.9	0.044	3486	2621	fbmy5635_rel_240606_4f3a57a1.cza1_c8r32
999	3401	0	0.0	1.0	0.0	0.000	0.000	0.001	0.008	13765	13.7	4.047	322	2.1	3.2	18.3	0.031	3212	2477	fbmy8028_rel_240606_c6c83b18.cza1_c8r32
999	3111	0	0.0	1.6	0.0	0.000	0.000	0.002	0.012	12862	13.6	4.135	350	2.1	3.2	19.0	0.043	3053	2414	fbmy8032_rel_240606_59f03d5a.cza1_c8r32
qp1000.L6
qp1000.L6: point queries with 1000 insert/s per client. Graphs for performance per 1-second interval are here.
Average throughput:
Query response time histogram: each cell has the percentage of responses that take <= the time in the header and max is the max response time in seconds. For max values in the top 25% of the range have a red background and in the bottom 25% of the range have a green background. The red background is not used when the min value is within 80% of the max value.
| dbms | 256us | 1ms | 4ms | 16ms | 64ms | 256ms | 1s | 4s | 16s | gt | max |
|---|---|---|---|---|---|---|---|---|---|---|---|
| fbmy5635_rel_240606_4f3a57a1.cza1_c8r32 | 99.655 | 0.345 | nonzero | 0.002 | |||||||
| fbmy8028_rel_240606_c6c83b18.cza1_c8r32 | 99.417 | 0.582 | nonzero | 0.002 | |||||||
| fbmy8032_rel_240606_59f03d5a.cza1_c8r32 | 99.427 | 0.573 | nonzero | 0.003 |
Insert response time histogram: each cell has the percentage of responses that take <= the time in the header and max is the max response time in seconds. For max values in the top 25% of the range have a red background and in the bottom 25% of the range have a green background. The red background is not used when the min value is within 80% of the max value.
| dbms | 256us | 1ms | 4ms | 16ms | 64ms | 256ms | 1s | 4s | 16s | gt | max |
|---|---|---|---|---|---|---|---|---|---|---|---|
| fbmy5635_rel_240606_4f3a57a1.cza1_c8r32 | 87.639 | 12.194 | 0.164 | 0.003 | 0.048 | ||||||
| fbmy8028_rel_240606_c6c83b18.cza1_c8r32 | 20.431 | 79.386 | 0.097 | 0.083 | 0.003 | 0.066 | |||||
| fbmy8032_rel_240606_59f03d5a.cza1_c8r32 | 11.244 | 88.492 | 0.178 | 0.086 | 0.049 |
Delete response time histogram: each cell has the percentage of responses that take <= the time in the header and max is the max response time in seconds. For max values in the top 25% of the range have a red background and in the bottom 25% of the range have a green background. The red background is not used when the min value is within 80% of the max value.
| dbms | 256us | 1ms | 4ms | 16ms | 64ms | 256ms | 1s | 4s | 16s | gt | max |
|---|---|---|---|---|---|---|---|---|---|---|---|
| fbmy5635_rel_240606_4f3a57a1.cza1_c8r32 | 88.042 | 11.794 | 0.161 | 0.003 | 0.048 | ||||||
| fbmy8028_rel_240606_c6c83b18.cza1_c8r32 | 26.283 | 73.531 | 0.097 | 0.089 | 0.051 | ||||||
| fbmy8032_rel_240606_59f03d5a.cza1_c8r32 | 16.042 | 83.700 | 0.169 | 0.089 | 0.041 |
Performance metrics for the DBMS listed above. Some are normalized by throughput, others are not. Legend for results is here.
ips	qps	rps	rmbps	wps	wmbps	rpq	rkbpq	wpi	wkbpi	csps	cpups	cspq	cpupq	dbgb1	dbgb2	rss	maxop	p50	p99	tag
999	5637	0	0.0	1.4	0.0	0.000	0.000	0.001	0.010	23214	13.7	4.118	194	2.1	3.4	20.3	0.002	5658	5322	fbmy5635_rel_240606_4f3a57a1.cza1_c8r32
999	5085	0	0.0	1.5	0.0	0.000	0.000	0.002	0.011	21099	13.9	4.149	219	2.1	3.6	20.9	0.002	5100	4811	fbmy8028_rel_240606_c6c83b18.cza1_c8r32
999	4960	0	0.0	1.5	0.0	0.000	0.000	0.002	0.010	20746	14.1	4.182	227	2.2	3.6	21.0	0.003	4973	4715	fbmy8032_rel_240606_59f03d5a.cza1_c8r32
l.i0
l.i0: load without secondary indexes
Performance metrics for all DBMS, not just the ones listed above. Some are normalized by throughput, others are not. Legend for results is here.
ips	qps	rps	rmbps	wps	wmbps	rpq	rkbpq	wpi	wkbpi	csps	cpups	cspq	cpupq	dbgb1	dbgb2	rss	maxop	p50	p99	tag
145631	0	1	0.0	1.0	0.0	0.000	0.000	0.000	0.000	15051	21.9	0.103	12	1.0	2.5	0.3	0.115	61038	0	fbmy5635_rel_240606_4f3a57a1.cza1_c8r32
102389	0	2	0.2	1.3	0.0	0.000	0.002	0.000	0.000	11144	19.0	0.109	15	0.9	2.7	0.6	0.147	102887	86308	fbmy8028_rel_240606_c6c83b18.cza1_c8r32
96463	0	0	0.0	2.0	0.0	0.000	0.000	0.000	0.000	10672	18.8	0.111	16	0.9	2.7	0.6	0.106	96442	83210	fbmy8032_rel_240606_59f03d5a.cza1_c8r32
l.x
l.x: create secondary indexes
Performance metrics for all DBMS, not just the ones listed above. Some are normalized by throughput, others are not. Legend for results is here.
ips	qps	rps	rmbps	wps	wmbps	rpq	rkbpq	wpi	wkbpi	csps	cpups	cspq	cpupq	dbgb1	dbgb2	rss	maxop	p50	p99	tag
156250	0	0	0.0	1.1	0.0	0.000	0.000	0.000	0.000	173	12.2	0.001	6	2.0	3.6	2.3	0.001	NA	NA	fbmy5635_rel_240606_4f3a57a1.cza1_c8r32
136364	0	0	0.0	1.0	0.0	0.000	0.000	0.000	0.000	316	11.6	0.002	7	2.0	3.8	2.7	0.002	NA	NA	fbmy8028_rel_240606_c6c83b18.cza1_c8r32
133929	0	0	0.0	1.6	0.0	0.000	0.000	0.000	0.000	515	11.6	0.004	7	2.0	3.8	2.6	0.009	NA	NA	fbmy8032_rel_240606_59f03d5a.cza1_c8r32
l.i1
l.i1: continue load after secondary indexes created with 50 inserts per transaction
Performance metrics for all DBMS, not just the ones listed above. Some are normalized by throughput, others are not. Legend for results is here.
ips	qps	rps	rmbps	wps	wmbps	rpq	rkbpq	wpi	wkbpi	csps	cpups	cspq	cpupq	dbgb1	dbgb2	rss	maxop	p50	p99	tag
45045	0	1	0.0	1.2	0.0	0.000	0.000	0.000	0.000	20136	42.8	0.447	76	2.3	3.0	7.1	0.125	45749	29130	fbmy5635_rel_240606_4f3a57a1.cza1_c8r32
39331	0	0	0.0	1.8	0.0	0.000	0.000	0.000	0.000	18123	41.6	0.461	85	2.5	3.3	7.0	0.147	40605	22225	fbmy8028_rel_240606_c6c83b18.cza1_c8r32
41408	0	0	0.0	1.9	0.0	0.000	0.000	0.000	0.000	19367	44.2	0.468	85	2.3	3.1	7.6	0.119	41505	35312	fbmy8032_rel_240606_59f03d5a.cza1_c8r32
l.i2
l.i2: continue load after secondary indexes created with 5 inserts per transaction
Performance metrics for all DBMS, not just the ones listed above. Some are normalized by throughput, others are not. Legend for results is here.
ips	qps	rps	rmbps	wps	wmbps	rpq	rkbpq	wpi	wkbpi	csps	cpups	cspq	cpupq	dbgb1	dbgb2	rss	maxop	p50	p99	tag
17575	0	0	0.0	1.8	0.0	0.000	0.000	0.000	0.001	76727	40.7	4.366	185	2.1	2.3	9.7	0.079	18076	7547	fbmy5635_rel_240606_4f3a57a1.cza1_c8r32
15873	0	0	0.0	1.6	0.0	0.000	0.000	0.000	0.001	66510	40.9	4.190	206	2.3	2.7	10.0	0.109	16198	5876	fbmy8028_rel_240606_c6c83b18.cza1_c8r32
15504	0	0	0.0	1.9	0.0	0.000	0.000	0.000	0.001	64822	40.6	4.181	210	2.1	2.5	10.4	0.078	15598	13795	fbmy8032_rel_240606_59f03d5a.cza1_c8r32
qr100.L1
qr100.L1: range queries with 100 insert/s per client
Performance metrics for all DBMS, not just the ones listed above. Some are normalized by throughput, others are not. Legend for results is here.
ips	qps	rps	rmbps	wps	wmbps	rpq	rkbpq	wpi	wkbpi	csps	cpups	cspq	cpupq	dbgb1	dbgb2	rss	maxop	p50	p99	tag
100	3204	0	0.0	1.0	0.0	0.000	0.000	0.010	0.073	12375	12.2	3.862	305	2.1	2.2	10.4	0.036	3596	2317	fbmy5635_rel_240606_4f3a57a1.cza1_c8r32
100	4477	0	0.0	1.1	0.0	0.000	0.000	0.011	0.081	17358	12.3	3.877	220	2.1	2.3	10.5	0.002	4475	4203	fbmy8028_rel_240606_c6c83b18.cza1_c8r32
100	2586	0	0.0	1.6	0.0	0.000	0.000	0.016	0.104	10336	12.4	3.997	384	2.1	2.4	11.0	0.034	2589	2397	fbmy8032_rel_240606_59f03d5a.cza1_c8r32
qp100.L2
qp100.L2: point queries with 100 insert/s per client
Performance metrics for all DBMS, not just the ones listed above. Some are normalized by throughput, others are not. Legend for results is here.
ips	qps	rps	rmbps	wps	wmbps	rpq	rkbpq	wpi	wkbpi	csps	cpups	cspq	cpupq	dbgb1	dbgb2	rss	maxop	p50	p99	tag
100	5682	0	0.0	1.1	0.0	0.000	0.000	0.011	0.082	22869	12.6	4.025	177	2.1	2.2	12.1	0.002	5705	5354	fbmy5635_rel_240606_4f3a57a1.cza1_c8r32
100	5059	0	0.0	1.2	0.0	0.000	0.000	0.012	0.102	20457	12.6	4.044	199	2.2	2.4	12.2	0.004	5067	4795	fbmy8028_rel_240606_c6c83b18.cza1_c8r32
100	4961	0	0.0	1.7	0.0	0.000	0.000	0.017	0.115	20233	12.8	4.078	206	2.1	2.4	12.7	0.002	4971	4715	fbmy8032_rel_240606_59f03d5a.cza1_c8r32
qr500.L3
qr500.L3: range queries with 500 insert/s per client
Performance metrics for all DBMS, not just the ones listed above. Some are normalized by throughput, others are not. Legend for results is here.
ips	qps	rps	rmbps	wps	wmbps	rpq	rkbpq	wpi	wkbpi	csps	cpups	cspq	cpupq	dbgb1	dbgb2	rss	maxop	p50	p99	tag
499	2902	0	0.0	1.0	0.0	0.000	0.000	0.002	0.015	11425	12.7	3.936	350	2.1	2.4	13.9	0.033	2893	2397	fbmy5635_rel_240606_4f3a57a1.cza1_c8r32
499	3258	0	0.0	1.8	0.0	0.000	0.000	0.004	0.024	12912	12.9	3.964	317	2.1	2.6	13.8	0.028	3230	2717	fbmy8028_rel_240606_c6c83b18.cza1_c8r32
499	2913	0	0.0	1.0	0.0	0.000	0.000	0.002	0.016	11807	13.0	4.053	357	2.1	2.6	14.4	0.032	2893	2541	fbmy8032_rel_240606_59f03d5a.cza1_c8r32
qp500.L4
qp500.L4: point queries with 500 insert/s per client
Performance metrics for all DBMS, not just the ones listed above. Some are normalized by throughput, others are not. Legend for results is here.
ips	qps	rps	rmbps	wps	wmbps	rpq	rkbpq	wpi	wkbpi	csps	cpups	cspq	cpupq	dbgb1	dbgb2	rss	maxop	p50	p99	tag
499	5691	1	0.0	1.6	0.0	0.000	0.002	0.003	0.021	23106	13.0	4.060	183	2.1	2.6	15.3	0.002	5706	5434	fbmy5635_rel_240606_4f3a57a1.cza1_c8r32
499	5074	0	0.0	1.9	0.0	0.000	0.000	0.004	0.029	20743	13.2	4.088	208	2.1	2.8	15.1	0.003	5084	4827	fbmy8028_rel_240606_c6c83b18.cza1_c8r32
499	4925	0	0.0	1.0	0.0	0.000	0.000	0.002	0.016	20291	13.2	4.120	214	2.1	2.8	15.9	0.001	4938	4683	fbmy8032_rel_240606_59f03d5a.cza1_c8r32
qr1000.L5
qr1000.L5: range queries with 1000 insert/s per client
Performance metrics for all DBMS, not just the ones listed above. Some are normalized by throughput, others are not. Legend for results is here.
ips	qps	rps	rmbps	wps	wmbps	rpq	rkbpq	wpi	wkbpi	csps	cpups	cspq	cpupq	dbgb1	dbgb2	rss	maxop	p50	p99	tag
999	3740	0	0.0	1.8	0.0	0.000	0.000	0.002	0.012	14913	13.4	3.987	287	2.1	3.0	17.9	0.044	3486	2621	fbmy5635_rel_240606_4f3a57a1.cza1_c8r32
999	3401	0	0.0	1.0	0.0	0.000	0.000	0.001	0.008	13765	13.7	4.047	322	2.1	3.2	18.3	0.031	3212	2477	fbmy8028_rel_240606_c6c83b18.cza1_c8r32
999	3111	0	0.0	1.6	0.0	0.000	0.000	0.002	0.012	12862	13.6	4.135	350	2.1	3.2	19.0	0.043	3053	2414	fbmy8032_rel_240606_59f03d5a.cza1_c8r32
qp1000.L6
qp1000.L6: point queries with 1000 insert/s per client
Performance metrics for all DBMS, not just the ones listed above. Some are normalized by throughput, others are not. Legend for results is here.
ips	qps	rps	rmbps	wps	wmbps	rpq	rkbpq	wpi	wkbpi	csps	cpups	cspq	cpupq	dbgb1	dbgb2	rss	maxop	p50	p99	tag
999	5637	0	0.0	1.4	0.0	0.000	0.000	0.001	0.010	23214	13.7	4.118	194	2.1	3.4	20.3	0.002	5658	5322	fbmy5635_rel_240606_4f3a57a1.cza1_c8r32
999	5085	0	0.0	1.5	0.0	0.000	0.000	0.002	0.011	21099	13.9	4.149	219	2.1	3.6	20.9	0.002	5100	4811	fbmy8028_rel_240606_c6c83b18.cza1_c8r32
999	4960	0	0.0	1.5	0.0	0.000	0.000	0.002	0.010	20746	14.1	4.182	227	2.2	3.6	21.0	0.003	4973	4715	fbmy8032_rel_240606_59f03d5a.cza1_c8r32
l.i0
- l.i0: load without secondary indexes
- Legend for results is here.
- Each entry lists the percentage of responses that fit in that bucket (slower than max time for previous bucket, faster than min time for next bucket).
Insert response time histogram
256us	1ms	4ms	16ms	64ms	256ms	1s	4s	16s	gt	max	tag
0.000	99.808	0.120	0.069	0.000	0.003	0.000	0.000	0.000	0.000	0.115	fbmy5635_rel_240606_4f3a57a1.cza1_c8r32
0.000	95.754	4.045	0.145	0.052	0.004	0.000	0.000	0.000	0.000	0.147	fbmy8028_rel_240606_c6c83b18.cza1_c8r32
0.000	78.877	20.915	0.148	0.056	0.004	0.000	0.000	0.000	0.000	0.106	fbmy8032_rel_240606_59f03d5a.cza1_c8r32
l.x
- l.x: create secondary indexes
- Legend for results is here.
- Each entry lists the percentage of responses that fit in that bucket (slower than max time for previous bucket, faster than min time for next bucket).
TODO - determine whether there is data for create index response time
l.i1
- l.i1: continue load after secondary indexes created with 50 inserts per transaction
- Legend for results is here.
- Each entry lists the percentage of responses that fit in that bucket (slower than max time for previous bucket, faster than min time for next bucket).
Insert response time histogram
256us	1ms	4ms	16ms	64ms	256ms	1s	4s	16s	gt	max	tag
0.000	86.919	12.983	0.093	0.001	0.004	0.000	0.000	0.000	0.000	0.125	fbmy5635_rel_240606_4f3a57a1.cza1_c8r32
0.000	27.809	71.973	0.165	0.051	0.003	0.000	0.000	0.000	0.000	0.147	fbmy8028_rel_240606_c6c83b18.cza1_c8r32
0.000	15.724	84.054	0.171	0.047	0.004	0.000	0.000	0.000	0.000	0.119	fbmy8032_rel_240606_59f03d5a.cza1_c8r32
Delete response time histogram
256us	1ms	4ms	16ms	64ms	256ms	1s	4s	16s	gt	max	tag
0.000	85.878	14.015	0.097	0.007	0.003	0.000	0.000	0.000	0.000	0.125	fbmy5635_rel_240606_4f3a57a1.cza1_c8r32
0.000	32.708	67.065	0.163	0.061	0.003	0.000	0.000	0.000	0.000	0.133	fbmy8028_rel_240606_c6c83b18.cza1_c8r32
0.000	21.754	78.017	0.168	0.057	0.004	0.000	0.000	0.000	0.000	0.126	fbmy8032_rel_240606_59f03d5a.cza1_c8r32
l.i2
- l.i2: continue load after secondary indexes created with 5 inserts per transaction
- Legend for results is here.
- Each entry lists the percentage of responses that fit in that bucket (slower than max time for previous bucket, faster than min time for next bucket).
Insert response time histogram
256us	1ms	4ms	16ms	64ms	256ms	1s	4s	16s	gt	max	tag
98.746	1.222	0.006	0.025	nonzero	0.001	0.000	0.000	0.000	0.000	0.079	fbmy5635_rel_240606_4f3a57a1.cza1_c8r32
69.098	30.847	0.007	0.040	0.007	0.001	0.000	0.000	0.000	0.000	0.109	fbmy8028_rel_240606_c6c83b18.cza1_c8r32
47.310	52.633	0.006	0.043	0.007	nonzero	0.000	0.000	0.000	0.000	0.078	fbmy8032_rel_240606_59f03d5a.cza1_c8r32
Delete response time histogram
256us	1ms	4ms	16ms	64ms	256ms	1s	4s	16s	gt	max	tag
95.187	4.781	0.006	0.026	nonzero	0.001	0.000	0.000	0.000	0.000	0.079	fbmy5635_rel_240606_4f3a57a1.cza1_c8r32
25.125	74.817	0.008	0.042	0.008	nonzero	0.000	0.000	0.000	0.000	0.089	fbmy8028_rel_240606_c6c83b18.cza1_c8r32
0.831	99.109	0.008	0.045	0.007	nonzero	0.000	0.000	0.000	0.000	0.079	fbmy8032_rel_240606_59f03d5a.cza1_c8r32
qr100.L1
- qr100.L1: range queries with 100 insert/s per client
- Legend for results is here.
- Each entry lists the percentage of responses that fit in that bucket (slower than max time for previous bucket, faster than min time for next bucket).
Query response time histogram
256us	1ms	4ms	16ms	64ms	256ms	1s	4s	16s	gt	max	tag
80.751	14.310	4.939	nonzero	nonzero	0.000	0.000	0.000	0.000	0.000	0.036	fbmy5635_rel_240606_4f3a57a1.cza1_c8r32
80.279	19.721	0.001	0.000	0.000	0.000	0.000	0.000	0.000	0.000	0.002	fbmy8028_rel_240606_c6c83b18.cza1_c8r32
66.570	23.063	10.366	0.000	nonzero	0.000	0.000	0.000	0.000	0.000	0.034	fbmy8032_rel_240606_59f03d5a.cza1_c8r32
Insert response time histogram
256us	1ms	4ms	16ms	64ms	256ms	1s	4s	16s	gt	max	tag
0.000	38.722	60.917	0.361	0.000	0.000	0.000	0.000	0.000	0.000	0.013	fbmy5635_rel_240606_4f3a57a1.cza1_c8r32
0.000	7.944	91.500	0.500	0.056	0.000	0.000	0.000	0.000	0.000	0.017	fbmy8028_rel_240606_c6c83b18.cza1_c8r32
0.000	2.972	96.667	0.333	0.028	0.000	0.000	0.000	0.000	0.000	0.023	fbmy8032_rel_240606_59f03d5a.cza1_c8r32
Delete response time histogram
256us	1ms	4ms	16ms	64ms	256ms	1s	4s	16s	gt	max	tag
0.000	47.583	52.056	0.361	0.000	0.000	0.000	0.000	0.000	0.000	0.013	fbmy5635_rel_240606_4f3a57a1.cza1_c8r32
0.000	30.917	68.556	0.472	0.056	0.000	0.000	0.000	0.000	0.000	0.016	fbmy8028_rel_240606_c6c83b18.cza1_c8r32
0.000	18.000	81.667	0.306	0.028	0.000	0.000	0.000	0.000	0.000	0.022	fbmy8032_rel_240606_59f03d5a.cza1_c8r32
qp100.L2
- qp100.L2: point queries with 100 insert/s per client
- Legend for results is here.
- Each entry lists the percentage of responses that fit in that bucket (slower than max time for previous bucket, faster than min time for next bucket).
Query response time histogram
256us	1ms	4ms	16ms	64ms	256ms	1s	4s	16s	gt	max	tag
99.706	0.294	nonzero	0.000	0.000	0.000	0.000	0.000	0.000	0.000	0.002	fbmy5635_rel_240606_4f3a57a1.cza1_c8r32
99.623	0.377	nonzero	0.000	0.000	0.000	0.000	0.000	0.000	0.000	0.004	fbmy8028_rel_240606_c6c83b18.cza1_c8r32
99.573	0.426	nonzero	0.000	0.000	0.000	0.000	0.000	0.000	0.000	0.002	fbmy8032_rel_240606_59f03d5a.cza1_c8r32
Insert response time histogram
256us	1ms	4ms	16ms	64ms	256ms	1s	4s	16s	gt	max	tag
0.000	27.972	71.417	0.611	0.000	0.000	0.000	0.000	0.000	0.000	0.014	fbmy5635_rel_240606_4f3a57a1.cza1_c8r32
0.000	1.306	98.361	0.278	0.056	0.000	0.000	0.000	0.000	0.000	0.022	fbmy8028_rel_240606_c6c83b18.cza1_c8r32
0.000	1.056	98.667	0.222	0.056	0.000	0.000	0.000	0.000	0.000	0.022	fbmy8032_rel_240606_59f03d5a.cza1_c8r32
Delete response time histogram
256us	1ms	4ms	16ms	64ms	256ms	1s	4s	16s	gt	max	tag
0.000	43.278	56.139	0.583	0.000	0.000	0.000	0.000	0.000	0.000	0.013	fbmy5635_rel_240606_4f3a57a1.cza1_c8r32
0.000	12.861	86.833	0.278	0.028	0.000	0.000	0.000	0.000	0.000	0.022	fbmy8028_rel_240606_c6c83b18.cza1_c8r32
0.000	10.194	89.583	0.194	0.028	0.000	0.000	0.000	0.000	0.000	0.022	fbmy8032_rel_240606_59f03d5a.cza1_c8r32
qr500.L3
- qr500.L3: range queries with 500 insert/s per client
- Legend for results is here.
- Each entry lists the percentage of responses that fit in that bucket (slower than max time for previous bucket, faster than min time for next bucket).
Query response time histogram
256us	1ms	4ms	16ms	64ms	256ms	1s	4s	16s	gt	max	tag
67.208	24.004	8.787	nonzero	nonzero	0.000	0.000	0.000	0.000	0.000	0.033	fbmy5635_rel_240606_4f3a57a1.cza1_c8r32
66.520	31.012	2.468	0.000	nonzero	0.000	0.000	0.000	0.000	0.000	0.028	fbmy8028_rel_240606_c6c83b18.cza1_c8r32
68.518	24.512	6.970	nonzero	nonzero	0.000	0.000	0.000	0.000	0.000	0.032	fbmy8032_rel_240606_59f03d5a.cza1_c8r32
Insert response time histogram
256us	1ms	4ms	16ms	64ms	256ms	1s	4s	16s	gt	max	tag
0.000	83.806	16.000	0.189	0.006	0.000	0.000	0.000	0.000	0.000	0.017	fbmy5635_rel_240606_4f3a57a1.cza1_c8r32
0.000	18.083	81.739	0.094	0.083	0.000	0.000	0.000	0.000	0.000	0.022	fbmy8028_rel_240606_c6c83b18.cza1_c8r32
0.000	9.739	90.072	0.100	0.089	0.000	0.000	0.000	0.000	0.000	0.024	fbmy8032_rel_240606_59f03d5a.cza1_c8r32
Delete response time histogram
256us	1ms	4ms	16ms	64ms	256ms	1s	4s	16s	gt	max	tag
0.000	84.361	15.450	0.183	0.006	0.000	0.000	0.000	0.000	0.000	0.017	fbmy5635_rel_240606_4f3a57a1.cza1_c8r32
0.000	31.383	68.433	0.100	0.083	0.000	0.000	0.000	0.000	0.000	0.023	fbmy8028_rel_240606_c6c83b18.cza1_c8r32
0.000	19.650	80.178	0.089	0.083	0.000	0.000	0.000	0.000	0.000	0.024	fbmy8032_rel_240606_59f03d5a.cza1_c8r32
qp500.L4
- qp500.L4: point queries with 500 insert/s per client
- Legend for results is here.
- Each entry lists the percentage of responses that fit in that bucket (slower than max time for previous bucket, faster than min time for next bucket).
Query response time histogram
256us	1ms	4ms	16ms	64ms	256ms	1s	4s	16s	gt	max	tag
99.720	0.280	nonzero	0.000	0.000	0.000	0.000	0.000	0.000	0.000	0.002	fbmy5635_rel_240606_4f3a57a1.cza1_c8r32
99.535	0.465	nonzero	0.000	0.000	0.000	0.000	0.000	0.000	0.000	0.003	fbmy8028_rel_240606_c6c83b18.cza1_c8r32
99.566	0.434	nonzero	0.000	0.000	0.000	0.000	0.000	0.000	0.000	0.001	fbmy8032_rel_240606_59f03d5a.cza1_c8r32
Insert response time histogram
256us	1ms	4ms	16ms	64ms	256ms	1s	4s	16s	gt	max	tag
0.000	78.300	21.500	0.200	0.000	0.000	0.000	0.000	0.000	0.000	0.014	fbmy5635_rel_240606_4f3a57a1.cza1_c8r32
0.000	10.794	88.994	0.133	0.078	0.000	0.000	0.000	0.000	0.000	0.022	fbmy8028_rel_240606_c6c83b18.cza1_c8r32
0.000	7.417	92.372	0.128	0.083	0.000	0.000	0.000	0.000	0.000	0.022	fbmy8032_rel_240606_59f03d5a.cza1_c8r32
Delete response time histogram
256us	1ms	4ms	16ms	64ms	256ms	1s	4s	16s	gt	max	tag
0.000	78.506	21.306	0.189	0.000	0.000	0.000	0.000	0.000	0.000	0.014	fbmy5635_rel_240606_4f3a57a1.cza1_c8r32
0.000	21.761	78.028	0.133	0.078	0.000	0.000	0.000	0.000	0.000	0.022	fbmy8028_rel_240606_c6c83b18.cza1_c8r32
0.000	14.511	85.278	0.133	0.078	0.000	0.000	0.000	0.000	0.000	0.023	fbmy8032_rel_240606_59f03d5a.cza1_c8r32
qr1000.L5
- qr1000.L5: range queries with 1000 insert/s per client
- Legend for results is here.
- Each entry lists the percentage of responses that fit in that bucket (slower than max time for previous bucket, faster than min time for next bucket).
Query response time histogram
256us	1ms	4ms	16ms	64ms	256ms	1s	4s	16s	gt	max	tag
71.006	28.132	0.862	nonzero	nonzero	0.000	0.000	0.000	0.000	0.000	0.044	fbmy5635_rel_240606_4f3a57a1.cza1_c8r32
67.546	32.441	0.013	0.000	nonzero	0.000	0.000	0.000	0.000	0.000	0.031	fbmy8028_rel_240606_c6c83b18.cza1_c8r32
69.841	25.652	4.507	nonzero	nonzero	0.000	0.000	0.000	0.000	0.000	0.043	fbmy8032_rel_240606_59f03d5a.cza1_c8r32
Insert response time histogram
256us	1ms	4ms	16ms	64ms	256ms	1s	4s	16s	gt	max	tag
0.000	90.361	9.494	0.142	0.003	0.000	0.000	0.000	0.000	0.000	0.062	fbmy5635_rel_240606_4f3a57a1.cza1_c8r32
0.000	24.744	75.053	0.111	0.089	0.003	0.000	0.000	0.000	0.000	0.067	fbmy8028_rel_240606_c6c83b18.cza1_c8r32
0.000	13.656	86.089	0.175	0.081	0.000	0.000	0.000	0.000	0.000	0.051	fbmy8032_rel_240606_59f03d5a.cza1_c8r32
Delete response time histogram
256us	1ms	4ms	16ms	64ms	256ms	1s	4s	16s	gt	max	tag
0.000	89.992	9.861	0.144	0.003	0.000	0.000	0.000	0.000	0.000	0.062	fbmy5635_rel_240606_4f3a57a1.cza1_c8r32
0.000	32.022	67.778	0.111	0.089	0.000	0.000	0.000	0.000	0.000	0.048	fbmy8028_rel_240606_c6c83b18.cza1_c8r32
0.000	19.294	80.458	0.169	0.075	0.003	0.000	0.000	0.000	0.000	0.073	fbmy8032_rel_240606_59f03d5a.cza1_c8r32
qp1000.L6
- qp1000.L6: point queries with 1000 insert/s per client
- Legend for results is here.
- Each entry lists the percentage of responses that fit in that bucket (slower than max time for previous bucket, faster than min time for next bucket).
Query response time histogram
256us	1ms	4ms	16ms	64ms	256ms	1s	4s	16s	gt	max	tag
99.655	0.345	nonzero	0.000	0.000	0.000	0.000	0.000	0.000	0.000	0.002	fbmy5635_rel_240606_4f3a57a1.cza1_c8r32
99.417	0.582	nonzero	0.000	0.000	0.000	0.000	0.000	0.000	0.000	0.002	fbmy8028_rel_240606_c6c83b18.cza1_c8r32
99.427	0.573	nonzero	0.000	0.000	0.000	0.000	0.000	0.000	0.000	0.003	fbmy8032_rel_240606_59f03d5a.cza1_c8r32
Insert response time histogram
256us	1ms	4ms	16ms	64ms	256ms	1s	4s	16s	gt	max	tag
0.000	87.639	12.194	0.164	0.003	0.000	0.000	0.000	0.000	0.000	0.048	fbmy5635_rel_240606_4f3a57a1.cza1_c8r32
0.000	20.431	79.386	0.097	0.083	0.003	0.000	0.000	0.000	0.000	0.066	fbmy8028_rel_240606_c6c83b18.cza1_c8r32
0.000	11.244	88.492	0.178	0.086	0.000	0.000	0.000	0.000	0.000	0.049	fbmy8032_rel_240606_59f03d5a.cza1_c8r32
Delete response time histogram
256us	1ms	4ms	16ms	64ms	256ms	1s	4s	16s	gt	max	tag
0.000	88.042	11.794	0.161	0.003	0.000	0.000	0.000	0.000	0.000	0.048	fbmy5635_rel_240606_4f3a57a1.cza1_c8r32
0.000	26.283	73.531	0.097	0.089	0.000	0.000	0.000	0.000	0.000	0.051	fbmy8028_rel_240606_c6c83b18.cza1_c8r32
0.000	16.042	83.700	0.169	0.089	0.000	0.000	0.000	0.000	0.000	0.041	fbmy8032_rel_240606_59f03d5a.cza1_c8r32