Introduction
This is a report for the insert benchmark with 20M docs and 1 client(s). It is generated by scripts (bash, awk, sed) and Tufte might not be impressed. An overview of the insert benchmark is here and a short update is here. Below, by DBMS, I mean DBMS+version.config. An example is my8020.c10b40 where my means MySQL, 8020 is version 8.0.20 and c10b40 is the name for the configuration file.
The test server has 8 AMD cores, 16G RAM and an NVMe SSD. It is described here as the Beelink. The benchmark was run with 1 client and there were 1 or 3 connections per client (1 for queries or inserts without rate limits, 1+1 for rate limited inserts+deletes). It uses 1 table. It loads 20M rows per table without secondary indexes, creates 3 secondary indexes per table, then inserts 40m+10m rows per table with a delete per insert to avoid growing the table. It then does 6 read+write tests for 1800s each that do queries as fast as possible with 100,100,500,500,1000,1000 inserts/s and the same for deletes/s per client concurrent with the queries. The database is cached in memory. Clients and the DBMS share one server. The per-database configs are in the per-database subdirectories here.
The tested DBMS are:
- my8032_rel.cz11a_bee - MySQL 8.0.32 with the cz11a_bee config
- my8037_rel.cz11a_bee - MySQL 8.0.37 with the cz11a_bee config
- fbmy5635_rel_240606_4f3a57a1.cza1_bee - MyRocks 5.6.35 with the cza1_bee config compiled at git sha 4f3a57a1 on 240606 using RocksDB 8.7.0
- fbmy8028_rel_240606_c6c83b18.cza1_bee - MyRocks 8.0.28 with the cza1_bee config compiled at git sha c6c83b18 on 240606 using RocksDB 8.7.0
- fbmy8032_rel_240606_59f03d5a.cza1_bee - MyRocks 8.0.36 with the cza1_bee config compiled at git sha 59f03d5a on 240606 using RocksDB 9.3.1
Contents
- Summary
- l.i0: load without secondary indexes
- l.x: create secondary indexes
- l.i1: continue load after secondary indexes created with 50 inserts per transaction
- l.i2: continue load after secondary indexes created with 5 inserts per transaction
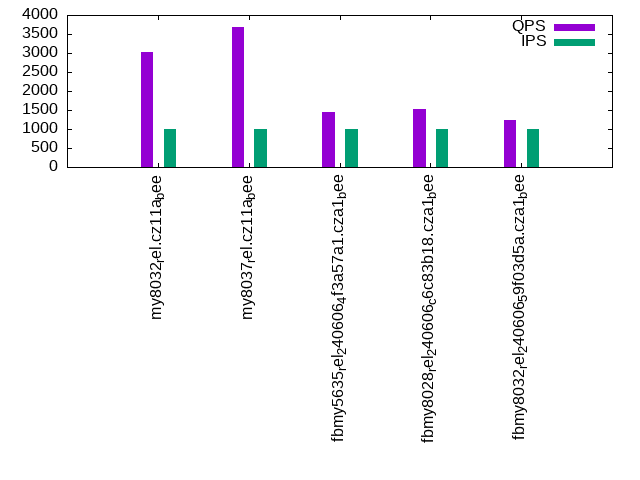
- qr100.L1: range queries with 100 insert/s per client
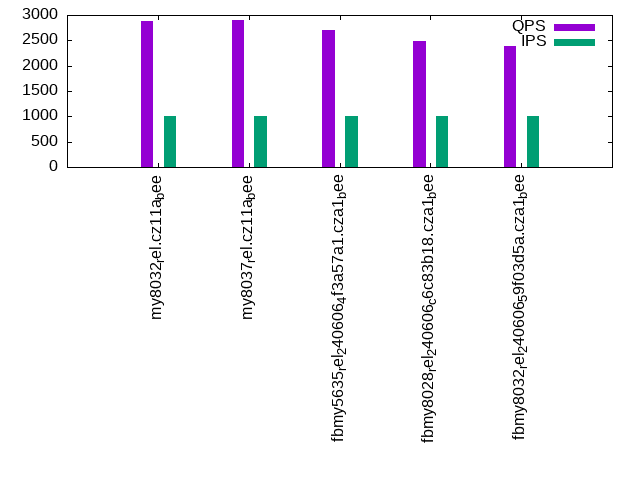
- qp100.L2: point queries with 100 insert/s per client
- qr500.L3: range queries with 500 insert/s per client
- qp500.L4: point queries with 500 insert/s per client
- qr1000.L5: range queries with 1000 insert/s per client
- qp1000.L6: point queries with 1000 insert/s per client
Summary
The numbers are inserts/s for l.i0, l.i1 and l.i2, indexed docs (or rows) /s for l.x and queries/s for qr100, qp100 thru qr1000, qp1000" The values are the average rate over the entire test for inserts (IPS) and queries (QPS). The range of values for IPS and QPS is split into 3 parts: bottom 25%, middle 50%, top 25%. Values in the bottom 25% have a red background, values in the top 25% have a green background and values in the middle have no color. A gray background is used for values that can be ignored because the DBMS did not sustain the target insert rate. Red backgrounds are not used when the minimum value is within 80% of the max value.
| dbms | l.i0 | l.x | l.i1 | l.i2 | qr100 | qp100 | qr500 | qp500 | qr1000 | qp1000 |
|---|---|---|---|---|---|---|---|---|---|---|
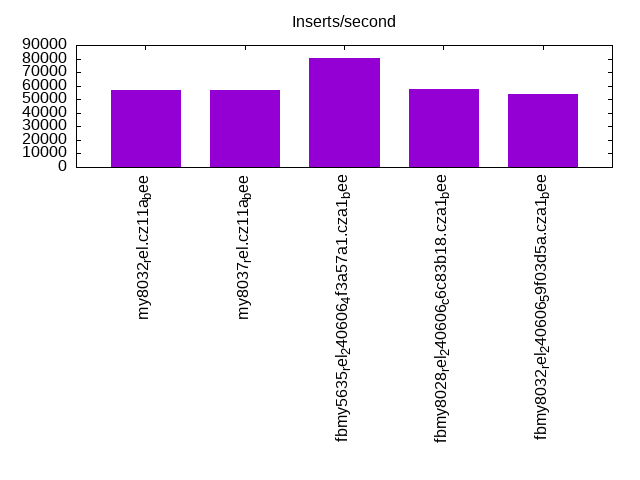
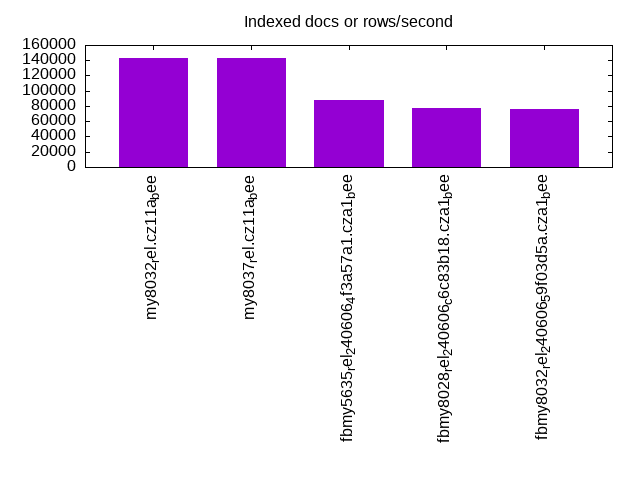
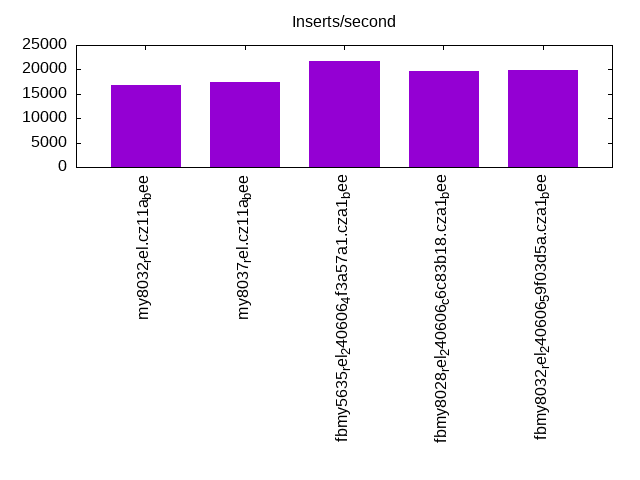
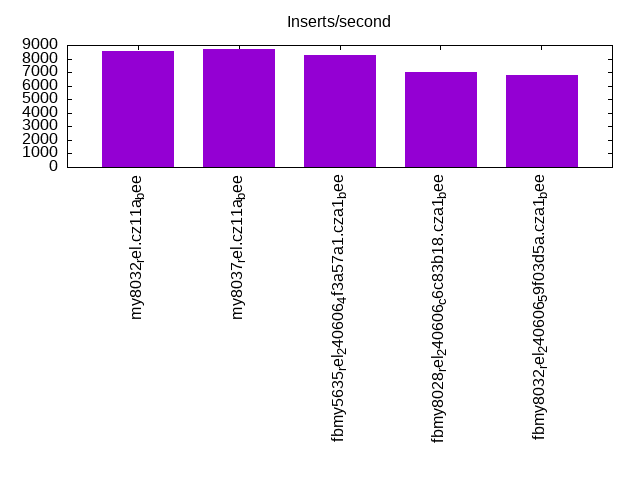
| my8032_rel.cz11a_bee | 56818 | 142858 | 16885 | 8584 | 3052 | 2829 | 3039 | 2808 | 3033 | 2880 |
| my8037_rel.cz11a_bee | 57143 | 142858 | 17391 | 8696 | 3648 | 2797 | 3643 | 2829 | 3696 | 2897 |
| fbmy5635_rel_240606_4f3a57a1.cza1_bee | 80321 | 87720 | 21727 | 8258 | 1916 | 2694 | 1453 | 2707 | 1446 | 2707 |
| fbmy8028_rel_240606_c6c83b18.cza1_bee | 57471 | 77520 | 19637 | 6988 | 1393 | 2618 | 1507 | 2571 | 1526 | 2496 |
| fbmy8032_rel_240606_59f03d5a.cza1_bee | 53908 | 76046 | 19871 | 6807 | 1225 | 2346 | 1338 | 2389 | 1235 | 2384 |
This table has relative throughput, throughput for the DBMS relative to the DBMS in the first line, using the absolute throughput from the previous table. Values less than 0.95 have a yellow background. Values greater than 1.05 have a blue background.
| dbms | l.i0 | l.x | l.i1 | l.i2 | qr100 | qp100 | qr500 | qp500 | qr1000 | qp1000 |
|---|---|---|---|---|---|---|---|---|---|---|
| my8032_rel.cz11a_bee | 1.00 | 1.00 | 1.00 | 1.00 | 1.00 | 1.00 | 1.00 | 1.00 | 1.00 | 1.00 |
| my8037_rel.cz11a_bee | 1.01 | 1.00 | 1.03 | 1.01 | 1.20 | 0.99 | 1.20 | 1.01 | 1.22 | 1.01 |
| fbmy5635_rel_240606_4f3a57a1.cza1_bee | 1.41 | 0.61 | 1.29 | 0.96 | 0.63 | 0.95 | 0.48 | 0.96 | 0.48 | 0.94 |
| fbmy8028_rel_240606_c6c83b18.cza1_bee | 1.01 | 0.54 | 1.16 | 0.81 | 0.46 | 0.93 | 0.50 | 0.92 | 0.50 | 0.87 |
| fbmy8032_rel_240606_59f03d5a.cza1_bee | 0.95 | 0.53 | 1.18 | 0.79 | 0.40 | 0.83 | 0.44 | 0.85 | 0.41 | 0.83 |
This lists the average rate of inserts/s for the tests that do inserts concurrent with queries. For such tests the query rate is listed in the table above. The read+write tests are setup so that the insert rate should match the target rate every second. Cells that are not at least 95% of the target have a red background to indicate a failure to satisfy the target.
| dbms | qr100.L1 | qp100.L2 | qr500.L3 | qp500.L4 | qr1000.L5 | qp1000.L6 |
|---|---|---|---|---|---|---|
| my8032_rel.cz11a_bee | 100 | 100 | 499 | 499 | 998 | 998 |
| my8037_rel.cz11a_bee | 100 | 100 | 499 | 499 | 998 | 998 |
| fbmy5635_rel_240606_4f3a57a1.cza1_bee | 100 | 100 | 499 | 499 | 998 | 998 |
| fbmy8028_rel_240606_c6c83b18.cza1_bee | 100 | 100 | 499 | 499 | 998 | 998 |
| fbmy8032_rel_240606_59f03d5a.cza1_bee | 100 | 100 | 499 | 499 | 998 | 998 |
| target | 100 | 100 | 500 | 500 | 1000 | 1000 |
l.i0
l.i0: load without secondary indexes. Graphs for performance per 1-second interval are here.
Average throughput:
Insert response time histogram: each cell has the percentage of responses that take <= the time in the header and max is the max response time in seconds. For the max column values in the top 25% of the range have a red background and in the bottom 25% of the range have a green background. The red background is not used when the min value is within 80% of the max value.
| dbms | 256us | 1ms | 4ms | 16ms | 64ms | 256ms | 1s | 4s | 16s | gt | max |
|---|---|---|---|---|---|---|---|---|---|---|---|
| my8032_rel.cz11a_bee | 99.418 | 0.441 | 0.141 | 0.001 | 0.084 | ||||||
| my8037_rel.cz11a_bee | 99.413 | 0.449 | 0.138 | 0.001 | 0.089 | ||||||
| fbmy5635_rel_240606_4f3a57a1.cza1_bee | 99.872 | 0.124 | 0.003 | 0.001 | 0.104 | ||||||
| fbmy8028_rel_240606_c6c83b18.cza1_bee | 99.724 | 0.199 | 0.074 | 0.003 | 0.089 | ||||||
| fbmy8032_rel_240606_59f03d5a.cza1_bee | 99.712 | 0.210 | 0.076 | 0.002 | 0.079 |
Performance metrics for the DBMS listed above. Some are normalized by throughput, others are not. Legend for results is here.
ips	qps	rps	rmbps	wps	wmbps	rpq	rkbpq	wpi	wkbpi	csps	cpups	cspq	cpupq	dbgb1	dbgb2	rss	maxop	p50	p99	tag
56818	0	0	0.0	205.1	18.0	0.000	0.000	0.004	0.325	6721	21.3	0.118	30	1.3	16.9	2.4	0.084	57235	53438	my8032_rel.cz11a_bee
57143	0	0	0.0	199.9	17.8	0.000	0.000	0.003	0.318	6453	21.0	0.113	29	1.3	16.9	2.4	0.089	57334	53939	my8037_rel.cz11a_bee
80321	0	0	0.0	35.6	13.4	0.000	0.000	0.000	0.171	7818	22.5	0.097	22	0.7	1.7	0.2	0.104	80854	71323	fbmy5635_rel_240606_4f3a57a1.cza1_bee
57471	0	0	0.0	34.1	10.9	0.000	0.000	0.001	0.194	5937	22.2	0.103	31	0.7	1.9	0.6	0.089	57568	51442	fbmy8028_rel_240606_c6c83b18.cza1_bee
53908	0	0	0.0	33.4	10.3	0.000	0.000	0.001	0.196	5837	21.8	0.108	32	0.7	1.9	0.6	0.079	53940	48571	fbmy8032_rel_240606_59f03d5a.cza1_bee
l.x
l.x: create secondary indexes.
Average throughput:
Performance metrics for the DBMS listed above. Some are normalized by throughput, others are not. Legend for results is here.
ips	qps	rps	rmbps	wps	wmbps	rpq	rkbpq	wpi	wkbpi	csps	cpups	cspq	cpupq	dbgb1	dbgb2	rss	maxop	p50	p99	tag
142858	0	750	47.3	2041.3	146.9	0.005	0.339	0.014	1.053	8948	44.1	0.063	25	3.0	18.6	3.1	0.003	NA	NA	my8032_rel.cz11a_bee
142858	0	725	45.7	3106.9	160.1	0.005	0.327	0.022	1.147	10776	43.2	0.075	24	3.0	18.6	3.1	0.003	NA	NA	my8037_rel.cz11a_bee
87720	0	0	0.0	38.9	14.7	0.000	0.000	0.000	0.172	223	11.8	0.003	11	1.4	2.4	1.7	0.002	NA	NA	fbmy5635_rel_240606_4f3a57a1.cza1_bee
77520	0	0	0.0	31.3	12.1	0.000	0.000	0.000	0.159	384	11.6	0.005	12	1.4	2.6	2.0	0.003	NA	NA	fbmy8028_rel_240606_c6c83b18.cza1_bee
76046	0	0	0.0	30.8	11.8	0.000	0.000	0.000	0.160	591	11.7	0.008	12	1.4	2.6	2.1	0.003	NA	NA	fbmy8032_rel_240606_59f03d5a.cza1_bee
l.i1
l.i1: continue load after secondary indexes created with 50 inserts per transaction. Graphs for performance per 1-second interval are here.
Average throughput:
Insert response time histogram: each cell has the percentage of responses that take <= the time in the header and max is the max response time in seconds. For the max column values in the top 25% of the range have a red background and in the bottom 25% of the range have a green background. The red background is not used when the min value is within 80% of the max value.
| dbms | 256us | 1ms | 4ms | 16ms | 64ms | 256ms | 1s | 4s | 16s | gt | max |
|---|---|---|---|---|---|---|---|---|---|---|---|
| my8032_rel.cz11a_bee | 96.550 | 3.315 | 0.132 | 0.003 | 0.105 | ||||||
| my8037_rel.cz11a_bee | 96.679 | 3.188 | 0.130 | 0.002 | 0.001 | 0.311 | |||||
| fbmy5635_rel_240606_4f3a57a1.cza1_bee | 99.800 | 0.194 | 0.004 | 0.002 | 0.086 | ||||||
| fbmy8028_rel_240606_c6c83b18.cza1_bee | 99.661 | 0.272 | 0.065 | 0.002 | 0.088 | ||||||
| fbmy8032_rel_240606_59f03d5a.cza1_bee | 99.650 | 0.279 | 0.071 | 0.001 | 0.078 |
Delete response time histogram: each cell has the percentage of responses that take <= the time in the header and max is the max response time in seconds. For the max column values in the top 25% of the range have a red background and in the bottom 25% of the range have a green background. The red background is not used when the min value is within 80% of the max value.
| dbms | 256us | 1ms | 4ms | 16ms | 64ms | 256ms | 1s | 4s | 16s | gt | max |
|---|---|---|---|---|---|---|---|---|---|---|---|
| my8032_rel.cz11a_bee | 97.840 | 2.107 | 0.050 | 0.003 | 0.108 | ||||||
| my8037_rel.cz11a_bee | 97.893 | 2.056 | 0.049 | 0.001 | 0.001 | 0.284 | |||||
| fbmy5635_rel_240606_4f3a57a1.cza1_bee | 99.787 | 0.200 | 0.011 | 0.002 | 0.085 | ||||||
| fbmy8028_rel_240606_c6c83b18.cza1_bee | 99.642 | 0.279 | 0.077 | 0.002 | 0.091 | ||||||
| fbmy8032_rel_240606_59f03d5a.cza1_bee | 99.631 | 0.285 | 0.084 | 0.001 | 0.076 |
Performance metrics for the DBMS listed above. Some are normalized by throughput, others are not. Legend for results is here.
ips	qps	rps	rmbps	wps	wmbps	rpq	rkbpq	wpi	wkbpi	csps	cpups	cspq	cpupq	dbgb1	dbgb2	rss	maxop	p50	p99	tag
16885	0	41	0.6	1999.9	79.1	0.002	0.039	0.118	4.800	36774	38.6	2.178	183	4.4	20.3	5.8	0.105	17473	7242	my8032_rel.cz11a_bee
17391	0	42	0.7	2069.8	81.9	0.002	0.039	0.119	4.824	36954	38.6	2.125	178	4.4	20.2	5.8	0.311	17998	6792	my8037_rel.cz11a_bee
21727	0	95	0.5	109.4	43.2	0.004	0.025	0.005	2.037	9641	44.3	0.444	163	1.6	3.5	7.2	0.086	23391	4495	fbmy5635_rel_240606_4f3a57a1.cza1_bee
19637	0	87	0.5	110.7	42.6	0.004	0.026	0.006	2.221	8890	45.1	0.453	184	1.8	3.9	7.8	0.088	21126	9339	fbmy8028_rel_240606_c6c83b18.cza1_bee
19871	0	92	0.5	121.2	45.9	0.005	0.027	0.006	2.364	9236	47.1	0.465	190	1.7	3.8	8.4	0.078	20527	15033	fbmy8032_rel_240606_59f03d5a.cza1_bee
l.i2
l.i2: continue load after secondary indexes created with 5 inserts per transaction. Graphs for performance per 1-second interval are here.
Average throughput:
Insert response time histogram: each cell has the percentage of responses that take <= the time in the header and max is the max response time in seconds. For the max column values in the top 25% of the range have a red background and in the bottom 25% of the range have a green background. The red background is not used when the min value is within 80% of the max value.
| dbms | 256us | 1ms | 4ms | 16ms | 64ms | 256ms | 1s | 4s | 16s | gt | max |
|---|---|---|---|---|---|---|---|---|---|---|---|
| my8032_rel.cz11a_bee | 99.377 | 0.367 | 0.254 | 0.001 | 0.001 | 0.106 | |||||
| my8037_rel.cz11a_bee | 99.378 | 0.364 | 0.255 | 0.002 | nonzero | nonzero | 0.291 | ||||
| fbmy5635_rel_240606_4f3a57a1.cza1_bee | 0.016 | 99.906 | 0.023 | 0.054 | 0.001 | nonzero | 0.064 | ||||
| fbmy8028_rel_240606_c6c83b18.cza1_bee | 99.823 | 0.089 | 0.082 | 0.005 | nonzero | 0.072 | |||||
| fbmy8032_rel_240606_59f03d5a.cza1_bee | 99.763 | 0.147 | 0.085 | 0.005 | 0.060 |
Delete response time histogram: each cell has the percentage of responses that take <= the time in the header and max is the max response time in seconds. For the max column values in the top 25% of the range have a red background and in the bottom 25% of the range have a green background. The red background is not used when the min value is within 80% of the max value.
| dbms | 256us | 1ms | 4ms | 16ms | 64ms | 256ms | 1s | 4s | 16s | gt | max |
|---|---|---|---|---|---|---|---|---|---|---|---|
| my8032_rel.cz11a_bee | 99.520 | 0.229 | 0.249 | 0.001 | 0.001 | 0.102 | |||||
| my8037_rel.cz11a_bee | 99.562 | 0.189 | 0.247 | 0.002 | nonzero | nonzero | 0.284 | ||||
| fbmy5635_rel_240606_4f3a57a1.cza1_bee | 99.897 | 0.043 | 0.059 | 0.001 | nonzero | 0.064 | |||||
| fbmy8028_rel_240606_c6c83b18.cza1_bee | 99.594 | 0.314 | 0.086 | 0.006 | nonzero | 0.084 | |||||
| fbmy8032_rel_240606_59f03d5a.cza1_bee | 99.418 | 0.488 | 0.089 | 0.006 | nonzero | 0.075 |
Performance metrics for the DBMS listed above. Some are normalized by throughput, others are not. Legend for results is here.
ips	qps	rps	rmbps	wps	wmbps	rpq	rkbpq	wpi	wkbpi	csps	cpups	cspq	cpupq	dbgb1	dbgb2	rss	maxop	p50	p99	tag
8584	0	0	0.0	1148.5	42.0	0.000	0.000	0.134	5.007	51193	35.9	5.964	335	4.4	20.3	5.9	0.106	8600	7677	my8032_rel.cz11a_bee
8696	0	0	0.0	1187.6	43.1	0.000	0.000	0.137	5.075	51409	35.6	5.912	328	4.4	20.2	5.8	0.291	8708	7757	my8037_rel.cz11a_bee
8258	0	35	0.2	99.7	36.9	0.004	0.026	0.012	4.580	34153	41.9	4.136	406	1.5	1.5	8.3	0.064	8256	6038	fbmy5635_rel_240606_4f3a57a1.cza1_bee
6988	0	30	0.2	86.5	31.9	0.004	0.026	0.012	4.669	29170	40.4	4.174	463	1.5	1.7	8.7	0.072	7002	5762	fbmy8028_rel_240606_c6c83b18.cza1_bee
6807	0	30	0.2	86.8	31.5	0.004	0.026	0.013	4.744	28638	40.4	4.207	475	1.5	1.7	9.0	0.060	6810	5753	fbmy8032_rel_240606_59f03d5a.cza1_bee
qr100.L1
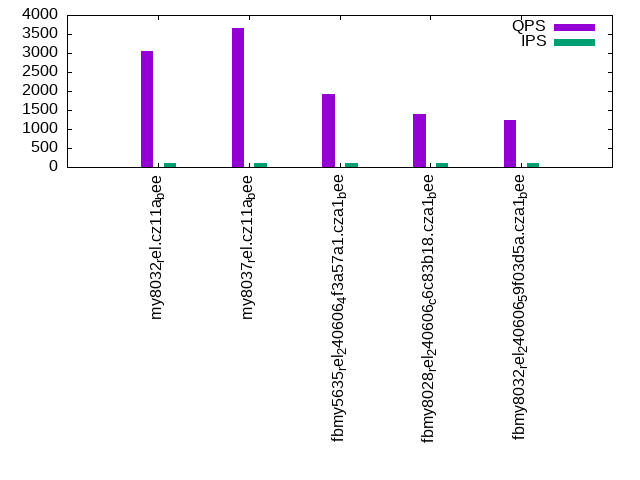
qr100.L1: range queries with 100 insert/s per client. Graphs for performance per 1-second interval are here.
Average throughput:
Query response time histogram: each cell has the percentage of responses that take <= the time in the header and max is the max response time in seconds. For max values in the top 25% of the range have a red background and in the bottom 25% of the range have a green background. The red background is not used when the min value is within 80% of the max value.
| dbms | 256us | 1ms | 4ms | 16ms | 64ms | 256ms | 1s | 4s | 16s | gt | max |
|---|---|---|---|---|---|---|---|---|---|---|---|
| my8032_rel.cz11a_bee | 20.761 | 79.238 | 0.001 | 0.004 | |||||||
| my8037_rel.cz11a_bee | 59.527 | 40.472 | 0.001 | nonzero | 0.005 | ||||||
| fbmy5635_rel_240606_4f3a57a1.cza1_bee | 14.105 | 71.801 | 14.094 | nonzero | 0.005 | ||||||
| fbmy8028_rel_240606_c6c83b18.cza1_bee | 5.471 | 66.112 | 28.417 | nonzero | nonzero | 0.033 | |||||
| fbmy8032_rel_240606_59f03d5a.cza1_bee | 6.017 | 62.462 | 31.520 | 0.001 | nonzero | 0.033 |
Insert response time histogram: each cell has the percentage of responses that take <= the time in the header and max is the max response time in seconds. For max values in the top 25% of the range have a red background and in the bottom 25% of the range have a green background. The red background is not used when the min value is within 80% of the max value.
| dbms | 256us | 1ms | 4ms | 16ms | 64ms | 256ms | 1s | 4s | 16s | gt | max |
|---|---|---|---|---|---|---|---|---|---|---|---|
| my8032_rel.cz11a_bee | 99.722 | 0.250 | 0.028 | 0.025 | |||||||
| my8037_rel.cz11a_bee | 99.611 | 0.361 | 0.028 | 0.030 | |||||||
| fbmy5635_rel_240606_4f3a57a1.cza1_bee | 99.583 | 0.417 | 0.008 | ||||||||
| fbmy8028_rel_240606_c6c83b18.cza1_bee | 99.444 | 0.500 | 0.056 | 0.018 | |||||||
| fbmy8032_rel_240606_59f03d5a.cza1_bee | 99.417 | 0.500 | 0.083 | 0.018 |
Delete response time histogram: each cell has the percentage of responses that take <= the time in the header and max is the max response time in seconds. For max values in the top 25% of the range have a red background and in the bottom 25% of the range have a green background. The red background is not used when the min value is within 80% of the max value.
| dbms | 256us | 1ms | 4ms | 16ms | 64ms | 256ms | 1s | 4s | 16s | gt | max |
|---|---|---|---|---|---|---|---|---|---|---|---|
| my8032_rel.cz11a_bee | 99.806 | 0.194 | 0.008 | ||||||||
| my8037_rel.cz11a_bee | 99.750 | 0.250 | 0.008 | ||||||||
| fbmy5635_rel_240606_4f3a57a1.cza1_bee | 99.611 | 0.389 | 0.008 | ||||||||
| fbmy8028_rel_240606_c6c83b18.cza1_bee | 99.528 | 0.444 | 0.028 | 0.018 | |||||||
| fbmy8032_rel_240606_59f03d5a.cza1_bee | 99.528 | 0.417 | 0.056 | 0.019 |
Performance metrics for the DBMS listed above. Some are normalized by throughput, others are not. Legend for results is here.
ips	qps	rps	rmbps	wps	wmbps	rpq	rkbpq	wpi	wkbpi	csps	cpups	cspq	cpupq	dbgb1	dbgb2	rss	maxop	p50	p99	tag
100	3052	0	0.0	149.5	3.8	0.000	0.000	1.498	38.801	12673	12.8	4.152	336	4.4	20.3	5.9	0.004	3020	2860	my8032_rel.cz11a_bee
100	3648	0	0.0	139.5	3.5	0.000	0.000	1.398	36.183	14896	13.1	4.084	287	4.4	20.2	5.8	0.005	3612	3420	my8037_rel.cz11a_bee
100	1916	0	0.0	4.0	0.3	0.000	0.000	0.040	3.380	7451	12.4	3.889	518	1.5	1.5	8.4	0.005	1950	1566	fbmy5635_rel_240606_4f3a57a1.cza1_bee
100	1393	0	0.0	4.4	0.5	0.000	0.000	0.044	4.668	5600	12.6	4.021	724	1.5	1.7	8.8	0.033	1390	1294	fbmy8028_rel_240606_c6c83b18.cza1_bee
100	1225	0	0.0	4.3	0.4	0.000	0.000	0.043	4.227	5144	12.6	4.198	823	1.5	1.7	9.0	0.033	1182	1071	fbmy8032_rel_240606_59f03d5a.cza1_bee
qp100.L2
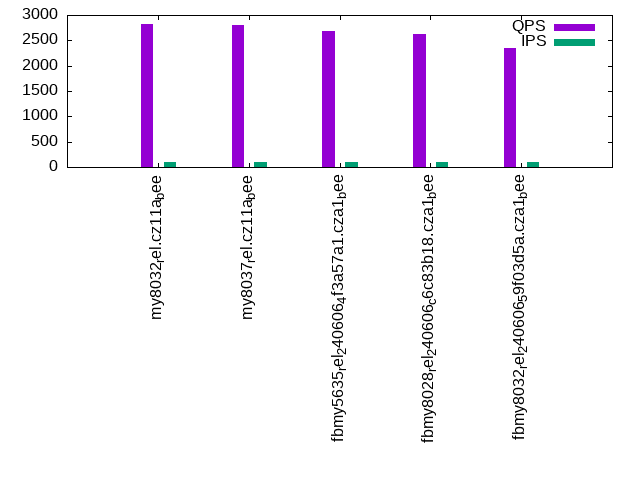
qp100.L2: point queries with 100 insert/s per client. Graphs for performance per 1-second interval are here.
Average throughput:
Query response time histogram: each cell has the percentage of responses that take <= the time in the header and max is the max response time in seconds. For max values in the top 25% of the range have a red background and in the bottom 25% of the range have a green background. The red background is not used when the min value is within 80% of the max value.
| dbms | 256us | 1ms | 4ms | 16ms | 64ms | 256ms | 1s | 4s | 16s | gt | max |
|---|---|---|---|---|---|---|---|---|---|---|---|
| my8032_rel.cz11a_bee | 12.325 | 87.673 | 0.002 | nonzero | 0.005 | ||||||
| my8037_rel.cz11a_bee | 6.361 | 93.638 | 0.001 | nonzero | 0.004 | ||||||
| fbmy5635_rel_240606_4f3a57a1.cza1_bee | 6.102 | 93.894 | 0.003 | 0.001 | 0.010 | ||||||
| fbmy8028_rel_240606_c6c83b18.cza1_bee | 99.994 | 0.006 | 0.001 | 0.010 | |||||||
| fbmy8032_rel_240606_59f03d5a.cza1_bee | nonzero | 99.991 | 0.008 | 0.001 | 0.010 |
Insert response time histogram: each cell has the percentage of responses that take <= the time in the header and max is the max response time in seconds. For max values in the top 25% of the range have a red background and in the bottom 25% of the range have a green background. The red background is not used when the min value is within 80% of the max value.
| dbms | 256us | 1ms | 4ms | 16ms | 64ms | 256ms | 1s | 4s | 16s | gt | max |
|---|---|---|---|---|---|---|---|---|---|---|---|
| my8032_rel.cz11a_bee | 99.444 | 0.556 | 0.015 | ||||||||
| my8037_rel.cz11a_bee | 99.500 | 0.500 | 0.014 | ||||||||
| fbmy5635_rel_240606_4f3a57a1.cza1_bee | 99.528 | 0.472 | 0.009 | ||||||||
| fbmy8028_rel_240606_c6c83b18.cza1_bee | 99.389 | 0.556 | 0.056 | 0.018 | |||||||
| fbmy8032_rel_240606_59f03d5a.cza1_bee | 99.306 | 0.639 | 0.056 | 0.018 |
Delete response time histogram: each cell has the percentage of responses that take <= the time in the header and max is the max response time in seconds. For max values in the top 25% of the range have a red background and in the bottom 25% of the range have a green background. The red background is not used when the min value is within 80% of the max value.
| dbms | 256us | 1ms | 4ms | 16ms | 64ms | 256ms | 1s | 4s | 16s | gt | max |
|---|---|---|---|---|---|---|---|---|---|---|---|
| my8032_rel.cz11a_bee | 99.639 | 0.361 | 0.009 | ||||||||
| my8037_rel.cz11a_bee | 99.611 | 0.389 | 0.009 | ||||||||
| fbmy5635_rel_240606_4f3a57a1.cza1_bee | 99.611 | 0.389 | 0.009 | ||||||||
| fbmy8028_rel_240606_c6c83b18.cza1_bee | 99.472 | 0.472 | 0.056 | 0.018 | |||||||
| fbmy8032_rel_240606_59f03d5a.cza1_bee | 99.556 | 0.389 | 0.056 | 0.018 |
Performance metrics for the DBMS listed above. Some are normalized by throughput, others are not. Legend for results is here.
ips	qps	rps	rmbps	wps	wmbps	rpq	rkbpq	wpi	wkbpi	csps	cpups	cspq	cpupq	dbgb1	dbgb2	rss	maxop	p50	p99	tag
100	2829	0	0.0	31.2	0.8	0.000	0.000	0.312	8.397	12035	13.2	4.255	373	4.4	20.3	5.9	0.005	2717	2589	my8032_rel.cz11a_bee
100	2797	0	0.0	29.7	0.8	0.000	0.000	0.298	8.088	11900	13.4	4.254	383	4.4	20.2	5.8	0.004	2733	2605	my8037_rel.cz11a_bee
100	2694	23	0.1	4.0	0.4	0.009	0.054	0.040	4.036	11021	13.4	4.091	398	1.5	1.6	8.7	0.010	2653	2445	fbmy5635_rel_240606_4f3a57a1.cza1_bee
100	2618	18	0.1	3.9	0.3	0.007	0.044	0.039	3.149	10861	13.7	4.149	419	1.5	1.8	9.1	0.010	2573	2095	fbmy8028_rel_240606_c6c83b18.cza1_bee
100	2346	17	0.1	4.2	0.4	0.007	0.047	0.042	4.150	9937	13.4	4.235	457	1.5	1.8	9.3	0.010	2333	1934	fbmy8032_rel_240606_59f03d5a.cza1_bee
qr500.L3
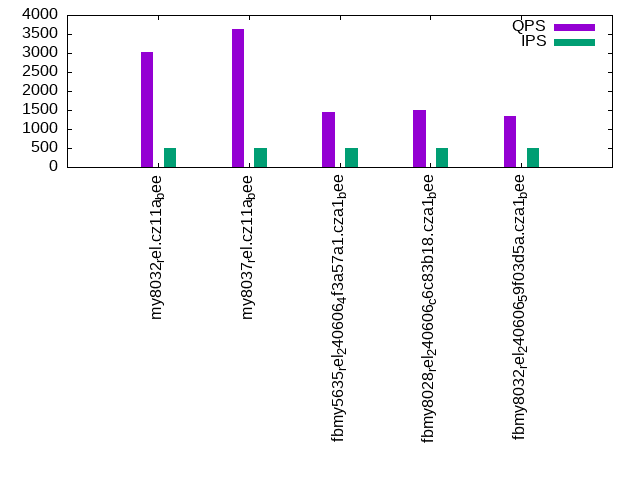
qr500.L3: range queries with 500 insert/s per client. Graphs for performance per 1-second interval are here.
Average throughput:
Query response time histogram: each cell has the percentage of responses that take <= the time in the header and max is the max response time in seconds. For max values in the top 25% of the range have a red background and in the bottom 25% of the range have a green background. The red background is not used when the min value is within 80% of the max value.
| dbms | 256us | 1ms | 4ms | 16ms | 64ms | 256ms | 1s | 4s | 16s | gt | max |
|---|---|---|---|---|---|---|---|---|---|---|---|
| my8032_rel.cz11a_bee | 19.510 | 80.489 | 0.001 | nonzero | 0.007 | ||||||
| my8037_rel.cz11a_bee | 59.002 | 40.997 | 0.001 | nonzero | 0.004 | ||||||
| fbmy5635_rel_240606_4f3a57a1.cza1_bee | 12.054 | 58.449 | 29.497 | nonzero | nonzero | 0.029 | |||||
| fbmy8028_rel_240606_c6c83b18.cza1_bee | 5.889 | 76.690 | 17.420 | 0.001 | nonzero | 0.031 | |||||
| fbmy8032_rel_240606_59f03d5a.cza1_bee | 5.664 | 69.706 | 24.629 | nonzero | nonzero | 0.028 |
Insert response time histogram: each cell has the percentage of responses that take <= the time in the header and max is the max response time in seconds. For max values in the top 25% of the range have a red background and in the bottom 25% of the range have a green background. The red background is not used when the min value is within 80% of the max value.
| dbms | 256us | 1ms | 4ms | 16ms | 64ms | 256ms | 1s | 4s | 16s | gt | max |
|---|---|---|---|---|---|---|---|---|---|---|---|
| my8032_rel.cz11a_bee | 98.683 | 1.311 | 0.006 | 0.020 | |||||||
| my8037_rel.cz11a_bee | 99.206 | 0.778 | 0.017 | 0.029 | |||||||
| fbmy5635_rel_240606_4f3a57a1.cza1_bee | 99.728 | 0.272 | 0.012 | ||||||||
| fbmy8028_rel_240606_c6c83b18.cza1_bee | 99.583 | 0.339 | 0.078 | 0.019 | |||||||
| fbmy8032_rel_240606_59f03d5a.cza1_bee | 99.456 | 0.456 | 0.089 | 0.019 |
Delete response time histogram: each cell has the percentage of responses that take <= the time in the header and max is the max response time in seconds. For max values in the top 25% of the range have a red background and in the bottom 25% of the range have a green background. The red background is not used when the min value is within 80% of the max value.
| dbms | 256us | 1ms | 4ms | 16ms | 64ms | 256ms | 1s | 4s | 16s | gt | max |
|---|---|---|---|---|---|---|---|---|---|---|---|
| my8032_rel.cz11a_bee | 99.611 | 0.389 | 0.014 | ||||||||
| my8037_rel.cz11a_bee | 99.706 | 0.283 | 0.011 | 0.029 | |||||||
| fbmy5635_rel_240606_4f3a57a1.cza1_bee | 99.700 | 0.300 | 0.008 | ||||||||
| fbmy8028_rel_240606_c6c83b18.cza1_bee | 99.583 | 0.344 | 0.072 | 0.018 | |||||||
| fbmy8032_rel_240606_59f03d5a.cza1_bee | 99.522 | 0.394 | 0.083 | 0.018 |
Performance metrics for the DBMS listed above. Some are normalized by throughput, others are not. Legend for results is here.
ips	qps	rps	rmbps	wps	wmbps	rpq	rkbpq	wpi	wkbpi	csps	cpups	cspq	cpupq	dbgb1	dbgb2	rss	maxop	p50	p99	tag
499	3039	0	0.0	65.4	2.2	0.000	0.000	0.131	4.547	12989	13.7	4.274	361	4.4	20.3	5.9	0.007	3005	2861	my8032_rel.cz11a_bee
499	3643	0	0.0	66.9	2.3	0.000	0.000	0.134	4.651	15254	14.1	4.187	310	4.4	20.2	5.8	0.004	3611	3404	my8037_rel.cz11a_bee
499	1453	0	0.0	8.5	2.3	0.000	0.000	0.017	4.820	5828	13.6	4.010	749	1.5	1.8	8.6	0.029	1438	1199	fbmy5635_rel_240606_4f3a57a1.cza1_bee
499	1507	0	0.0	8.4	2.3	0.000	0.000	0.017	4.726	6190	13.7	4.107	727	1.5	2.0	9.1	0.031	1502	1135	fbmy8028_rel_240606_c6c83b18.cza1_bee
499	1338	0	0.0	8.3	2.3	0.000	0.000	0.017	4.626	5722	13.7	4.276	819	1.5	2.0	9.1	0.028	1343	1135	fbmy8032_rel_240606_59f03d5a.cza1_bee
qp500.L4
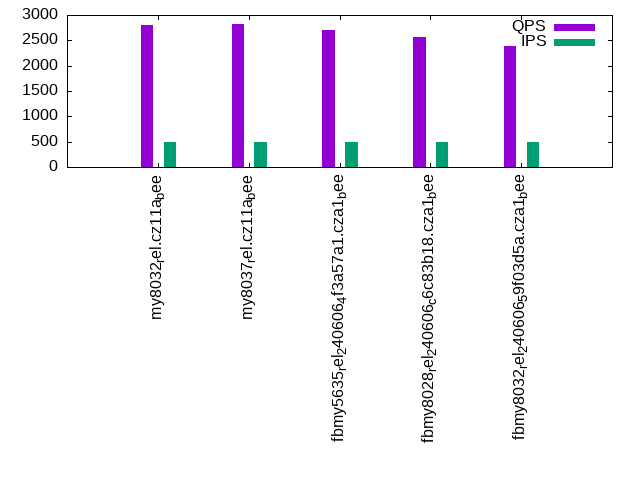
qp500.L4: point queries with 500 insert/s per client. Graphs for performance per 1-second interval are here.
Average throughput:
Query response time histogram: each cell has the percentage of responses that take <= the time in the header and max is the max response time in seconds. For max values in the top 25% of the range have a red background and in the bottom 25% of the range have a green background. The red background is not used when the min value is within 80% of the max value.
| dbms | 256us | 1ms | 4ms | 16ms | 64ms | 256ms | 1s | 4s | 16s | gt | max |
|---|---|---|---|---|---|---|---|---|---|---|---|
| my8032_rel.cz11a_bee | 9.972 | 90.023 | 0.005 | nonzero | 0.005 | ||||||
| my8037_rel.cz11a_bee | 10.446 | 89.550 | 0.004 | nonzero | 0.005 | ||||||
| fbmy5635_rel_240606_4f3a57a1.cza1_bee | 7.201 | 92.795 | 0.004 | nonzero | 0.005 | ||||||
| fbmy8028_rel_240606_c6c83b18.cza1_bee | nonzero | 99.992 | 0.007 | nonzero | 0.009 | ||||||
| fbmy8032_rel_240606_59f03d5a.cza1_bee | 99.993 | 0.007 | 0.003 |
Insert response time histogram: each cell has the percentage of responses that take <= the time in the header and max is the max response time in seconds. For max values in the top 25% of the range have a red background and in the bottom 25% of the range have a green background. The red background is not used when the min value is within 80% of the max value.
| dbms | 256us | 1ms | 4ms | 16ms | 64ms | 256ms | 1s | 4s | 16s | gt | max |
|---|---|---|---|---|---|---|---|---|---|---|---|
| my8032_rel.cz11a_bee | 98.456 | 1.533 | 0.006 | 0.006 | 0.104 | ||||||
| my8037_rel.cz11a_bee | 98.917 | 1.078 | 0.006 | 0.030 | |||||||
| fbmy5635_rel_240606_4f3a57a1.cza1_bee | 99.678 | 0.322 | 0.013 | ||||||||
| fbmy8028_rel_240606_c6c83b18.cza1_bee | 99.450 | 0.467 | 0.083 | 0.018 | |||||||
| fbmy8032_rel_240606_59f03d5a.cza1_bee | 99.428 | 0.494 | 0.078 | 0.019 |
Delete response time histogram: each cell has the percentage of responses that take <= the time in the header and max is the max response time in seconds. For max values in the top 25% of the range have a red background and in the bottom 25% of the range have a green background. The red background is not used when the min value is within 80% of the max value.
| dbms | 256us | 1ms | 4ms | 16ms | 64ms | 256ms | 1s | 4s | 16s | gt | max |
|---|---|---|---|---|---|---|---|---|---|---|---|
| my8032_rel.cz11a_bee | 99.583 | 0.411 | 0.006 | 0.103 | |||||||
| my8037_rel.cz11a_bee | 99.633 | 0.361 | 0.006 | 0.030 | |||||||
| fbmy5635_rel_240606_4f3a57a1.cza1_bee | 99.683 | 0.317 | 0.012 | ||||||||
| fbmy8028_rel_240606_c6c83b18.cza1_bee | 99.561 | 0.356 | 0.083 | 0.020 | |||||||
| fbmy8032_rel_240606_59f03d5a.cza1_bee | 99.511 | 0.422 | 0.067 | 0.019 |
Performance metrics for the DBMS listed above. Some are normalized by throughput, others are not. Legend for results is here.
ips	qps	rps	rmbps	wps	wmbps	rpq	rkbpq	wpi	wkbpi	csps	cpups	cspq	cpupq	dbgb1	dbgb2	rss	maxop	p50	p99	tag
499	2808	0	0.0	67.7	2.3	0.000	0.000	0.136	4.666	12719	14.4	4.529	410	4.4	20.3	5.9	0.005	2717	2573	my8032_rel.cz11a_bee
499	2829	0	0.0	68.9	2.3	0.000	0.000	0.138	4.728	12738	14.2	4.503	402	4.4	20.2	5.8	0.005	2749	2589	my8037_rel.cz11a_bee
499	2707	0	0.0	8.9	2.2	0.000	0.000	0.018	4.518	11164	14.7	4.124	434	1.5	2.0	8.5	0.005	2653	2429	fbmy5635_rel_240606_4f3a57a1.cza1_bee
499	2571	0	0.0	8.8	2.3	0.000	0.000	0.018	4.644	10789	15.1	4.197	470	1.5	2.1	9.0	0.009	2557	2094	fbmy8028_rel_240606_c6c83b18.cza1_bee
499	2389	0	0.0	8.3	2.2	0.000	0.000	0.017	4.565	10217	14.9	4.277	499	1.5	2.1	9.1	0.003	2381	1950	fbmy8032_rel_240606_59f03d5a.cza1_bee
qr1000.L5
qr1000.L5: range queries with 1000 insert/s per client. Graphs for performance per 1-second interval are here.
Average throughput:
Query response time histogram: each cell has the percentage of responses that take <= the time in the header and max is the max response time in seconds. For max values in the top 25% of the range have a red background and in the bottom 25% of the range have a green background. The red background is not used when the min value is within 80% of the max value.
| dbms | 256us | 1ms | 4ms | 16ms | 64ms | 256ms | 1s | 4s | 16s | gt | max |
|---|---|---|---|---|---|---|---|---|---|---|---|
| my8032_rel.cz11a_bee | 19.321 | 80.675 | 0.003 | nonzero | 0.009 | ||||||
| my8037_rel.cz11a_bee | 61.596 | 38.402 | 0.002 | nonzero | 0.008 | ||||||
| fbmy5635_rel_240606_4f3a57a1.cza1_bee | 12.476 | 66.991 | 20.522 | 0.010 | 0.001 | 0.033 | |||||
| fbmy8028_rel_240606_c6c83b18.cza1_bee | 4.709 | 74.611 | 20.679 | nonzero | nonzero | 0.036 | |||||
| fbmy8032_rel_240606_59f03d5a.cza1_bee | 5.092 | 67.094 | 27.813 | 0.001 | nonzero | 0.032 |
Insert response time histogram: each cell has the percentage of responses that take <= the time in the header and max is the max response time in seconds. For max values in the top 25% of the range have a red background and in the bottom 25% of the range have a green background. The red background is not used when the min value is within 80% of the max value.
| dbms | 256us | 1ms | 4ms | 16ms | 64ms | 256ms | 1s | 4s | 16s | gt | max |
|---|---|---|---|---|---|---|---|---|---|---|---|
| my8032_rel.cz11a_bee | 96.717 | 3.272 | 0.011 | 0.026 | |||||||
| my8037_rel.cz11a_bee | 98.122 | 1.864 | 0.008 | 0.003 | 0.003 | 0.275 | |||||
| fbmy5635_rel_240606_4f3a57a1.cza1_bee | 99.686 | 0.311 | 0.003 | 0.038 | |||||||
| fbmy8028_rel_240606_c6c83b18.cza1_bee | 99.556 | 0.364 | 0.081 | 0.063 | |||||||
| fbmy8032_rel_240606_59f03d5a.cza1_bee | 99.500 | 0.419 | 0.081 | 0.056 |
Delete response time histogram: each cell has the percentage of responses that take <= the time in the header and max is the max response time in seconds. For max values in the top 25% of the range have a red background and in the bottom 25% of the range have a green background. The red background is not used when the min value is within 80% of the max value.
| dbms | 256us | 1ms | 4ms | 16ms | 64ms | 256ms | 1s | 4s | 16s | gt | max |
|---|---|---|---|---|---|---|---|---|---|---|---|
| my8032_rel.cz11a_bee | 99.650 | 0.342 | 0.008 | 0.025 | |||||||
| my8037_rel.cz11a_bee | 99.728 | 0.256 | 0.011 | 0.003 | 0.003 | 0.275 | |||||
| fbmy5635_rel_240606_4f3a57a1.cza1_bee | 99.692 | 0.303 | 0.006 | 0.039 | |||||||
| fbmy8028_rel_240606_c6c83b18.cza1_bee | 99.547 | 0.372 | 0.081 | 0.049 | |||||||
| fbmy8032_rel_240606_59f03d5a.cza1_bee | 99.536 | 0.386 | 0.078 | 0.045 |
Performance metrics for the DBMS listed above. Some are normalized by throughput, others are not. Legend for results is here.
ips	qps	rps	rmbps	wps	wmbps	rpq	rkbpq	wpi	wkbpi	csps	cpups	cspq	cpupq	dbgb1	dbgb2	rss	maxop	p50	p99	tag
998	3033	0	0.0	154.6	5.1	0.000	0.000	0.155	5.252	14083	15.0	4.643	396	4.4	20.3	5.9	0.009	2989	2829	my8032_rel.cz11a_bee
998	3696	0	0.0	150.7	5.0	0.000	0.000	0.151	5.152	16512	15.2	4.468	329	4.4	20.2	5.8	0.008	3660	3436	my8037_rel.cz11a_bee
998	1446	0	0.0	14.0	4.5	0.000	0.000	0.014	4.647	6011	15.2	4.159	841	1.5	2.4	8.8	0.033	1454	1071	fbmy5635_rel_240606_4f3a57a1.cza1_bee
998	1526	0	0.0	14.0	4.6	0.000	0.000	0.014	4.747	6477	15.6	4.244	818	1.5	2.5	9.2	0.036	1471	1055	fbmy8028_rel_240606_c6c83b18.cza1_bee
998	1235	0	0.0	14.4	4.6	0.000	0.000	0.014	4.702	5560	15.5	4.501	1004	1.5	2.6	9.1	0.032	1247	959	fbmy8032_rel_240606_59f03d5a.cza1_bee
qp1000.L6
qp1000.L6: point queries with 1000 insert/s per client. Graphs for performance per 1-second interval are here.
Average throughput:
Query response time histogram: each cell has the percentage of responses that take <= the time in the header and max is the max response time in seconds. For max values in the top 25% of the range have a red background and in the bottom 25% of the range have a green background. The red background is not used when the min value is within 80% of the max value.
| dbms | 256us | 1ms | 4ms | 16ms | 64ms | 256ms | 1s | 4s | 16s | gt | max |
|---|---|---|---|---|---|---|---|---|---|---|---|
| my8032_rel.cz11a_bee | 16.458 | 83.531 | 0.010 | nonzero | 0.007 | ||||||
| my8037_rel.cz11a_bee | 15.967 | 84.024 | 0.009 | nonzero | 0.005 | ||||||
| fbmy5635_rel_240606_4f3a57a1.cza1_bee | 6.851 | 93.141 | 0.008 | nonzero | 0.006 | ||||||
| fbmy8028_rel_240606_c6c83b18.cza1_bee | 99.991 | 0.009 | nonzero | 0.005 | |||||||
| fbmy8032_rel_240606_59f03d5a.cza1_bee | 99.990 | 0.010 | 0.004 |
Insert response time histogram: each cell has the percentage of responses that take <= the time in the header and max is the max response time in seconds. For max values in the top 25% of the range have a red background and in the bottom 25% of the range have a green background. The red background is not used when the min value is within 80% of the max value.
| dbms | 256us | 1ms | 4ms | 16ms | 64ms | 256ms | 1s | 4s | 16s | gt | max |
|---|---|---|---|---|---|---|---|---|---|---|---|
| my8032_rel.cz11a_bee | 96.747 | 3.247 | 0.006 | 0.026 | |||||||
| my8037_rel.cz11a_bee | 97.792 | 2.197 | 0.011 | 0.031 | |||||||
| fbmy5635_rel_240606_4f3a57a1.cza1_bee | 99.686 | 0.311 | 0.003 | 0.048 | |||||||
| fbmy8028_rel_240606_c6c83b18.cza1_bee | 99.542 | 0.378 | 0.081 | 0.051 | |||||||
| fbmy8032_rel_240606_59f03d5a.cza1_bee | 99.453 | 0.469 | 0.078 | 0.042 |
Delete response time histogram: each cell has the percentage of responses that take <= the time in the header and max is the max response time in seconds. For max values in the top 25% of the range have a red background and in the bottom 25% of the range have a green background. The red background is not used when the min value is within 80% of the max value.
| dbms | 256us | 1ms | 4ms | 16ms | 64ms | 256ms | 1s | 4s | 16s | gt | max |
|---|---|---|---|---|---|---|---|---|---|---|---|
| my8032_rel.cz11a_bee | 99.622 | 0.372 | 0.006 | 0.023 | |||||||
| my8037_rel.cz11a_bee | 99.653 | 0.342 | 0.006 | 0.029 | |||||||
| fbmy5635_rel_240606_4f3a57a1.cza1_bee | 99.619 | 0.378 | 0.003 | 0.048 | |||||||
| fbmy8028_rel_240606_c6c83b18.cza1_bee | 99.569 | 0.350 | 0.078 | 0.003 | 0.070 | ||||||
| fbmy8032_rel_240606_59f03d5a.cza1_bee | 99.508 | 0.414 | 0.078 | 0.062 |
Performance metrics for the DBMS listed above. Some are normalized by throughput, others are not. Legend for results is here.
ips	qps	rps	rmbps	wps	wmbps	rpq	rkbpq	wpi	wkbpi	csps	cpups	cspq	cpupq	dbgb1	dbgb2	rss	maxop	p50	p99	tag
998	2880	0	0.0	154.5	5.1	0.000	0.000	0.155	5.246	14092	15.5	4.894	431	4.4	20.3	5.9	0.007	2813	2590	my8032_rel.cz11a_bee
998	2897	0	0.0	151.6	5.0	0.000	0.000	0.152	5.172	14094	15.4	4.865	425	4.4	20.2	5.8	0.005	2813	2605	my8037_rel.cz11a_bee
998	2707	0	0.0	13.5	4.5	0.000	0.000	0.013	4.603	11367	16.4	4.199	485	1.5	2.8	8.8	0.006	2653	2445	fbmy5635_rel_240606_4f3a57a1.cza1_bee
998	2496	0	0.0	13.2	4.3	0.000	0.000	0.013	4.364	10671	16.5	4.276	529	1.5	3.0	9.3	0.005	2462	2046	fbmy8028_rel_240606_c6c83b18.cza1_bee
998	2384	0	0.0	13.3	4.3	0.000	0.000	0.013	4.434	10415	16.7	4.369	560	1.5	3.0	9.1	0.004	2381	1950	fbmy8032_rel_240606_59f03d5a.cza1_bee
l.i0
l.i0: load without secondary indexes
Performance metrics for all DBMS, not just the ones listed above. Some are normalized by throughput, others are not. Legend for results is here.
ips	qps	rps	rmbps	wps	wmbps	rpq	rkbpq	wpi	wkbpi	csps	cpups	cspq	cpupq	dbgb1	dbgb2	rss	maxop	p50	p99	tag
56818	0	0	0.0	205.1	18.0	0.000	0.000	0.004	0.325	6721	21.3	0.118	30	1.3	16.9	2.4	0.084	57235	53438	my8032_rel.cz11a_bee
57143	0	0	0.0	199.9	17.8	0.000	0.000	0.003	0.318	6453	21.0	0.113	29	1.3	16.9	2.4	0.089	57334	53939	my8037_rel.cz11a_bee
80321	0	0	0.0	35.6	13.4	0.000	0.000	0.000	0.171	7818	22.5	0.097	22	0.7	1.7	0.2	0.104	80854	71323	fbmy5635_rel_240606_4f3a57a1.cza1_bee
57471	0	0	0.0	34.1	10.9	0.000	0.000	0.001	0.194	5937	22.2	0.103	31	0.7	1.9	0.6	0.089	57568	51442	fbmy8028_rel_240606_c6c83b18.cza1_bee
53908	0	0	0.0	33.4	10.3	0.000	0.000	0.001	0.196	5837	21.8	0.108	32	0.7	1.9	0.6	0.079	53940	48571	fbmy8032_rel_240606_59f03d5a.cza1_bee
l.x
l.x: create secondary indexes
Performance metrics for all DBMS, not just the ones listed above. Some are normalized by throughput, others are not. Legend for results is here.
ips	qps	rps	rmbps	wps	wmbps	rpq	rkbpq	wpi	wkbpi	csps	cpups	cspq	cpupq	dbgb1	dbgb2	rss	maxop	p50	p99	tag
142858	0	750	47.3	2041.3	146.9	0.005	0.339	0.014	1.053	8948	44.1	0.063	25	3.0	18.6	3.1	0.003	NA	NA	my8032_rel.cz11a_bee
142858	0	725	45.7	3106.9	160.1	0.005	0.327	0.022	1.147	10776	43.2	0.075	24	3.0	18.6	3.1	0.003	NA	NA	my8037_rel.cz11a_bee
87720	0	0	0.0	38.9	14.7	0.000	0.000	0.000	0.172	223	11.8	0.003	11	1.4	2.4	1.7	0.002	NA	NA	fbmy5635_rel_240606_4f3a57a1.cza1_bee
77520	0	0	0.0	31.3	12.1	0.000	0.000	0.000	0.159	384	11.6	0.005	12	1.4	2.6	2.0	0.003	NA	NA	fbmy8028_rel_240606_c6c83b18.cza1_bee
76046	0	0	0.0	30.8	11.8	0.000	0.000	0.000	0.160	591	11.7	0.008	12	1.4	2.6	2.1	0.003	NA	NA	fbmy8032_rel_240606_59f03d5a.cza1_bee
l.i1
l.i1: continue load after secondary indexes created with 50 inserts per transaction
Performance metrics for all DBMS, not just the ones listed above. Some are normalized by throughput, others are not. Legend for results is here.
ips	qps	rps	rmbps	wps	wmbps	rpq	rkbpq	wpi	wkbpi	csps	cpups	cspq	cpupq	dbgb1	dbgb2	rss	maxop	p50	p99	tag
16885	0	41	0.6	1999.9	79.1	0.002	0.039	0.118	4.800	36774	38.6	2.178	183	4.4	20.3	5.8	0.105	17473	7242	my8032_rel.cz11a_bee
17391	0	42	0.7	2069.8	81.9	0.002	0.039	0.119	4.824	36954	38.6	2.125	178	4.4	20.2	5.8	0.311	17998	6792	my8037_rel.cz11a_bee
21727	0	95	0.5	109.4	43.2	0.004	0.025	0.005	2.037	9641	44.3	0.444	163	1.6	3.5	7.2	0.086	23391	4495	fbmy5635_rel_240606_4f3a57a1.cza1_bee
19637	0	87	0.5	110.7	42.6	0.004	0.026	0.006	2.221	8890	45.1	0.453	184	1.8	3.9	7.8	0.088	21126	9339	fbmy8028_rel_240606_c6c83b18.cza1_bee
19871	0	92	0.5	121.2	45.9	0.005	0.027	0.006	2.364	9236	47.1	0.465	190	1.7	3.8	8.4	0.078	20527	15033	fbmy8032_rel_240606_59f03d5a.cza1_bee
l.i2
l.i2: continue load after secondary indexes created with 5 inserts per transaction
Performance metrics for all DBMS, not just the ones listed above. Some are normalized by throughput, others are not. Legend for results is here.
ips	qps	rps	rmbps	wps	wmbps	rpq	rkbpq	wpi	wkbpi	csps	cpups	cspq	cpupq	dbgb1	dbgb2	rss	maxop	p50	p99	tag
8584	0	0	0.0	1148.5	42.0	0.000	0.000	0.134	5.007	51193	35.9	5.964	335	4.4	20.3	5.9	0.106	8600	7677	my8032_rel.cz11a_bee
8696	0	0	0.0	1187.6	43.1	0.000	0.000	0.137	5.075	51409	35.6	5.912	328	4.4	20.2	5.8	0.291	8708	7757	my8037_rel.cz11a_bee
8258	0	35	0.2	99.7	36.9	0.004	0.026	0.012	4.580	34153	41.9	4.136	406	1.5	1.5	8.3	0.064	8256	6038	fbmy5635_rel_240606_4f3a57a1.cza1_bee
6988	0	30	0.2	86.5	31.9	0.004	0.026	0.012	4.669	29170	40.4	4.174	463	1.5	1.7	8.7	0.072	7002	5762	fbmy8028_rel_240606_c6c83b18.cza1_bee
6807	0	30	0.2	86.8	31.5	0.004	0.026	0.013	4.744	28638	40.4	4.207	475	1.5	1.7	9.0	0.060	6810	5753	fbmy8032_rel_240606_59f03d5a.cza1_bee
qr100.L1
qr100.L1: range queries with 100 insert/s per client
Performance metrics for all DBMS, not just the ones listed above. Some are normalized by throughput, others are not. Legend for results is here.
ips	qps	rps	rmbps	wps	wmbps	rpq	rkbpq	wpi	wkbpi	csps	cpups	cspq	cpupq	dbgb1	dbgb2	rss	maxop	p50	p99	tag
100	3052	0	0.0	149.5	3.8	0.000	0.000	1.498	38.801	12673	12.8	4.152	336	4.4	20.3	5.9	0.004	3020	2860	my8032_rel.cz11a_bee
100	3648	0	0.0	139.5	3.5	0.000	0.000	1.398	36.183	14896	13.1	4.084	287	4.4	20.2	5.8	0.005	3612	3420	my8037_rel.cz11a_bee
100	1916	0	0.0	4.0	0.3	0.000	0.000	0.040	3.380	7451	12.4	3.889	518	1.5	1.5	8.4	0.005	1950	1566	fbmy5635_rel_240606_4f3a57a1.cza1_bee
100	1393	0	0.0	4.4	0.5	0.000	0.000	0.044	4.668	5600	12.6	4.021	724	1.5	1.7	8.8	0.033	1390	1294	fbmy8028_rel_240606_c6c83b18.cza1_bee
100	1225	0	0.0	4.3	0.4	0.000	0.000	0.043	4.227	5144	12.6	4.198	823	1.5	1.7	9.0	0.033	1182	1071	fbmy8032_rel_240606_59f03d5a.cza1_bee
qp100.L2
qp100.L2: point queries with 100 insert/s per client
Performance metrics for all DBMS, not just the ones listed above. Some are normalized by throughput, others are not. Legend for results is here.
ips	qps	rps	rmbps	wps	wmbps	rpq	rkbpq	wpi	wkbpi	csps	cpups	cspq	cpupq	dbgb1	dbgb2	rss	maxop	p50	p99	tag
100	2829	0	0.0	31.2	0.8	0.000	0.000	0.312	8.397	12035	13.2	4.255	373	4.4	20.3	5.9	0.005	2717	2589	my8032_rel.cz11a_bee
100	2797	0	0.0	29.7	0.8	0.000	0.000	0.298	8.088	11900	13.4	4.254	383	4.4	20.2	5.8	0.004	2733	2605	my8037_rel.cz11a_bee
100	2694	23	0.1	4.0	0.4	0.009	0.054	0.040	4.036	11021	13.4	4.091	398	1.5	1.6	8.7	0.010	2653	2445	fbmy5635_rel_240606_4f3a57a1.cza1_bee
100	2618	18	0.1	3.9	0.3	0.007	0.044	0.039	3.149	10861	13.7	4.149	419	1.5	1.8	9.1	0.010	2573	2095	fbmy8028_rel_240606_c6c83b18.cza1_bee
100	2346	17	0.1	4.2	0.4	0.007	0.047	0.042	4.150	9937	13.4	4.235	457	1.5	1.8	9.3	0.010	2333	1934	fbmy8032_rel_240606_59f03d5a.cza1_bee
qr500.L3
qr500.L3: range queries with 500 insert/s per client
Performance metrics for all DBMS, not just the ones listed above. Some are normalized by throughput, others are not. Legend for results is here.
ips	qps	rps	rmbps	wps	wmbps	rpq	rkbpq	wpi	wkbpi	csps	cpups	cspq	cpupq	dbgb1	dbgb2	rss	maxop	p50	p99	tag
499	3039	0	0.0	65.4	2.2	0.000	0.000	0.131	4.547	12989	13.7	4.274	361	4.4	20.3	5.9	0.007	3005	2861	my8032_rel.cz11a_bee
499	3643	0	0.0	66.9	2.3	0.000	0.000	0.134	4.651	15254	14.1	4.187	310	4.4	20.2	5.8	0.004	3611	3404	my8037_rel.cz11a_bee
499	1453	0	0.0	8.5	2.3	0.000	0.000	0.017	4.820	5828	13.6	4.010	749	1.5	1.8	8.6	0.029	1438	1199	fbmy5635_rel_240606_4f3a57a1.cza1_bee
499	1507	0	0.0	8.4	2.3	0.000	0.000	0.017	4.726	6190	13.7	4.107	727	1.5	2.0	9.1	0.031	1502	1135	fbmy8028_rel_240606_c6c83b18.cza1_bee
499	1338	0	0.0	8.3	2.3	0.000	0.000	0.017	4.626	5722	13.7	4.276	819	1.5	2.0	9.1	0.028	1343	1135	fbmy8032_rel_240606_59f03d5a.cza1_bee
qp500.L4
qp500.L4: point queries with 500 insert/s per client
Performance metrics for all DBMS, not just the ones listed above. Some are normalized by throughput, others are not. Legend for results is here.
ips	qps	rps	rmbps	wps	wmbps	rpq	rkbpq	wpi	wkbpi	csps	cpups	cspq	cpupq	dbgb1	dbgb2	rss	maxop	p50	p99	tag
499	2808	0	0.0	67.7	2.3	0.000	0.000	0.136	4.666	12719	14.4	4.529	410	4.4	20.3	5.9	0.005	2717	2573	my8032_rel.cz11a_bee
499	2829	0	0.0	68.9	2.3	0.000	0.000	0.138	4.728	12738	14.2	4.503	402	4.4	20.2	5.8	0.005	2749	2589	my8037_rel.cz11a_bee
499	2707	0	0.0	8.9	2.2	0.000	0.000	0.018	4.518	11164	14.7	4.124	434	1.5	2.0	8.5	0.005	2653	2429	fbmy5635_rel_240606_4f3a57a1.cza1_bee
499	2571	0	0.0	8.8	2.3	0.000	0.000	0.018	4.644	10789	15.1	4.197	470	1.5	2.1	9.0	0.009	2557	2094	fbmy8028_rel_240606_c6c83b18.cza1_bee
499	2389	0	0.0	8.3	2.2	0.000	0.000	0.017	4.565	10217	14.9	4.277	499	1.5	2.1	9.1	0.003	2381	1950	fbmy8032_rel_240606_59f03d5a.cza1_bee
qr1000.L5
qr1000.L5: range queries with 1000 insert/s per client
Performance metrics for all DBMS, not just the ones listed above. Some are normalized by throughput, others are not. Legend for results is here.
ips	qps	rps	rmbps	wps	wmbps	rpq	rkbpq	wpi	wkbpi	csps	cpups	cspq	cpupq	dbgb1	dbgb2	rss	maxop	p50	p99	tag
998	3033	0	0.0	154.6	5.1	0.000	0.000	0.155	5.252	14083	15.0	4.643	396	4.4	20.3	5.9	0.009	2989	2829	my8032_rel.cz11a_bee
998	3696	0	0.0	150.7	5.0	0.000	0.000	0.151	5.152	16512	15.2	4.468	329	4.4	20.2	5.8	0.008	3660	3436	my8037_rel.cz11a_bee
998	1446	0	0.0	14.0	4.5	0.000	0.000	0.014	4.647	6011	15.2	4.159	841	1.5	2.4	8.8	0.033	1454	1071	fbmy5635_rel_240606_4f3a57a1.cza1_bee
998	1526	0	0.0	14.0	4.6	0.000	0.000	0.014	4.747	6477	15.6	4.244	818	1.5	2.5	9.2	0.036	1471	1055	fbmy8028_rel_240606_c6c83b18.cza1_bee
998	1235	0	0.0	14.4	4.6	0.000	0.000	0.014	4.702	5560	15.5	4.501	1004	1.5	2.6	9.1	0.032	1247	959	fbmy8032_rel_240606_59f03d5a.cza1_bee
qp1000.L6
qp1000.L6: point queries with 1000 insert/s per client
Performance metrics for all DBMS, not just the ones listed above. Some are normalized by throughput, others are not. Legend for results is here.
ips	qps	rps	rmbps	wps	wmbps	rpq	rkbpq	wpi	wkbpi	csps	cpups	cspq	cpupq	dbgb1	dbgb2	rss	maxop	p50	p99	tag
998	2880	0	0.0	154.5	5.1	0.000	0.000	0.155	5.246	14092	15.5	4.894	431	4.4	20.3	5.9	0.007	2813	2590	my8032_rel.cz11a_bee
998	2897	0	0.0	151.6	5.0	0.000	0.000	0.152	5.172	14094	15.4	4.865	425	4.4	20.2	5.8	0.005	2813	2605	my8037_rel.cz11a_bee
998	2707	0	0.0	13.5	4.5	0.000	0.000	0.013	4.603	11367	16.4	4.199	485	1.5	2.8	8.8	0.006	2653	2445	fbmy5635_rel_240606_4f3a57a1.cza1_bee
998	2496	0	0.0	13.2	4.3	0.000	0.000	0.013	4.364	10671	16.5	4.276	529	1.5	3.0	9.3	0.005	2462	2046	fbmy8028_rel_240606_c6c83b18.cza1_bee
998	2384	0	0.0	13.3	4.3	0.000	0.000	0.013	4.434	10415	16.7	4.369	560	1.5	3.0	9.1	0.004	2381	1950	fbmy8032_rel_240606_59f03d5a.cza1_bee
l.i0
- l.i0: load without secondary indexes
- Legend for results is here.
- Each entry lists the percentage of responses that fit in that bucket (slower than max time for previous bucket, faster than min time for next bucket).
Insert response time histogram
256us	1ms	4ms	16ms	64ms	256ms	1s	4s	16s	gt	max	tag
0.000	0.000	99.418	0.441	0.141	0.001	0.000	0.000	0.000	0.000	0.084	my8032_rel.cz11a_bee
0.000	0.000	99.413	0.449	0.138	0.001	0.000	0.000	0.000	0.000	0.089	my8037_rel.cz11a_bee
0.000	0.000	99.872	0.124	0.003	0.001	0.000	0.000	0.000	0.000	0.104	fbmy5635_rel_240606_4f3a57a1.cza1_bee
0.000	0.000	99.724	0.199	0.074	0.003	0.000	0.000	0.000	0.000	0.089	fbmy8028_rel_240606_c6c83b18.cza1_bee
0.000	0.000	99.712	0.210	0.076	0.002	0.000	0.000	0.000	0.000	0.079	fbmy8032_rel_240606_59f03d5a.cza1_bee
l.x
- l.x: create secondary indexes
- Legend for results is here.
- Each entry lists the percentage of responses that fit in that bucket (slower than max time for previous bucket, faster than min time for next bucket).
TODO - determine whether there is data for create index response time
l.i1
- l.i1: continue load after secondary indexes created with 50 inserts per transaction
- Legend for results is here.
- Each entry lists the percentage of responses that fit in that bucket (slower than max time for previous bucket, faster than min time for next bucket).
Insert response time histogram
256us	1ms	4ms	16ms	64ms	256ms	1s	4s	16s	gt	max	tag
0.000	0.000	96.550	3.315	0.132	0.003	0.000	0.000	0.000	0.000	0.105	my8032_rel.cz11a_bee
0.000	0.000	96.679	3.188	0.130	0.002	0.001	0.000	0.000	0.000	0.311	my8037_rel.cz11a_bee
0.000	0.000	99.800	0.194	0.004	0.002	0.000	0.000	0.000	0.000	0.086	fbmy5635_rel_240606_4f3a57a1.cza1_bee
0.000	0.000	99.661	0.272	0.065	0.002	0.000	0.000	0.000	0.000	0.088	fbmy8028_rel_240606_c6c83b18.cza1_bee
0.000	0.000	99.650	0.279	0.071	0.001	0.000	0.000	0.000	0.000	0.078	fbmy8032_rel_240606_59f03d5a.cza1_bee
Delete response time histogram
256us	1ms	4ms	16ms	64ms	256ms	1s	4s	16s	gt	max	tag
0.000	0.000	97.840	2.107	0.050	0.003	0.000	0.000	0.000	0.000	0.108	my8032_rel.cz11a_bee
0.000	0.000	97.893	2.056	0.049	0.001	0.001	0.000	0.000	0.000	0.284	my8037_rel.cz11a_bee
0.000	0.000	99.787	0.200	0.011	0.002	0.000	0.000	0.000	0.000	0.085	fbmy5635_rel_240606_4f3a57a1.cza1_bee
0.000	0.000	99.642	0.279	0.077	0.002	0.000	0.000	0.000	0.000	0.091	fbmy8028_rel_240606_c6c83b18.cza1_bee
0.000	0.000	99.631	0.285	0.084	0.001	0.000	0.000	0.000	0.000	0.076	fbmy8032_rel_240606_59f03d5a.cza1_bee
l.i2
- l.i2: continue load after secondary indexes created with 5 inserts per transaction
- Legend for results is here.
- Each entry lists the percentage of responses that fit in that bucket (slower than max time for previous bucket, faster than min time for next bucket).
Insert response time histogram
256us	1ms	4ms	16ms	64ms	256ms	1s	4s	16s	gt	max	tag
0.000	99.377	0.367	0.254	0.001	0.001	0.000	0.000	0.000	0.000	0.106	my8032_rel.cz11a_bee
0.000	99.378	0.364	0.255	0.002	nonzero	nonzero	0.000	0.000	0.000	0.291	my8037_rel.cz11a_bee
0.016	99.906	0.023	0.054	0.001	nonzero	0.000	0.000	0.000	0.000	0.064	fbmy5635_rel_240606_4f3a57a1.cza1_bee
0.000	99.823	0.089	0.082	0.005	nonzero	0.000	0.000	0.000	0.000	0.072	fbmy8028_rel_240606_c6c83b18.cza1_bee
0.000	99.763	0.147	0.085	0.005	0.000	0.000	0.000	0.000	0.000	0.060	fbmy8032_rel_240606_59f03d5a.cza1_bee
Delete response time histogram
256us	1ms	4ms	16ms	64ms	256ms	1s	4s	16s	gt	max	tag
0.000	99.520	0.229	0.249	0.001	0.001	0.000	0.000	0.000	0.000	0.102	my8032_rel.cz11a_bee
0.000	99.562	0.189	0.247	0.002	nonzero	nonzero	0.000	0.000	0.000	0.284	my8037_rel.cz11a_bee
0.000	99.897	0.043	0.059	0.001	nonzero	0.000	0.000	0.000	0.000	0.064	fbmy5635_rel_240606_4f3a57a1.cza1_bee
0.000	99.594	0.314	0.086	0.006	nonzero	0.000	0.000	0.000	0.000	0.084	fbmy8028_rel_240606_c6c83b18.cza1_bee
0.000	99.418	0.488	0.089	0.006	nonzero	0.000	0.000	0.000	0.000	0.075	fbmy8032_rel_240606_59f03d5a.cza1_bee
qr100.L1
- qr100.L1: range queries with 100 insert/s per client
- Legend for results is here.
- Each entry lists the percentage of responses that fit in that bucket (slower than max time for previous bucket, faster than min time for next bucket).
Query response time histogram
256us	1ms	4ms	16ms	64ms	256ms	1s	4s	16s	gt	max	tag
20.761	79.238	0.001	0.000	0.000	0.000	0.000	0.000	0.000	0.000	0.004	my8032_rel.cz11a_bee
59.527	40.472	0.001	nonzero	0.000	0.000	0.000	0.000	0.000	0.000	0.005	my8037_rel.cz11a_bee
14.105	71.801	14.094	nonzero	0.000	0.000	0.000	0.000	0.000	0.000	0.005	fbmy5635_rel_240606_4f3a57a1.cza1_bee
5.471	66.112	28.417	nonzero	nonzero	0.000	0.000	0.000	0.000	0.000	0.033	fbmy8028_rel_240606_c6c83b18.cza1_bee
6.017	62.462	31.520	0.001	nonzero	0.000	0.000	0.000	0.000	0.000	0.033	fbmy8032_rel_240606_59f03d5a.cza1_bee
Insert response time histogram
256us	1ms	4ms	16ms	64ms	256ms	1s	4s	16s	gt	max	tag
0.000	0.000	99.722	0.250	0.028	0.000	0.000	0.000	0.000	0.000	0.025	my8032_rel.cz11a_bee
0.000	0.000	99.611	0.361	0.028	0.000	0.000	0.000	0.000	0.000	0.030	my8037_rel.cz11a_bee
0.000	0.000	99.583	0.417	0.000	0.000	0.000	0.000	0.000	0.000	0.008	fbmy5635_rel_240606_4f3a57a1.cza1_bee
0.000	0.000	99.444	0.500	0.056	0.000	0.000	0.000	0.000	0.000	0.018	fbmy8028_rel_240606_c6c83b18.cza1_bee
0.000	0.000	99.417	0.500	0.083	0.000	0.000	0.000	0.000	0.000	0.018	fbmy8032_rel_240606_59f03d5a.cza1_bee
Delete response time histogram
256us	1ms	4ms	16ms	64ms	256ms	1s	4s	16s	gt	max	tag
0.000	0.000	99.806	0.194	0.000	0.000	0.000	0.000	0.000	0.000	0.008	my8032_rel.cz11a_bee
0.000	0.000	99.750	0.250	0.000	0.000	0.000	0.000	0.000	0.000	0.008	my8037_rel.cz11a_bee
0.000	0.000	99.611	0.389	0.000	0.000	0.000	0.000	0.000	0.000	0.008	fbmy5635_rel_240606_4f3a57a1.cza1_bee
0.000	0.000	99.528	0.444	0.028	0.000	0.000	0.000	0.000	0.000	0.018	fbmy8028_rel_240606_c6c83b18.cza1_bee
0.000	0.000	99.528	0.417	0.056	0.000	0.000	0.000	0.000	0.000	0.019	fbmy8032_rel_240606_59f03d5a.cza1_bee
qp100.L2
- qp100.L2: point queries with 100 insert/s per client
- Legend for results is here.
- Each entry lists the percentage of responses that fit in that bucket (slower than max time for previous bucket, faster than min time for next bucket).
Query response time histogram
256us	1ms	4ms	16ms	64ms	256ms	1s	4s	16s	gt	max	tag
12.325	87.673	0.002	nonzero	0.000	0.000	0.000	0.000	0.000	0.000	0.005	my8032_rel.cz11a_bee
6.361	93.638	0.001	nonzero	0.000	0.000	0.000	0.000	0.000	0.000	0.004	my8037_rel.cz11a_bee
6.102	93.894	0.003	0.001	0.000	0.000	0.000	0.000	0.000	0.000	0.010	fbmy5635_rel_240606_4f3a57a1.cza1_bee
0.000	99.994	0.006	0.001	0.000	0.000	0.000	0.000	0.000	0.000	0.010	fbmy8028_rel_240606_c6c83b18.cza1_bee
nonzero	99.991	0.008	0.001	0.000	0.000	0.000	0.000	0.000	0.000	0.010	fbmy8032_rel_240606_59f03d5a.cza1_bee
Insert response time histogram
256us	1ms	4ms	16ms	64ms	256ms	1s	4s	16s	gt	max	tag
0.000	0.000	99.444	0.556	0.000	0.000	0.000	0.000	0.000	0.000	0.015	my8032_rel.cz11a_bee
0.000	0.000	99.500	0.500	0.000	0.000	0.000	0.000	0.000	0.000	0.014	my8037_rel.cz11a_bee
0.000	0.000	99.528	0.472	0.000	0.000	0.000	0.000	0.000	0.000	0.009	fbmy5635_rel_240606_4f3a57a1.cza1_bee
0.000	0.000	99.389	0.556	0.056	0.000	0.000	0.000	0.000	0.000	0.018	fbmy8028_rel_240606_c6c83b18.cza1_bee
0.000	0.000	99.306	0.639	0.056	0.000	0.000	0.000	0.000	0.000	0.018	fbmy8032_rel_240606_59f03d5a.cza1_bee
Delete response time histogram
256us	1ms	4ms	16ms	64ms	256ms	1s	4s	16s	gt	max	tag
0.000	0.000	99.639	0.361	0.000	0.000	0.000	0.000	0.000	0.000	0.009	my8032_rel.cz11a_bee
0.000	0.000	99.611	0.389	0.000	0.000	0.000	0.000	0.000	0.000	0.009	my8037_rel.cz11a_bee
0.000	0.000	99.611	0.389	0.000	0.000	0.000	0.000	0.000	0.000	0.009	fbmy5635_rel_240606_4f3a57a1.cza1_bee
0.000	0.000	99.472	0.472	0.056	0.000	0.000	0.000	0.000	0.000	0.018	fbmy8028_rel_240606_c6c83b18.cza1_bee
0.000	0.000	99.556	0.389	0.056	0.000	0.000	0.000	0.000	0.000	0.018	fbmy8032_rel_240606_59f03d5a.cza1_bee
qr500.L3
- qr500.L3: range queries with 500 insert/s per client
- Legend for results is here.
- Each entry lists the percentage of responses that fit in that bucket (slower than max time for previous bucket, faster than min time for next bucket).
Query response time histogram
256us	1ms	4ms	16ms	64ms	256ms	1s	4s	16s	gt	max	tag
19.510	80.489	0.001	nonzero	0.000	0.000	0.000	0.000	0.000	0.000	0.007	my8032_rel.cz11a_bee
59.002	40.997	0.001	nonzero	0.000	0.000	0.000	0.000	0.000	0.000	0.004	my8037_rel.cz11a_bee
12.054	58.449	29.497	nonzero	nonzero	0.000	0.000	0.000	0.000	0.000	0.029	fbmy5635_rel_240606_4f3a57a1.cza1_bee
5.889	76.690	17.420	0.001	nonzero	0.000	0.000	0.000	0.000	0.000	0.031	fbmy8028_rel_240606_c6c83b18.cza1_bee
5.664	69.706	24.629	nonzero	nonzero	0.000	0.000	0.000	0.000	0.000	0.028	fbmy8032_rel_240606_59f03d5a.cza1_bee
Insert response time histogram
256us	1ms	4ms	16ms	64ms	256ms	1s	4s	16s	gt	max	tag
0.000	0.000	98.683	1.311	0.006	0.000	0.000	0.000	0.000	0.000	0.020	my8032_rel.cz11a_bee
0.000	0.000	99.206	0.778	0.017	0.000	0.000	0.000	0.000	0.000	0.029	my8037_rel.cz11a_bee
0.000	0.000	99.728	0.272	0.000	0.000	0.000	0.000	0.000	0.000	0.012	fbmy5635_rel_240606_4f3a57a1.cza1_bee
0.000	0.000	99.583	0.339	0.078	0.000	0.000	0.000	0.000	0.000	0.019	fbmy8028_rel_240606_c6c83b18.cza1_bee
0.000	0.000	99.456	0.456	0.089	0.000	0.000	0.000	0.000	0.000	0.019	fbmy8032_rel_240606_59f03d5a.cza1_bee
Delete response time histogram
256us	1ms	4ms	16ms	64ms	256ms	1s	4s	16s	gt	max	tag
0.000	0.000	99.611	0.389	0.000	0.000	0.000	0.000	0.000	0.000	0.014	my8032_rel.cz11a_bee
0.000	0.000	99.706	0.283	0.011	0.000	0.000	0.000	0.000	0.000	0.029	my8037_rel.cz11a_bee
0.000	0.000	99.700	0.300	0.000	0.000	0.000	0.000	0.000	0.000	0.008	fbmy5635_rel_240606_4f3a57a1.cza1_bee
0.000	0.000	99.583	0.344	0.072	0.000	0.000	0.000	0.000	0.000	0.018	fbmy8028_rel_240606_c6c83b18.cza1_bee
0.000	0.000	99.522	0.394	0.083	0.000	0.000	0.000	0.000	0.000	0.018	fbmy8032_rel_240606_59f03d5a.cza1_bee
qp500.L4
- qp500.L4: point queries with 500 insert/s per client
- Legend for results is here.
- Each entry lists the percentage of responses that fit in that bucket (slower than max time for previous bucket, faster than min time for next bucket).
Query response time histogram
256us	1ms	4ms	16ms	64ms	256ms	1s	4s	16s	gt	max	tag
9.972	90.023	0.005	nonzero	0.000	0.000	0.000	0.000	0.000	0.000	0.005	my8032_rel.cz11a_bee
10.446	89.550	0.004	nonzero	0.000	0.000	0.000	0.000	0.000	0.000	0.005	my8037_rel.cz11a_bee
7.201	92.795	0.004	nonzero	0.000	0.000	0.000	0.000	0.000	0.000	0.005	fbmy5635_rel_240606_4f3a57a1.cza1_bee
nonzero	99.992	0.007	nonzero	0.000	0.000	0.000	0.000	0.000	0.000	0.009	fbmy8028_rel_240606_c6c83b18.cza1_bee
0.000	99.993	0.007	0.000	0.000	0.000	0.000	0.000	0.000	0.000	0.003	fbmy8032_rel_240606_59f03d5a.cza1_bee
Insert response time histogram
256us	1ms	4ms	16ms	64ms	256ms	1s	4s	16s	gt	max	tag
0.000	0.000	98.456	1.533	0.006	0.006	0.000	0.000	0.000	0.000	0.104	my8032_rel.cz11a_bee
0.000	0.000	98.917	1.078	0.006	0.000	0.000	0.000	0.000	0.000	0.030	my8037_rel.cz11a_bee
0.000	0.000	99.678	0.322	0.000	0.000	0.000	0.000	0.000	0.000	0.013	fbmy5635_rel_240606_4f3a57a1.cza1_bee
0.000	0.000	99.450	0.467	0.083	0.000	0.000	0.000	0.000	0.000	0.018	fbmy8028_rel_240606_c6c83b18.cza1_bee
0.000	0.000	99.428	0.494	0.078	0.000	0.000	0.000	0.000	0.000	0.019	fbmy8032_rel_240606_59f03d5a.cza1_bee
Delete response time histogram
256us	1ms	4ms	16ms	64ms	256ms	1s	4s	16s	gt	max	tag
0.000	0.000	99.583	0.411	0.000	0.006	0.000	0.000	0.000	0.000	0.103	my8032_rel.cz11a_bee
0.000	0.000	99.633	0.361	0.006	0.000	0.000	0.000	0.000	0.000	0.030	my8037_rel.cz11a_bee
0.000	0.000	99.683	0.317	0.000	0.000	0.000	0.000	0.000	0.000	0.012	fbmy5635_rel_240606_4f3a57a1.cza1_bee
0.000	0.000	99.561	0.356	0.083	0.000	0.000	0.000	0.000	0.000	0.020	fbmy8028_rel_240606_c6c83b18.cza1_bee
0.000	0.000	99.511	0.422	0.067	0.000	0.000	0.000	0.000	0.000	0.019	fbmy8032_rel_240606_59f03d5a.cza1_bee
qr1000.L5
- qr1000.L5: range queries with 1000 insert/s per client
- Legend for results is here.
- Each entry lists the percentage of responses that fit in that bucket (slower than max time for previous bucket, faster than min time for next bucket).
Query response time histogram
256us	1ms	4ms	16ms	64ms	256ms	1s	4s	16s	gt	max	tag
19.321	80.675	0.003	nonzero	0.000	0.000	0.000	0.000	0.000	0.000	0.009	my8032_rel.cz11a_bee
61.596	38.402	0.002	nonzero	0.000	0.000	0.000	0.000	0.000	0.000	0.008	my8037_rel.cz11a_bee
12.476	66.991	20.522	0.010	0.001	0.000	0.000	0.000	0.000	0.000	0.033	fbmy5635_rel_240606_4f3a57a1.cza1_bee
4.709	74.611	20.679	nonzero	nonzero	0.000	0.000	0.000	0.000	0.000	0.036	fbmy8028_rel_240606_c6c83b18.cza1_bee
5.092	67.094	27.813	0.001	nonzero	0.000	0.000	0.000	0.000	0.000	0.032	fbmy8032_rel_240606_59f03d5a.cza1_bee
Insert response time histogram
256us	1ms	4ms	16ms	64ms	256ms	1s	4s	16s	gt	max	tag
0.000	0.000	96.717	3.272	0.011	0.000	0.000	0.000	0.000	0.000	0.026	my8032_rel.cz11a_bee
0.000	0.000	98.122	1.864	0.008	0.003	0.003	0.000	0.000	0.000	0.275	my8037_rel.cz11a_bee
0.000	0.000	99.686	0.311	0.003	0.000	0.000	0.000	0.000	0.000	0.038	fbmy5635_rel_240606_4f3a57a1.cza1_bee
0.000	0.000	99.556	0.364	0.081	0.000	0.000	0.000	0.000	0.000	0.063	fbmy8028_rel_240606_c6c83b18.cza1_bee
0.000	0.000	99.500	0.419	0.081	0.000	0.000	0.000	0.000	0.000	0.056	fbmy8032_rel_240606_59f03d5a.cza1_bee
Delete response time histogram
256us	1ms	4ms	16ms	64ms	256ms	1s	4s	16s	gt	max	tag
0.000	0.000	99.650	0.342	0.008	0.000	0.000	0.000	0.000	0.000	0.025	my8032_rel.cz11a_bee
0.000	0.000	99.728	0.256	0.011	0.003	0.003	0.000	0.000	0.000	0.275	my8037_rel.cz11a_bee
0.000	0.000	99.692	0.303	0.006	0.000	0.000	0.000	0.000	0.000	0.039	fbmy5635_rel_240606_4f3a57a1.cza1_bee
0.000	0.000	99.547	0.372	0.081	0.000	0.000	0.000	0.000	0.000	0.049	fbmy8028_rel_240606_c6c83b18.cza1_bee
0.000	0.000	99.536	0.386	0.078	0.000	0.000	0.000	0.000	0.000	0.045	fbmy8032_rel_240606_59f03d5a.cza1_bee
qp1000.L6
- qp1000.L6: point queries with 1000 insert/s per client
- Legend for results is here.
- Each entry lists the percentage of responses that fit in that bucket (slower than max time for previous bucket, faster than min time for next bucket).
Query response time histogram
256us	1ms	4ms	16ms	64ms	256ms	1s	4s	16s	gt	max	tag
16.458	83.531	0.010	nonzero	0.000	0.000	0.000	0.000	0.000	0.000	0.007	my8032_rel.cz11a_bee
15.967	84.024	0.009	nonzero	0.000	0.000	0.000	0.000	0.000	0.000	0.005	my8037_rel.cz11a_bee
6.851	93.141	0.008	nonzero	0.000	0.000	0.000	0.000	0.000	0.000	0.006	fbmy5635_rel_240606_4f3a57a1.cza1_bee
0.000	99.991	0.009	nonzero	0.000	0.000	0.000	0.000	0.000	0.000	0.005	fbmy8028_rel_240606_c6c83b18.cza1_bee
0.000	99.990	0.010	0.000	0.000	0.000	0.000	0.000	0.000	0.000	0.004	fbmy8032_rel_240606_59f03d5a.cza1_bee
Insert response time histogram
256us	1ms	4ms	16ms	64ms	256ms	1s	4s	16s	gt	max	tag
0.000	0.000	96.747	3.247	0.006	0.000	0.000	0.000	0.000	0.000	0.026	my8032_rel.cz11a_bee
0.000	0.000	97.792	2.197	0.011	0.000	0.000	0.000	0.000	0.000	0.031	my8037_rel.cz11a_bee
0.000	0.000	99.686	0.311	0.003	0.000	0.000	0.000	0.000	0.000	0.048	fbmy5635_rel_240606_4f3a57a1.cza1_bee
0.000	0.000	99.542	0.378	0.081	0.000	0.000	0.000	0.000	0.000	0.051	fbmy8028_rel_240606_c6c83b18.cza1_bee
0.000	0.000	99.453	0.469	0.078	0.000	0.000	0.000	0.000	0.000	0.042	fbmy8032_rel_240606_59f03d5a.cza1_bee
Delete response time histogram
256us	1ms	4ms	16ms	64ms	256ms	1s	4s	16s	gt	max	tag
0.000	0.000	99.622	0.372	0.006	0.000	0.000	0.000	0.000	0.000	0.023	my8032_rel.cz11a_bee
0.000	0.000	99.653	0.342	0.006	0.000	0.000	0.000	0.000	0.000	0.029	my8037_rel.cz11a_bee
0.000	0.000	99.619	0.378	0.003	0.000	0.000	0.000	0.000	0.000	0.048	fbmy5635_rel_240606_4f3a57a1.cza1_bee
0.000	0.000	99.569	0.350	0.078	0.003	0.000	0.000	0.000	0.000	0.070	fbmy8028_rel_240606_c6c83b18.cza1_bee
0.000	0.000	99.508	0.414	0.078	0.000	0.000	0.000	0.000	0.000	0.062	fbmy8032_rel_240606_59f03d5a.cza1_bee