Introduction
This is a report for the insert benchmark with 20M docs and 1 client(s). It is generated by scripts (bash, awk, sed) and Tufte might not be impressed. An overview of the insert benchmark is here and a short update is here. Below, by DBMS, I mean DBMS+version.config. An example is my8020.c10b40 where my means MySQL, 8020 is version 8.0.20 and c10b40 is the name for the configuration file.
The test server has 8 AMD cores, 16G RAM and an NVMe SSD. It is described here as the Beelink. The benchmark was run with 1 client and there were 1 or 3 connections per client (1 for queries or inserts without rate limits, 1+1 for rate limited inserts+deletes). It uses 1 table. It loads 20M rows per table without secondary indexes, creates 3 secondary indexes per table, then inserts 40m+10m rows per table with a delete per insert to avoid growing the table. It then does 6 read+write tests for 1800s each that do queries as fast as possible with 100,100,500,500,1000,1000 inserts/s and the same for deletes/s per client concurrent with the queries. The database is cached in memory. Clients and the DBMS share one server. The per-database configs are in the per-database subdirectories here.
The tested DBMS are:
- my5651_rel.cz11a_bee - MySQL 5.6.51 with the cz11a_bee config
- my5744_rel.cz11a_bee - MySQL 5.7.44 with the cz11a_bee config
- my8028_rel.cz11a_bee - MySQL 8.0.28 with the cz11a_bee config
- my8032_rel.cz11a_bee - MySQL 8.0.32 with the cz11a_bee config
- my8036_rel.cz11a_bee - MySQL 8.0.36 with the cz11a_bee config
- my8037_rel.cz11a_bee - MySQL 8.0.37 with the cz11a_bee config
Contents
- Summary
- l.i0: load without secondary indexes
- l.x: create secondary indexes
- l.i1: continue load after secondary indexes created with 50 inserts per transaction
- l.i2: continue load after secondary indexes created with 5 inserts per transaction
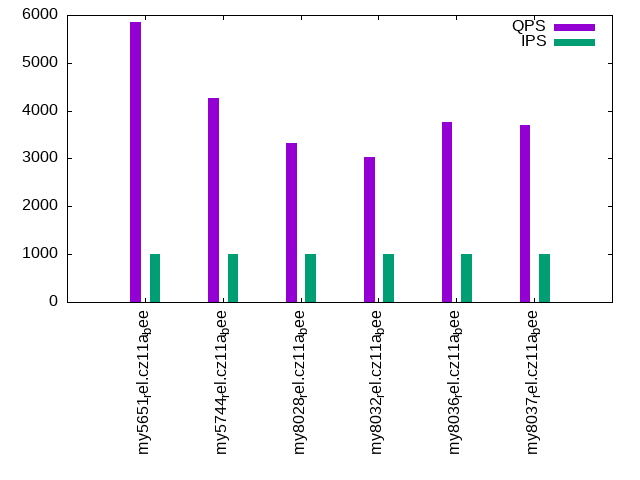
- qr100.L1: range queries with 100 insert/s per client
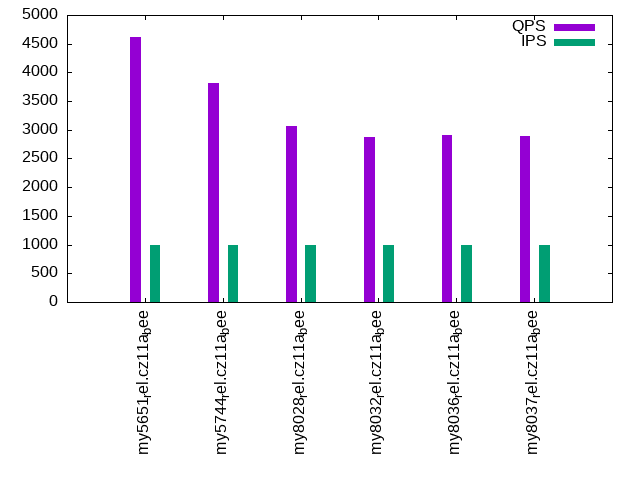
- qp100.L2: point queries with 100 insert/s per client
- qr500.L3: range queries with 500 insert/s per client
- qp500.L4: point queries with 500 insert/s per client
- qr1000.L5: range queries with 1000 insert/s per client
- qp1000.L6: point queries with 1000 insert/s per client
Summary
The numbers are inserts/s for l.i0, l.i1 and l.i2, indexed docs (or rows) /s for l.x and queries/s for qr100, qp100 thru qr1000, qp1000" The values are the average rate over the entire test for inserts (IPS) and queries (QPS). The range of values for IPS and QPS is split into 3 parts: bottom 25%, middle 50%, top 25%. Values in the bottom 25% have a red background, values in the top 25% have a green background and values in the middle have no color. A gray background is used for values that can be ignored because the DBMS did not sustain the target insert rate. Red backgrounds are not used when the minimum value is within 80% of the max value.
| dbms | l.i0 | l.x | l.i1 | l.i2 | qr100 | qp100 | qr500 | qp500 | qr1000 | qp1000 |
|---|---|---|---|---|---|---|---|---|---|---|
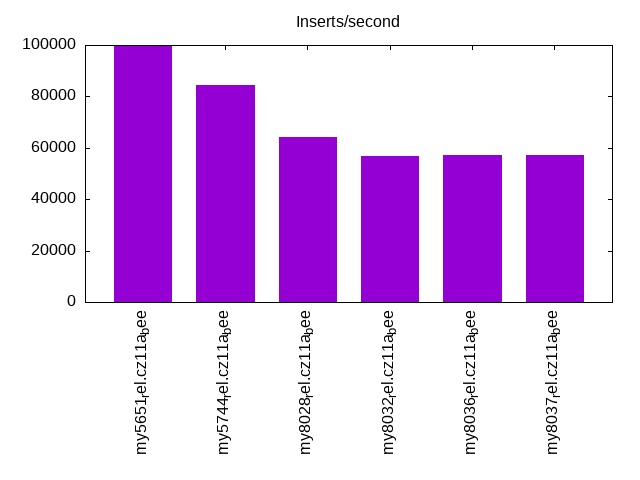
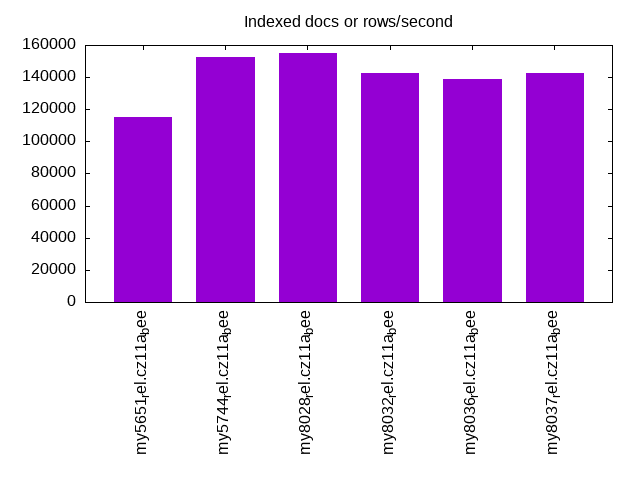
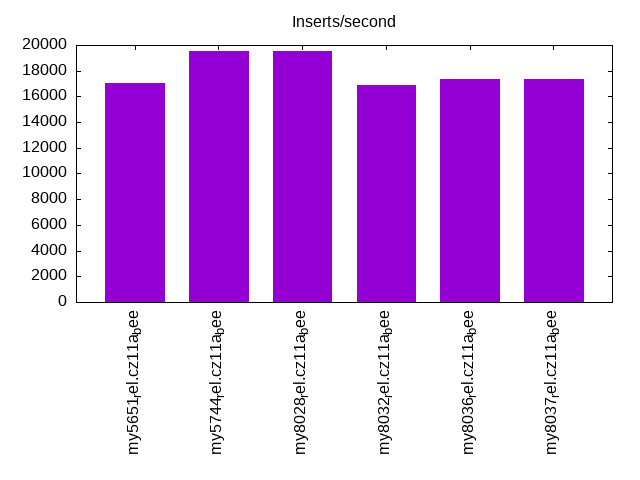
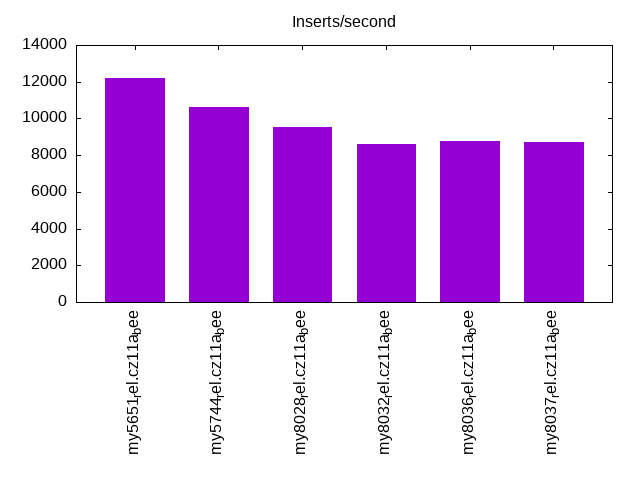
| my5651_rel.cz11a_bee | 100000 | 114943 | 17014 | 12210 | 5711 | 4601 | 5719 | 4626 | 5862 | 4621 |
| my5744_rel.cz11a_bee | 84388 | 152672 | 19503 | 10638 | 4259 | 3747 | 4242 | 3802 | 4268 | 3816 |
| my8028_rel.cz11a_bee | 64309 | 155040 | 19503 | 9524 | 3369 | 3045 | 3367 | 3092 | 3332 | 3073 |
| my8032_rel.cz11a_bee | 56818 | 142858 | 16885 | 8584 | 3052 | 2829 | 3039 | 2808 | 3033 | 2880 |
| my8036_rel.cz11a_bee | 57143 | 138890 | 17384 | 8764 | 3665 | 2824 | 3713 | 2843 | 3764 | 2914 |
| my8037_rel.cz11a_bee | 57143 | 142858 | 17391 | 8696 | 3648 | 2797 | 3643 | 2829 | 3696 | 2897 |
This table has relative throughput, throughput for the DBMS relative to the DBMS in the first line, using the absolute throughput from the previous table. Values less than 0.95 have a yellow background. Values greater than 1.05 have a blue background.
| dbms | l.i0 | l.x | l.i1 | l.i2 | qr100 | qp100 | qr500 | qp500 | qr1000 | qp1000 |
|---|---|---|---|---|---|---|---|---|---|---|
| my5651_rel.cz11a_bee | 1.00 | 1.00 | 1.00 | 1.00 | 1.00 | 1.00 | 1.00 | 1.00 | 1.00 | 1.00 |
| my5744_rel.cz11a_bee | 0.84 | 1.33 | 1.15 | 0.87 | 0.75 | 0.81 | 0.74 | 0.82 | 0.73 | 0.83 |
| my8028_rel.cz11a_bee | 0.64 | 1.35 | 1.15 | 0.78 | 0.59 | 0.66 | 0.59 | 0.67 | 0.57 | 0.67 |
| my8032_rel.cz11a_bee | 0.57 | 1.24 | 0.99 | 0.70 | 0.53 | 0.61 | 0.53 | 0.61 | 0.52 | 0.62 |
| my8036_rel.cz11a_bee | 0.57 | 1.21 | 1.02 | 0.72 | 0.64 | 0.61 | 0.65 | 0.61 | 0.64 | 0.63 |
| my8037_rel.cz11a_bee | 0.57 | 1.24 | 1.02 | 0.71 | 0.64 | 0.61 | 0.64 | 0.61 | 0.63 | 0.63 |
This lists the average rate of inserts/s for the tests that do inserts concurrent with queries. For such tests the query rate is listed in the table above. The read+write tests are setup so that the insert rate should match the target rate every second. Cells that are not at least 95% of the target have a red background to indicate a failure to satisfy the target.
| dbms | qr100.L1 | qp100.L2 | qr500.L3 | qp500.L4 | qr1000.L5 | qp1000.L6 |
|---|---|---|---|---|---|---|
| my5651_rel.cz11a_bee | 100 | 100 | 499 | 499 | 998 | 998 |
| my5744_rel.cz11a_bee | 100 | 100 | 499 | 499 | 998 | 998 |
| my8028_rel.cz11a_bee | 100 | 100 | 499 | 499 | 998 | 998 |
| my8032_rel.cz11a_bee | 100 | 100 | 499 | 499 | 998 | 998 |
| my8036_rel.cz11a_bee | 100 | 100 | 499 | 499 | 998 | 998 |
| my8037_rel.cz11a_bee | 100 | 100 | 499 | 499 | 998 | 998 |
| target | 100 | 100 | 500 | 500 | 1000 | 1000 |
l.i0
l.i0: load without secondary indexes. Graphs for performance per 1-second interval are here.
Average throughput:
Insert response time histogram: each cell has the percentage of responses that take <= the time in the header and max is the max response time in seconds. For the max column values in the top 25% of the range have a red background and in the bottom 25% of the range have a green background. The red background is not used when the min value is within 80% of the max value.
| dbms | 256us | 1ms | 4ms | 16ms | 64ms | 256ms | 1s | 4s | 16s | gt | max |
|---|---|---|---|---|---|---|---|---|---|---|---|
| my5651_rel.cz11a_bee | 88.959 | 10.933 | 0.106 | 0.002 | 0.002 | 0.087 | |||||
| my5744_rel.cz11a_bee | 3.368 | 96.287 | 0.203 | 0.142 | 0.001 | 0.066 | |||||
| my8028_rel.cz11a_bee | 99.461 | 0.398 | 0.139 | 0.002 | 0.088 | ||||||
| my8032_rel.cz11a_bee | 99.418 | 0.441 | 0.141 | 0.001 | 0.084 | ||||||
| my8036_rel.cz11a_bee | 99.413 | 0.456 | 0.132 | 0.001 | 0.088 | ||||||
| my8037_rel.cz11a_bee | 99.413 | 0.449 | 0.138 | 0.001 | 0.089 |
Performance metrics for the DBMS listed above. Some are normalized by throughput, others are not. Legend for results is here.
ips	qps	rps	rmbps	wps	wmbps	rpq	rkbpq	wpi	wkbpi	csps	cpups	cspq	cpupq	dbgb1	dbgb2	rss	maxop	p50	p99	tag
100000	0	876	3.4	276.6	29.6	0.009	0.035	0.003	0.303	11978	22.8	0.120	18	1.3	16.8	1.9	0.087	100387	88598	my5651_rel.cz11a_bee
84388	0	0	0.0	205.6	23.7	0.000	0.000	0.002	0.288	8487	21.5	0.101	20	1.3	16.8	2.3	0.066	84885	75713	my5744_rel.cz11a_bee
64309	0	0	0.0	206.4	19.3	0.000	0.000	0.003	0.307	7039	21.2	0.109	26	1.3	16.9	2.4	0.088	64427	59831	my8028_rel.cz11a_bee
56818	0	0	0.0	205.1	18.0	0.000	0.000	0.004	0.325	6721	21.3	0.118	30	1.3	16.9	2.4	0.084	57235	53438	my8032_rel.cz11a_bee
57143	0	0	0.0	201.7	18.0	0.000	0.000	0.004	0.322	6443	20.9	0.113	29	1.3	16.9	2.4	0.088	57237	54040	my8036_rel.cz11a_bee
57143	0	0	0.0	199.9	17.8	0.000	0.000	0.003	0.318	6453	21.0	0.113	29	1.3	16.9	2.4	0.089	57334	53939	my8037_rel.cz11a_bee
l.x
l.x: create secondary indexes.
Average throughput:
Performance metrics for the DBMS listed above. Some are normalized by throughput, others are not. Legend for results is here.
ips	qps	rps	rmbps	wps	wmbps	rpq	rkbpq	wpi	wkbpi	csps	cpups	cspq	cpupq	dbgb1	dbgb2	rss	maxop	p50	p99	tag
114943	0	8	0.0	871.0	111.7	0.000	0.000	0.008	0.995	2315	11.7	0.020	8	2.8	18.3	3.0	0.001	NA	NA	my5651_rel.cz11a_bee
152672	0	0	0.0	1554.8	139.0	0.000	0.000	0.010	0.932	9510	11.9	0.062	6	3.0	18.6	3.3	0.001	NA	NA	my5744_rel.cz11a_bee
155040	0	811	51.1	2394.4	162.1	0.005	0.338	0.015	1.070	9470	43.7	0.061	23	3.0	18.6	3.6	0.003	NA	NA	my8028_rel.cz11a_bee
142858	0	750	47.3	2041.3	146.9	0.005	0.339	0.014	1.053	8948	44.1	0.063	25	3.0	18.6	3.1	0.003	NA	NA	my8032_rel.cz11a_bee
138890	0	724	45.6	2242.8	146.5	0.005	0.336	0.016	1.080	9152	43.4	0.066	25	3.0	18.6	3.0	0.003	NA	NA	my8036_rel.cz11a_bee
142858	0	725	45.7	3106.9	160.1	0.005	0.327	0.022	1.147	10776	43.2	0.075	24	3.0	18.6	3.1	0.003	NA	NA	my8037_rel.cz11a_bee
l.i1
l.i1: continue load after secondary indexes created with 50 inserts per transaction. Graphs for performance per 1-second interval are here.
Average throughput:
Insert response time histogram: each cell has the percentage of responses that take <= the time in the header and max is the max response time in seconds. For the max column values in the top 25% of the range have a red background and in the bottom 25% of the range have a green background. The red background is not used when the min value is within 80% of the max value.
| dbms | 256us | 1ms | 4ms | 16ms | 64ms | 256ms | 1s | 4s | 16s | gt | max |
|---|---|---|---|---|---|---|---|---|---|---|---|
| my5651_rel.cz11a_bee | 93.758 | 6.083 | 0.158 | nonzero | 0.114 | ||||||
| my5744_rel.cz11a_bee | 95.958 | 3.964 | 0.076 | 0.001 | 0.081 | ||||||
| my8028_rel.cz11a_bee | 97.571 | 2.349 | 0.076 | 0.003 | 0.106 | ||||||
| my8032_rel.cz11a_bee | 96.550 | 3.315 | 0.132 | 0.003 | 0.105 | ||||||
| my8036_rel.cz11a_bee | 96.677 | 3.199 | 0.121 | 0.003 | 0.105 | ||||||
| my8037_rel.cz11a_bee | 96.679 | 3.188 | 0.130 | 0.002 | 0.001 | 0.311 |
Delete response time histogram: each cell has the percentage of responses that take <= the time in the header and max is the max response time in seconds. For the max column values in the top 25% of the range have a red background and in the bottom 25% of the range have a green background. The red background is not used when the min value is within 80% of the max value.
| dbms | 256us | 1ms | 4ms | 16ms | 64ms | 256ms | 1s | 4s | 16s | gt | max |
|---|---|---|---|---|---|---|---|---|---|---|---|
| my5651_rel.cz11a_bee | 97.076 | 2.832 | 0.091 | nonzero | 0.066 | ||||||
| my5744_rel.cz11a_bee | 97.403 | 2.577 | 0.018 | 0.001 | 0.081 | ||||||
| my8028_rel.cz11a_bee | 98.256 | 1.722 | 0.019 | 0.003 | 0.105 | ||||||
| my8032_rel.cz11a_bee | 97.840 | 2.107 | 0.050 | 0.003 | 0.108 | ||||||
| my8036_rel.cz11a_bee | 97.902 | 2.055 | 0.040 | 0.003 | 0.105 | ||||||
| my8037_rel.cz11a_bee | 97.893 | 2.056 | 0.049 | 0.001 | 0.001 | 0.284 |
Performance metrics for the DBMS listed above. Some are normalized by throughput, others are not. Legend for results is here.
ips	qps	rps	rmbps	wps	wmbps	rpq	rkbpq	wpi	wkbpi	csps	cpups	cspq	cpupq	dbgb1	dbgb2	rss	maxop	p50	p99	tag
17014	0	503	2.0	1451.6	65.7	0.030	0.118	0.085	3.952	20489	47.1	1.204	221	4.1	19.6	4.8	0.114	18029	5694	my5651_rel.cz11a_bee
19503	0	0	0.0	1642.0	74.5	0.000	0.000	0.084	3.912	16219	53.5	0.832	219	4.1	19.7	5.1	0.081	20377	7042	my5744_rel.cz11a_bee
19503	0	47	0.7	1816.8	70.8	0.002	0.039	0.093	3.718	36617	38.8	1.878	159	4.3	20.1	5.6	0.106	20177	8690	my8028_rel.cz11a_bee
16885	0	41	0.6	1999.9	79.1	0.002	0.039	0.118	4.800	36774	38.6	2.178	183	4.4	20.3	5.8	0.105	17473	7242	my8032_rel.cz11a_bee
17384	0	42	0.7	2075.9	82.2	0.002	0.039	0.119	4.840	36928	38.5	2.124	177	4.3	20.2	5.8	0.105	17980	7192	my8036_rel.cz11a_bee
17391	0	42	0.7	2069.8	81.9	0.002	0.039	0.119	4.824	36954	38.6	2.125	178	4.4	20.2	5.8	0.311	17998	6792	my8037_rel.cz11a_bee
l.i2
l.i2: continue load after secondary indexes created with 5 inserts per transaction. Graphs for performance per 1-second interval are here.
Average throughput:
Insert response time histogram: each cell has the percentage of responses that take <= the time in the header and max is the max response time in seconds. For the max column values in the top 25% of the range have a red background and in the bottom 25% of the range have a green background. The red background is not used when the min value is within 80% of the max value.
| dbms | 256us | 1ms | 4ms | 16ms | 64ms | 256ms | 1s | 4s | 16s | gt | max |
|---|---|---|---|---|---|---|---|---|---|---|---|
| my5651_rel.cz11a_bee | 10.881 | 88.836 | 0.086 | 0.197 | 0.001 | 0.052 | |||||
| my5744_rel.cz11a_bee | 0.284 | 98.656 | 0.826 | 0.233 | 0.001 | 0.056 | |||||
| my8028_rel.cz11a_bee | 99.523 | 0.246 | 0.230 | 0.001 | 0.001 | 0.104 | |||||
| my8032_rel.cz11a_bee | 99.377 | 0.367 | 0.254 | 0.001 | 0.001 | 0.106 | |||||
| my8036_rel.cz11a_bee | 99.410 | 0.340 | 0.248 | 0.002 | 0.001 | 0.108 | |||||
| my8037_rel.cz11a_bee | 99.378 | 0.364 | 0.255 | 0.002 | nonzero | nonzero | 0.291 |
Delete response time histogram: each cell has the percentage of responses that take <= the time in the header and max is the max response time in seconds. For the max column values in the top 25% of the range have a red background and in the bottom 25% of the range have a green background. The red background is not used when the min value is within 80% of the max value.
| dbms | 256us | 1ms | 4ms | 16ms | 64ms | 256ms | 1s | 4s | 16s | gt | max |
|---|---|---|---|---|---|---|---|---|---|---|---|
| my5651_rel.cz11a_bee | 15.289 | 84.450 | 0.063 | 0.197 | 0.001 | 0.051 | |||||
| my5744_rel.cz11a_bee | 0.779 | 98.129 | 0.860 | 0.232 | 0.001 | 0.056 | |||||
| my8028_rel.cz11a_bee | 99.615 | 0.160 | 0.223 | nonzero | 0.001 | 0.102 | |||||
| my8032_rel.cz11a_bee | 99.520 | 0.229 | 0.249 | 0.001 | 0.001 | 0.102 | |||||
| my8036_rel.cz11a_bee | 99.563 | 0.194 | 0.240 | 0.002 | 0.001 | 0.102 | |||||
| my8037_rel.cz11a_bee | 99.562 | 0.189 | 0.247 | 0.002 | nonzero | nonzero | 0.284 |
Performance metrics for the DBMS listed above. Some are normalized by throughput, others are not. Legend for results is here.
ips	qps	rps	rmbps	wps	wmbps	rpq	rkbpq	wpi	wkbpi	csps	cpups	cspq	cpupq	dbgb1	dbgb2	rss	maxop	p50	p99	tag
12210	0	2181	8.5	1052.6	45.9	0.179	0.715	0.086	3.851	96316	44.9	7.888	294	4.1	19.6	4.8	0.052	12191	11233	my5651_rel.cz11a_bee
10638	0	0	0.0	965.0	41.5	0.000	0.000	0.091	3.996	44615	42.2	4.194	317	4.1	19.7	5.1	0.056	10638	9884	my5744_rel.cz11a_bee
9524	0	0	0.0	1074.1	38.5	0.000	0.000	0.113	4.141	53515	35.7	5.619	300	4.3	20.1	5.6	0.104	9510	8501	my8028_rel.cz11a_bee
8584	0	0	0.0	1148.5	42.0	0.000	0.000	0.134	5.007	51193	35.9	5.964	335	4.4	20.3	5.9	0.106	8600	7677	my8032_rel.cz11a_bee
8764	0	0	0.0	1170.0	42.8	0.000	0.000	0.133	4.997	51525	35.6	5.879	325	4.3	20.2	5.8	0.108	8784	7821	my8036_rel.cz11a_bee
8696	0	0	0.0	1187.6	43.1	0.000	0.000	0.137	5.075	51409	35.6	5.912	328	4.4	20.2	5.8	0.291	8708	7757	my8037_rel.cz11a_bee
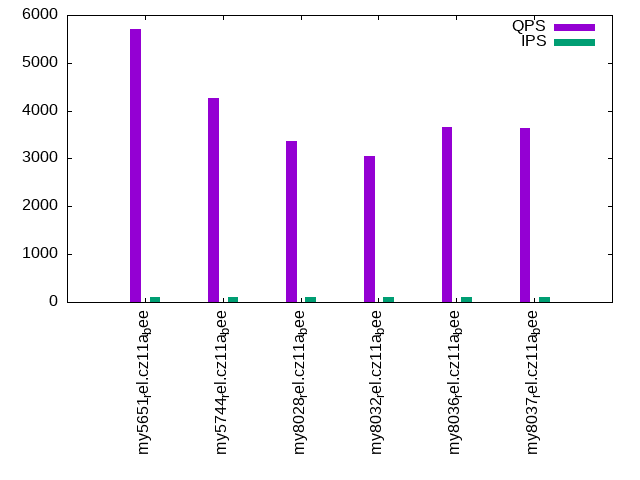
qr100.L1
qr100.L1: range queries with 100 insert/s per client. Graphs for performance per 1-second interval are here.
Average throughput:
Query response time histogram: each cell has the percentage of responses that take <= the time in the header and max is the max response time in seconds. For max values in the top 25% of the range have a red background and in the bottom 25% of the range have a green background. The red background is not used when the min value is within 80% of the max value.
| dbms | 256us | 1ms | 4ms | 16ms | 64ms | 256ms | 1s | 4s | 16s | gt | max |
|---|---|---|---|---|---|---|---|---|---|---|---|
| my5651_rel.cz11a_bee | 97.515 | 2.478 | 0.003 | 0.004 | nonzero | 0.019 | |||||
| my5744_rel.cz11a_bee | 75.966 | 24.033 | 0.001 | 0.003 | |||||||
| my8028_rel.cz11a_bee | 38.514 | 61.485 | 0.001 | nonzero | 0.004 | ||||||
| my8032_rel.cz11a_bee | 20.761 | 79.238 | 0.001 | 0.004 | |||||||
| my8036_rel.cz11a_bee | 60.140 | 39.859 | 0.001 | nonzero | 0.005 | ||||||
| my8037_rel.cz11a_bee | 59.527 | 40.472 | 0.001 | nonzero | 0.005 |
Insert response time histogram: each cell has the percentage of responses that take <= the time in the header and max is the max response time in seconds. For max values in the top 25% of the range have a red background and in the bottom 25% of the range have a green background. The red background is not used when the min value is within 80% of the max value.
| dbms | 256us | 1ms | 4ms | 16ms | 64ms | 256ms | 1s | 4s | 16s | gt | max |
|---|---|---|---|---|---|---|---|---|---|---|---|
| my5651_rel.cz11a_bee | 47.667 | 49.972 | 2.361 | 0.034 | |||||||
| my5744_rel.cz11a_bee | 99.444 | 0.556 | 0.012 | ||||||||
| my8028_rel.cz11a_bee | 99.722 | 0.250 | 0.028 | 0.016 | |||||||
| my8032_rel.cz11a_bee | 99.722 | 0.250 | 0.028 | 0.025 | |||||||
| my8036_rel.cz11a_bee | 99.333 | 0.667 | 0.014 | ||||||||
| my8037_rel.cz11a_bee | 99.611 | 0.361 | 0.028 | 0.030 |
Delete response time histogram: each cell has the percentage of responses that take <= the time in the header and max is the max response time in seconds. For max values in the top 25% of the range have a red background and in the bottom 25% of the range have a green background. The red background is not used when the min value is within 80% of the max value.
| dbms | 256us | 1ms | 4ms | 16ms | 64ms | 256ms | 1s | 4s | 16s | gt | max |
|---|---|---|---|---|---|---|---|---|---|---|---|
| my5651_rel.cz11a_bee | 48.139 | 50.250 | 1.611 | 0.039 | |||||||
| my5744_rel.cz11a_bee | 99.694 | 0.306 | 0.009 | ||||||||
| my8028_rel.cz11a_bee | 99.722 | 0.278 | 0.015 | ||||||||
| my8032_rel.cz11a_bee | 99.806 | 0.194 | 0.008 | ||||||||
| my8036_rel.cz11a_bee | 99.528 | 0.472 | 0.013 | ||||||||
| my8037_rel.cz11a_bee | 99.750 | 0.250 | 0.008 |
Performance metrics for the DBMS listed above. Some are normalized by throughput, others are not. Legend for results is here.
ips	qps	rps	rmbps	wps	wmbps	rpq	rkbpq	wpi	wkbpi	csps	cpups	cspq	cpupq	dbgb1	dbgb2	rss	maxop	p50	p99	tag
100	5711	4	0.0	217.3	6.6	0.001	0.003	2.177	67.208	22694	13.2	3.974	185	4.1	19.6	4.8	0.019	5674	5545	my5651_rel.cz11a_bee
100	4259	0	0.0	144.5	4.2	0.000	0.000	1.448	43.507	16907	13.2	3.970	248	4.1	19.7	5.1	0.003	4203	4026	my5744_rel.cz11a_bee
100	3369	0	0.0	146.6	3.7	0.000	0.000	1.469	37.743	13657	12.7	4.054	302	4.3	20.1	5.7	0.004	3340	3164	my8028_rel.cz11a_bee
100	3052	0	0.0	149.5	3.8	0.000	0.000	1.498	38.801	12673	12.8	4.152	336	4.4	20.3	5.9	0.004	3020	2860	my8032_rel.cz11a_bee
100	3665	0	0.0	163.3	4.1	0.000	0.000	1.636	42.302	15040	13.1	4.104	286	4.3	20.2	5.8	0.005	3628	3436	my8036_rel.cz11a_bee
100	3648	0	0.0	139.5	3.5	0.000	0.000	1.398	36.183	14896	13.1	4.084	287	4.4	20.2	5.8	0.005	3612	3420	my8037_rel.cz11a_bee
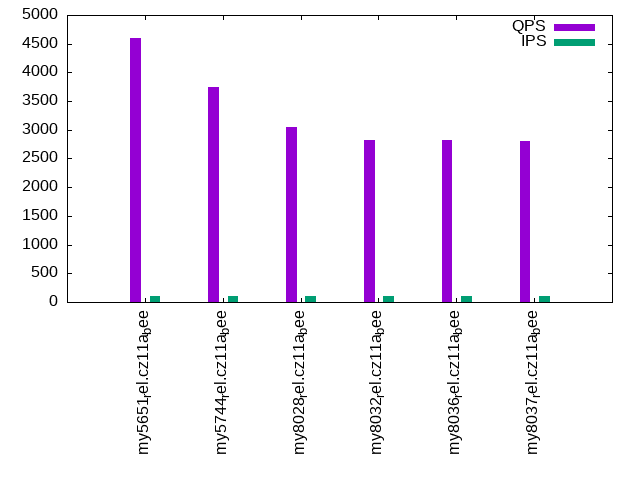
qp100.L2
qp100.L2: point queries with 100 insert/s per client. Graphs for performance per 1-second interval are here.
Average throughput:
Query response time histogram: each cell has the percentage of responses that take <= the time in the header and max is the max response time in seconds. For max values in the top 25% of the range have a red background and in the bottom 25% of the range have a green background. The red background is not used when the min value is within 80% of the max value.
| dbms | 256us | 1ms | 4ms | 16ms | 64ms | 256ms | 1s | 4s | 16s | gt | max |
|---|---|---|---|---|---|---|---|---|---|---|---|
| my5651_rel.cz11a_bee | 94.855 | 5.136 | 0.006 | 0.003 | 0.011 | ||||||
| my5744_rel.cz11a_bee | 85.527 | 14.467 | 0.006 | nonzero | 0.005 | ||||||
| my8028_rel.cz11a_bee | 11.317 | 88.681 | 0.001 | nonzero | 0.005 | ||||||
| my8032_rel.cz11a_bee | 12.325 | 87.673 | 0.002 | nonzero | 0.005 | ||||||
| my8036_rel.cz11a_bee | 8.662 | 91.337 | 0.001 | nonzero | 0.004 | ||||||
| my8037_rel.cz11a_bee | 6.361 | 93.638 | 0.001 | nonzero | 0.004 |
Insert response time histogram: each cell has the percentage of responses that take <= the time in the header and max is the max response time in seconds. For max values in the top 25% of the range have a red background and in the bottom 25% of the range have a green background. The red background is not used when the min value is within 80% of the max value.
| dbms | 256us | 1ms | 4ms | 16ms | 64ms | 256ms | 1s | 4s | 16s | gt | max |
|---|---|---|---|---|---|---|---|---|---|---|---|
| my5651_rel.cz11a_bee | 52.361 | 47.167 | 0.472 | 0.019 | |||||||
| my5744_rel.cz11a_bee | 99.472 | 0.528 | 0.010 | ||||||||
| my8028_rel.cz11a_bee | 99.778 | 0.222 | 0.016 | ||||||||
| my8032_rel.cz11a_bee | 99.444 | 0.556 | 0.015 | ||||||||
| my8036_rel.cz11a_bee | 99.500 | 0.472 | 0.028 | 0.024 | |||||||
| my8037_rel.cz11a_bee | 99.500 | 0.500 | 0.014 |
Delete response time histogram: each cell has the percentage of responses that take <= the time in the header and max is the max response time in seconds. For max values in the top 25% of the range have a red background and in the bottom 25% of the range have a green background. The red background is not used when the min value is within 80% of the max value.
| dbms | 256us | 1ms | 4ms | 16ms | 64ms | 256ms | 1s | 4s | 16s | gt | max |
|---|---|---|---|---|---|---|---|---|---|---|---|
| my5651_rel.cz11a_bee | 53.944 | 45.972 | 0.083 | 0.018 | |||||||
| my5744_rel.cz11a_bee | 99.639 | 0.361 | 0.008 | ||||||||
| my8028_rel.cz11a_bee | 99.750 | 0.250 | 0.008 | ||||||||
| my8032_rel.cz11a_bee | 99.639 | 0.361 | 0.009 | ||||||||
| my8036_rel.cz11a_bee | 99.611 | 0.361 | 0.028 | 0.025 | |||||||
| my8037_rel.cz11a_bee | 99.611 | 0.389 | 0.009 |
Performance metrics for the DBMS listed above. Some are normalized by throughput, others are not. Legend for results is here.
ips	qps	rps	rmbps	wps	wmbps	rpq	rkbpq	wpi	wkbpi	csps	cpups	cspq	cpupq	dbgb1	dbgb2	rss	maxop	p50	p99	tag
100	4601	4	0.0	2.2	0.1	0.001	0.003	0.022	1.182	18710	13.6	4.066	236	4.1	19.6	4.8	0.011	4541	4299	my5651_rel.cz11a_bee
100	3747	0	0.0	26.7	0.7	0.000	0.000	0.267	7.217	15333	13.9	4.092	297	4.1	19.7	5.1	0.005	3692	3500	my5744_rel.cz11a_bee
100	3045	0	0.0	29.9	0.8	0.000	0.000	0.299	7.771	12682	13.4	4.165	352	4.3	20.1	5.7	0.005	2973	2829	my8028_rel.cz11a_bee
100	2829	0	0.0	31.2	0.8	0.000	0.000	0.312	8.397	12035	13.2	4.255	373	4.4	20.3	5.9	0.005	2717	2589	my8032_rel.cz11a_bee
100	2824	0	0.0	29.9	0.8	0.000	0.000	0.300	8.155	12014	13.5	4.254	382	4.3	20.2	5.8	0.004	2749	2621	my8036_rel.cz11a_bee
100	2797	0	0.0	29.7	0.8	0.000	0.000	0.298	8.088	11900	13.4	4.254	383	4.4	20.2	5.8	0.004	2733	2605	my8037_rel.cz11a_bee
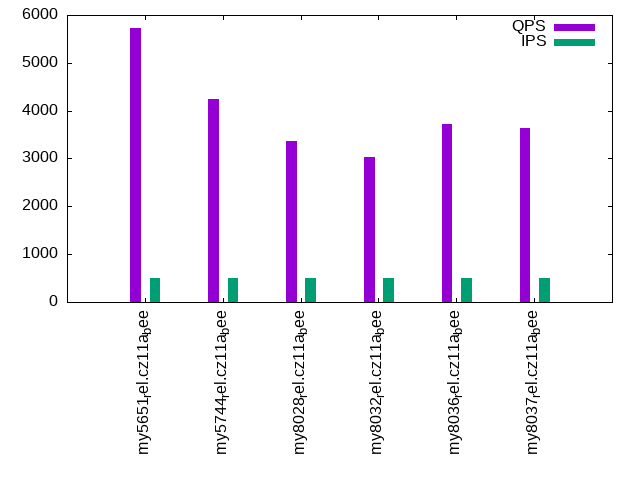
qr500.L3
qr500.L3: range queries with 500 insert/s per client. Graphs for performance per 1-second interval are here.
Average throughput:
Query response time histogram: each cell has the percentage of responses that take <= the time in the header and max is the max response time in seconds. For max values in the top 25% of the range have a red background and in the bottom 25% of the range have a green background. The red background is not used when the min value is within 80% of the max value.
| dbms | 256us | 1ms | 4ms | 16ms | 64ms | 256ms | 1s | 4s | 16s | gt | max |
|---|---|---|---|---|---|---|---|---|---|---|---|
| my5651_rel.cz11a_bee | 97.369 | 2.624 | 0.004 | 0.004 | 0.010 | ||||||
| my5744_rel.cz11a_bee | 75.069 | 24.930 | nonzero | nonzero | 0.004 | ||||||
| my8028_rel.cz11a_bee | 38.349 | 61.650 | 0.001 | nonzero | 0.008 | ||||||
| my8032_rel.cz11a_bee | 19.510 | 80.489 | 0.001 | nonzero | 0.007 | ||||||
| my8036_rel.cz11a_bee | 62.652 | 37.346 | 0.001 | nonzero | 0.008 | ||||||
| my8037_rel.cz11a_bee | 59.002 | 40.997 | 0.001 | nonzero | 0.004 |
Insert response time histogram: each cell has the percentage of responses that take <= the time in the header and max is the max response time in seconds. For max values in the top 25% of the range have a red background and in the bottom 25% of the range have a green background. The red background is not used when the min value is within 80% of the max value.
| dbms | 256us | 1ms | 4ms | 16ms | 64ms | 256ms | 1s | 4s | 16s | gt | max |
|---|---|---|---|---|---|---|---|---|---|---|---|
| my5651_rel.cz11a_bee | 88.711 | 11.200 | 0.089 | 0.021 | |||||||
| my5744_rel.cz11a_bee | 99.333 | 0.667 | 0.014 | ||||||||
| my8028_rel.cz11a_bee | 99.500 | 0.494 | 0.006 | 0.016 | |||||||
| my8032_rel.cz11a_bee | 98.683 | 1.311 | 0.006 | 0.020 | |||||||
| my8036_rel.cz11a_bee | 99.156 | 0.828 | 0.011 | 0.006 | 0.102 | ||||||
| my8037_rel.cz11a_bee | 99.206 | 0.778 | 0.017 | 0.029 |
Delete response time histogram: each cell has the percentage of responses that take <= the time in the header and max is the max response time in seconds. For max values in the top 25% of the range have a red background and in the bottom 25% of the range have a green background. The red background is not used when the min value is within 80% of the max value.
| dbms | 256us | 1ms | 4ms | 16ms | 64ms | 256ms | 1s | 4s | 16s | gt | max |
|---|---|---|---|---|---|---|---|---|---|---|---|
| my5651_rel.cz11a_bee | 90.150 | 9.833 | 0.017 | 0.017 | |||||||
| my5744_rel.cz11a_bee | 99.550 | 0.450 | 0.014 | ||||||||
| my8028_rel.cz11a_bee | 99.672 | 0.328 | 0.015 | ||||||||
| my8032_rel.cz11a_bee | 99.611 | 0.389 | 0.014 | ||||||||
| my8036_rel.cz11a_bee | 99.583 | 0.400 | 0.011 | 0.006 | 0.103 | ||||||
| my8037_rel.cz11a_bee | 99.706 | 0.283 | 0.011 | 0.029 |
Performance metrics for the DBMS listed above. Some are normalized by throughput, others are not. Legend for results is here.
ips	qps	rps	rmbps	wps	wmbps	rpq	rkbpq	wpi	wkbpi	csps	cpups	cspq	cpupq	dbgb1	dbgb2	rss	maxop	p50	p99	tag
499	5719	16	0.1	7.7	0.7	0.003	0.011	0.015	1.439	22348	14.3	3.908	200	4.1	19.6	4.8	0.010	5658	5529	my5651_rel.cz11a_bee
499	4242	0	0.0	48.0	1.8	0.000	0.000	0.096	3.648	16634	14.1	3.922	266	4.1	19.7	5.1	0.004	4186	4012	my5744_rel.cz11a_bee
499	3367	0	0.0	51.4	1.7	0.000	0.000	0.103	3.538	13899	13.6	4.128	323	4.3	20.1	5.7	0.008	3326	3148	my8028_rel.cz11a_bee
499	3039	0	0.0	65.4	2.2	0.000	0.000	0.131	4.547	12989	13.7	4.274	361	4.4	20.3	5.9	0.007	3005	2861	my8032_rel.cz11a_bee
499	3713	0	0.0	64.5	2.2	0.000	0.000	0.129	4.512	15504	14.2	4.175	306	4.3	20.2	5.8	0.008	3662	3484	my8036_rel.cz11a_bee
499	3643	0	0.0	66.9	2.3	0.000	0.000	0.134	4.651	15254	14.1	4.187	310	4.4	20.2	5.8	0.004	3611	3404	my8037_rel.cz11a_bee
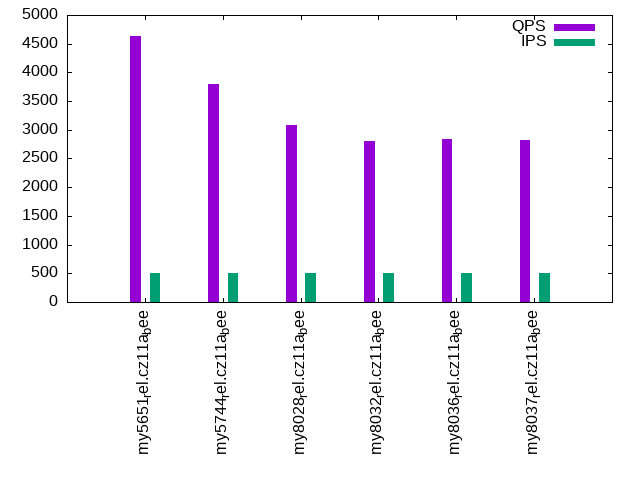
qp500.L4
qp500.L4: point queries with 500 insert/s per client. Graphs for performance per 1-second interval are here.
Average throughput:
Query response time histogram: each cell has the percentage of responses that take <= the time in the header and max is the max response time in seconds. For max values in the top 25% of the range have a red background and in the bottom 25% of the range have a green background. The red background is not used when the min value is within 80% of the max value.
| dbms | 256us | 1ms | 4ms | 16ms | 64ms | 256ms | 1s | 4s | 16s | gt | max |
|---|---|---|---|---|---|---|---|---|---|---|---|
| my5651_rel.cz11a_bee | 94.184 | 5.788 | 0.026 | 0.002 | 0.013 | ||||||
| my5744_rel.cz11a_bee | 86.101 | 13.889 | 0.010 | 0.001 | 0.010 | ||||||
| my8028_rel.cz11a_bee | 17.282 | 82.712 | 0.006 | nonzero | 0.008 | ||||||
| my8032_rel.cz11a_bee | 9.972 | 90.023 | 0.005 | nonzero | 0.005 | ||||||
| my8036_rel.cz11a_bee | 11.368 | 88.626 | 0.005 | nonzero | 0.007 | ||||||
| my8037_rel.cz11a_bee | 10.446 | 89.550 | 0.004 | nonzero | 0.005 |
Insert response time histogram: each cell has the percentage of responses that take <= the time in the header and max is the max response time in seconds. For max values in the top 25% of the range have a red background and in the bottom 25% of the range have a green background. The red background is not used when the min value is within 80% of the max value.
| dbms | 256us | 1ms | 4ms | 16ms | 64ms | 256ms | 1s | 4s | 16s | gt | max |
|---|---|---|---|---|---|---|---|---|---|---|---|
| my5651_rel.cz11a_bee | 86.472 | 13.344 | 0.183 | 0.033 | |||||||
| my5744_rel.cz11a_bee | 99.417 | 0.583 | 0.011 | ||||||||
| my8028_rel.cz11a_bee | 99.483 | 0.517 | 0.015 | ||||||||
| my8032_rel.cz11a_bee | 98.456 | 1.533 | 0.006 | 0.006 | 0.104 | ||||||
| my8036_rel.cz11a_bee | 99.228 | 0.761 | 0.011 | 0.026 | |||||||
| my8037_rel.cz11a_bee | 98.917 | 1.078 | 0.006 | 0.030 |
Delete response time histogram: each cell has the percentage of responses that take <= the time in the header and max is the max response time in seconds. For max values in the top 25% of the range have a red background and in the bottom 25% of the range have a green background. The red background is not used when the min value is within 80% of the max value.
| dbms | 256us | 1ms | 4ms | 16ms | 64ms | 256ms | 1s | 4s | 16s | gt | max |
|---|---|---|---|---|---|---|---|---|---|---|---|
| my5651_rel.cz11a_bee | 89.594 | 10.294 | 0.111 | 0.039 | |||||||
| my5744_rel.cz11a_bee | 99.639 | 0.361 | 0.011 | ||||||||
| my8028_rel.cz11a_bee | 99.650 | 0.350 | 0.016 | ||||||||
| my8032_rel.cz11a_bee | 99.583 | 0.411 | 0.006 | 0.103 | |||||||
| my8036_rel.cz11a_bee | 99.711 | 0.283 | 0.006 | 0.028 | |||||||
| my8037_rel.cz11a_bee | 99.633 | 0.361 | 0.006 | 0.030 |
Performance metrics for the DBMS listed above. Some are normalized by throughput, others are not. Legend for results is here.
ips	qps	rps	rmbps	wps	wmbps	rpq	rkbpq	wpi	wkbpi	csps	cpups	cspq	cpupq	dbgb1	dbgb2	rss	maxop	p50	p99	tag
499	4626	16	0.1	406.9	12.7	0.004	0.014	0.815	26.111	20411	14.7	4.412	254	4.1	19.6	4.8	0.013	4523	4267	my5651_rel.cz11a_bee
499	3802	0	0.0	60.4	2.1	0.000	0.000	0.121	4.398	15768	14.8	4.147	311	4.1	19.7	5.1	0.010	3740	3500	my5744_rel.cz11a_bee
499	3092	0	0.0	59.3	1.9	0.000	0.000	0.119	3.941	13506	14.0	4.369	362	4.3	20.1	5.7	0.008	3005	2828	my8028_rel.cz11a_bee
499	2808	0	0.0	67.7	2.3	0.000	0.000	0.136	4.666	12719	14.4	4.529	410	4.4	20.3	5.9	0.005	2717	2573	my8032_rel.cz11a_bee
499	2843	0	0.0	65.8	2.2	0.000	0.000	0.132	4.576	12777	14.4	4.494	405	4.3	20.2	5.8	0.007	2749	2590	my8036_rel.cz11a_bee
499	2829	0	0.0	68.9	2.3	0.000	0.000	0.138	4.728	12738	14.2	4.503	402	4.4	20.2	5.8	0.005	2749	2589	my8037_rel.cz11a_bee
qr1000.L5
qr1000.L5: range queries with 1000 insert/s per client. Graphs for performance per 1-second interval are here.
Average throughput:
Query response time histogram: each cell has the percentage of responses that take <= the time in the header and max is the max response time in seconds. For max values in the top 25% of the range have a red background and in the bottom 25% of the range have a green background. The red background is not used when the min value is within 80% of the max value.
| dbms | 256us | 1ms | 4ms | 16ms | 64ms | 256ms | 1s | 4s | 16s | gt | max |
|---|---|---|---|---|---|---|---|---|---|---|---|
| my5651_rel.cz11a_bee | 97.314 | 2.669 | 0.014 | 0.003 | nonzero | 0.016 | |||||
| my5744_rel.cz11a_bee | 75.700 | 24.298 | 0.002 | nonzero | 0.007 | ||||||
| my8028_rel.cz11a_bee | 37.045 | 62.952 | 0.003 | nonzero | 0.007 | ||||||
| my8032_rel.cz11a_bee | 19.321 | 80.675 | 0.003 | nonzero | 0.009 | ||||||
| my8036_rel.cz11a_bee | 64.098 | 35.899 | 0.003 | nonzero | 0.005 | ||||||
| my8037_rel.cz11a_bee | 61.596 | 38.402 | 0.002 | nonzero | 0.008 |
Insert response time histogram: each cell has the percentage of responses that take <= the time in the header and max is the max response time in seconds. For max values in the top 25% of the range have a red background and in the bottom 25% of the range have a green background. The red background is not used when the min value is within 80% of the max value.
| dbms | 256us | 1ms | 4ms | 16ms | 64ms | 256ms | 1s | 4s | 16s | gt | max |
|---|---|---|---|---|---|---|---|---|---|---|---|
| my5651_rel.cz11a_bee | 88.461 | 11.392 | 0.147 | 0.026 | |||||||
| my5744_rel.cz11a_bee | 99.506 | 0.494 | 0.011 | ||||||||
| my8028_rel.cz11a_bee | 99.444 | 0.550 | 0.006 | 0.016 | |||||||
| my8032_rel.cz11a_bee | 96.717 | 3.272 | 0.011 | 0.026 | |||||||
| my8036_rel.cz11a_bee | 98.036 | 1.953 | 0.011 | 0.025 | |||||||
| my8037_rel.cz11a_bee | 98.122 | 1.864 | 0.008 | 0.003 | 0.003 | 0.275 |
Delete response time histogram: each cell has the percentage of responses that take <= the time in the header and max is the max response time in seconds. For max values in the top 25% of the range have a red background and in the bottom 25% of the range have a green background. The red background is not used when the min value is within 80% of the max value.
| dbms | 256us | 1ms | 4ms | 16ms | 64ms | 256ms | 1s | 4s | 16s | gt | max |
|---|---|---|---|---|---|---|---|---|---|---|---|
| my5651_rel.cz11a_bee | 92.675 | 7.233 | 0.092 | 0.025 | |||||||
| my5744_rel.cz11a_bee | 99.708 | 0.292 | 0.012 | ||||||||
| my8028_rel.cz11a_bee | 99.728 | 0.272 | 0.016 | ||||||||
| my8032_rel.cz11a_bee | 99.650 | 0.342 | 0.008 | 0.025 | |||||||
| my8036_rel.cz11a_bee | 99.539 | 0.453 | 0.008 | 0.025 | |||||||
| my8037_rel.cz11a_bee | 99.728 | 0.256 | 0.011 | 0.003 | 0.003 | 0.275 |
Performance metrics for the DBMS listed above. Some are normalized by throughput, others are not. Legend for results is here.
ips	qps	rps	rmbps	wps	wmbps	rpq	rkbpq	wpi	wkbpi	csps	cpups	cspq	cpupq	dbgb1	dbgb2	rss	maxop	p50	p99	tag
998	5862	32	0.1	361.4	11.8	0.005	0.022	0.362	12.154	24367	15.4	4.157	210	4.1	19.6	4.8	0.016	5823	5500	my5651_rel.cz11a_bee
998	4268	0	0.0	84.9	3.4	0.000	0.000	0.085	3.486	17024	15.2	3.989	285	4.1	19.7	5.1	0.007	4203	4027	my5744_rel.cz11a_bee
998	3332	0	0.0	105.3	3.6	0.000	0.000	0.105	3.690	14667	14.6	4.402	351	4.3	20.1	5.7	0.007	3292	3117	my8028_rel.cz11a_bee
998	3033	0	0.0	154.6	5.1	0.000	0.000	0.155	5.252	14083	15.0	4.643	396	4.4	20.3	5.9	0.009	2989	2829	my8032_rel.cz11a_bee
998	3764	0	0.0	151.7	5.0	0.000	0.000	0.152	5.170	16754	15.2	4.452	323	4.3	20.2	5.8	0.005	3710	3484	my8036_rel.cz11a_bee
998	3696	0	0.0	150.7	5.0	0.000	0.000	0.151	5.152	16512	15.2	4.468	329	4.4	20.2	5.8	0.008	3660	3436	my8037_rel.cz11a_bee
qp1000.L6
qp1000.L6: point queries with 1000 insert/s per client. Graphs for performance per 1-second interval are here.
Average throughput:
Query response time histogram: each cell has the percentage of responses that take <= the time in the header and max is the max response time in seconds. For max values in the top 25% of the range have a red background and in the bottom 25% of the range have a green background. The red background is not used when the min value is within 80% of the max value.
| dbms | 256us | 1ms | 4ms | 16ms | 64ms | 256ms | 1s | 4s | 16s | gt | max |
|---|---|---|---|---|---|---|---|---|---|---|---|
| my5651_rel.cz11a_bee | 93.545 | 6.340 | 0.113 | 0.002 | 0.013 | ||||||
| my5744_rel.cz11a_bee | 85.758 | 14.229 | 0.012 | nonzero | 0.011 | ||||||
| my8028_rel.cz11a_bee | 16.260 | 83.729 | 0.011 | nonzero | 0.009 | ||||||
| my8032_rel.cz11a_bee | 16.458 | 83.531 | 0.010 | nonzero | 0.007 | ||||||
| my8036_rel.cz11a_bee | 17.333 | 82.657 | 0.009 | nonzero | 0.009 | ||||||
| my8037_rel.cz11a_bee | 15.967 | 84.024 | 0.009 | nonzero | 0.005 |
Insert response time histogram: each cell has the percentage of responses that take <= the time in the header and max is the max response time in seconds. For max values in the top 25% of the range have a red background and in the bottom 25% of the range have a green background. The red background is not used when the min value is within 80% of the max value.
| dbms | 256us | 1ms | 4ms | 16ms | 64ms | 256ms | 1s | 4s | 16s | gt | max |
|---|---|---|---|---|---|---|---|---|---|---|---|
| my5651_rel.cz11a_bee | 86.778 | 13.103 | 0.119 | 0.023 | |||||||
| my5744_rel.cz11a_bee | 99.397 | 0.600 | 0.003 | 0.017 | |||||||
| my8028_rel.cz11a_bee | 99.239 | 0.758 | 0.003 | 0.017 | |||||||
| my8032_rel.cz11a_bee | 96.747 | 3.247 | 0.006 | 0.026 | |||||||
| my8036_rel.cz11a_bee | 97.672 | 2.317 | 0.011 | 0.025 | |||||||
| my8037_rel.cz11a_bee | 97.792 | 2.197 | 0.011 | 0.031 |
Delete response time histogram: each cell has the percentage of responses that take <= the time in the header and max is the max response time in seconds. For max values in the top 25% of the range have a red background and in the bottom 25% of the range have a green background. The red background is not used when the min value is within 80% of the max value.
| dbms | 256us | 1ms | 4ms | 16ms | 64ms | 256ms | 1s | 4s | 16s | gt | max |
|---|---|---|---|---|---|---|---|---|---|---|---|
| my5651_rel.cz11a_bee | 91.397 | 8.508 | 0.094 | 0.023 | |||||||
| my5744_rel.cz11a_bee | 99.692 | 0.308 | 0.012 | ||||||||
| my8028_rel.cz11a_bee | 99.667 | 0.333 | 0.016 | ||||||||
| my8032_rel.cz11a_bee | 99.622 | 0.372 | 0.006 | 0.023 | |||||||
| my8036_rel.cz11a_bee | 99.417 | 0.578 | 0.006 | 0.025 | |||||||
| my8037_rel.cz11a_bee | 99.653 | 0.342 | 0.006 | 0.029 |
Performance metrics for the DBMS listed above. Some are normalized by throughput, others are not. Legend for results is here.
ips	qps	rps	rmbps	wps	wmbps	rpq	rkbpq	wpi	wkbpi	csps	cpups	cspq	cpupq	dbgb1	dbgb2	rss	maxop	p50	p99	tag
998	4621	32	0.1	283.3	9.5	0.007	0.028	0.284	9.741	20333	15.8	4.400	274	4.1	19.6	4.8	0.013	4507	4219	my5651_rel.cz11a_bee
998	3816	0	0.0	82.2	3.3	0.000	0.000	0.082	3.412	16134	15.6	4.228	327	4.1	19.7	5.1	0.011	3724	3500	my5744_rel.cz11a_bee
998	3073	0	0.0	106.0	3.6	0.000	0.000	0.106	3.710	14316	15.2	4.658	396	4.3	20.1	5.7	0.009	2990	2829	my8028_rel.cz11a_bee
998	2880	0	0.0	154.5	5.1	0.000	0.000	0.155	5.246	14092	15.5	4.894	431	4.4	20.3	5.9	0.007	2813	2590	my8032_rel.cz11a_bee
998	2914	0	0.0	151.5	5.0	0.000	0.000	0.152	5.173	14135	15.5	4.850	425	4.3	20.2	5.8	0.009	2813	2605	my8036_rel.cz11a_bee
998	2897	0	0.0	151.6	5.0	0.000	0.000	0.152	5.172	14094	15.4	4.865	425	4.4	20.2	5.8	0.005	2813	2605	my8037_rel.cz11a_bee
l.i0
l.i0: load without secondary indexes
Performance metrics for all DBMS, not just the ones listed above. Some are normalized by throughput, others are not. Legend for results is here.
ips	qps	rps	rmbps	wps	wmbps	rpq	rkbpq	wpi	wkbpi	csps	cpups	cspq	cpupq	dbgb1	dbgb2	rss	maxop	p50	p99	tag
100000	0	876	3.4	276.6	29.6	0.009	0.035	0.003	0.303	11978	22.8	0.120	18	1.3	16.8	1.9	0.087	100387	88598	my5651_rel.cz11a_bee
84388	0	0	0.0	205.6	23.7	0.000	0.000	0.002	0.288	8487	21.5	0.101	20	1.3	16.8	2.3	0.066	84885	75713	my5744_rel.cz11a_bee
64309	0	0	0.0	206.4	19.3	0.000	0.000	0.003	0.307	7039	21.2	0.109	26	1.3	16.9	2.4	0.088	64427	59831	my8028_rel.cz11a_bee
56818	0	0	0.0	205.1	18.0	0.000	0.000	0.004	0.325	6721	21.3	0.118	30	1.3	16.9	2.4	0.084	57235	53438	my8032_rel.cz11a_bee
57143	0	0	0.0	201.7	18.0	0.000	0.000	0.004	0.322	6443	20.9	0.113	29	1.3	16.9	2.4	0.088	57237	54040	my8036_rel.cz11a_bee
57143	0	0	0.0	199.9	17.8	0.000	0.000	0.003	0.318	6453	21.0	0.113	29	1.3	16.9	2.4	0.089	57334	53939	my8037_rel.cz11a_bee
l.x
l.x: create secondary indexes
Performance metrics for all DBMS, not just the ones listed above. Some are normalized by throughput, others are not. Legend for results is here.
ips	qps	rps	rmbps	wps	wmbps	rpq	rkbpq	wpi	wkbpi	csps	cpups	cspq	cpupq	dbgb1	dbgb2	rss	maxop	p50	p99	tag
114943	0	8	0.0	871.0	111.7	0.000	0.000	0.008	0.995	2315	11.7	0.020	8	2.8	18.3	3.0	0.001	NA	NA	my5651_rel.cz11a_bee
152672	0	0	0.0	1554.8	139.0	0.000	0.000	0.010	0.932	9510	11.9	0.062	6	3.0	18.6	3.3	0.001	NA	NA	my5744_rel.cz11a_bee
155040	0	811	51.1	2394.4	162.1	0.005	0.338	0.015	1.070	9470	43.7	0.061	23	3.0	18.6	3.6	0.003	NA	NA	my8028_rel.cz11a_bee
142858	0	750	47.3	2041.3	146.9	0.005	0.339	0.014	1.053	8948	44.1	0.063	25	3.0	18.6	3.1	0.003	NA	NA	my8032_rel.cz11a_bee
138890	0	724	45.6	2242.8	146.5	0.005	0.336	0.016	1.080	9152	43.4	0.066	25	3.0	18.6	3.0	0.003	NA	NA	my8036_rel.cz11a_bee
142858	0	725	45.7	3106.9	160.1	0.005	0.327	0.022	1.147	10776	43.2	0.075	24	3.0	18.6	3.1	0.003	NA	NA	my8037_rel.cz11a_bee
l.i1
l.i1: continue load after secondary indexes created with 50 inserts per transaction
Performance metrics for all DBMS, not just the ones listed above. Some are normalized by throughput, others are not. Legend for results is here.
ips	qps	rps	rmbps	wps	wmbps	rpq	rkbpq	wpi	wkbpi	csps	cpups	cspq	cpupq	dbgb1	dbgb2	rss	maxop	p50	p99	tag
17014	0	503	2.0	1451.6	65.7	0.030	0.118	0.085	3.952	20489	47.1	1.204	221	4.1	19.6	4.8	0.114	18029	5694	my5651_rel.cz11a_bee
19503	0	0	0.0	1642.0	74.5	0.000	0.000	0.084	3.912	16219	53.5	0.832	219	4.1	19.7	5.1	0.081	20377	7042	my5744_rel.cz11a_bee
19503	0	47	0.7	1816.8	70.8	0.002	0.039	0.093	3.718	36617	38.8	1.878	159	4.3	20.1	5.6	0.106	20177	8690	my8028_rel.cz11a_bee
16885	0	41	0.6	1999.9	79.1	0.002	0.039	0.118	4.800	36774	38.6	2.178	183	4.4	20.3	5.8	0.105	17473	7242	my8032_rel.cz11a_bee
17384	0	42	0.7	2075.9	82.2	0.002	0.039	0.119	4.840	36928	38.5	2.124	177	4.3	20.2	5.8	0.105	17980	7192	my8036_rel.cz11a_bee
17391	0	42	0.7	2069.8	81.9	0.002	0.039	0.119	4.824	36954	38.6	2.125	178	4.4	20.2	5.8	0.311	17998	6792	my8037_rel.cz11a_bee
l.i2
l.i2: continue load after secondary indexes created with 5 inserts per transaction
Performance metrics for all DBMS, not just the ones listed above. Some are normalized by throughput, others are not. Legend for results is here.
ips	qps	rps	rmbps	wps	wmbps	rpq	rkbpq	wpi	wkbpi	csps	cpups	cspq	cpupq	dbgb1	dbgb2	rss	maxop	p50	p99	tag
12210	0	2181	8.5	1052.6	45.9	0.179	0.715	0.086	3.851	96316	44.9	7.888	294	4.1	19.6	4.8	0.052	12191	11233	my5651_rel.cz11a_bee
10638	0	0	0.0	965.0	41.5	0.000	0.000	0.091	3.996	44615	42.2	4.194	317	4.1	19.7	5.1	0.056	10638	9884	my5744_rel.cz11a_bee
9524	0	0	0.0	1074.1	38.5	0.000	0.000	0.113	4.141	53515	35.7	5.619	300	4.3	20.1	5.6	0.104	9510	8501	my8028_rel.cz11a_bee
8584	0	0	0.0	1148.5	42.0	0.000	0.000	0.134	5.007	51193	35.9	5.964	335	4.4	20.3	5.9	0.106	8600	7677	my8032_rel.cz11a_bee
8764	0	0	0.0	1170.0	42.8	0.000	0.000	0.133	4.997	51525	35.6	5.879	325	4.3	20.2	5.8	0.108	8784	7821	my8036_rel.cz11a_bee
8696	0	0	0.0	1187.6	43.1	0.000	0.000	0.137	5.075	51409	35.6	5.912	328	4.4	20.2	5.8	0.291	8708	7757	my8037_rel.cz11a_bee
qr100.L1
qr100.L1: range queries with 100 insert/s per client
Performance metrics for all DBMS, not just the ones listed above. Some are normalized by throughput, others are not. Legend for results is here.
ips	qps	rps	rmbps	wps	wmbps	rpq	rkbpq	wpi	wkbpi	csps	cpups	cspq	cpupq	dbgb1	dbgb2	rss	maxop	p50	p99	tag
100	5711	4	0.0	217.3	6.6	0.001	0.003	2.177	67.208	22694	13.2	3.974	185	4.1	19.6	4.8	0.019	5674	5545	my5651_rel.cz11a_bee
100	4259	0	0.0	144.5	4.2	0.000	0.000	1.448	43.507	16907	13.2	3.970	248	4.1	19.7	5.1	0.003	4203	4026	my5744_rel.cz11a_bee
100	3369	0	0.0	146.6	3.7	0.000	0.000	1.469	37.743	13657	12.7	4.054	302	4.3	20.1	5.7	0.004	3340	3164	my8028_rel.cz11a_bee
100	3052	0	0.0	149.5	3.8	0.000	0.000	1.498	38.801	12673	12.8	4.152	336	4.4	20.3	5.9	0.004	3020	2860	my8032_rel.cz11a_bee
100	3665	0	0.0	163.3	4.1	0.000	0.000	1.636	42.302	15040	13.1	4.104	286	4.3	20.2	5.8	0.005	3628	3436	my8036_rel.cz11a_bee
100	3648	0	0.0	139.5	3.5	0.000	0.000	1.398	36.183	14896	13.1	4.084	287	4.4	20.2	5.8	0.005	3612	3420	my8037_rel.cz11a_bee
qp100.L2
qp100.L2: point queries with 100 insert/s per client
Performance metrics for all DBMS, not just the ones listed above. Some are normalized by throughput, others are not. Legend for results is here.
ips	qps	rps	rmbps	wps	wmbps	rpq	rkbpq	wpi	wkbpi	csps	cpups	cspq	cpupq	dbgb1	dbgb2	rss	maxop	p50	p99	tag
100	4601	4	0.0	2.2	0.1	0.001	0.003	0.022	1.182	18710	13.6	4.066	236	4.1	19.6	4.8	0.011	4541	4299	my5651_rel.cz11a_bee
100	3747	0	0.0	26.7	0.7	0.000	0.000	0.267	7.217	15333	13.9	4.092	297	4.1	19.7	5.1	0.005	3692	3500	my5744_rel.cz11a_bee
100	3045	0	0.0	29.9	0.8	0.000	0.000	0.299	7.771	12682	13.4	4.165	352	4.3	20.1	5.7	0.005	2973	2829	my8028_rel.cz11a_bee
100	2829	0	0.0	31.2	0.8	0.000	0.000	0.312	8.397	12035	13.2	4.255	373	4.4	20.3	5.9	0.005	2717	2589	my8032_rel.cz11a_bee
100	2824	0	0.0	29.9	0.8	0.000	0.000	0.300	8.155	12014	13.5	4.254	382	4.3	20.2	5.8	0.004	2749	2621	my8036_rel.cz11a_bee
100	2797	0	0.0	29.7	0.8	0.000	0.000	0.298	8.088	11900	13.4	4.254	383	4.4	20.2	5.8	0.004	2733	2605	my8037_rel.cz11a_bee
qr500.L3
qr500.L3: range queries with 500 insert/s per client
Performance metrics for all DBMS, not just the ones listed above. Some are normalized by throughput, others are not. Legend for results is here.
ips	qps	rps	rmbps	wps	wmbps	rpq	rkbpq	wpi	wkbpi	csps	cpups	cspq	cpupq	dbgb1	dbgb2	rss	maxop	p50	p99	tag
499	5719	16	0.1	7.7	0.7	0.003	0.011	0.015	1.439	22348	14.3	3.908	200	4.1	19.6	4.8	0.010	5658	5529	my5651_rel.cz11a_bee
499	4242	0	0.0	48.0	1.8	0.000	0.000	0.096	3.648	16634	14.1	3.922	266	4.1	19.7	5.1	0.004	4186	4012	my5744_rel.cz11a_bee
499	3367	0	0.0	51.4	1.7	0.000	0.000	0.103	3.538	13899	13.6	4.128	323	4.3	20.1	5.7	0.008	3326	3148	my8028_rel.cz11a_bee
499	3039	0	0.0	65.4	2.2	0.000	0.000	0.131	4.547	12989	13.7	4.274	361	4.4	20.3	5.9	0.007	3005	2861	my8032_rel.cz11a_bee
499	3713	0	0.0	64.5	2.2	0.000	0.000	0.129	4.512	15504	14.2	4.175	306	4.3	20.2	5.8	0.008	3662	3484	my8036_rel.cz11a_bee
499	3643	0	0.0	66.9	2.3	0.000	0.000	0.134	4.651	15254	14.1	4.187	310	4.4	20.2	5.8	0.004	3611	3404	my8037_rel.cz11a_bee
qp500.L4
qp500.L4: point queries with 500 insert/s per client
Performance metrics for all DBMS, not just the ones listed above. Some are normalized by throughput, others are not. Legend for results is here.
ips	qps	rps	rmbps	wps	wmbps	rpq	rkbpq	wpi	wkbpi	csps	cpups	cspq	cpupq	dbgb1	dbgb2	rss	maxop	p50	p99	tag
499	4626	16	0.1	406.9	12.7	0.004	0.014	0.815	26.111	20411	14.7	4.412	254	4.1	19.6	4.8	0.013	4523	4267	my5651_rel.cz11a_bee
499	3802	0	0.0	60.4	2.1	0.000	0.000	0.121	4.398	15768	14.8	4.147	311	4.1	19.7	5.1	0.010	3740	3500	my5744_rel.cz11a_bee
499	3092	0	0.0	59.3	1.9	0.000	0.000	0.119	3.941	13506	14.0	4.369	362	4.3	20.1	5.7	0.008	3005	2828	my8028_rel.cz11a_bee
499	2808	0	0.0	67.7	2.3	0.000	0.000	0.136	4.666	12719	14.4	4.529	410	4.4	20.3	5.9	0.005	2717	2573	my8032_rel.cz11a_bee
499	2843	0	0.0	65.8	2.2	0.000	0.000	0.132	4.576	12777	14.4	4.494	405	4.3	20.2	5.8	0.007	2749	2590	my8036_rel.cz11a_bee
499	2829	0	0.0	68.9	2.3	0.000	0.000	0.138	4.728	12738	14.2	4.503	402	4.4	20.2	5.8	0.005	2749	2589	my8037_rel.cz11a_bee
qr1000.L5
qr1000.L5: range queries with 1000 insert/s per client
Performance metrics for all DBMS, not just the ones listed above. Some are normalized by throughput, others are not. Legend for results is here.
ips	qps	rps	rmbps	wps	wmbps	rpq	rkbpq	wpi	wkbpi	csps	cpups	cspq	cpupq	dbgb1	dbgb2	rss	maxop	p50	p99	tag
998	5862	32	0.1	361.4	11.8	0.005	0.022	0.362	12.154	24367	15.4	4.157	210	4.1	19.6	4.8	0.016	5823	5500	my5651_rel.cz11a_bee
998	4268	0	0.0	84.9	3.4	0.000	0.000	0.085	3.486	17024	15.2	3.989	285	4.1	19.7	5.1	0.007	4203	4027	my5744_rel.cz11a_bee
998	3332	0	0.0	105.3	3.6	0.000	0.000	0.105	3.690	14667	14.6	4.402	351	4.3	20.1	5.7	0.007	3292	3117	my8028_rel.cz11a_bee
998	3033	0	0.0	154.6	5.1	0.000	0.000	0.155	5.252	14083	15.0	4.643	396	4.4	20.3	5.9	0.009	2989	2829	my8032_rel.cz11a_bee
998	3764	0	0.0	151.7	5.0	0.000	0.000	0.152	5.170	16754	15.2	4.452	323	4.3	20.2	5.8	0.005	3710	3484	my8036_rel.cz11a_bee
998	3696	0	0.0	150.7	5.0	0.000	0.000	0.151	5.152	16512	15.2	4.468	329	4.4	20.2	5.8	0.008	3660	3436	my8037_rel.cz11a_bee
qp1000.L6
qp1000.L6: point queries with 1000 insert/s per client
Performance metrics for all DBMS, not just the ones listed above. Some are normalized by throughput, others are not. Legend for results is here.
ips	qps	rps	rmbps	wps	wmbps	rpq	rkbpq	wpi	wkbpi	csps	cpups	cspq	cpupq	dbgb1	dbgb2	rss	maxop	p50	p99	tag
998	4621	32	0.1	283.3	9.5	0.007	0.028	0.284	9.741	20333	15.8	4.400	274	4.1	19.6	4.8	0.013	4507	4219	my5651_rel.cz11a_bee
998	3816	0	0.0	82.2	3.3	0.000	0.000	0.082	3.412	16134	15.6	4.228	327	4.1	19.7	5.1	0.011	3724	3500	my5744_rel.cz11a_bee
998	3073	0	0.0	106.0	3.6	0.000	0.000	0.106	3.710	14316	15.2	4.658	396	4.3	20.1	5.7	0.009	2990	2829	my8028_rel.cz11a_bee
998	2880	0	0.0	154.5	5.1	0.000	0.000	0.155	5.246	14092	15.5	4.894	431	4.4	20.3	5.9	0.007	2813	2590	my8032_rel.cz11a_bee
998	2914	0	0.0	151.5	5.0	0.000	0.000	0.152	5.173	14135	15.5	4.850	425	4.3	20.2	5.8	0.009	2813	2605	my8036_rel.cz11a_bee
998	2897	0	0.0	151.6	5.0	0.000	0.000	0.152	5.172	14094	15.4	4.865	425	4.4	20.2	5.8	0.005	2813	2605	my8037_rel.cz11a_bee
l.i0
- l.i0: load without secondary indexes
- Legend for results is here.
- Each entry lists the percentage of responses that fit in that bucket (slower than max time for previous bucket, faster than min time for next bucket).
Insert response time histogram
256us	1ms	4ms	16ms	64ms	256ms	1s	4s	16s	gt	max	tag
0.000	88.959	10.933	0.106	0.002	0.002	0.000	0.000	0.000	0.000	0.087	my5651_rel.cz11a_bee
0.000	3.368	96.287	0.203	0.142	0.001	0.000	0.000	0.000	0.000	0.066	my5744_rel.cz11a_bee
0.000	0.000	99.461	0.398	0.139	0.002	0.000	0.000	0.000	0.000	0.088	my8028_rel.cz11a_bee
0.000	0.000	99.418	0.441	0.141	0.001	0.000	0.000	0.000	0.000	0.084	my8032_rel.cz11a_bee
0.000	0.000	99.413	0.456	0.132	0.001	0.000	0.000	0.000	0.000	0.088	my8036_rel.cz11a_bee
0.000	0.000	99.413	0.449	0.138	0.001	0.000	0.000	0.000	0.000	0.089	my8037_rel.cz11a_bee
l.x
- l.x: create secondary indexes
- Legend for results is here.
- Each entry lists the percentage of responses that fit in that bucket (slower than max time for previous bucket, faster than min time for next bucket).
TODO - determine whether there is data for create index response time
l.i1
- l.i1: continue load after secondary indexes created with 50 inserts per transaction
- Legend for results is here.
- Each entry lists the percentage of responses that fit in that bucket (slower than max time for previous bucket, faster than min time for next bucket).
Insert response time histogram
256us	1ms	4ms	16ms	64ms	256ms	1s	4s	16s	gt	max	tag
0.000	0.000	93.758	6.083	0.158	nonzero	0.000	0.000	0.000	0.000	0.114	my5651_rel.cz11a_bee
0.000	0.000	95.958	3.964	0.076	0.001	0.000	0.000	0.000	0.000	0.081	my5744_rel.cz11a_bee
0.000	0.000	97.571	2.349	0.076	0.003	0.000	0.000	0.000	0.000	0.106	my8028_rel.cz11a_bee
0.000	0.000	96.550	3.315	0.132	0.003	0.000	0.000	0.000	0.000	0.105	my8032_rel.cz11a_bee
0.000	0.000	96.677	3.199	0.121	0.003	0.000	0.000	0.000	0.000	0.105	my8036_rel.cz11a_bee
0.000	0.000	96.679	3.188	0.130	0.002	0.001	0.000	0.000	0.000	0.311	my8037_rel.cz11a_bee
Delete response time histogram
256us	1ms	4ms	16ms	64ms	256ms	1s	4s	16s	gt	max	tag
0.000	0.000	97.076	2.832	0.091	nonzero	0.000	0.000	0.000	0.000	0.066	my5651_rel.cz11a_bee
0.000	0.000	97.403	2.577	0.018	0.001	0.000	0.000	0.000	0.000	0.081	my5744_rel.cz11a_bee
0.000	0.000	98.256	1.722	0.019	0.003	0.000	0.000	0.000	0.000	0.105	my8028_rel.cz11a_bee
0.000	0.000	97.840	2.107	0.050	0.003	0.000	0.000	0.000	0.000	0.108	my8032_rel.cz11a_bee
0.000	0.000	97.902	2.055	0.040	0.003	0.000	0.000	0.000	0.000	0.105	my8036_rel.cz11a_bee
0.000	0.000	97.893	2.056	0.049	0.001	0.001	0.000	0.000	0.000	0.284	my8037_rel.cz11a_bee
l.i2
- l.i2: continue load after secondary indexes created with 5 inserts per transaction
- Legend for results is here.
- Each entry lists the percentage of responses that fit in that bucket (slower than max time for previous bucket, faster than min time for next bucket).
Insert response time histogram
256us	1ms	4ms	16ms	64ms	256ms	1s	4s	16s	gt	max	tag
10.881	88.836	0.086	0.197	0.001	0.000	0.000	0.000	0.000	0.000	0.052	my5651_rel.cz11a_bee
0.284	98.656	0.826	0.233	0.001	0.000	0.000	0.000	0.000	0.000	0.056	my5744_rel.cz11a_bee
0.000	99.523	0.246	0.230	0.001	0.001	0.000	0.000	0.000	0.000	0.104	my8028_rel.cz11a_bee
0.000	99.377	0.367	0.254	0.001	0.001	0.000	0.000	0.000	0.000	0.106	my8032_rel.cz11a_bee
0.000	99.410	0.340	0.248	0.002	0.001	0.000	0.000	0.000	0.000	0.108	my8036_rel.cz11a_bee
0.000	99.378	0.364	0.255	0.002	nonzero	nonzero	0.000	0.000	0.000	0.291	my8037_rel.cz11a_bee
Delete response time histogram
256us	1ms	4ms	16ms	64ms	256ms	1s	4s	16s	gt	max	tag
15.289	84.450	0.063	0.197	0.001	0.000	0.000	0.000	0.000	0.000	0.051	my5651_rel.cz11a_bee
0.779	98.129	0.860	0.232	0.001	0.000	0.000	0.000	0.000	0.000	0.056	my5744_rel.cz11a_bee
0.000	99.615	0.160	0.223	nonzero	0.001	0.000	0.000	0.000	0.000	0.102	my8028_rel.cz11a_bee
0.000	99.520	0.229	0.249	0.001	0.001	0.000	0.000	0.000	0.000	0.102	my8032_rel.cz11a_bee
0.000	99.563	0.194	0.240	0.002	0.001	0.000	0.000	0.000	0.000	0.102	my8036_rel.cz11a_bee
0.000	99.562	0.189	0.247	0.002	nonzero	nonzero	0.000	0.000	0.000	0.284	my8037_rel.cz11a_bee
qr100.L1
- qr100.L1: range queries with 100 insert/s per client
- Legend for results is here.
- Each entry lists the percentage of responses that fit in that bucket (slower than max time for previous bucket, faster than min time for next bucket).
Query response time histogram
256us	1ms	4ms	16ms	64ms	256ms	1s	4s	16s	gt	max	tag
97.515	2.478	0.003	0.004	nonzero	0.000	0.000	0.000	0.000	0.000	0.019	my5651_rel.cz11a_bee
75.966	24.033	0.001	0.000	0.000	0.000	0.000	0.000	0.000	0.000	0.003	my5744_rel.cz11a_bee
38.514	61.485	0.001	nonzero	0.000	0.000	0.000	0.000	0.000	0.000	0.004	my8028_rel.cz11a_bee
20.761	79.238	0.001	0.000	0.000	0.000	0.000	0.000	0.000	0.000	0.004	my8032_rel.cz11a_bee
60.140	39.859	0.001	nonzero	0.000	0.000	0.000	0.000	0.000	0.000	0.005	my8036_rel.cz11a_bee
59.527	40.472	0.001	nonzero	0.000	0.000	0.000	0.000	0.000	0.000	0.005	my8037_rel.cz11a_bee
Insert response time histogram
256us	1ms	4ms	16ms	64ms	256ms	1s	4s	16s	gt	max	tag
0.000	0.000	47.667	49.972	2.361	0.000	0.000	0.000	0.000	0.000	0.034	my5651_rel.cz11a_bee
0.000	0.000	99.444	0.556	0.000	0.000	0.000	0.000	0.000	0.000	0.012	my5744_rel.cz11a_bee
0.000	0.000	99.722	0.250	0.028	0.000	0.000	0.000	0.000	0.000	0.016	my8028_rel.cz11a_bee
0.000	0.000	99.722	0.250	0.028	0.000	0.000	0.000	0.000	0.000	0.025	my8032_rel.cz11a_bee
0.000	0.000	99.333	0.667	0.000	0.000	0.000	0.000	0.000	0.000	0.014	my8036_rel.cz11a_bee
0.000	0.000	99.611	0.361	0.028	0.000	0.000	0.000	0.000	0.000	0.030	my8037_rel.cz11a_bee
Delete response time histogram
256us	1ms	4ms	16ms	64ms	256ms	1s	4s	16s	gt	max	tag
0.000	0.000	48.139	50.250	1.611	0.000	0.000	0.000	0.000	0.000	0.039	my5651_rel.cz11a_bee
0.000	0.000	99.694	0.306	0.000	0.000	0.000	0.000	0.000	0.000	0.009	my5744_rel.cz11a_bee
0.000	0.000	99.722	0.278	0.000	0.000	0.000	0.000	0.000	0.000	0.015	my8028_rel.cz11a_bee
0.000	0.000	99.806	0.194	0.000	0.000	0.000	0.000	0.000	0.000	0.008	my8032_rel.cz11a_bee
0.000	0.000	99.528	0.472	0.000	0.000	0.000	0.000	0.000	0.000	0.013	my8036_rel.cz11a_bee
0.000	0.000	99.750	0.250	0.000	0.000	0.000	0.000	0.000	0.000	0.008	my8037_rel.cz11a_bee
qp100.L2
- qp100.L2: point queries with 100 insert/s per client
- Legend for results is here.
- Each entry lists the percentage of responses that fit in that bucket (slower than max time for previous bucket, faster than min time for next bucket).
Query response time histogram
256us	1ms	4ms	16ms	64ms	256ms	1s	4s	16s	gt	max	tag
94.855	5.136	0.006	0.003	0.000	0.000	0.000	0.000	0.000	0.000	0.011	my5651_rel.cz11a_bee
85.527	14.467	0.006	nonzero	0.000	0.000	0.000	0.000	0.000	0.000	0.005	my5744_rel.cz11a_bee
11.317	88.681	0.001	nonzero	0.000	0.000	0.000	0.000	0.000	0.000	0.005	my8028_rel.cz11a_bee
12.325	87.673	0.002	nonzero	0.000	0.000	0.000	0.000	0.000	0.000	0.005	my8032_rel.cz11a_bee
8.662	91.337	0.001	nonzero	0.000	0.000	0.000	0.000	0.000	0.000	0.004	my8036_rel.cz11a_bee
6.361	93.638	0.001	nonzero	0.000	0.000	0.000	0.000	0.000	0.000	0.004	my8037_rel.cz11a_bee
Insert response time histogram
256us	1ms	4ms	16ms	64ms	256ms	1s	4s	16s	gt	max	tag
0.000	0.000	52.361	47.167	0.472	0.000	0.000	0.000	0.000	0.000	0.019	my5651_rel.cz11a_bee
0.000	0.000	99.472	0.528	0.000	0.000	0.000	0.000	0.000	0.000	0.010	my5744_rel.cz11a_bee
0.000	0.000	99.778	0.222	0.000	0.000	0.000	0.000	0.000	0.000	0.016	my8028_rel.cz11a_bee
0.000	0.000	99.444	0.556	0.000	0.000	0.000	0.000	0.000	0.000	0.015	my8032_rel.cz11a_bee
0.000	0.000	99.500	0.472	0.028	0.000	0.000	0.000	0.000	0.000	0.024	my8036_rel.cz11a_bee
0.000	0.000	99.500	0.500	0.000	0.000	0.000	0.000	0.000	0.000	0.014	my8037_rel.cz11a_bee
Delete response time histogram
256us	1ms	4ms	16ms	64ms	256ms	1s	4s	16s	gt	max	tag
0.000	0.000	53.944	45.972	0.083	0.000	0.000	0.000	0.000	0.000	0.018	my5651_rel.cz11a_bee
0.000	0.000	99.639	0.361	0.000	0.000	0.000	0.000	0.000	0.000	0.008	my5744_rel.cz11a_bee
0.000	0.000	99.750	0.250	0.000	0.000	0.000	0.000	0.000	0.000	0.008	my8028_rel.cz11a_bee
0.000	0.000	99.639	0.361	0.000	0.000	0.000	0.000	0.000	0.000	0.009	my8032_rel.cz11a_bee
0.000	0.000	99.611	0.361	0.028	0.000	0.000	0.000	0.000	0.000	0.025	my8036_rel.cz11a_bee
0.000	0.000	99.611	0.389	0.000	0.000	0.000	0.000	0.000	0.000	0.009	my8037_rel.cz11a_bee
qr500.L3
- qr500.L3: range queries with 500 insert/s per client
- Legend for results is here.
- Each entry lists the percentage of responses that fit in that bucket (slower than max time for previous bucket, faster than min time for next bucket).
Query response time histogram
256us	1ms	4ms	16ms	64ms	256ms	1s	4s	16s	gt	max	tag
97.369	2.624	0.004	0.004	0.000	0.000	0.000	0.000	0.000	0.000	0.010	my5651_rel.cz11a_bee
75.069	24.930	nonzero	nonzero	0.000	0.000	0.000	0.000	0.000	0.000	0.004	my5744_rel.cz11a_bee
38.349	61.650	0.001	nonzero	0.000	0.000	0.000	0.000	0.000	0.000	0.008	my8028_rel.cz11a_bee
19.510	80.489	0.001	nonzero	0.000	0.000	0.000	0.000	0.000	0.000	0.007	my8032_rel.cz11a_bee
62.652	37.346	0.001	nonzero	0.000	0.000	0.000	0.000	0.000	0.000	0.008	my8036_rel.cz11a_bee
59.002	40.997	0.001	nonzero	0.000	0.000	0.000	0.000	0.000	0.000	0.004	my8037_rel.cz11a_bee
Insert response time histogram
256us	1ms	4ms	16ms	64ms	256ms	1s	4s	16s	gt	max	tag
0.000	0.000	88.711	11.200	0.089	0.000	0.000	0.000	0.000	0.000	0.021	my5651_rel.cz11a_bee
0.000	0.000	99.333	0.667	0.000	0.000	0.000	0.000	0.000	0.000	0.014	my5744_rel.cz11a_bee
0.000	0.000	99.500	0.494	0.006	0.000	0.000	0.000	0.000	0.000	0.016	my8028_rel.cz11a_bee
0.000	0.000	98.683	1.311	0.006	0.000	0.000	0.000	0.000	0.000	0.020	my8032_rel.cz11a_bee
0.000	0.000	99.156	0.828	0.011	0.006	0.000	0.000	0.000	0.000	0.102	my8036_rel.cz11a_bee
0.000	0.000	99.206	0.778	0.017	0.000	0.000	0.000	0.000	0.000	0.029	my8037_rel.cz11a_bee
Delete response time histogram
256us	1ms	4ms	16ms	64ms	256ms	1s	4s	16s	gt	max	tag
0.000	0.000	90.150	9.833	0.017	0.000	0.000	0.000	0.000	0.000	0.017	my5651_rel.cz11a_bee
0.000	0.000	99.550	0.450	0.000	0.000	0.000	0.000	0.000	0.000	0.014	my5744_rel.cz11a_bee
0.000	0.000	99.672	0.328	0.000	0.000	0.000	0.000	0.000	0.000	0.015	my8028_rel.cz11a_bee
0.000	0.000	99.611	0.389	0.000	0.000	0.000	0.000	0.000	0.000	0.014	my8032_rel.cz11a_bee
0.000	0.000	99.583	0.400	0.011	0.006	0.000	0.000	0.000	0.000	0.103	my8036_rel.cz11a_bee
0.000	0.000	99.706	0.283	0.011	0.000	0.000	0.000	0.000	0.000	0.029	my8037_rel.cz11a_bee
qp500.L4
- qp500.L4: point queries with 500 insert/s per client
- Legend for results is here.
- Each entry lists the percentage of responses that fit in that bucket (slower than max time for previous bucket, faster than min time for next bucket).
Query response time histogram
256us	1ms	4ms	16ms	64ms	256ms	1s	4s	16s	gt	max	tag
94.184	5.788	0.026	0.002	0.000	0.000	0.000	0.000	0.000	0.000	0.013	my5651_rel.cz11a_bee
86.101	13.889	0.010	0.001	0.000	0.000	0.000	0.000	0.000	0.000	0.010	my5744_rel.cz11a_bee
17.282	82.712	0.006	nonzero	0.000	0.000	0.000	0.000	0.000	0.000	0.008	my8028_rel.cz11a_bee
9.972	90.023	0.005	nonzero	0.000	0.000	0.000	0.000	0.000	0.000	0.005	my8032_rel.cz11a_bee
11.368	88.626	0.005	nonzero	0.000	0.000	0.000	0.000	0.000	0.000	0.007	my8036_rel.cz11a_bee
10.446	89.550	0.004	nonzero	0.000	0.000	0.000	0.000	0.000	0.000	0.005	my8037_rel.cz11a_bee
Insert response time histogram
256us	1ms	4ms	16ms	64ms	256ms	1s	4s	16s	gt	max	tag
0.000	0.000	86.472	13.344	0.183	0.000	0.000	0.000	0.000	0.000	0.033	my5651_rel.cz11a_bee
0.000	0.000	99.417	0.583	0.000	0.000	0.000	0.000	0.000	0.000	0.011	my5744_rel.cz11a_bee
0.000	0.000	99.483	0.517	0.000	0.000	0.000	0.000	0.000	0.000	0.015	my8028_rel.cz11a_bee
0.000	0.000	98.456	1.533	0.006	0.006	0.000	0.000	0.000	0.000	0.104	my8032_rel.cz11a_bee
0.000	0.000	99.228	0.761	0.011	0.000	0.000	0.000	0.000	0.000	0.026	my8036_rel.cz11a_bee
0.000	0.000	98.917	1.078	0.006	0.000	0.000	0.000	0.000	0.000	0.030	my8037_rel.cz11a_bee
Delete response time histogram
256us	1ms	4ms	16ms	64ms	256ms	1s	4s	16s	gt	max	tag
0.000	0.000	89.594	10.294	0.111	0.000	0.000	0.000	0.000	0.000	0.039	my5651_rel.cz11a_bee
0.000	0.000	99.639	0.361	0.000	0.000	0.000	0.000	0.000	0.000	0.011	my5744_rel.cz11a_bee
0.000	0.000	99.650	0.350	0.000	0.000	0.000	0.000	0.000	0.000	0.016	my8028_rel.cz11a_bee
0.000	0.000	99.583	0.411	0.000	0.006	0.000	0.000	0.000	0.000	0.103	my8032_rel.cz11a_bee
0.000	0.000	99.711	0.283	0.006	0.000	0.000	0.000	0.000	0.000	0.028	my8036_rel.cz11a_bee
0.000	0.000	99.633	0.361	0.006	0.000	0.000	0.000	0.000	0.000	0.030	my8037_rel.cz11a_bee
qr1000.L5
- qr1000.L5: range queries with 1000 insert/s per client
- Legend for results is here.
- Each entry lists the percentage of responses that fit in that bucket (slower than max time for previous bucket, faster than min time for next bucket).
Query response time histogram
256us	1ms	4ms	16ms	64ms	256ms	1s	4s	16s	gt	max	tag
97.314	2.669	0.014	0.003	nonzero	0.000	0.000	0.000	0.000	0.000	0.016	my5651_rel.cz11a_bee
75.700	24.298	0.002	nonzero	0.000	0.000	0.000	0.000	0.000	0.000	0.007	my5744_rel.cz11a_bee
37.045	62.952	0.003	nonzero	0.000	0.000	0.000	0.000	0.000	0.000	0.007	my8028_rel.cz11a_bee
19.321	80.675	0.003	nonzero	0.000	0.000	0.000	0.000	0.000	0.000	0.009	my8032_rel.cz11a_bee
64.098	35.899	0.003	nonzero	0.000	0.000	0.000	0.000	0.000	0.000	0.005	my8036_rel.cz11a_bee
61.596	38.402	0.002	nonzero	0.000	0.000	0.000	0.000	0.000	0.000	0.008	my8037_rel.cz11a_bee
Insert response time histogram
256us	1ms	4ms	16ms	64ms	256ms	1s	4s	16s	gt	max	tag
0.000	0.000	88.461	11.392	0.147	0.000	0.000	0.000	0.000	0.000	0.026	my5651_rel.cz11a_bee
0.000	0.000	99.506	0.494	0.000	0.000	0.000	0.000	0.000	0.000	0.011	my5744_rel.cz11a_bee
0.000	0.000	99.444	0.550	0.006	0.000	0.000	0.000	0.000	0.000	0.016	my8028_rel.cz11a_bee
0.000	0.000	96.717	3.272	0.011	0.000	0.000	0.000	0.000	0.000	0.026	my8032_rel.cz11a_bee
0.000	0.000	98.036	1.953	0.011	0.000	0.000	0.000	0.000	0.000	0.025	my8036_rel.cz11a_bee
0.000	0.000	98.122	1.864	0.008	0.003	0.003	0.000	0.000	0.000	0.275	my8037_rel.cz11a_bee
Delete response time histogram
256us	1ms	4ms	16ms	64ms	256ms	1s	4s	16s	gt	max	tag
0.000	0.000	92.675	7.233	0.092	0.000	0.000	0.000	0.000	0.000	0.025	my5651_rel.cz11a_bee
0.000	0.000	99.708	0.292	0.000	0.000	0.000	0.000	0.000	0.000	0.012	my5744_rel.cz11a_bee
0.000	0.000	99.728	0.272	0.000	0.000	0.000	0.000	0.000	0.000	0.016	my8028_rel.cz11a_bee
0.000	0.000	99.650	0.342	0.008	0.000	0.000	0.000	0.000	0.000	0.025	my8032_rel.cz11a_bee
0.000	0.000	99.539	0.453	0.008	0.000	0.000	0.000	0.000	0.000	0.025	my8036_rel.cz11a_bee
0.000	0.000	99.728	0.256	0.011	0.003	0.003	0.000	0.000	0.000	0.275	my8037_rel.cz11a_bee
qp1000.L6
- qp1000.L6: point queries with 1000 insert/s per client
- Legend for results is here.
- Each entry lists the percentage of responses that fit in that bucket (slower than max time for previous bucket, faster than min time for next bucket).
Query response time histogram
256us	1ms	4ms	16ms	64ms	256ms	1s	4s	16s	gt	max	tag
93.545	6.340	0.113	0.002	0.000	0.000	0.000	0.000	0.000	0.000	0.013	my5651_rel.cz11a_bee
85.758	14.229	0.012	nonzero	0.000	0.000	0.000	0.000	0.000	0.000	0.011	my5744_rel.cz11a_bee
16.260	83.729	0.011	nonzero	0.000	0.000	0.000	0.000	0.000	0.000	0.009	my8028_rel.cz11a_bee
16.458	83.531	0.010	nonzero	0.000	0.000	0.000	0.000	0.000	0.000	0.007	my8032_rel.cz11a_bee
17.333	82.657	0.009	nonzero	0.000	0.000	0.000	0.000	0.000	0.000	0.009	my8036_rel.cz11a_bee
15.967	84.024	0.009	nonzero	0.000	0.000	0.000	0.000	0.000	0.000	0.005	my8037_rel.cz11a_bee
Insert response time histogram
256us	1ms	4ms	16ms	64ms	256ms	1s	4s	16s	gt	max	tag
0.000	0.000	86.778	13.103	0.119	0.000	0.000	0.000	0.000	0.000	0.023	my5651_rel.cz11a_bee
0.000	0.000	99.397	0.600	0.003	0.000	0.000	0.000	0.000	0.000	0.017	my5744_rel.cz11a_bee
0.000	0.000	99.239	0.758	0.003	0.000	0.000	0.000	0.000	0.000	0.017	my8028_rel.cz11a_bee
0.000	0.000	96.747	3.247	0.006	0.000	0.000	0.000	0.000	0.000	0.026	my8032_rel.cz11a_bee
0.000	0.000	97.672	2.317	0.011	0.000	0.000	0.000	0.000	0.000	0.025	my8036_rel.cz11a_bee
0.000	0.000	97.792	2.197	0.011	0.000	0.000	0.000	0.000	0.000	0.031	my8037_rel.cz11a_bee
Delete response time histogram
256us	1ms	4ms	16ms	64ms	256ms	1s	4s	16s	gt	max	tag
0.000	0.000	91.397	8.508	0.094	0.000	0.000	0.000	0.000	0.000	0.023	my5651_rel.cz11a_bee
0.000	0.000	99.692	0.308	0.000	0.000	0.000	0.000	0.000	0.000	0.012	my5744_rel.cz11a_bee
0.000	0.000	99.667	0.333	0.000	0.000	0.000	0.000	0.000	0.000	0.016	my8028_rel.cz11a_bee
0.000	0.000	99.622	0.372	0.006	0.000	0.000	0.000	0.000	0.000	0.023	my8032_rel.cz11a_bee
0.000	0.000	99.417	0.578	0.006	0.000	0.000	0.000	0.000	0.000	0.025	my8036_rel.cz11a_bee
0.000	0.000	99.653	0.342	0.006	0.000	0.000	0.000	0.000	0.000	0.029	my8037_rel.cz11a_bee