Introduction
This is a report for the insert benchmark with 50M docs and 1 client(s). It is generated by scripts (bash, awk, sed) and Tufte might not be impressed. An overview of the insert benchmark is here and a short update is here. Below, by DBMS, I mean DBMS+version.config. An example is my8020.c10b40 where my means MySQL, 8020 is version 8.0.20 and c10b40 is the name for the configuration file.
The test server has 8 AMD cores, 32G RAM and an NVMe SSD. It is described here as the ASUS PN53. The benchmark was run with 1 client and there were 1 or 3 connections per client (1 for queries or inserts without rate limits, 1+1 for rate limited inserts+deletes). It uses 1 table. It loads 50M rows per table without secondary indexes, creates 3 secondary indexes per table, then inserts 40m+10m rows per table with a delete per insert to avoid growing the table. It then does 6 read+write tests for 1800s each that do queries as fast as possible with 100,100,500,500,1000,1000 inserts/s and the same for deletes/s per client concurrent with the queries. The database is cached in memory. Clients and the DBMS share one server. The per-database configs are in the per-database subdirectories here.
The tested DBMS are:
- pg17beta1_def.cx9a2_c8r32 - Postgres 17beta1 with the cx9a2_c8r32 config
- pg17beta1_def_hack10.cx9a2_c8r32 - Postgres 17beta1 with the cx9a2_c8r32 config and a patch with VISITED_PAGES_LIMIT=10 for get_actual_value_range
- pg17beta1_def_hack100.cx9a2_c8r32 - Postgres 17beta1 with the cx9a2_c8r32 config and a patch with VISITED_PAGES_LIMIT=100 for get_actual_value_range
Contents
- Summary
- l.i0: load without secondary indexes
- l.x: create secondary indexes
- l.i1: continue load after secondary indexes created with 50 inserts per transaction
- l.i2: continue load after secondary indexes created with 5 inserts per transaction
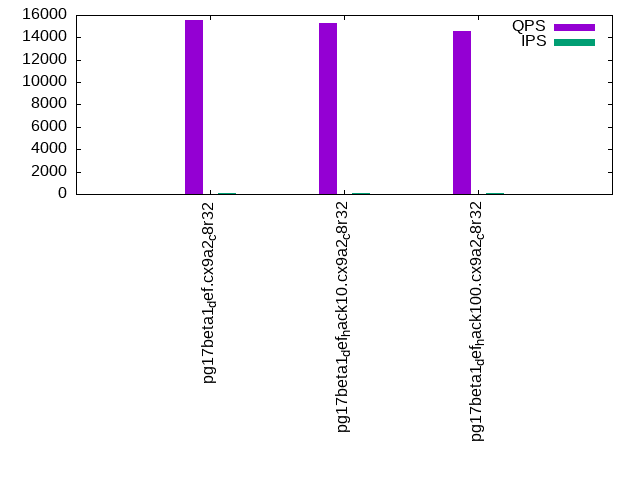
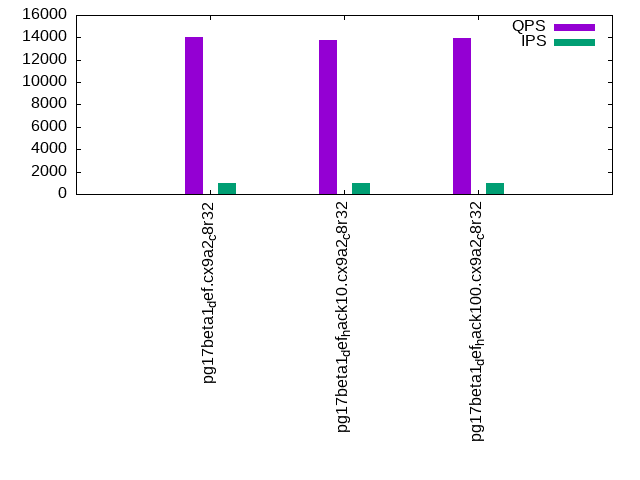
- qr100.L1: range queries with 100 insert/s per client
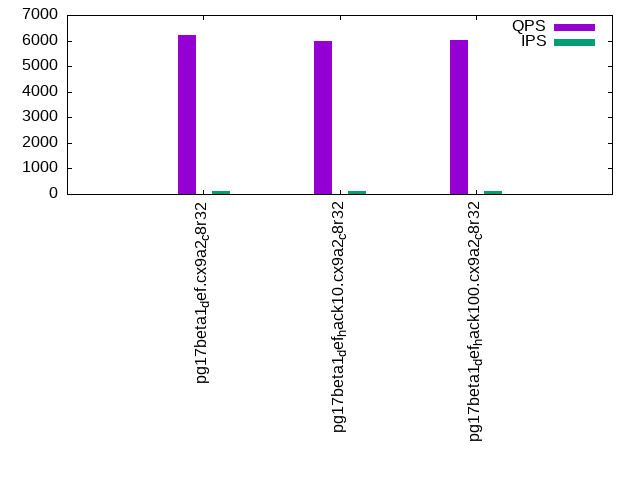
- qp100.L2: point queries with 100 insert/s per client
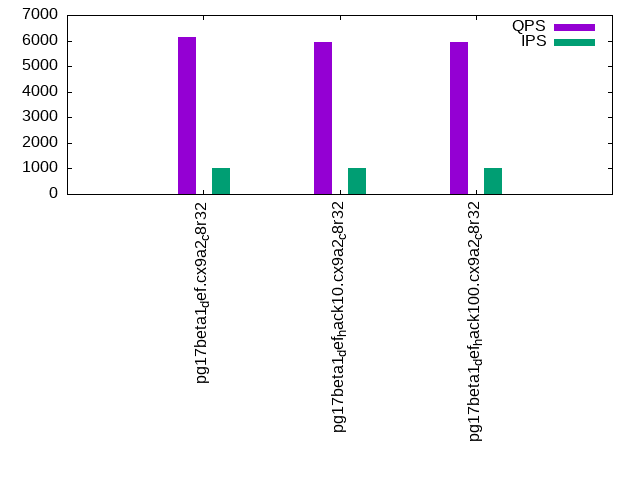
- qr500.L3: range queries with 500 insert/s per client
- qp500.L4: point queries with 500 insert/s per client
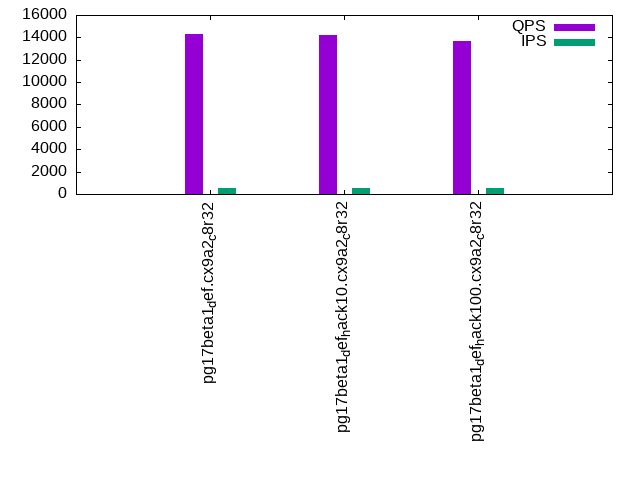
- qr1000.L5: range queries with 1000 insert/s per client
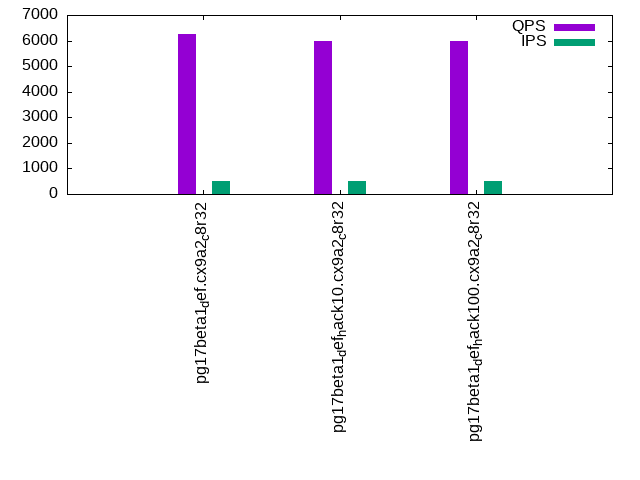
- qp1000.L6: point queries with 1000 insert/s per client
Summary
The numbers are inserts/s for l.i0, l.i1 and l.i2, indexed docs (or rows) /s for l.x and queries/s for qr100, qp100 thru qr1000, qp1000" The values are the average rate over the entire test for inserts (IPS) and queries (QPS). The range of values for IPS and QPS is split into 3 parts: bottom 25%, middle 50%, top 25%. Values in the bottom 25% have a red background, values in the top 25% have a green background and values in the middle have no color. A gray background is used for values that can be ignored because the DBMS did not sustain the target insert rate. Red backgrounds are not used when the minimum value is within 80% of the max value.
| dbms | l.i0 | l.x | l.i1 | l.i2 | qr100 | qp100 | qr500 | qp500 | qr1000 | qp1000 |
|---|---|---|---|---|---|---|---|---|---|---|
| pg17beta1_def.cx9a2_c8r32 | 154799 | 381680 | 11182 | 1286 | 15516 | 6220 | 14272 | 6258 | 14016 | 6149 |
| pg17beta1_def_hack10.cx9a2_c8r32 | 148368 | 384616 | 49322 | 22573 | 15250 | 5996 | 14191 | 5968 | 13737 | 5934 |
| pg17beta1_def_hack100.cx9a2_c8r32 | 148810 | 384616 | 49383 | 17513 | 14552 | 6013 | 13679 | 5966 | 13932 | 5939 |
This table has relative throughput, throughput for the DBMS relative to the DBMS in the first line, using the absolute throughput from the previous table. Values less than 0.95 have a yellow background. Values greater than 1.05 have a blue background.
| dbms | l.i0 | l.x | l.i1 | l.i2 | qr100 | qp100 | qr500 | qp500 | qr1000 | qp1000 |
|---|---|---|---|---|---|---|---|---|---|---|
| pg17beta1_def.cx9a2_c8r32 | 1.00 | 1.00 | 1.00 | 1.00 | 1.00 | 1.00 | 1.00 | 1.00 | 1.00 | 1.00 |
| pg17beta1_def_hack10.cx9a2_c8r32 | 0.96 | 1.01 | 4.41 | 17.55 | 0.98 | 0.96 | 0.99 | 0.95 | 0.98 | 0.97 |
| pg17beta1_def_hack100.cx9a2_c8r32 | 0.96 | 1.01 | 4.42 | 13.62 | 0.94 | 0.97 | 0.96 | 0.95 | 0.99 | 0.97 |
This lists the average rate of inserts/s for the tests that do inserts concurrent with queries. For such tests the query rate is listed in the table above. The read+write tests are setup so that the insert rate should match the target rate every second. Cells that are not at least 95% of the target have a red background to indicate a failure to satisfy the target.
| dbms | qr100.L1 | qp100.L2 | qr500.L3 | qp500.L4 | qr1000.L5 | qp1000.L6 |
|---|---|---|---|---|---|---|
| pg17beta1_def.cx9a2_c8r32 | 100 | 100 | 499 | 499 | 999 | 999 |
| pg17beta1_def_hack10.cx9a2_c8r32 | 100 | 100 | 499 | 499 | 999 | 999 |
| pg17beta1_def_hack100.cx9a2_c8r32 | 100 | 100 | 499 | 499 | 999 | 999 |
| target | 100 | 100 | 500 | 500 | 1000 | 1000 |
l.i0
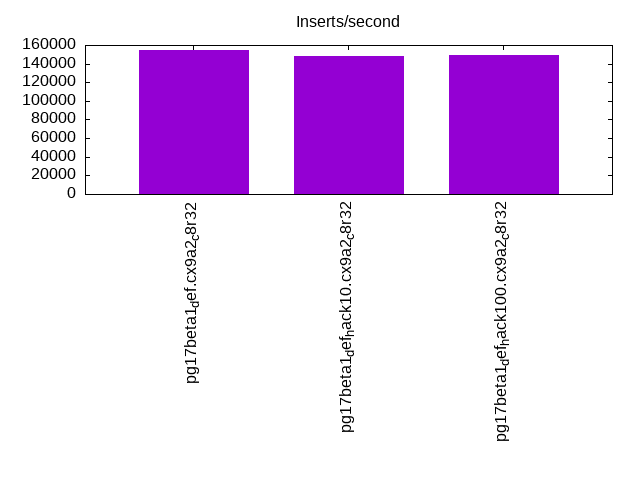
l.i0: load without secondary indexes. Graphs for performance per 1-second interval are here.
Average throughput:
Insert response time histogram: each cell has the percentage of responses that take <= the time in the header and max is the max response time in seconds. For the max column values in the top 25% of the range have a red background and in the bottom 25% of the range have a green background. The red background is not used when the min value is within 80% of the max value.
| dbms | 256us | 1ms | 4ms | 16ms | 64ms | 256ms | 1s | 4s | 16s | gt | max |
|---|---|---|---|---|---|---|---|---|---|---|---|
| pg17beta1_def.cx9a2_c8r32 | 99.924 | 0.076 | 0.002 | ||||||||
| pg17beta1_def_hack10.cx9a2_c8r32 | 99.920 | 0.080 | nonzero | 0.005 | |||||||
| pg17beta1_def_hack100.cx9a2_c8r32 | 99.919 | 0.081 | 0.002 |
Performance metrics for the DBMS listed above. Some are normalized by throughput, others are not. Legend for results is here.
ips	qps	rps	rmbps	wps	wmbps	rpq	rkbpq	wpi	wkbpi	csps	cpups	cspq	cpupq	dbgb1	dbgb2	rss	maxop	p50	p99	tag
154799	0	0	0.0	571.0	65.5	0.000	0.000	0.004	0.433	16548	21.4	0.107	11	4.8	13.0	0.4	0.002	154733	153534	pg17beta1_def.cx9a2_c8r32
148368	0	0	0.0	556.5	63.9	0.000	0.000	0.004	0.441	16024	21.3	0.108	11	4.8	13.0	0.4	0.005	148537	142456	pg17beta1_def_hack10.cx9a2_c8r32
148810	0	0	0.0	557.6	64.0	0.000	0.000	0.004	0.441	16036	21.5	0.108	12	4.8	13.0	0.4	0.002	149787	142742	pg17beta1_def_hack100.cx9a2_c8r32
l.x
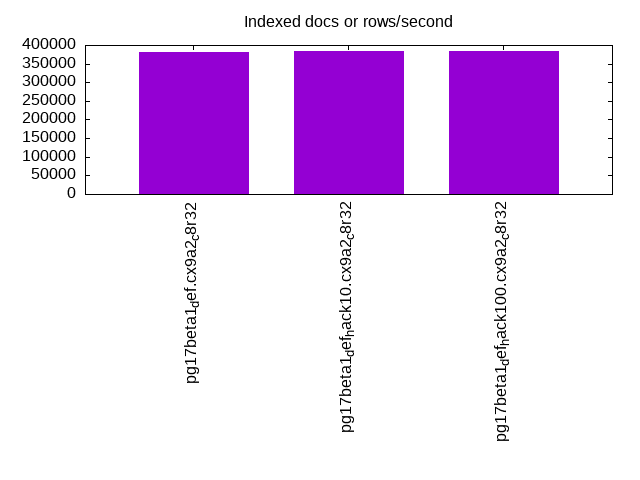
l.x: create secondary indexes.
Average throughput:
Performance metrics for the DBMS listed above. Some are normalized by throughput, others are not. Legend for results is here.
ips	qps	rps	rmbps	wps	wmbps	rpq	rkbpq	wpi	wkbpi	csps	cpups	cspq	cpupq	dbgb1	dbgb2	rss	maxop	p50	p99	tag
381680	0	0	0.0	936.5	115.8	0.000	0.000	0.002	0.311	680	11.7	0.002	2	9.6	22.1	5.0	0.002	NA	NA	pg17beta1_def.cx9a2_c8r32
384616	0	0	0.0	956.3	117.9	0.000	0.000	0.002	0.314	600	11.4	0.002	2	9.6	22.1	5.0	0.002	NA	NA	pg17beta1_def_hack10.cx9a2_c8r32
384616	0	0	0.0	950.6	117.5	0.000	0.000	0.002	0.313	681	11.5	0.002	2	9.6	22.1	5.0	0.002	NA	NA	pg17beta1_def_hack100.cx9a2_c8r32
l.i1
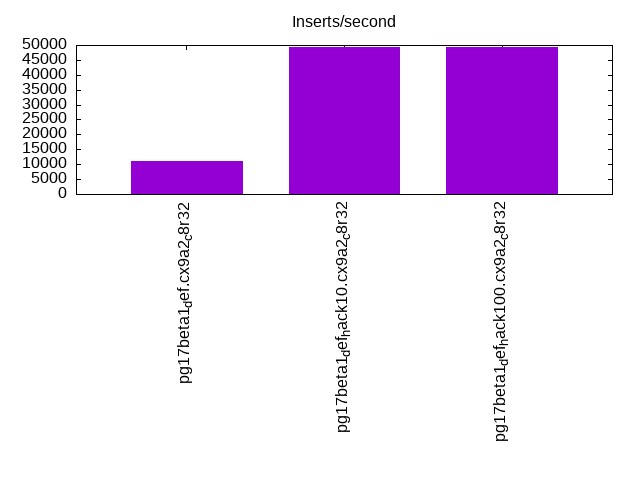
l.i1: continue load after secondary indexes created with 50 inserts per transaction. Graphs for performance per 1-second interval are here.
Average throughput:
Insert response time histogram: each cell has the percentage of responses that take <= the time in the header and max is the max response time in seconds. For the max column values in the top 25% of the range have a red background and in the bottom 25% of the range have a green background. The red background is not used when the min value is within 80% of the max value.
| dbms | 256us | 1ms | 4ms | 16ms | 64ms | 256ms | 1s | 4s | 16s | gt | max |
|---|---|---|---|---|---|---|---|---|---|---|---|
| pg17beta1_def.cx9a2_c8r32 | 28.062 | 71.936 | 0.001 | 0.001 | 0.029 | ||||||
| pg17beta1_def_hack10.cx9a2_c8r32 | 70.828 | 29.156 | 0.009 | 0.007 | 0.036 | ||||||
| pg17beta1_def_hack100.cx9a2_c8r32 | 70.801 | 29.185 | 0.008 | 0.006 | 0.032 |
Delete response time histogram: each cell has the percentage of responses that take <= the time in the header and max is the max response time in seconds. For the max column values in the top 25% of the range have a red background and in the bottom 25% of the range have a green background. The red background is not used when the min value is within 80% of the max value.
| dbms | 256us | 1ms | 4ms | 16ms | 64ms | 256ms | 1s | 4s | 16s | gt | max |
|---|---|---|---|---|---|---|---|---|---|---|---|
| pg17beta1_def.cx9a2_c8r32 | 11.229 | 45.669 | 43.100 | 0.001 | 0.031 | ||||||
| pg17beta1_def_hack10.cx9a2_c8r32 | 99.974 | 0.017 | 0.005 | 0.003 | 0.062 | ||||||
| pg17beta1_def_hack100.cx9a2_c8r32 | 99.932 | 0.061 | 0.005 | 0.003 | 0.024 |
Performance metrics for the DBMS listed above. Some are normalized by throughput, others are not. Legend for results is here.
ips	qps	rps	rmbps	wps	wmbps	rpq	rkbpq	wpi	wkbpi	csps	cpups	cspq	cpupq	dbgb1	dbgb2	rss	maxop	p50	p99	tag
11182	0	0	0.0	171.0	18.8	0.000	0.000	0.015	1.724	5203	17.7	0.465	127	12.2	45.8	8.5	0.029	7742	3496	pg17beta1_def.cx9a2_c8r32
49322	0	0	0.0	724.1	81.6	0.000	0.000	0.015	1.695	22259	22.7	0.451	37	12.4	50.5	11.0	0.036	49896	32813	pg17beta1_def_hack10.cx9a2_c8r32
49383	0	0	0.0	719.0	81.1	0.000	0.000	0.015	1.682	22269	23.4	0.451	38	12.4	50.3	1.2	0.032	49796	35562	pg17beta1_def_hack100.cx9a2_c8r32
l.i2
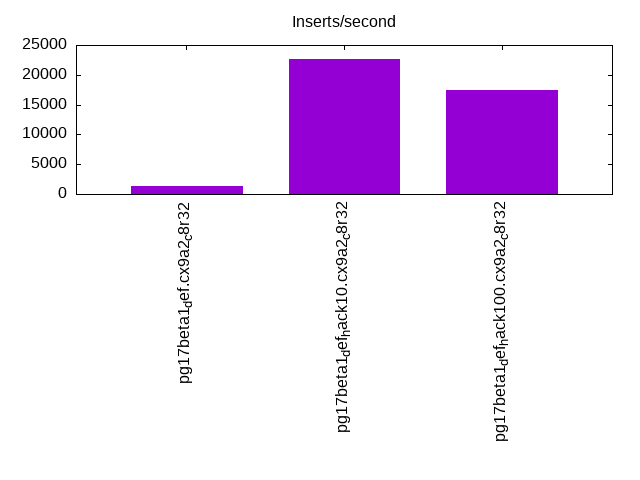
l.i2: continue load after secondary indexes created with 5 inserts per transaction. Graphs for performance per 1-second interval are here.
Average throughput:
Insert response time histogram: each cell has the percentage of responses that take <= the time in the header and max is the max response time in seconds. For the max column values in the top 25% of the range have a red background and in the bottom 25% of the range have a green background. The red background is not used when the min value is within 80% of the max value.
| dbms | 256us | 1ms | 4ms | 16ms | 64ms | 256ms | 1s | 4s | 16s | gt | max |
|---|---|---|---|---|---|---|---|---|---|---|---|
| pg17beta1_def.cx9a2_c8r32 | 29.143 | 70.857 | nonzero | 0.002 | |||||||
| pg17beta1_def_hack10.cx9a2_c8r32 | 98.941 | 1.059 | nonzero | nonzero | 0.007 | ||||||
| pg17beta1_def_hack100.cx9a2_c8r32 | 98.975 | 1.022 | 0.003 | nonzero | 0.007 |
Delete response time histogram: each cell has the percentage of responses that take <= the time in the header and max is the max response time in seconds. For the max column values in the top 25% of the range have a red background and in the bottom 25% of the range have a green background. The red background is not used when the min value is within 80% of the max value.
| dbms | 256us | 1ms | 4ms | 16ms | 64ms | 256ms | 1s | 4s | 16s | gt | max |
|---|---|---|---|---|---|---|---|---|---|---|---|
| pg17beta1_def.cx9a2_c8r32 | 0.983 | 16.375 | 25.948 | 56.694 | nonzero | 0.020 | |||||
| pg17beta1_def_hack10.cx9a2_c8r32 | 99.035 | 0.962 | 0.004 | nonzero | 0.006 | ||||||
| pg17beta1_def_hack100.cx9a2_c8r32 | 77.174 | 22.819 | 0.006 | nonzero | 0.007 |
Performance metrics for the DBMS listed above. Some are normalized by throughput, others are not. Legend for results is here.
ips	qps	rps	rmbps	wps	wmbps	rpq	rkbpq	wpi	wkbpi	csps	cpups	cspq	cpupq	dbgb1	dbgb2	rss	maxop	p50	p99	tag
1286	0	0	0.0	56.3	5.3	0.000	0.000	0.044	4.235	5338	14.0	4.151	871	12.6	45.9	0.4	0.002	884	579	pg17beta1_def.cx9a2_c8r32
22573	0	0	0.0	319.5	34.9	0.000	0.000	0.014	1.582	87526	27.1	3.877	96	12.8	52.9	11.5	0.007	22576	21107	pg17beta1_def_hack10.cx9a2_c8r32
17513	0	0	0.0	242.2	27.0	0.000	0.000	0.014	1.580	69146	24.5	3.948	112	12.8	52.8	8.3	0.007	18025	14984	pg17beta1_def_hack100.cx9a2_c8r32
qr100.L1
qr100.L1: range queries with 100 insert/s per client. Graphs for performance per 1-second interval are here.
Average throughput:
Query response time histogram: each cell has the percentage of responses that take <= the time in the header and max is the max response time in seconds. For max values in the top 25% of the range have a red background and in the bottom 25% of the range have a green background. The red background is not used when the min value is within 80% of the max value.
| dbms | 256us | 1ms | 4ms | 16ms | 64ms | 256ms | 1s | 4s | 16s | gt | max |
|---|---|---|---|---|---|---|---|---|---|---|---|
| pg17beta1_def.cx9a2_c8r32 | 100.000 | nonzero | nonzero | 0.004 | |||||||
| pg17beta1_def_hack10.cx9a2_c8r32 | 99.999 | 0.001 | nonzero | 0.001 | |||||||
| pg17beta1_def_hack100.cx9a2_c8r32 | 99.997 | 0.003 | nonzero | nonzero | 0.004 |
Insert response time histogram: each cell has the percentage of responses that take <= the time in the header and max is the max response time in seconds. For max values in the top 25% of the range have a red background and in the bottom 25% of the range have a green background. The red background is not used when the min value is within 80% of the max value.
| dbms | 256us | 1ms | 4ms | 16ms | 64ms | 256ms | 1s | 4s | 16s | gt | max |
|---|---|---|---|---|---|---|---|---|---|---|---|
| pg17beta1_def.cx9a2_c8r32 | 99.944 | 0.056 | 0.006 | ||||||||
| pg17beta1_def_hack10.cx9a2_c8r32 | 99.944 | 0.056 | 0.006 | ||||||||
| pg17beta1_def_hack100.cx9a2_c8r32 | 99.944 | 0.056 | 0.006 |
Delete response time histogram: each cell has the percentage of responses that take <= the time in the header and max is the max response time in seconds. For max values in the top 25% of the range have a red background and in the bottom 25% of the range have a green background. The red background is not used when the min value is within 80% of the max value.
| dbms | 256us | 1ms | 4ms | 16ms | 64ms | 256ms | 1s | 4s | 16s | gt | max |
|---|---|---|---|---|---|---|---|---|---|---|---|
| pg17beta1_def.cx9a2_c8r32 | 51.250 | 48.750 | 0.002 | ||||||||
| pg17beta1_def_hack10.cx9a2_c8r32 | 97.167 | 2.833 | 0.002 | ||||||||
| pg17beta1_def_hack100.cx9a2_c8r32 | 71.306 | 28.694 | 0.003 |
Performance metrics for the DBMS listed above. Some are normalized by throughput, others are not. Legend for results is here.
ips	qps	rps	rmbps	wps	wmbps	rpq	rkbpq	wpi	wkbpi	csps	cpups	cspq	cpupq	dbgb1	dbgb2	rss	maxop	p50	p99	tag
100	15516	0	0.0	15.2	1.0	0.000	0.000	0.152	9.748	59337	12.7	3.824	65	12.7	41.2	0.3	0.004	15519	15311	pg17beta1_def.cx9a2_c8r32
100	15250	0	0.0	14.5	0.9	0.000	0.000	0.146	9.517	58298	10.8	3.823	57	12.8	52.9	0.3	0.001	15326	14368	pg17beta1_def_hack10.cx9a2_c8r32
100	14552	0	0.0	14.9	0.9	0.000	0.000	0.150	9.726	55632	10.7	3.823	59	12.8	52.8	0.3	0.004	14544	14192	pg17beta1_def_hack100.cx9a2_c8r32
qp100.L2
qp100.L2: point queries with 100 insert/s per client. Graphs for performance per 1-second interval are here.
Average throughput:
Query response time histogram: each cell has the percentage of responses that take <= the time in the header and max is the max response time in seconds. For max values in the top 25% of the range have a red background and in the bottom 25% of the range have a green background. The red background is not used when the min value is within 80% of the max value.
| dbms | 256us | 1ms | 4ms | 16ms | 64ms | 256ms | 1s | 4s | 16s | gt | max |
|---|---|---|---|---|---|---|---|---|---|---|---|
| pg17beta1_def.cx9a2_c8r32 | 99.984 | 0.016 | nonzero | 0.002 | |||||||
| pg17beta1_def_hack10.cx9a2_c8r32 | 97.448 | 2.552 | nonzero | 0.002 | |||||||
| pg17beta1_def_hack100.cx9a2_c8r32 | 98.019 | 1.981 | nonzero | 0.001 |
Insert response time histogram: each cell has the percentage of responses that take <= the time in the header and max is the max response time in seconds. For max values in the top 25% of the range have a red background and in the bottom 25% of the range have a green background. The red background is not used when the min value is within 80% of the max value.
| dbms | 256us | 1ms | 4ms | 16ms | 64ms | 256ms | 1s | 4s | 16s | gt | max |
|---|---|---|---|---|---|---|---|---|---|---|---|
| pg17beta1_def.cx9a2_c8r32 | 99.944 | 0.056 | 0.006 | ||||||||
| pg17beta1_def_hack10.cx9a2_c8r32 | 99.972 | 0.028 | 0.006 | ||||||||
| pg17beta1_def_hack100.cx9a2_c8r32 | 99.944 | 0.056 | 0.006 |
Delete response time histogram: each cell has the percentage of responses that take <= the time in the header and max is the max response time in seconds. For max values in the top 25% of the range have a red background and in the bottom 25% of the range have a green background. The red background is not used when the min value is within 80% of the max value.
| dbms | 256us | 1ms | 4ms | 16ms | 64ms | 256ms | 1s | 4s | 16s | gt | max |
|---|---|---|---|---|---|---|---|---|---|---|---|
| pg17beta1_def.cx9a2_c8r32 | 99.972 | 0.028 | 0.007 | ||||||||
| pg17beta1_def_hack10.cx9a2_c8r32 | 98.694 | 1.306 | 0.002 | ||||||||
| pg17beta1_def_hack100.cx9a2_c8r32 | 66.833 | 33.167 | 0.003 |
Performance metrics for the DBMS listed above. Some are normalized by throughput, others are not. Legend for results is here.
ips	qps	rps	rmbps	wps	wmbps	rpq	rkbpq	wpi	wkbpi	csps	cpups	cspq	cpupq	dbgb1	dbgb2	rss	maxop	p50	p99	tag
100	6220	0	0.0	85.8	2.0	0.000	0.000	0.859	20.115	25227	13.5	4.056	174	12.7	39.8	0.3	0.002	6217	6153	pg17beta1_def.cx9a2_c8r32
100	5996	0	0.0	87.6	2.0	0.000	0.000	0.878	20.142	24323	12.8	4.057	171	12.9	51.5	0.3	0.002	5961	5882	pg17beta1_def_hack10.cx9a2_c8r32
100	6013	0	0.0	87.7	2.0	0.000	0.000	0.879	20.308	24387	12.9	4.056	172	12.8	51.4	0.3	0.001	5993	5881	pg17beta1_def_hack100.cx9a2_c8r32
qr500.L3
qr500.L3: range queries with 500 insert/s per client. Graphs for performance per 1-second interval are here.
Average throughput:
Query response time histogram: each cell has the percentage of responses that take <= the time in the header and max is the max response time in seconds. For max values in the top 25% of the range have a red background and in the bottom 25% of the range have a green background. The red background is not used when the min value is within 80% of the max value.
| dbms | 256us | 1ms | 4ms | 16ms | 64ms | 256ms | 1s | 4s | 16s | gt | max |
|---|---|---|---|---|---|---|---|---|---|---|---|
| pg17beta1_def.cx9a2_c8r32 | 99.998 | 0.002 | nonzero | 0.004 | |||||||
| pg17beta1_def_hack10.cx9a2_c8r32 | 99.997 | 0.003 | nonzero | 0.004 | |||||||
| pg17beta1_def_hack100.cx9a2_c8r32 | 99.996 | 0.004 | nonzero | 0.003 |
Insert response time histogram: each cell has the percentage of responses that take <= the time in the header and max is the max response time in seconds. For max values in the top 25% of the range have a red background and in the bottom 25% of the range have a green background. The red background is not used when the min value is within 80% of the max value.
| dbms | 256us | 1ms | 4ms | 16ms | 64ms | 256ms | 1s | 4s | 16s | gt | max |
|---|---|---|---|---|---|---|---|---|---|---|---|
| pg17beta1_def.cx9a2_c8r32 | 26.722 | 73.267 | 0.011 | 0.006 | |||||||
| pg17beta1_def_hack10.cx9a2_c8r32 | 18.439 | 81.550 | 0.011 | 0.006 | |||||||
| pg17beta1_def_hack100.cx9a2_c8r32 | 17.833 | 82.150 | 0.017 | 0.006 |
Delete response time histogram: each cell has the percentage of responses that take <= the time in the header and max is the max response time in seconds. For max values in the top 25% of the range have a red background and in the bottom 25% of the range have a green background. The red background is not used when the min value is within 80% of the max value.
| dbms | 256us | 1ms | 4ms | 16ms | 64ms | 256ms | 1s | 4s | 16s | gt | max |
|---|---|---|---|---|---|---|---|---|---|---|---|
| pg17beta1_def.cx9a2_c8r32 | 86.050 | 13.950 | 0.011 | ||||||||
| pg17beta1_def_hack10.cx9a2_c8r32 | 99.800 | 0.200 | 0.003 | ||||||||
| pg17beta1_def_hack100.cx9a2_c8r32 | 95.878 | 4.122 | 0.003 |
Performance metrics for the DBMS listed above. Some are normalized by throughput, others are not. Legend for results is here.
ips	qps	rps	rmbps	wps	wmbps	rpq	rkbpq	wpi	wkbpi	csps	cpups	cspq	cpupq	dbgb1	dbgb2	rss	maxop	p50	p99	tag
499	14272	0	0.0	93.7	3.1	0.000	0.000	0.188	6.287	54729	12.9	3.835	72	12.8	38.4	5.8	0.004	14270	13585	pg17beta1_def.cx9a2_c8r32
499	14191	0	0.0	94.7	3.0	0.000	0.000	0.190	6.233	54404	11.1	3.834	63	12.9	50.1	6.0	0.004	14192	13473	pg17beta1_def_hack10.cx9a2_c8r32
499	13679	0	0.0	94.8	3.0	0.000	0.000	0.190	6.243	52448	11.0	3.834	64	12.8	50.0	6.0	0.003	13665	13009	pg17beta1_def_hack100.cx9a2_c8r32
qp500.L4
qp500.L4: point queries with 500 insert/s per client. Graphs for performance per 1-second interval are here.
Average throughput:
Query response time histogram: each cell has the percentage of responses that take <= the time in the header and max is the max response time in seconds. For max values in the top 25% of the range have a red background and in the bottom 25% of the range have a green background. The red background is not used when the min value is within 80% of the max value.
| dbms | 256us | 1ms | 4ms | 16ms | 64ms | 256ms | 1s | 4s | 16s | gt | max |
|---|---|---|---|---|---|---|---|---|---|---|---|
| pg17beta1_def.cx9a2_c8r32 | 99.974 | 0.026 | nonzero | 0.002 | |||||||
| pg17beta1_def_hack10.cx9a2_c8r32 | 97.934 | 2.066 | nonzero | 0.002 | |||||||
| pg17beta1_def_hack100.cx9a2_c8r32 | 97.955 | 2.045 | nonzero | 0.002 |
Insert response time histogram: each cell has the percentage of responses that take <= the time in the header and max is the max response time in seconds. For max values in the top 25% of the range have a red background and in the bottom 25% of the range have a green background. The red background is not used when the min value is within 80% of the max value.
| dbms | 256us | 1ms | 4ms | 16ms | 64ms | 256ms | 1s | 4s | 16s | gt | max |
|---|---|---|---|---|---|---|---|---|---|---|---|
| pg17beta1_def.cx9a2_c8r32 | 6.700 | 93.289 | 0.011 | 0.006 | |||||||
| pg17beta1_def_hack10.cx9a2_c8r32 | 5.644 | 94.344 | 0.011 | 0.006 | |||||||
| pg17beta1_def_hack100.cx9a2_c8r32 | 5.394 | 94.594 | 0.011 | 0.006 |
Delete response time histogram: each cell has the percentage of responses that take <= the time in the header and max is the max response time in seconds. For max values in the top 25% of the range have a red background and in the bottom 25% of the range have a green background. The red background is not used when the min value is within 80% of the max value.
| dbms | 256us | 1ms | 4ms | 16ms | 64ms | 256ms | 1s | 4s | 16s | gt | max |
|---|---|---|---|---|---|---|---|---|---|---|---|
| pg17beta1_def.cx9a2_c8r32 | 0.439 | 99.556 | 0.006 | 0.023 | |||||||
| pg17beta1_def_hack10.cx9a2_c8r32 | 99.928 | 0.072 | 0.002 | ||||||||
| pg17beta1_def_hack100.cx9a2_c8r32 | 95.522 | 4.478 | 0.003 |
Performance metrics for the DBMS listed above. Some are normalized by throughput, others are not. Legend for results is here.
ips	qps	rps	rmbps	wps	wmbps	rpq	rkbpq	wpi	wkbpi	csps	cpups	cspq	cpupq	dbgb1	dbgb2	rss	maxop	p50	p99	tag
499	6258	0	0.0	67.7	4.1	0.000	0.000	0.136	8.497	25491	14.1	4.073	180	12.9	35.4	5.7	0.002	6251	6169	pg17beta1_def.cx9a2_c8r32
499	5968	0	0.0	68.9	4.2	0.000	0.000	0.138	8.524	24334	13.1	4.077	176	13.0	47.1	5.2	0.002	5946	5855	pg17beta1_def_hack10.cx9a2_c8r32
499	5966	0	0.0	70.1	4.3	0.000	0.000	0.140	8.869	24321	13.3	4.077	178	12.9	46.9	10.7	0.002	5945	5850	pg17beta1_def_hack100.cx9a2_c8r32
qr1000.L5
qr1000.L5: range queries with 1000 insert/s per client. Graphs for performance per 1-second interval are here.
Average throughput:
Query response time histogram: each cell has the percentage of responses that take <= the time in the header and max is the max response time in seconds. For max values in the top 25% of the range have a red background and in the bottom 25% of the range have a green background. The red background is not used when the min value is within 80% of the max value.
| dbms | 256us | 1ms | 4ms | 16ms | 64ms | 256ms | 1s | 4s | 16s | gt | max |
|---|---|---|---|---|---|---|---|---|---|---|---|
| pg17beta1_def.cx9a2_c8r32 | 99.998 | 0.002 | nonzero | nonzero | 0.016 | ||||||
| pg17beta1_def_hack10.cx9a2_c8r32 | 99.994 | 0.006 | nonzero | nonzero | nonzero | 0.016 | |||||
| pg17beta1_def_hack100.cx9a2_c8r32 | 99.996 | 0.004 | nonzero | 0.002 |
Insert response time histogram: each cell has the percentage of responses that take <= the time in the header and max is the max response time in seconds. For max values in the top 25% of the range have a red background and in the bottom 25% of the range have a green background. The red background is not used when the min value is within 80% of the max value.
| dbms | 256us | 1ms | 4ms | 16ms | 64ms | 256ms | 1s | 4s | 16s | gt | max |
|---|---|---|---|---|---|---|---|---|---|---|---|
| pg17beta1_def.cx9a2_c8r32 | 51.817 | 48.161 | 0.019 | 0.003 | 0.021 | ||||||
| pg17beta1_def_hack10.cx9a2_c8r32 | 49.681 | 50.294 | 0.017 | 0.008 | 0.028 | ||||||
| pg17beta1_def_hack100.cx9a2_c8r32 | 40.328 | 59.667 | 0.006 | 0.006 |
Delete response time histogram: each cell has the percentage of responses that take <= the time in the header and max is the max response time in seconds. For max values in the top 25% of the range have a red background and in the bottom 25% of the range have a green background. The red background is not used when the min value is within 80% of the max value.
| dbms | 256us | 1ms | 4ms | 16ms | 64ms | 256ms | 1s | 4s | 16s | gt | max |
|---|---|---|---|---|---|---|---|---|---|---|---|
| pg17beta1_def.cx9a2_c8r32 | 8.678 | 64.936 | 26.378 | 0.008 | 0.033 | ||||||
| pg17beta1_def_hack10.cx9a2_c8r32 | 99.922 | 0.061 | 0.011 | 0.006 | 0.026 | ||||||
| pg17beta1_def_hack100.cx9a2_c8r32 | 97.833 | 2.167 | 0.003 |
Performance metrics for the DBMS listed above. Some are normalized by throughput, others are not. Legend for results is here.
ips	qps	rps	rmbps	wps	wmbps	rpq	rkbpq	wpi	wkbpi	csps	cpups	cspq	cpupq	dbgb1	dbgb2	rss	maxop	p50	p99	tag
999	14016	0	0.0	83.6	4.7	0.000	0.000	0.084	4.784	53950	13.9	3.849	79	12.9	33.4	3.9	0.016	14176	12056	pg17beta1_def.cx9a2_c8r32
999	13737	0	0.0	85.4	4.7	0.000	0.000	0.086	4.795	52886	11.3	3.850	66	13.1	44.0	5.0	0.016	13921	11971	pg17beta1_def_hack10.cx9a2_c8r32
999	13932	0	0.0	50.6	5.1	0.000	0.000	0.051	5.268	53639	11.5	3.850	66	12.9	43.4	6.2	0.002	13937	12850	pg17beta1_def_hack100.cx9a2_c8r32
qp1000.L6
qp1000.L6: point queries with 1000 insert/s per client. Graphs for performance per 1-second interval are here.
Average throughput:
Query response time histogram: each cell has the percentage of responses that take <= the time in the header and max is the max response time in seconds. For max values in the top 25% of the range have a red background and in the bottom 25% of the range have a green background. The red background is not used when the min value is within 80% of the max value.
| dbms | 256us | 1ms | 4ms | 16ms | 64ms | 256ms | 1s | 4s | 16s | gt | max |
|---|---|---|---|---|---|---|---|---|---|---|---|
| pg17beta1_def.cx9a2_c8r32 | 99.956 | 0.044 | nonzero | 0.002 | |||||||
| pg17beta1_def_hack10.cx9a2_c8r32 | 98.033 | 1.967 | nonzero | 0.002 | |||||||
| pg17beta1_def_hack100.cx9a2_c8r32 | 98.042 | 1.958 | nonzero | 0.002 |
Insert response time histogram: each cell has the percentage of responses that take <= the time in the header and max is the max response time in seconds. For max values in the top 25% of the range have a red background and in the bottom 25% of the range have a green background. The red background is not used when the min value is within 80% of the max value.
| dbms | 256us | 1ms | 4ms | 16ms | 64ms | 256ms | 1s | 4s | 16s | gt | max |
|---|---|---|---|---|---|---|---|---|---|---|---|
| pg17beta1_def.cx9a2_c8r32 | 20.978 | 79.017 | 0.003 | 0.003 | 0.016 | ||||||
| pg17beta1_def_hack10.cx9a2_c8r32 | 28.744 | 71.250 | 0.006 | 0.006 | |||||||
| pg17beta1_def_hack100.cx9a2_c8r32 | 28.311 | 71.681 | 0.006 | 0.003 | 0.017 |
Delete response time histogram: each cell has the percentage of responses that take <= the time in the header and max is the max response time in seconds. For max values in the top 25% of the range have a red background and in the bottom 25% of the range have a green background. The red background is not used when the min value is within 80% of the max value.
| dbms | 256us | 1ms | 4ms | 16ms | 64ms | 256ms | 1s | 4s | 16s | gt | max |
|---|---|---|---|---|---|---|---|---|---|---|---|
| pg17beta1_def.cx9a2_c8r32 | 8.936 | 32.417 | 58.647 | 0.016 | |||||||
| pg17beta1_def_hack10.cx9a2_c8r32 | 99.989 | 0.011 | 0.002 | ||||||||
| pg17beta1_def_hack100.cx9a2_c8r32 | 98.261 | 1.733 | 0.006 | 0.016 |
Performance metrics for the DBMS listed above. Some are normalized by throughput, others are not. Legend for results is here.
ips	qps	rps	rmbps	wps	wmbps	rpq	rkbpq	wpi	wkbpi	csps	cpups	cspq	cpupq	dbgb1	dbgb2	rss	maxop	p50	p99	tag
999	6149	0	0.0	65.2	5.1	0.000	0.000	0.065	5.241	25259	14.7	4.108	191	13.0	33.1	2.7	0.002	6153	6089	pg17beta1_def.cx9a2_c8r32
999	5934	0	0.0	65.5	5.1	0.000	0.000	0.066	5.202	24404	13.6	4.113	183	13.1	39.9	10.7	0.002	5929	5801	pg17beta1_def_hack10.cx9a2_c8r32
999	5939	0	0.0	65.6	4.8	0.000	0.000	0.066	4.959	24405	13.5	4.110	182	13.0	39.8	2.8	0.002	5930	5820	pg17beta1_def_hack100.cx9a2_c8r32
l.i0
l.i0: load without secondary indexes
Performance metrics for all DBMS, not just the ones listed above. Some are normalized by throughput, others are not. Legend for results is here.
ips	qps	rps	rmbps	wps	wmbps	rpq	rkbpq	wpi	wkbpi	csps	cpups	cspq	cpupq	dbgb1	dbgb2	rss	maxop	p50	p99	tag
154799	0	0	0.0	571.0	65.5	0.000	0.000	0.004	0.433	16548	21.4	0.107	11	4.8	13.0	0.4	0.002	154733	153534	pg17beta1_def.cx9a2_c8r32
148368	0	0	0.0	556.5	63.9	0.000	0.000	0.004	0.441	16024	21.3	0.108	11	4.8	13.0	0.4	0.005	148537	142456	pg17beta1_def_hack10.cx9a2_c8r32
148810	0	0	0.0	557.6	64.0	0.000	0.000	0.004	0.441	16036	21.5	0.108	12	4.8	13.0	0.4	0.002	149787	142742	pg17beta1_def_hack100.cx9a2_c8r32
l.x
l.x: create secondary indexes
Performance metrics for all DBMS, not just the ones listed above. Some are normalized by throughput, others are not. Legend for results is here.
ips	qps	rps	rmbps	wps	wmbps	rpq	rkbpq	wpi	wkbpi	csps	cpups	cspq	cpupq	dbgb1	dbgb2	rss	maxop	p50	p99	tag
381680	0	0	0.0	936.5	115.8	0.000	0.000	0.002	0.311	680	11.7	0.002	2	9.6	22.1	5.0	0.002	NA	NA	pg17beta1_def.cx9a2_c8r32
384616	0	0	0.0	956.3	117.9	0.000	0.000	0.002	0.314	600	11.4	0.002	2	9.6	22.1	5.0	0.002	NA	NA	pg17beta1_def_hack10.cx9a2_c8r32
384616	0	0	0.0	950.6	117.5	0.000	0.000	0.002	0.313	681	11.5	0.002	2	9.6	22.1	5.0	0.002	NA	NA	pg17beta1_def_hack100.cx9a2_c8r32
l.i1
l.i1: continue load after secondary indexes created with 50 inserts per transaction
Performance metrics for all DBMS, not just the ones listed above. Some are normalized by throughput, others are not. Legend for results is here.
ips	qps	rps	rmbps	wps	wmbps	rpq	rkbpq	wpi	wkbpi	csps	cpups	cspq	cpupq	dbgb1	dbgb2	rss	maxop	p50	p99	tag
11182	0	0	0.0	171.0	18.8	0.000	0.000	0.015	1.724	5203	17.7	0.465	127	12.2	45.8	8.5	0.029	7742	3496	pg17beta1_def.cx9a2_c8r32
49322	0	0	0.0	724.1	81.6	0.000	0.000	0.015	1.695	22259	22.7	0.451	37	12.4	50.5	11.0	0.036	49896	32813	pg17beta1_def_hack10.cx9a2_c8r32
49383	0	0	0.0	719.0	81.1	0.000	0.000	0.015	1.682	22269	23.4	0.451	38	12.4	50.3	1.2	0.032	49796	35562	pg17beta1_def_hack100.cx9a2_c8r32
l.i2
l.i2: continue load after secondary indexes created with 5 inserts per transaction
Performance metrics for all DBMS, not just the ones listed above. Some are normalized by throughput, others are not. Legend for results is here.
ips	qps	rps	rmbps	wps	wmbps	rpq	rkbpq	wpi	wkbpi	csps	cpups	cspq	cpupq	dbgb1	dbgb2	rss	maxop	p50	p99	tag
1286	0	0	0.0	56.3	5.3	0.000	0.000	0.044	4.235	5338	14.0	4.151	871	12.6	45.9	0.4	0.002	884	579	pg17beta1_def.cx9a2_c8r32
22573	0	0	0.0	319.5	34.9	0.000	0.000	0.014	1.582	87526	27.1	3.877	96	12.8	52.9	11.5	0.007	22576	21107	pg17beta1_def_hack10.cx9a2_c8r32
17513	0	0	0.0	242.2	27.0	0.000	0.000	0.014	1.580	69146	24.5	3.948	112	12.8	52.8	8.3	0.007	18025	14984	pg17beta1_def_hack100.cx9a2_c8r32
qr100.L1
qr100.L1: range queries with 100 insert/s per client
Performance metrics for all DBMS, not just the ones listed above. Some are normalized by throughput, others are not. Legend for results is here.
ips	qps	rps	rmbps	wps	wmbps	rpq	rkbpq	wpi	wkbpi	csps	cpups	cspq	cpupq	dbgb1	dbgb2	rss	maxop	p50	p99	tag
100	15516	0	0.0	15.2	1.0	0.000	0.000	0.152	9.748	59337	12.7	3.824	65	12.7	41.2	0.3	0.004	15519	15311	pg17beta1_def.cx9a2_c8r32
100	15250	0	0.0	14.5	0.9	0.000	0.000	0.146	9.517	58298	10.8	3.823	57	12.8	52.9	0.3	0.001	15326	14368	pg17beta1_def_hack10.cx9a2_c8r32
100	14552	0	0.0	14.9	0.9	0.000	0.000	0.150	9.726	55632	10.7	3.823	59	12.8	52.8	0.3	0.004	14544	14192	pg17beta1_def_hack100.cx9a2_c8r32
qp100.L2
qp100.L2: point queries with 100 insert/s per client
Performance metrics for all DBMS, not just the ones listed above. Some are normalized by throughput, others are not. Legend for results is here.
ips	qps	rps	rmbps	wps	wmbps	rpq	rkbpq	wpi	wkbpi	csps	cpups	cspq	cpupq	dbgb1	dbgb2	rss	maxop	p50	p99	tag
100	6220	0	0.0	85.8	2.0	0.000	0.000	0.859	20.115	25227	13.5	4.056	174	12.7	39.8	0.3	0.002	6217	6153	pg17beta1_def.cx9a2_c8r32
100	5996	0	0.0	87.6	2.0	0.000	0.000	0.878	20.142	24323	12.8	4.057	171	12.9	51.5	0.3	0.002	5961	5882	pg17beta1_def_hack10.cx9a2_c8r32
100	6013	0	0.0	87.7	2.0	0.000	0.000	0.879	20.308	24387	12.9	4.056	172	12.8	51.4	0.3	0.001	5993	5881	pg17beta1_def_hack100.cx9a2_c8r32
qr500.L3
qr500.L3: range queries with 500 insert/s per client
Performance metrics for all DBMS, not just the ones listed above. Some are normalized by throughput, others are not. Legend for results is here.
ips	qps	rps	rmbps	wps	wmbps	rpq	rkbpq	wpi	wkbpi	csps	cpups	cspq	cpupq	dbgb1	dbgb2	rss	maxop	p50	p99	tag
499	14272	0	0.0	93.7	3.1	0.000	0.000	0.188	6.287	54729	12.9	3.835	72	12.8	38.4	5.8	0.004	14270	13585	pg17beta1_def.cx9a2_c8r32
499	14191	0	0.0	94.7	3.0	0.000	0.000	0.190	6.233	54404	11.1	3.834	63	12.9	50.1	6.0	0.004	14192	13473	pg17beta1_def_hack10.cx9a2_c8r32
499	13679	0	0.0	94.8	3.0	0.000	0.000	0.190	6.243	52448	11.0	3.834	64	12.8	50.0	6.0	0.003	13665	13009	pg17beta1_def_hack100.cx9a2_c8r32
qp500.L4
qp500.L4: point queries with 500 insert/s per client
Performance metrics for all DBMS, not just the ones listed above. Some are normalized by throughput, others are not. Legend for results is here.
ips	qps	rps	rmbps	wps	wmbps	rpq	rkbpq	wpi	wkbpi	csps	cpups	cspq	cpupq	dbgb1	dbgb2	rss	maxop	p50	p99	tag
499	6258	0	0.0	67.7	4.1	0.000	0.000	0.136	8.497	25491	14.1	4.073	180	12.9	35.4	5.7	0.002	6251	6169	pg17beta1_def.cx9a2_c8r32
499	5968	0	0.0	68.9	4.2	0.000	0.000	0.138	8.524	24334	13.1	4.077	176	13.0	47.1	5.2	0.002	5946	5855	pg17beta1_def_hack10.cx9a2_c8r32
499	5966	0	0.0	70.1	4.3	0.000	0.000	0.140	8.869	24321	13.3	4.077	178	12.9	46.9	10.7	0.002	5945	5850	pg17beta1_def_hack100.cx9a2_c8r32
qr1000.L5
qr1000.L5: range queries with 1000 insert/s per client
Performance metrics for all DBMS, not just the ones listed above. Some are normalized by throughput, others are not. Legend for results is here.
ips	qps	rps	rmbps	wps	wmbps	rpq	rkbpq	wpi	wkbpi	csps	cpups	cspq	cpupq	dbgb1	dbgb2	rss	maxop	p50	p99	tag
999	14016	0	0.0	83.6	4.7	0.000	0.000	0.084	4.784	53950	13.9	3.849	79	12.9	33.4	3.9	0.016	14176	12056	pg17beta1_def.cx9a2_c8r32
999	13737	0	0.0	85.4	4.7	0.000	0.000	0.086	4.795	52886	11.3	3.850	66	13.1	44.0	5.0	0.016	13921	11971	pg17beta1_def_hack10.cx9a2_c8r32
999	13932	0	0.0	50.6	5.1	0.000	0.000	0.051	5.268	53639	11.5	3.850	66	12.9	43.4	6.2	0.002	13937	12850	pg17beta1_def_hack100.cx9a2_c8r32
qp1000.L6
qp1000.L6: point queries with 1000 insert/s per client
Performance metrics for all DBMS, not just the ones listed above. Some are normalized by throughput, others are not. Legend for results is here.
ips	qps	rps	rmbps	wps	wmbps	rpq	rkbpq	wpi	wkbpi	csps	cpups	cspq	cpupq	dbgb1	dbgb2	rss	maxop	p50	p99	tag
999	6149	0	0.0	65.2	5.1	0.000	0.000	0.065	5.241	25259	14.7	4.108	191	13.0	33.1	2.7	0.002	6153	6089	pg17beta1_def.cx9a2_c8r32
999	5934	0	0.0	65.5	5.1	0.000	0.000	0.066	5.202	24404	13.6	4.113	183	13.1	39.9	10.7	0.002	5929	5801	pg17beta1_def_hack10.cx9a2_c8r32
999	5939	0	0.0	65.6	4.8	0.000	0.000	0.066	4.959	24405	13.5	4.110	182	13.0	39.8	2.8	0.002	5930	5820	pg17beta1_def_hack100.cx9a2_c8r32
l.i0
- l.i0: load without secondary indexes
- Legend for results is here.
- Each entry lists the percentage of responses that fit in that bucket (slower than max time for previous bucket, faster than min time for next bucket).
Insert response time histogram
256us	1ms	4ms	16ms	64ms	256ms	1s	4s	16s	gt	max	tag
0.000	99.924	0.076	0.000	0.000	0.000	0.000	0.000	0.000	0.000	0.002	pg17beta1_def.cx9a2_c8r32
0.000	99.920	0.080	nonzero	0.000	0.000	0.000	0.000	0.000	0.000	0.005	pg17beta1_def_hack10.cx9a2_c8r32
0.000	99.919	0.081	0.000	0.000	0.000	0.000	0.000	0.000	0.000	0.002	pg17beta1_def_hack100.cx9a2_c8r32
l.x
- l.x: create secondary indexes
- Legend for results is here.
- Each entry lists the percentage of responses that fit in that bucket (slower than max time for previous bucket, faster than min time for next bucket).
TODO - determine whether there is data for create index response time
l.i1
- l.i1: continue load after secondary indexes created with 50 inserts per transaction
- Legend for results is here.
- Each entry lists the percentage of responses that fit in that bucket (slower than max time for previous bucket, faster than min time for next bucket).
Insert response time histogram
256us	1ms	4ms	16ms	64ms	256ms	1s	4s	16s	gt	max	tag
0.000	28.062	71.936	0.001	0.001	0.000	0.000	0.000	0.000	0.000	0.029	pg17beta1_def.cx9a2_c8r32
0.000	70.828	29.156	0.009	0.007	0.000	0.000	0.000	0.000	0.000	0.036	pg17beta1_def_hack10.cx9a2_c8r32
0.000	70.801	29.185	0.008	0.006	0.000	0.000	0.000	0.000	0.000	0.032	pg17beta1_def_hack100.cx9a2_c8r32
Delete response time histogram
256us	1ms	4ms	16ms	64ms	256ms	1s	4s	16s	gt	max	tag
0.000	11.229	45.669	43.100	0.001	0.000	0.000	0.000	0.000	0.000	0.031	pg17beta1_def.cx9a2_c8r32
0.000	99.974	0.017	0.005	0.003	0.000	0.000	0.000	0.000	0.000	0.062	pg17beta1_def_hack10.cx9a2_c8r32
0.000	99.932	0.061	0.005	0.003	0.000	0.000	0.000	0.000	0.000	0.024	pg17beta1_def_hack100.cx9a2_c8r32
l.i2
- l.i2: continue load after secondary indexes created with 5 inserts per transaction
- Legend for results is here.
- Each entry lists the percentage of responses that fit in that bucket (slower than max time for previous bucket, faster than min time for next bucket).
Insert response time histogram
256us	1ms	4ms	16ms	64ms	256ms	1s	4s	16s	gt	max	tag
29.143	70.857	nonzero	0.000	0.000	0.000	0.000	0.000	0.000	0.000	0.002	pg17beta1_def.cx9a2_c8r32
98.941	1.059	nonzero	nonzero	0.000	0.000	0.000	0.000	0.000	0.000	0.007	pg17beta1_def_hack10.cx9a2_c8r32
98.975	1.022	0.003	nonzero	0.000	0.000	0.000	0.000	0.000	0.000	0.007	pg17beta1_def_hack100.cx9a2_c8r32
Delete response time histogram
256us	1ms	4ms	16ms	64ms	256ms	1s	4s	16s	gt	max	tag
0.983	16.375	25.948	56.694	nonzero	0.000	0.000	0.000	0.000	0.000	0.020	pg17beta1_def.cx9a2_c8r32
99.035	0.962	0.004	nonzero	0.000	0.000	0.000	0.000	0.000	0.000	0.006	pg17beta1_def_hack10.cx9a2_c8r32
77.174	22.819	0.006	nonzero	0.000	0.000	0.000	0.000	0.000	0.000	0.007	pg17beta1_def_hack100.cx9a2_c8r32
qr100.L1
- qr100.L1: range queries with 100 insert/s per client
- Legend for results is here.
- Each entry lists the percentage of responses that fit in that bucket (slower than max time for previous bucket, faster than min time for next bucket).
Query response time histogram
256us	1ms	4ms	16ms	64ms	256ms	1s	4s	16s	gt	max	tag
100.000	nonzero	nonzero	0.000	0.000	0.000	0.000	0.000	0.000	0.000	0.004	pg17beta1_def.cx9a2_c8r32
99.999	0.001	nonzero	0.000	0.000	0.000	0.000	0.000	0.000	0.000	0.001	pg17beta1_def_hack10.cx9a2_c8r32
99.997	0.003	nonzero	nonzero	0.000	0.000	0.000	0.000	0.000	0.000	0.004	pg17beta1_def_hack100.cx9a2_c8r32
Insert response time histogram
256us	1ms	4ms	16ms	64ms	256ms	1s	4s	16s	gt	max	tag
0.000	0.000	99.944	0.056	0.000	0.000	0.000	0.000	0.000	0.000	0.006	pg17beta1_def.cx9a2_c8r32
0.000	0.000	99.944	0.056	0.000	0.000	0.000	0.000	0.000	0.000	0.006	pg17beta1_def_hack10.cx9a2_c8r32
0.000	0.000	99.944	0.056	0.000	0.000	0.000	0.000	0.000	0.000	0.006	pg17beta1_def_hack100.cx9a2_c8r32
Delete response time histogram
256us	1ms	4ms	16ms	64ms	256ms	1s	4s	16s	gt	max	tag
0.000	51.250	48.750	0.000	0.000	0.000	0.000	0.000	0.000	0.000	0.002	pg17beta1_def.cx9a2_c8r32
0.000	97.167	2.833	0.000	0.000	0.000	0.000	0.000	0.000	0.000	0.002	pg17beta1_def_hack10.cx9a2_c8r32
0.000	71.306	28.694	0.000	0.000	0.000	0.000	0.000	0.000	0.000	0.003	pg17beta1_def_hack100.cx9a2_c8r32
qp100.L2
- qp100.L2: point queries with 100 insert/s per client
- Legend for results is here.
- Each entry lists the percentage of responses that fit in that bucket (slower than max time for previous bucket, faster than min time for next bucket).
Query response time histogram
256us	1ms	4ms	16ms	64ms	256ms	1s	4s	16s	gt	max	tag
99.984	0.016	nonzero	0.000	0.000	0.000	0.000	0.000	0.000	0.000	0.002	pg17beta1_def.cx9a2_c8r32
97.448	2.552	nonzero	0.000	0.000	0.000	0.000	0.000	0.000	0.000	0.002	pg17beta1_def_hack10.cx9a2_c8r32
98.019	1.981	nonzero	0.000	0.000	0.000	0.000	0.000	0.000	0.000	0.001	pg17beta1_def_hack100.cx9a2_c8r32
Insert response time histogram
256us	1ms	4ms	16ms	64ms	256ms	1s	4s	16s	gt	max	tag
0.000	0.000	99.944	0.056	0.000	0.000	0.000	0.000	0.000	0.000	0.006	pg17beta1_def.cx9a2_c8r32
0.000	0.000	99.972	0.028	0.000	0.000	0.000	0.000	0.000	0.000	0.006	pg17beta1_def_hack10.cx9a2_c8r32
0.000	0.000	99.944	0.056	0.000	0.000	0.000	0.000	0.000	0.000	0.006	pg17beta1_def_hack100.cx9a2_c8r32
Delete response time histogram
256us	1ms	4ms	16ms	64ms	256ms	1s	4s	16s	gt	max	tag
0.000	0.000	99.972	0.028	0.000	0.000	0.000	0.000	0.000	0.000	0.007	pg17beta1_def.cx9a2_c8r32
0.000	98.694	1.306	0.000	0.000	0.000	0.000	0.000	0.000	0.000	0.002	pg17beta1_def_hack10.cx9a2_c8r32
0.000	66.833	33.167	0.000	0.000	0.000	0.000	0.000	0.000	0.000	0.003	pg17beta1_def_hack100.cx9a2_c8r32
qr500.L3
- qr500.L3: range queries with 500 insert/s per client
- Legend for results is here.
- Each entry lists the percentage of responses that fit in that bucket (slower than max time for previous bucket, faster than min time for next bucket).
Query response time histogram
256us	1ms	4ms	16ms	64ms	256ms	1s	4s	16s	gt	max	tag
99.998	0.002	nonzero	0.000	0.000	0.000	0.000	0.000	0.000	0.000	0.004	pg17beta1_def.cx9a2_c8r32
99.997	0.003	nonzero	0.000	0.000	0.000	0.000	0.000	0.000	0.000	0.004	pg17beta1_def_hack10.cx9a2_c8r32
99.996	0.004	nonzero	0.000	0.000	0.000	0.000	0.000	0.000	0.000	0.003	pg17beta1_def_hack100.cx9a2_c8r32
Insert response time histogram
256us	1ms	4ms	16ms	64ms	256ms	1s	4s	16s	gt	max	tag
0.000	26.722	73.267	0.011	0.000	0.000	0.000	0.000	0.000	0.000	0.006	pg17beta1_def.cx9a2_c8r32
0.000	18.439	81.550	0.011	0.000	0.000	0.000	0.000	0.000	0.000	0.006	pg17beta1_def_hack10.cx9a2_c8r32
0.000	17.833	82.150	0.017	0.000	0.000	0.000	0.000	0.000	0.000	0.006	pg17beta1_def_hack100.cx9a2_c8r32
Delete response time histogram
256us	1ms	4ms	16ms	64ms	256ms	1s	4s	16s	gt	max	tag
0.000	0.000	86.050	13.950	0.000	0.000	0.000	0.000	0.000	0.000	0.011	pg17beta1_def.cx9a2_c8r32
0.000	99.800	0.200	0.000	0.000	0.000	0.000	0.000	0.000	0.000	0.003	pg17beta1_def_hack10.cx9a2_c8r32
0.000	95.878	4.122	0.000	0.000	0.000	0.000	0.000	0.000	0.000	0.003	pg17beta1_def_hack100.cx9a2_c8r32
qp500.L4
- qp500.L4: point queries with 500 insert/s per client
- Legend for results is here.
- Each entry lists the percentage of responses that fit in that bucket (slower than max time for previous bucket, faster than min time for next bucket).
Query response time histogram
256us	1ms	4ms	16ms	64ms	256ms	1s	4s	16s	gt	max	tag
99.974	0.026	nonzero	0.000	0.000	0.000	0.000	0.000	0.000	0.000	0.002	pg17beta1_def.cx9a2_c8r32
97.934	2.066	nonzero	0.000	0.000	0.000	0.000	0.000	0.000	0.000	0.002	pg17beta1_def_hack10.cx9a2_c8r32
97.955	2.045	nonzero	0.000	0.000	0.000	0.000	0.000	0.000	0.000	0.002	pg17beta1_def_hack100.cx9a2_c8r32
Insert response time histogram
256us	1ms	4ms	16ms	64ms	256ms	1s	4s	16s	gt	max	tag
0.000	6.700	93.289	0.011	0.000	0.000	0.000	0.000	0.000	0.000	0.006	pg17beta1_def.cx9a2_c8r32
0.000	5.644	94.344	0.011	0.000	0.000	0.000	0.000	0.000	0.000	0.006	pg17beta1_def_hack10.cx9a2_c8r32
0.000	5.394	94.594	0.011	0.000	0.000	0.000	0.000	0.000	0.000	0.006	pg17beta1_def_hack100.cx9a2_c8r32
Delete response time histogram
256us	1ms	4ms	16ms	64ms	256ms	1s	4s	16s	gt	max	tag
0.000	0.000	0.439	99.556	0.006	0.000	0.000	0.000	0.000	0.000	0.023	pg17beta1_def.cx9a2_c8r32
0.000	99.928	0.072	0.000	0.000	0.000	0.000	0.000	0.000	0.000	0.002	pg17beta1_def_hack10.cx9a2_c8r32
0.000	95.522	4.478	0.000	0.000	0.000	0.000	0.000	0.000	0.000	0.003	pg17beta1_def_hack100.cx9a2_c8r32
qr1000.L5
- qr1000.L5: range queries with 1000 insert/s per client
- Legend for results is here.
- Each entry lists the percentage of responses that fit in that bucket (slower than max time for previous bucket, faster than min time for next bucket).
Query response time histogram
256us	1ms	4ms	16ms	64ms	256ms	1s	4s	16s	gt	max	tag
99.998	0.002	nonzero	nonzero	0.000	0.000	0.000	0.000	0.000	0.000	0.016	pg17beta1_def.cx9a2_c8r32
99.994	0.006	nonzero	nonzero	nonzero	0.000	0.000	0.000	0.000	0.000	0.016	pg17beta1_def_hack10.cx9a2_c8r32
99.996	0.004	nonzero	0.000	0.000	0.000	0.000	0.000	0.000	0.000	0.002	pg17beta1_def_hack100.cx9a2_c8r32
Insert response time histogram
256us	1ms	4ms	16ms	64ms	256ms	1s	4s	16s	gt	max	tag
0.000	51.817	48.161	0.019	0.003	0.000	0.000	0.000	0.000	0.000	0.021	pg17beta1_def.cx9a2_c8r32
0.000	49.681	50.294	0.017	0.008	0.000	0.000	0.000	0.000	0.000	0.028	pg17beta1_def_hack10.cx9a2_c8r32
0.000	40.328	59.667	0.006	0.000	0.000	0.000	0.000	0.000	0.000	0.006	pg17beta1_def_hack100.cx9a2_c8r32
Delete response time histogram
256us	1ms	4ms	16ms	64ms	256ms	1s	4s	16s	gt	max	tag
0.000	8.678	64.936	26.378	0.008	0.000	0.000	0.000	0.000	0.000	0.033	pg17beta1_def.cx9a2_c8r32
0.000	99.922	0.061	0.011	0.006	0.000	0.000	0.000	0.000	0.000	0.026	pg17beta1_def_hack10.cx9a2_c8r32
0.000	97.833	2.167	0.000	0.000	0.000	0.000	0.000	0.000	0.000	0.003	pg17beta1_def_hack100.cx9a2_c8r32
qp1000.L6
- qp1000.L6: point queries with 1000 insert/s per client
- Legend for results is here.
- Each entry lists the percentage of responses that fit in that bucket (slower than max time for previous bucket, faster than min time for next bucket).
Query response time histogram
256us	1ms	4ms	16ms	64ms	256ms	1s	4s	16s	gt	max	tag
99.956	0.044	nonzero	0.000	0.000	0.000	0.000	0.000	0.000	0.000	0.002	pg17beta1_def.cx9a2_c8r32
98.033	1.967	nonzero	0.000	0.000	0.000	0.000	0.000	0.000	0.000	0.002	pg17beta1_def_hack10.cx9a2_c8r32
98.042	1.958	nonzero	0.000	0.000	0.000	0.000	0.000	0.000	0.000	0.002	pg17beta1_def_hack100.cx9a2_c8r32
Insert response time histogram
256us	1ms	4ms	16ms	64ms	256ms	1s	4s	16s	gt	max	tag
0.000	20.978	79.017	0.003	0.003	0.000	0.000	0.000	0.000	0.000	0.016	pg17beta1_def.cx9a2_c8r32
0.000	28.744	71.250	0.006	0.000	0.000	0.000	0.000	0.000	0.000	0.006	pg17beta1_def_hack10.cx9a2_c8r32
0.000	28.311	71.681	0.006	0.003	0.000	0.000	0.000	0.000	0.000	0.017	pg17beta1_def_hack100.cx9a2_c8r32
Delete response time histogram
256us	1ms	4ms	16ms	64ms	256ms	1s	4s	16s	gt	max	tag
0.000	8.936	32.417	58.647	0.000	0.000	0.000	0.000	0.000	0.000	0.016	pg17beta1_def.cx9a2_c8r32
0.000	99.989	0.011	0.000	0.000	0.000	0.000	0.000	0.000	0.000	0.002	pg17beta1_def_hack10.cx9a2_c8r32
0.000	98.261	1.733	0.006	0.000	0.000	0.000	0.000	0.000	0.000	0.016	pg17beta1_def_hack100.cx9a2_c8r32