Introduction
This is a report for the insert benchmark with 50M docs and 1 client(s). It is generated by scripts (bash, awk, sed) and Tufte might not be impressed. An overview of the insert benchmark is here and a short update is here. Below, by DBMS, I mean DBMS+version.config. An example is my8020.c10b40 where my means MySQL, 8020 is version 8.0.20 and c10b40 is the name for the configuration file.
The test server has 8 AMD cores, 32G RAM and an NVMe SSD. It is described here as the ASUS PN53. The benchmark was run with 1 client and there were 1 or 3 connections per client (1 for queries or inserts without rate limits, 1+1 for rate limited inserts+deletes). It uses 1 table. It loads 50M rows per table without secondary indexes, creates 3 secondary indexes per table, then inserts 40m+10m rows per table with a delete per insert to avoid growing the table. It then does 6 read+write tests for 3600s each that do queries as fast as possible with 100,100,500,500,1000,1000 inserts/s and the same for deletes/s per client concurrent with the queries. The database is cached in memory. Clients and the DBMS share one server. The per-database configs are in the per-database subdirectories here.
The tested DBMS are:
- pg163_def.cx9a2_c8r32 - Postgres 16.3 with the cx9a2_c8r32 config
- pg163_def.cx9a2vic_c8r32 - Postgres 16.3 with the cx9a2_c8r32 config and vacuum_index_cleanup=ON for the test table
- pg163_def.cx9a2nofpw_c8r32 - Postgres 16.3 with the cx9a2_c8r32 config except that full_page_writes=off
- pg163_def.cx9a2nofpwvic_c8r32 - Postgres 16.3 with the cx9a2_c8r32 config except that full_page_writes=off and vacuum_index_cleanup=ON for the test table
Contents
- Summary
- l.i0: load without secondary indexes
- l.x: create secondary indexes
- l.i1: continue load after secondary indexes created with 50 inserts per transaction
- l.i2: continue load after secondary indexes created with 5 inserts per transaction
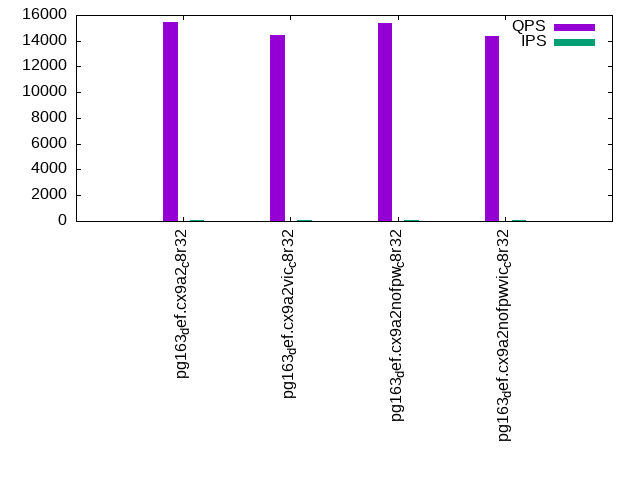
- qr100.L1: range queries with 100 insert/s per client
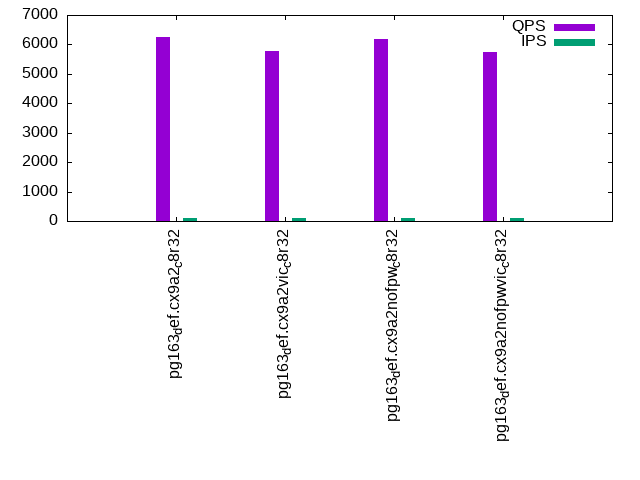
- qp100.L2: point queries with 100 insert/s per client
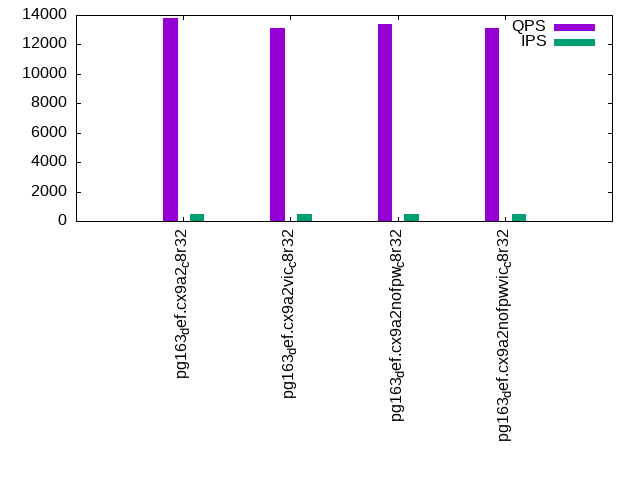
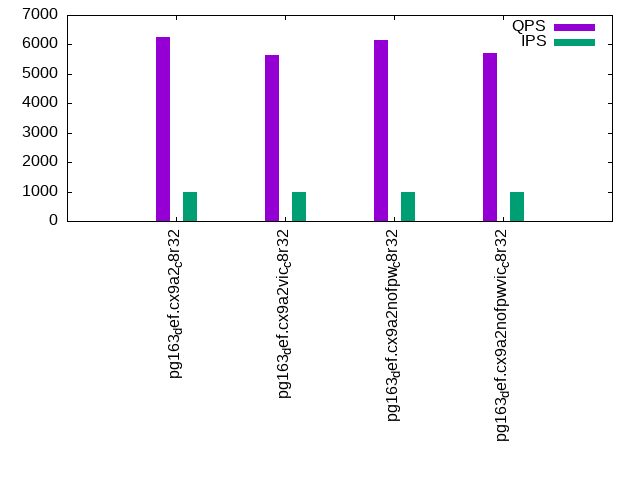
- qr500.L3: range queries with 500 insert/s per client
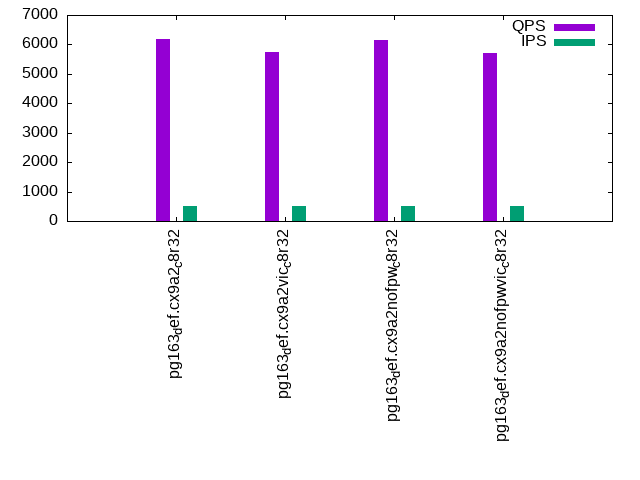
- qp500.L4: point queries with 500 insert/s per client
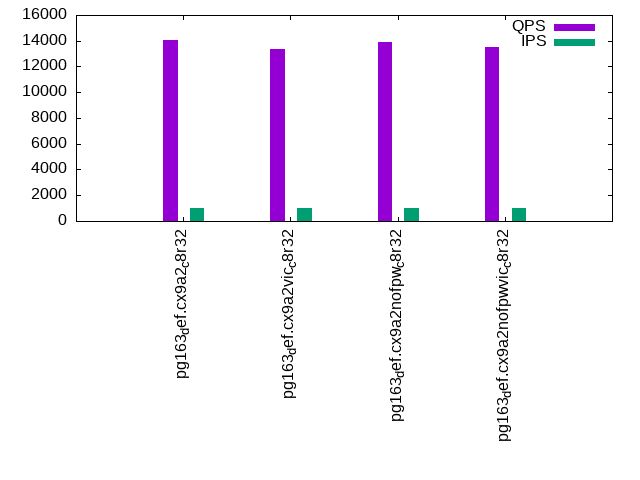
- qr1000.L5: range queries with 1000 insert/s per client
- qp1000.L6: point queries with 1000 insert/s per client
Summary
The numbers are inserts/s for l.i0, l.i1 and l.i2, indexed docs (or rows) /s for l.x and queries/s for qr100, qp100 thru qr1000, qp1000" The values are the average rate over the entire test for inserts (IPS) and queries (QPS). The range of values for IPS and QPS is split into 3 parts: bottom 25%, middle 50%, top 25%. Values in the bottom 25% have a red background, values in the top 25% have a green background and values in the middle have no color. A gray background is used for values that can be ignored because the DBMS did not sustain the target insert rate. Red backgrounds are not used when the minimum value is within 80% of the max value.
| dbms | l.i0 | l.x | l.i1 | l.i2 | qr100 | qp100 | qr500 | qp500 | qr1000 | qp1000 |
|---|---|---|---|---|---|---|---|---|---|---|
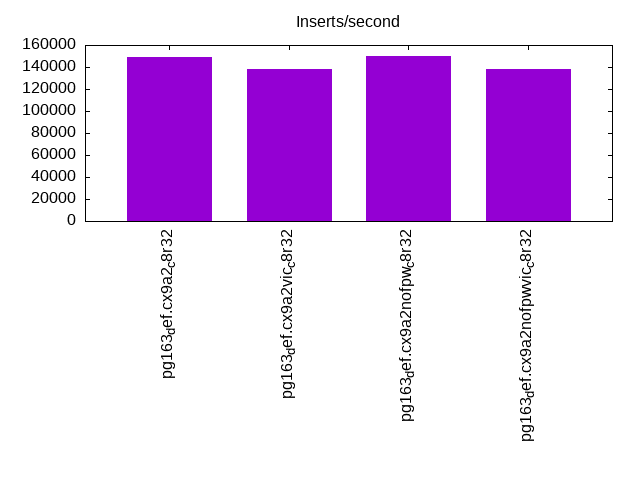
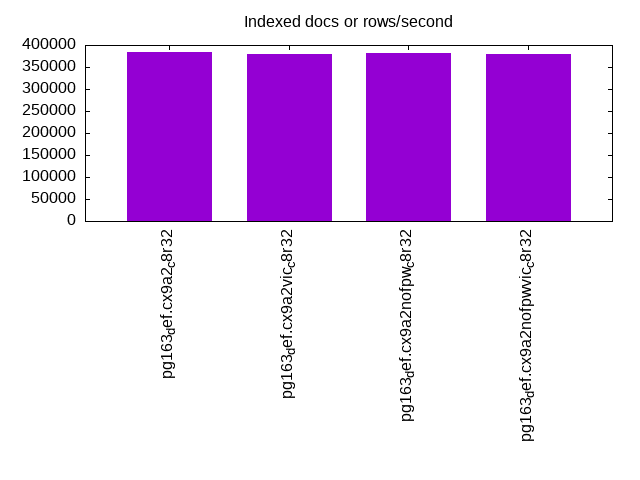
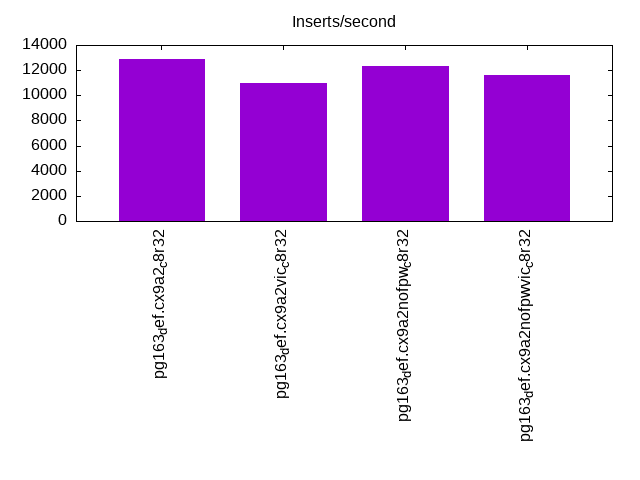
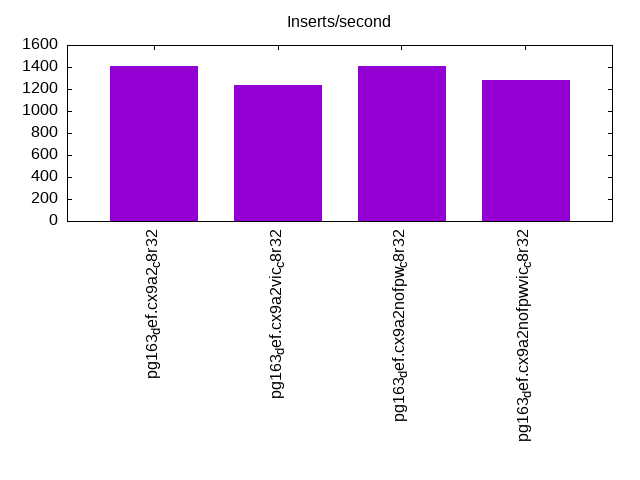
| pg163_def.cx9a2_c8r32 | 149254 | 384616 | 12862 | 1409 | 15493 | 6240 | 13769 | 6191 | 14083 | 6268 |
| pg163_def.cx9a2vic_c8r32 | 138504 | 378789 | 10968 | 1237 | 14466 | 5765 | 13113 | 5729 | 13361 | 5642 |
| pg163_def.cx9a2nofpw_c8r32 | 149700 | 381680 | 12357 | 1407 | 15349 | 6200 | 13364 | 6135 | 13889 | 6140 |
| pg163_def.cx9a2nofpwvic_c8r32 | 137741 | 378789 | 11624 | 1278 | 14388 | 5749 | 13099 | 5715 | 13482 | 5714 |
This table has relative throughput, throughput for the DBMS relative to the DBMS in the first line, using the absolute throughput from the previous table. Values less than 0.95 have a yellow background. Values greater than 1.05 have a blue background.
| dbms | l.i0 | l.x | l.i1 | l.i2 | qr100 | qp100 | qr500 | qp500 | qr1000 | qp1000 |
|---|---|---|---|---|---|---|---|---|---|---|
| pg163_def.cx9a2_c8r32 | 1.00 | 1.00 | 1.00 | 1.00 | 1.00 | 1.00 | 1.00 | 1.00 | 1.00 | 1.00 |
| pg163_def.cx9a2vic_c8r32 | 0.93 | 0.98 | 0.85 | 0.88 | 0.93 | 0.92 | 0.95 | 0.93 | 0.95 | 0.90 |
| pg163_def.cx9a2nofpw_c8r32 | 1.00 | 0.99 | 0.96 | 1.00 | 0.99 | 0.99 | 0.97 | 0.99 | 0.99 | 0.98 |
| pg163_def.cx9a2nofpwvic_c8r32 | 0.92 | 0.98 | 0.90 | 0.91 | 0.93 | 0.92 | 0.95 | 0.92 | 0.96 | 0.91 |
This lists the average rate of inserts/s for the tests that do inserts concurrent with queries. For such tests the query rate is listed in the table above. The read+write tests are setup so that the insert rate should match the target rate every second. Cells that are not at least 95% of the target have a red background to indicate a failure to satisfy the target.
| dbms | qr100.L1 | qp100.L2 | qr500.L3 | qp500.L4 | qr1000.L5 | qp1000.L6 |
|---|---|---|---|---|---|---|
| pg163_def.cx9a2_c8r32 | 100 | 100 | 499 | 499 | 999 | 999 |
| pg163_def.cx9a2vic_c8r32 | 100 | 100 | 499 | 499 | 999 | 999 |
| pg163_def.cx9a2nofpw_c8r32 | 100 | 100 | 499 | 499 | 999 | 999 |
| pg163_def.cx9a2nofpwvic_c8r32 | 100 | 100 | 499 | 499 | 999 | 999 |
| target | 100 | 100 | 500 | 500 | 1000 | 1000 |
l.i0
l.i0: load without secondary indexes. Graphs for performance per 1-second interval are here.
Average throughput:
Insert response time histogram: each cell has the percentage of responses that take <= the time in the header and max is the max response time in seconds. For the max column values in the top 25% of the range have a red background and in the bottom 25% of the range have a green background. The red background is not used when the min value is within 80% of the max value.
| dbms | 256us | 1ms | 4ms | 16ms | 64ms | 256ms | 1s | 4s | 16s | gt | max |
|---|---|---|---|---|---|---|---|---|---|---|---|
| pg163_def.cx9a2_c8r32 | 99.929 | 0.071 | 0.002 | ||||||||
| pg163_def.cx9a2vic_c8r32 | 99.917 | 0.083 | 0.003 | ||||||||
| pg163_def.cx9a2nofpw_c8r32 | 99.935 | 0.065 | 0.002 | ||||||||
| pg163_def.cx9a2nofpwvic_c8r32 | 99.916 | 0.084 | 0.002 |
Performance metrics for the DBMS listed above. Some are normalized by throughput, others are not. Legend for results is here.
ips	qps	rps	rmbps	wps	wmbps	rpq	rkbpq	wpi	wkbpi	csps	cpups	cspq	cpupq	dbgb1	dbgb2	rss	maxop	p50	p99	tag
149254	0	0	0.0	552.7	63.4	0.000	0.000	0.004	0.435	18645	22.5	0.125	12	4.8	13.0	0.4	0.002	149938	148637	pg163_def.cx9a2_c8r32
138504	0	0	0.0	517.2	59.6	0.000	0.000	0.004	0.440	17375	21.1	0.125	12	4.8	13.0	0.0	0.003	139051	137580	pg163_def.cx9a2vic_c8r32
149700	0	0	0.0	552.8	63.4	0.000	0.000	0.004	0.434	18581	22.6	0.124	12	4.8	13.0	0.4	0.002	149939	148737	pg163_def.cx9a2nofpw_c8r32
137741	0	0	0.0	512.1	58.9	0.000	0.000	0.004	0.438	17194	20.9	0.125	12	4.8	13.0	0.4	0.002	137652	136246	pg163_def.cx9a2nofpwvic_c8r32
l.x
l.x: create secondary indexes.
Average throughput:
Performance metrics for the DBMS listed above. Some are normalized by throughput, others are not. Legend for results is here.
ips	qps	rps	rmbps	wps	wmbps	rpq	rkbpq	wpi	wkbpi	csps	cpups	cspq	cpupq	dbgb1	dbgb2	rss	maxop	p50	p99	tag
384616	0	0	0.0	961.3	118.8	0.000	0.000	0.002	0.316	678	11.7	0.002	2	9.6	22.2	5.0	0.002	NA	NA	pg163_def.cx9a2_c8r32
378789	0	0	0.0	951.9	117.7	0.000	0.000	0.003	0.318	637	11.3	0.002	2	9.6	22.2	5.0	0.002	NA	NA	pg163_def.cx9a2vic_c8r32
381680	0	0	0.0	959.3	118.6	0.000	0.000	0.003	0.318	609	11.8	0.002	2	9.6	22.2	5.0	0.002	NA	NA	pg163_def.cx9a2nofpw_c8r32
378789	0	0	0.0	917.6	113.5	0.000	0.000	0.002	0.307	545	11.6	0.001	2	9.6	22.2	5.0	0.002	NA	NA	pg163_def.cx9a2nofpwvic_c8r32
l.i1
l.i1: continue load after secondary indexes created with 50 inserts per transaction. Graphs for performance per 1-second interval are here.
Average throughput:
Insert response time histogram: each cell has the percentage of responses that take <= the time in the header and max is the max response time in seconds. For the max column values in the top 25% of the range have a red background and in the bottom 25% of the range have a green background. The red background is not used when the min value is within 80% of the max value.
| dbms | 256us | 1ms | 4ms | 16ms | 64ms | 256ms | 1s | 4s | 16s | gt | max |
|---|---|---|---|---|---|---|---|---|---|---|---|
| pg163_def.cx9a2_c8r32 | 21.577 | 78.417 | 0.005 | 0.002 | 0.020 | ||||||
| pg163_def.cx9a2vic_c8r32 | 3.209 | 96.790 | nonzero | 0.005 | |||||||
| pg163_def.cx9a2nofpw_c8r32 | 21.313 | 78.687 | nonzero | 0.011 | |||||||
| pg163_def.cx9a2nofpwvic_c8r32 | 1.165 | 98.835 | nonzero | 0.014 |
Delete response time histogram: each cell has the percentage of responses that take <= the time in the header and max is the max response time in seconds. For the max column values in the top 25% of the range have a red background and in the bottom 25% of the range have a green background. The red background is not used when the min value is within 80% of the max value.
| dbms | 256us | 1ms | 4ms | 16ms | 64ms | 256ms | 1s | 4s | 16s | gt | max |
|---|---|---|---|---|---|---|---|---|---|---|---|
| pg163_def.cx9a2_c8r32 | 14.850 | 30.126 | 55.022 | 0.002 | 0.020 | ||||||
| pg163_def.cx9a2vic_c8r32 | 12.356 | 25.048 | 62.595 | nonzero | 0.017 | ||||||
| pg163_def.cx9a2nofpw_c8r32 | 14.841 | 37.942 | 47.217 | 0.012 | |||||||
| pg163_def.cx9a2nofpwvic_c8r32 | 12.283 | 34.437 | 53.279 | 0.015 |
Performance metrics for the DBMS listed above. Some are normalized by throughput, others are not. Legend for results is here.
ips	qps	rps	rmbps	wps	wmbps	rpq	rkbpq	wpi	wkbpi	csps	cpups	cspq	cpupq	dbgb1	dbgb2	rss	maxop	p50	p99	tag
12862	0	0	0.0	185.7	20.4	0.000	0.000	0.014	1.625	6894	18.8	0.536	117	12.3	48.9	11.0	0.020	9043	6296	pg163_def.cx9a2_c8r32
10968	0	0	0.0	172.6	18.0	0.000	0.000	0.016	1.685	5711	20.1	0.521	147	12.2	45.6	8.8	0.005	8141	5647	pg163_def.cx9a2vic_c8r32
12357	0	0	0.0	148.0	16.0	0.000	0.000	0.012	1.322	6546	18.4	0.530	119	12.3	42.7	9.6	0.011	8491	4547	pg163_def.cx9a2nofpw_c8r32
11624	0	0	0.0	148.3	15.0	0.000	0.000	0.013	1.322	5983	20.8	0.515	143	12.2	41.5	9.7	0.014	9439	6243	pg163_def.cx9a2nofpwvic_c8r32
l.i2
l.i2: continue load after secondary indexes created with 5 inserts per transaction. Graphs for performance per 1-second interval are here.
Average throughput:
Insert response time histogram: each cell has the percentage of responses that take <= the time in the header and max is the max response time in seconds. For the max column values in the top 25% of the range have a red background and in the bottom 25% of the range have a green background. The red background is not used when the min value is within 80% of the max value.
| dbms | 256us | 1ms | 4ms | 16ms | 64ms | 256ms | 1s | 4s | 16s | gt | max |
|---|---|---|---|---|---|---|---|---|---|---|---|
| pg163_def.cx9a2_c8r32 | 26.040 | 73.960 | 0.001 | nonzero | 0.005 | ||||||
| pg163_def.cx9a2vic_c8r32 | 16.798 | 83.201 | 0.001 | 0.002 | |||||||
| pg163_def.cx9a2nofpw_c8r32 | 24.055 | 75.944 | 0.001 | 0.002 | |||||||
| pg163_def.cx9a2nofpwvic_c8r32 | 12.687 | 87.311 | 0.002 | 0.002 |
Delete response time histogram: each cell has the percentage of responses that take <= the time in the header and max is the max response time in seconds. For the max column values in the top 25% of the range have a red background and in the bottom 25% of the range have a green background. The red background is not used when the min value is within 80% of the max value.
| dbms | 256us | 1ms | 4ms | 16ms | 64ms | 256ms | 1s | 4s | 16s | gt | max |
|---|---|---|---|---|---|---|---|---|---|---|---|
| pg163_def.cx9a2_c8r32 | 0.875 | 16.652 | 33.451 | 49.022 | 0.013 | ||||||
| pg163_def.cx9a2vic_c8r32 | 1.225 | 14.178 | 33.774 | 50.824 | nonzero | 0.016 | |||||
| pg163_def.cx9a2nofpw_c8r32 | 0.628 | 16.615 | 35.695 | 47.062 | 0.010 | ||||||
| pg163_def.cx9a2nofpwvic_c8r32 | 0.697 | 8.625 | 45.605 | 45.073 | nonzero | 0.018 |
Performance metrics for the DBMS listed above. Some are normalized by throughput, others are not. Legend for results is here.
ips	qps	rps	rmbps	wps	wmbps	rpq	rkbpq	wpi	wkbpi	csps	cpups	cspq	cpupq	dbgb1	dbgb2	rss	maxop	p50	p99	tag
1409	0	0	0.0	62.3	5.7	0.000	0.000	0.044	4.144	6882	14.4	4.884	817	12.7	46.7	0.1	0.005	1034	744	pg163_def.cx9a2_c8r32
1237	0	0	0.0	64.1	5.2	0.000	0.000	0.052	4.286	5839	15.7	4.718	1015	12.6	44.7	11.8	0.002	964	644	pg163_def.cx9a2vic_c8r32
1407	0	0	0.0	47.8	3.8	0.000	0.000	0.034	2.786	6874	14.4	4.886	819	12.7	43.1	0.8	0.002	1059	739	pg163_def.cx9a2nofpw_c8r32
1278	0	0	0.0	40.5	3.8	0.000	0.000	0.032	3.013	6022	15.8	4.712	989	12.6	42.0	0.4	0.002	945	654	pg163_def.cx9a2nofpwvic_c8r32
qr100.L1
qr100.L1: range queries with 100 insert/s per client. Graphs for performance per 1-second interval are here.
Average throughput:
Query response time histogram: each cell has the percentage of responses that take <= the time in the header and max is the max response time in seconds. For max values in the top 25% of the range have a red background and in the bottom 25% of the range have a green background. The red background is not used when the min value is within 80% of the max value.
| dbms | 256us | 1ms | 4ms | 16ms | 64ms | 256ms | 1s | 4s | 16s | gt | max |
|---|---|---|---|---|---|---|---|---|---|---|---|
| pg163_def.cx9a2_c8r32 | 100.000 | nonzero | nonzero | 0.002 | |||||||
| pg163_def.cx9a2vic_c8r32 | 99.981 | 0.019 | nonzero | nonzero | 0.005 | ||||||
| pg163_def.cx9a2nofpw_c8r32 | 100.000 | nonzero | nonzero | 0.002 | |||||||
| pg163_def.cx9a2nofpwvic_c8r32 | 99.981 | 0.019 | nonzero | 0.001 |
Insert response time histogram: each cell has the percentage of responses that take <= the time in the header and max is the max response time in seconds. For max values in the top 25% of the range have a red background and in the bottom 25% of the range have a green background. The red background is not used when the min value is within 80% of the max value.
| dbms | 256us | 1ms | 4ms | 16ms | 64ms | 256ms | 1s | 4s | 16s | gt | max |
|---|---|---|---|---|---|---|---|---|---|---|---|
| pg163_def.cx9a2_c8r32 | 99.972 | 0.028 | 0.006 | ||||||||
| pg163_def.cx9a2vic_c8r32 | 99.972 | 0.028 | 0.006 | ||||||||
| pg163_def.cx9a2nofpw_c8r32 | 10.819 | 89.167 | 0.014 | 0.005 | |||||||
| pg163_def.cx9a2nofpwvic_c8r32 | 99.972 | 0.028 | 0.005 |
Delete response time histogram: each cell has the percentage of responses that take <= the time in the header and max is the max response time in seconds. For max values in the top 25% of the range have a red background and in the bottom 25% of the range have a green background. The red background is not used when the min value is within 80% of the max value.
| dbms | 256us | 1ms | 4ms | 16ms | 64ms | 256ms | 1s | 4s | 16s | gt | max |
|---|---|---|---|---|---|---|---|---|---|---|---|
| pg163_def.cx9a2_c8r32 | 24.222 | 75.778 | 0.004 | ||||||||
| pg163_def.cx9a2vic_c8r32 | 22.236 | 77.764 | 0.004 | ||||||||
| pg163_def.cx9a2nofpw_c8r32 | 29.403 | 70.597 | 0.003 | ||||||||
| pg163_def.cx9a2nofpwvic_c8r32 | 22.292 | 77.708 | 0.003 |
Performance metrics for the DBMS listed above. Some are normalized by throughput, others are not. Legend for results is here.
ips	qps	rps	rmbps	wps	wmbps	rpq	rkbpq	wpi	wkbpi	csps	cpups	cspq	cpupq	dbgb1	dbgb2	rss	maxop	p50	p99	tag
100	15493	0	0.0	52.1	1.4	0.000	0.000	0.522	14.811	59342	12.8	3.830	66	12.7	42.8	0.5	0.002	15503	15183	pg163_def.cx9a2_c8r32
100	14466	0	0.0	51.9	1.4	0.000	0.000	0.520	14.864	55423	11.2	3.831	62	12.7	39.0	0.5	0.005	14351	13997	pg163_def.cx9a2vic_c8r32
100	15349	0	0.0	46.0	0.6	0.000	0.000	0.461	6.572	58812	12.8	3.832	67	12.7	41.8	0.5	0.002	15343	15039	pg163_def.cx9a2nofpw_c8r32
100	14388	0	0.0	45.9	0.6	0.000	0.000	0.460	6.622	55106	11.2	3.830	62	12.7	40.1	0.5	0.001	14220	13917	pg163_def.cx9a2nofpwvic_c8r32
qp100.L2
qp100.L2: point queries with 100 insert/s per client. Graphs for performance per 1-second interval are here.
Average throughput:
Query response time histogram: each cell has the percentage of responses that take <= the time in the header and max is the max response time in seconds. For max values in the top 25% of the range have a red background and in the bottom 25% of the range have a green background. The red background is not used when the min value is within 80% of the max value.
| dbms | 256us | 1ms | 4ms | 16ms | 64ms | 256ms | 1s | 4s | 16s | gt | max |
|---|---|---|---|---|---|---|---|---|---|---|---|
| pg163_def.cx9a2_c8r32 | 99.985 | 0.015 | nonzero | 0.002 | |||||||
| pg163_def.cx9a2vic_c8r32 | 95.923 | 4.077 | nonzero | 0.002 | |||||||
| pg163_def.cx9a2nofpw_c8r32 | 99.986 | 0.014 | nonzero | 0.003 | |||||||
| pg163_def.cx9a2nofpwvic_c8r32 | 95.828 | 4.172 | nonzero | 0.001 |
Insert response time histogram: each cell has the percentage of responses that take <= the time in the header and max is the max response time in seconds. For max values in the top 25% of the range have a red background and in the bottom 25% of the range have a green background. The red background is not used when the min value is within 80% of the max value.
| dbms | 256us | 1ms | 4ms | 16ms | 64ms | 256ms | 1s | 4s | 16s | gt | max |
|---|---|---|---|---|---|---|---|---|---|---|---|
| pg163_def.cx9a2_c8r32 | 99.972 | 0.028 | 0.006 | ||||||||
| pg163_def.cx9a2vic_c8r32 | 99.972 | 0.028 | 0.005 | ||||||||
| pg163_def.cx9a2nofpw_c8r32 | 99.986 | 0.014 | 0.005 | ||||||||
| pg163_def.cx9a2nofpwvic_c8r32 | 99.972 | 0.028 | 0.005 |
Delete response time histogram: each cell has the percentage of responses that take <= the time in the header and max is the max response time in seconds. For max values in the top 25% of the range have a red background and in the bottom 25% of the range have a green background. The red background is not used when the min value is within 80% of the max value.
| dbms | 256us | 1ms | 4ms | 16ms | 64ms | 256ms | 1s | 4s | 16s | gt | max |
|---|---|---|---|---|---|---|---|---|---|---|---|
| pg163_def.cx9a2_c8r32 | 92.028 | 7.972 | 0.011 | ||||||||
| pg163_def.cx9a2vic_c8r32 | 95.764 | 4.236 | 0.011 | ||||||||
| pg163_def.cx9a2nofpw_c8r32 | 97.028 | 2.972 | 0.011 | ||||||||
| pg163_def.cx9a2nofpwvic_c8r32 | 96.625 | 3.375 | 0.011 |
Performance metrics for the DBMS listed above. Some are normalized by throughput, others are not. Legend for results is here.
ips	qps	rps	rmbps	wps	wmbps	rpq	rkbpq	wpi	wkbpi	csps	cpups	cspq	cpupq	dbgb1	dbgb2	rss	maxop	p50	p99	tag
100	6240	0	0.0	84.3	1.8	0.000	0.000	0.844	18.825	25342	13.4	4.062	172	12.7	39.8	0.4	0.002	6233	6153	pg163_def.cx9a2_c8r32
100	5765	0	0.0	84.0	1.8	0.000	0.000	0.842	18.898	23444	13.0	4.067	180	12.7	36.1	0.5	0.002	5769	5658	pg163_def.cx9a2vic_c8r32
100	6200	0	0.0	78.4	1.0	0.000	0.000	0.785	10.544	25177	13.4	4.061	173	12.7	41.7	3.0	0.003	6201	6137	pg163_def.cx9a2nofpw_c8r32
100	5749	0	0.0	78.1	1.0	0.000	0.000	0.783	10.581	23373	13.0	4.066	181	12.7	40.0	0.5	0.001	5753	5631	pg163_def.cx9a2nofpwvic_c8r32
qr500.L3
qr500.L3: range queries with 500 insert/s per client. Graphs for performance per 1-second interval are here.
Average throughput:
Query response time histogram: each cell has the percentage of responses that take <= the time in the header and max is the max response time in seconds. For max values in the top 25% of the range have a red background and in the bottom 25% of the range have a green background. The red background is not used when the min value is within 80% of the max value.
| dbms | 256us | 1ms | 4ms | 16ms | 64ms | 256ms | 1s | 4s | 16s | gt | max |
|---|---|---|---|---|---|---|---|---|---|---|---|
| pg163_def.cx9a2_c8r32 | 99.999 | 0.001 | nonzero | nonzero | nonzero | 0.019 | |||||
| pg163_def.cx9a2vic_c8r32 | 99.980 | 0.020 | nonzero | nonzero | nonzero | 0.025 | |||||
| pg163_def.cx9a2nofpw_c8r32 | 99.999 | 0.001 | nonzero | nonzero | 0.005 | ||||||
| pg163_def.cx9a2nofpwvic_c8r32 | 99.981 | 0.019 | nonzero | nonzero | 0.005 |
Insert response time histogram: each cell has the percentage of responses that take <= the time in the header and max is the max response time in seconds. For max values in the top 25% of the range have a red background and in the bottom 25% of the range have a green background. The red background is not used when the min value is within 80% of the max value.
| dbms | 256us | 1ms | 4ms | 16ms | 64ms | 256ms | 1s | 4s | 16s | gt | max |
|---|---|---|---|---|---|---|---|---|---|---|---|
| pg163_def.cx9a2_c8r32 | 15.250 | 84.697 | 0.036 | 0.017 | 0.032 | ||||||
| pg163_def.cx9a2vic_c8r32 | 0.311 | 99.639 | 0.017 | 0.033 | 0.027 | ||||||
| pg163_def.cx9a2nofpw_c8r32 | 43.969 | 56.025 | 0.006 | 0.005 | |||||||
| pg163_def.cx9a2nofpwvic_c8r32 | 0.742 | 99.253 | 0.006 | 0.005 |
Delete response time histogram: each cell has the percentage of responses that take <= the time in the header and max is the max response time in seconds. For max values in the top 25% of the range have a red background and in the bottom 25% of the range have a green background. The red background is not used when the min value is within 80% of the max value.
| dbms | 256us | 1ms | 4ms | 16ms | 64ms | 256ms | 1s | 4s | 16s | gt | max |
|---|---|---|---|---|---|---|---|---|---|---|---|
| pg163_def.cx9a2_c8r32 | 0.806 | 30.686 | 68.489 | 0.019 | 0.021 | ||||||
| pg163_def.cx9a2vic_c8r32 | 0.947 | 27.172 | 71.850 | 0.031 | 0.026 | ||||||
| pg163_def.cx9a2nofpw_c8r32 | 1.022 | 32.097 | 66.881 | 0.015 | |||||||
| pg163_def.cx9a2nofpwvic_c8r32 | 0.583 | 26.950 | 72.467 | 0.014 |
Performance metrics for the DBMS listed above. Some are normalized by throughput, others are not. Legend for results is here.
ips	qps	rps	rmbps	wps	wmbps	rpq	rkbpq	wpi	wkbpi	csps	cpups	cspq	cpupq	dbgb1	dbgb2	rss	maxop	p50	p99	tag
499	13769	0	0.0	89.5	4.4	0.000	0.000	0.179	9.008	52919	13.3	3.843	77	12.8	35.4	2.2	0.019	13729	12786	pg163_def.cx9a2_c8r32
499	13113	0	0.0	89.5	4.4	0.000	0.000	0.179	9.045	50385	12.1	3.842	74	12.9	32.9	10.0	0.025	13073	12130	pg163_def.cx9a2vic_c8r32
499	13364	0	0.0	68.0	1.9	0.000	0.000	0.136	3.972	51362	13.2	3.843	79	12.8	41.3	10.5	0.005	13345	12435	pg163_def.cx9a2nofpw_c8r32
499	13099	0	0.0	67.9	2.0	0.000	0.000	0.136	4.015	50343	12.2	3.843	75	12.9	39.7	6.1	0.005	13065	12146	pg163_def.cx9a2nofpwvic_c8r32
qp500.L4
qp500.L4: point queries with 500 insert/s per client. Graphs for performance per 1-second interval are here.
Average throughput:
Query response time histogram: each cell has the percentage of responses that take <= the time in the header and max is the max response time in seconds. For max values in the top 25% of the range have a red background and in the bottom 25% of the range have a green background. The red background is not used when the min value is within 80% of the max value.
| dbms | 256us | 1ms | 4ms | 16ms | 64ms | 256ms | 1s | 4s | 16s | gt | max |
|---|---|---|---|---|---|---|---|---|---|---|---|
| pg163_def.cx9a2_c8r32 | 99.971 | 0.029 | nonzero | 0.002 | |||||||
| pg163_def.cx9a2vic_c8r32 | 95.887 | 4.113 | nonzero | 0.002 | |||||||
| pg163_def.cx9a2nofpw_c8r32 | 99.970 | 0.030 | nonzero | 0.002 | |||||||
| pg163_def.cx9a2nofpwvic_c8r32 | 95.833 | 4.167 | nonzero | 0.002 |
Insert response time histogram: each cell has the percentage of responses that take <= the time in the header and max is the max response time in seconds. For max values in the top 25% of the range have a red background and in the bottom 25% of the range have a green background. The red background is not used when the min value is within 80% of the max value.
| dbms | 256us | 1ms | 4ms | 16ms | 64ms | 256ms | 1s | 4s | 16s | gt | max |
|---|---|---|---|---|---|---|---|---|---|---|---|
| pg163_def.cx9a2_c8r32 | 12.017 | 87.981 | 0.003 | 0.006 | |||||||
| pg163_def.cx9a2vic_c8r32 | 0.339 | 99.656 | 0.006 | 0.006 | |||||||
| pg163_def.cx9a2nofpw_c8r32 | 19.944 | 80.053 | 0.003 | 0.006 | |||||||
| pg163_def.cx9a2nofpwvic_c8r32 | 0.669 | 99.325 | 0.006 | 0.006 |
Delete response time histogram: each cell has the percentage of responses that take <= the time in the header and max is the max response time in seconds. For max values in the top 25% of the range have a red background and in the bottom 25% of the range have a green background. The red background is not used when the min value is within 80% of the max value.
| dbms | 256us | 1ms | 4ms | 16ms | 64ms | 256ms | 1s | 4s | 16s | gt | max |
|---|---|---|---|---|---|---|---|---|---|---|---|
| pg163_def.cx9a2_c8r32 | 8.794 | 63.700 | 27.506 | 0.007 | |||||||
| pg163_def.cx9a2vic_c8r32 | 6.619 | 58.542 | 34.839 | 0.007 | |||||||
| pg163_def.cx9a2nofpw_c8r32 | 8.839 | 62.858 | 28.303 | 0.007 | |||||||
| pg163_def.cx9a2nofpwvic_c8r32 | 7.108 | 59.044 | 33.847 | 0.007 |
Performance metrics for the DBMS listed above. Some are normalized by throughput, others are not. Legend for results is here.
ips	qps	rps	rmbps	wps	wmbps	rpq	rkbpq	wpi	wkbpi	csps	cpups	cspq	cpupq	dbgb1	dbgb2	rss	maxop	p50	p99	tag
499	6191	0	0.0	70.6	3.3	0.000	0.000	0.141	6.801	25286	13.7	4.084	177	12.8	32.9	0.8	0.002	6185	6108	pg163_def.cx9a2_c8r32
499	5729	0	0.0	70.2	3.3	0.000	0.000	0.141	6.810	23427	13.8	4.089	193	12.9	32.9	6.1	0.002	5736	5614	pg163_def.cx9a2vic_c8r32
499	6135	0	0.0	62.7	2.4	0.000	0.000	0.126	4.946	25057	13.5	4.084	176	12.8	40.4	6.1	0.002	6137	6057	pg163_def.cx9a2nofpw_c8r32
499	5715	0	0.0	62.4	2.4	0.000	0.000	0.125	4.977	23371	13.9	4.089	195	12.9	38.8	1.0	0.002	5720	5608	pg163_def.cx9a2nofpwvic_c8r32
qr1000.L5
qr1000.L5: range queries with 1000 insert/s per client. Graphs for performance per 1-second interval are here.
Average throughput:
Query response time histogram: each cell has the percentage of responses that take <= the time in the header and max is the max response time in seconds. For max values in the top 25% of the range have a red background and in the bottom 25% of the range have a green background. The red background is not used when the min value is within 80% of the max value.
| dbms | 256us | 1ms | 4ms | 16ms | 64ms | 256ms | 1s | 4s | 16s | gt | max |
|---|---|---|---|---|---|---|---|---|---|---|---|
| pg163_def.cx9a2_c8r32 | 99.999 | nonzero | 0.001 | nonzero | 0.013 | ||||||
| pg163_def.cx9a2vic_c8r32 | 99.975 | 0.024 | 0.001 | nonzero | 0.013 | ||||||
| pg163_def.cx9a2nofpw_c8r32 | 99.999 | nonzero | 0.001 | nonzero | 0.013 | ||||||
| pg163_def.cx9a2nofpwvic_c8r32 | 99.975 | 0.024 | 0.001 | nonzero | 0.012 |
Insert response time histogram: each cell has the percentage of responses that take <= the time in the header and max is the max response time in seconds. For max values in the top 25% of the range have a red background and in the bottom 25% of the range have a green background. The red background is not used when the min value is within 80% of the max value.
| dbms | 256us | 1ms | 4ms | 16ms | 64ms | 256ms | 1s | 4s | 16s | gt | max |
|---|---|---|---|---|---|---|---|---|---|---|---|
| pg163_def.cx9a2_c8r32 | 37.297 | 62.700 | 0.003 | 0.006 | |||||||
| pg163_def.cx9a2vic_c8r32 | 5.826 | 94.171 | 0.003 | 0.006 | |||||||
| pg163_def.cx9a2nofpw_c8r32 | 46.986 | 53.012 | 0.001 | 0.005 | |||||||
| pg163_def.cx9a2nofpwvic_c8r32 | 6.207 | 93.790 | 0.003 | 0.005 |
Delete response time histogram: each cell has the percentage of responses that take <= the time in the header and max is the max response time in seconds. For max values in the top 25% of the range have a red background and in the bottom 25% of the range have a green background. The red background is not used when the min value is within 80% of the max value.
| dbms | 256us | 1ms | 4ms | 16ms | 64ms | 256ms | 1s | 4s | 16s | gt | max |
|---|---|---|---|---|---|---|---|---|---|---|---|
| pg163_def.cx9a2_c8r32 | 9.986 | 41.219 | 48.793 | 0.001 | 0.021 | ||||||
| pg163_def.cx9a2vic_c8r32 | 8.072 | 39.265 | 52.661 | 0.001 | 0.019 | ||||||
| pg163_def.cx9a2nofpw_c8r32 | 9.818 | 41.086 | 49.094 | 0.001 | 0.020 | ||||||
| pg163_def.cx9a2nofpwvic_c8r32 | 7.931 | 39.103 | 52.965 | 0.001 | 0.019 |
Performance metrics for the DBMS listed above. Some are normalized by throughput, others are not. Legend for results is here.
ips	qps	rps	rmbps	wps	wmbps	rpq	rkbpq	wpi	wkbpi	csps	cpups	cspq	cpupq	dbgb1	dbgb2	rss	maxop	p50	p99	tag
999	14083	0	0.0	75.8	4.8	0.000	0.000	0.076	4.917	54368	14.0	3.861	80	12.9	32.9	3.0	0.013	13937	12722	pg163_def.cx9a2_c8r32
999	13361	0	0.0	75.4	4.8	0.000	0.000	0.075	4.913	51575	13.1	3.860	78	13.0	33.0	11.9	0.013	13318	12098	pg163_def.cx9a2vic_c8r32
999	13889	0	0.0	58.4	2.9	0.000	0.000	0.059	2.987	53638	13.9	3.862	80	12.9	39.2	3.0	0.013	13745	12530	pg163_def.cx9a2nofpw_c8r32
999	13482	0	0.0	58.1	2.9	0.000	0.000	0.058	2.984	52046	13.1	3.860	78	13.0	37.6	10.7	0.012	13470	12239	pg163_def.cx9a2nofpwvic_c8r32
qp1000.L6
qp1000.L6: point queries with 1000 insert/s per client. Graphs for performance per 1-second interval are here.
Average throughput:
Query response time histogram: each cell has the percentage of responses that take <= the time in the header and max is the max response time in seconds. For max values in the top 25% of the range have a red background and in the bottom 25% of the range have a green background. The red background is not used when the min value is within 80% of the max value.
| dbms | 256us | 1ms | 4ms | 16ms | 64ms | 256ms | 1s | 4s | 16s | gt | max |
|---|---|---|---|---|---|---|---|---|---|---|---|
| pg163_def.cx9a2_c8r32 | 99.956 | 0.044 | nonzero | nonzero | nonzero | 0.033 | |||||
| pg163_def.cx9a2vic_c8r32 | 95.744 | 4.256 | nonzero | 0.002 | |||||||
| pg163_def.cx9a2nofpw_c8r32 | 99.950 | 0.050 | nonzero | 0.002 | |||||||
| pg163_def.cx9a2nofpwvic_c8r32 | 95.866 | 4.133 | nonzero | 0.002 |
Insert response time histogram: each cell has the percentage of responses that take <= the time in the header and max is the max response time in seconds. For max values in the top 25% of the range have a red background and in the bottom 25% of the range have a green background. The red background is not used when the min value is within 80% of the max value.
| dbms | 256us | 1ms | 4ms | 16ms | 64ms | 256ms | 1s | 4s | 16s | gt | max |
|---|---|---|---|---|---|---|---|---|---|---|---|
| pg163_def.cx9a2_c8r32 | 18.249 | 81.742 | 0.006 | 0.004 | 0.022 | ||||||
| pg163_def.cx9a2vic_c8r32 | 2.939 | 97.051 | 0.006 | 0.004 | 0.019 | ||||||
| pg163_def.cx9a2nofpw_c8r32 | 24.672 | 75.326 | 0.001 | 0.005 | |||||||
| pg163_def.cx9a2nofpwvic_c8r32 | 2.192 | 97.806 | 0.003 | 0.005 |
Delete response time histogram: each cell has the percentage of responses that take <= the time in the header and max is the max response time in seconds. For max values in the top 25% of the range have a red background and in the bottom 25% of the range have a green background. The red background is not used when the min value is within 80% of the max value.
| dbms | 256us | 1ms | 4ms | 16ms | 64ms | 256ms | 1s | 4s | 16s | gt | max |
|---|---|---|---|---|---|---|---|---|---|---|---|
| pg163_def.cx9a2_c8r32 | 4.849 | 62.714 | 32.435 | 0.003 | 0.019 | ||||||
| pg163_def.cx9a2vic_c8r32 | 4.144 | 52.789 | 43.064 | 0.003 | 0.018 | ||||||
| pg163_def.cx9a2nofpw_c8r32 | 4.789 | 62.149 | 33.062 | 0.009 | |||||||
| pg163_def.cx9a2nofpwvic_c8r32 | 4.131 | 53.144 | 42.725 | 0.009 |
Performance metrics for the DBMS listed above. Some are normalized by throughput, others are not. Legend for results is here.
ips	qps	rps	rmbps	wps	wmbps	rpq	rkbpq	wpi	wkbpi	csps	cpups	cspq	cpupq	dbgb1	dbgb2	rss	maxop	p50	p99	tag
999	6268	0	0.0	57.7	4.8	0.000	0.000	0.058	4.967	25846	14.4	4.123	184	12.9	32.9	6.4	0.033	6268	6153	pg163_def.cx9a2_c8r32
999	5642	0	0.0	57.4	4.8	0.000	0.000	0.057	4.968	23321	14.6	4.133	207	13.0	33.0	6.4	0.002	5642	5530	pg163_def.cx9a2vic_c8r32
999	6140	0	0.0	41.6	3.1	0.000	0.000	0.042	3.194	25312	14.4	4.123	188	13.0	37.6	10.6	0.002	6137	6073	pg163_def.cx9a2nofpw_c8r32
999	5714	0	0.0	41.3	3.1	0.000	0.000	0.041	3.174	23596	14.6	4.130	204	13.0	35.9	6.4	0.002	5720	5594	pg163_def.cx9a2nofpwvic_c8r32
l.i0
l.i0: load without secondary indexes
Performance metrics for all DBMS, not just the ones listed above. Some are normalized by throughput, others are not. Legend for results is here.
ips	qps	rps	rmbps	wps	wmbps	rpq	rkbpq	wpi	wkbpi	csps	cpups	cspq	cpupq	dbgb1	dbgb2	rss	maxop	p50	p99	tag
149254	0	0	0.0	552.7	63.4	0.000	0.000	0.004	0.435	18645	22.5	0.125	12	4.8	13.0	0.4	0.002	149938	148637	pg163_def.cx9a2_c8r32
138504	0	0	0.0	517.2	59.6	0.000	0.000	0.004	0.440	17375	21.1	0.125	12	4.8	13.0	0.0	0.003	139051	137580	pg163_def.cx9a2vic_c8r32
149700	0	0	0.0	552.8	63.4	0.000	0.000	0.004	0.434	18581	22.6	0.124	12	4.8	13.0	0.4	0.002	149939	148737	pg163_def.cx9a2nofpw_c8r32
137741	0	0	0.0	512.1	58.9	0.000	0.000	0.004	0.438	17194	20.9	0.125	12	4.8	13.0	0.4	0.002	137652	136246	pg163_def.cx9a2nofpwvic_c8r32
l.x
l.x: create secondary indexes
Performance metrics for all DBMS, not just the ones listed above. Some are normalized by throughput, others are not. Legend for results is here.
ips	qps	rps	rmbps	wps	wmbps	rpq	rkbpq	wpi	wkbpi	csps	cpups	cspq	cpupq	dbgb1	dbgb2	rss	maxop	p50	p99	tag
384616	0	0	0.0	961.3	118.8	0.000	0.000	0.002	0.316	678	11.7	0.002	2	9.6	22.2	5.0	0.002	NA	NA	pg163_def.cx9a2_c8r32
378789	0	0	0.0	951.9	117.7	0.000	0.000	0.003	0.318	637	11.3	0.002	2	9.6	22.2	5.0	0.002	NA	NA	pg163_def.cx9a2vic_c8r32
381680	0	0	0.0	959.3	118.6	0.000	0.000	0.003	0.318	609	11.8	0.002	2	9.6	22.2	5.0	0.002	NA	NA	pg163_def.cx9a2nofpw_c8r32
378789	0	0	0.0	917.6	113.5	0.000	0.000	0.002	0.307	545	11.6	0.001	2	9.6	22.2	5.0	0.002	NA	NA	pg163_def.cx9a2nofpwvic_c8r32
l.i1
l.i1: continue load after secondary indexes created with 50 inserts per transaction
Performance metrics for all DBMS, not just the ones listed above. Some are normalized by throughput, others are not. Legend for results is here.
ips	qps	rps	rmbps	wps	wmbps	rpq	rkbpq	wpi	wkbpi	csps	cpups	cspq	cpupq	dbgb1	dbgb2	rss	maxop	p50	p99	tag
12862	0	0	0.0	185.7	20.4	0.000	0.000	0.014	1.625	6894	18.8	0.536	117	12.3	48.9	11.0	0.020	9043	6296	pg163_def.cx9a2_c8r32
10968	0	0	0.0	172.6	18.0	0.000	0.000	0.016	1.685	5711	20.1	0.521	147	12.2	45.6	8.8	0.005	8141	5647	pg163_def.cx9a2vic_c8r32
12357	0	0	0.0	148.0	16.0	0.000	0.000	0.012	1.322	6546	18.4	0.530	119	12.3	42.7	9.6	0.011	8491	4547	pg163_def.cx9a2nofpw_c8r32
11624	0	0	0.0	148.3	15.0	0.000	0.000	0.013	1.322	5983	20.8	0.515	143	12.2	41.5	9.7	0.014	9439	6243	pg163_def.cx9a2nofpwvic_c8r32
l.i2
l.i2: continue load after secondary indexes created with 5 inserts per transaction
Performance metrics for all DBMS, not just the ones listed above. Some are normalized by throughput, others are not. Legend for results is here.
ips	qps	rps	rmbps	wps	wmbps	rpq	rkbpq	wpi	wkbpi	csps	cpups	cspq	cpupq	dbgb1	dbgb2	rss	maxop	p50	p99	tag
1409	0	0	0.0	62.3	5.7	0.000	0.000	0.044	4.144	6882	14.4	4.884	817	12.7	46.7	0.1	0.005	1034	744	pg163_def.cx9a2_c8r32
1237	0	0	0.0	64.1	5.2	0.000	0.000	0.052	4.286	5839	15.7	4.718	1015	12.6	44.7	11.8	0.002	964	644	pg163_def.cx9a2vic_c8r32
1407	0	0	0.0	47.8	3.8	0.000	0.000	0.034	2.786	6874	14.4	4.886	819	12.7	43.1	0.8	0.002	1059	739	pg163_def.cx9a2nofpw_c8r32
1278	0	0	0.0	40.5	3.8	0.000	0.000	0.032	3.013	6022	15.8	4.712	989	12.6	42.0	0.4	0.002	945	654	pg163_def.cx9a2nofpwvic_c8r32
qr100.L1
qr100.L1: range queries with 100 insert/s per client
Performance metrics for all DBMS, not just the ones listed above. Some are normalized by throughput, others are not. Legend for results is here.
ips	qps	rps	rmbps	wps	wmbps	rpq	rkbpq	wpi	wkbpi	csps	cpups	cspq	cpupq	dbgb1	dbgb2	rss	maxop	p50	p99	tag
100	15493	0	0.0	52.1	1.4	0.000	0.000	0.522	14.811	59342	12.8	3.830	66	12.7	42.8	0.5	0.002	15503	15183	pg163_def.cx9a2_c8r32
100	14466	0	0.0	51.9	1.4	0.000	0.000	0.520	14.864	55423	11.2	3.831	62	12.7	39.0	0.5	0.005	14351	13997	pg163_def.cx9a2vic_c8r32
100	15349	0	0.0	46.0	0.6	0.000	0.000	0.461	6.572	58812	12.8	3.832	67	12.7	41.8	0.5	0.002	15343	15039	pg163_def.cx9a2nofpw_c8r32
100	14388	0	0.0	45.9	0.6	0.000	0.000	0.460	6.622	55106	11.2	3.830	62	12.7	40.1	0.5	0.001	14220	13917	pg163_def.cx9a2nofpwvic_c8r32
qp100.L2
qp100.L2: point queries with 100 insert/s per client
Performance metrics for all DBMS, not just the ones listed above. Some are normalized by throughput, others are not. Legend for results is here.
ips	qps	rps	rmbps	wps	wmbps	rpq	rkbpq	wpi	wkbpi	csps	cpups	cspq	cpupq	dbgb1	dbgb2	rss	maxop	p50	p99	tag
100	6240	0	0.0	84.3	1.8	0.000	0.000	0.844	18.825	25342	13.4	4.062	172	12.7	39.8	0.4	0.002	6233	6153	pg163_def.cx9a2_c8r32
100	5765	0	0.0	84.0	1.8	0.000	0.000	0.842	18.898	23444	13.0	4.067	180	12.7	36.1	0.5	0.002	5769	5658	pg163_def.cx9a2vic_c8r32
100	6200	0	0.0	78.4	1.0	0.000	0.000	0.785	10.544	25177	13.4	4.061	173	12.7	41.7	3.0	0.003	6201	6137	pg163_def.cx9a2nofpw_c8r32
100	5749	0	0.0	78.1	1.0	0.000	0.000	0.783	10.581	23373	13.0	4.066	181	12.7	40.0	0.5	0.001	5753	5631	pg163_def.cx9a2nofpwvic_c8r32
qr500.L3
qr500.L3: range queries with 500 insert/s per client
Performance metrics for all DBMS, not just the ones listed above. Some are normalized by throughput, others are not. Legend for results is here.
ips	qps	rps	rmbps	wps	wmbps	rpq	rkbpq	wpi	wkbpi	csps	cpups	cspq	cpupq	dbgb1	dbgb2	rss	maxop	p50	p99	tag
499	13769	0	0.0	89.5	4.4	0.000	0.000	0.179	9.008	52919	13.3	3.843	77	12.8	35.4	2.2	0.019	13729	12786	pg163_def.cx9a2_c8r32
499	13113	0	0.0	89.5	4.4	0.000	0.000	0.179	9.045	50385	12.1	3.842	74	12.9	32.9	10.0	0.025	13073	12130	pg163_def.cx9a2vic_c8r32
499	13364	0	0.0	68.0	1.9	0.000	0.000	0.136	3.972	51362	13.2	3.843	79	12.8	41.3	10.5	0.005	13345	12435	pg163_def.cx9a2nofpw_c8r32
499	13099	0	0.0	67.9	2.0	0.000	0.000	0.136	4.015	50343	12.2	3.843	75	12.9	39.7	6.1	0.005	13065	12146	pg163_def.cx9a2nofpwvic_c8r32
qp500.L4
qp500.L4: point queries with 500 insert/s per client
Performance metrics for all DBMS, not just the ones listed above. Some are normalized by throughput, others are not. Legend for results is here.
ips	qps	rps	rmbps	wps	wmbps	rpq	rkbpq	wpi	wkbpi	csps	cpups	cspq	cpupq	dbgb1	dbgb2	rss	maxop	p50	p99	tag
499	6191	0	0.0	70.6	3.3	0.000	0.000	0.141	6.801	25286	13.7	4.084	177	12.8	32.9	0.8	0.002	6185	6108	pg163_def.cx9a2_c8r32
499	5729	0	0.0	70.2	3.3	0.000	0.000	0.141	6.810	23427	13.8	4.089	193	12.9	32.9	6.1	0.002	5736	5614	pg163_def.cx9a2vic_c8r32
499	6135	0	0.0	62.7	2.4	0.000	0.000	0.126	4.946	25057	13.5	4.084	176	12.8	40.4	6.1	0.002	6137	6057	pg163_def.cx9a2nofpw_c8r32
499	5715	0	0.0	62.4	2.4	0.000	0.000	0.125	4.977	23371	13.9	4.089	195	12.9	38.8	1.0	0.002	5720	5608	pg163_def.cx9a2nofpwvic_c8r32
qr1000.L5
qr1000.L5: range queries with 1000 insert/s per client
Performance metrics for all DBMS, not just the ones listed above. Some are normalized by throughput, others are not. Legend for results is here.
ips	qps	rps	rmbps	wps	wmbps	rpq	rkbpq	wpi	wkbpi	csps	cpups	cspq	cpupq	dbgb1	dbgb2	rss	maxop	p50	p99	tag
999	14083	0	0.0	75.8	4.8	0.000	0.000	0.076	4.917	54368	14.0	3.861	80	12.9	32.9	3.0	0.013	13937	12722	pg163_def.cx9a2_c8r32
999	13361	0	0.0	75.4	4.8	0.000	0.000	0.075	4.913	51575	13.1	3.860	78	13.0	33.0	11.9	0.013	13318	12098	pg163_def.cx9a2vic_c8r32
999	13889	0	0.0	58.4	2.9	0.000	0.000	0.059	2.987	53638	13.9	3.862	80	12.9	39.2	3.0	0.013	13745	12530	pg163_def.cx9a2nofpw_c8r32
999	13482	0	0.0	58.1	2.9	0.000	0.000	0.058	2.984	52046	13.1	3.860	78	13.0	37.6	10.7	0.012	13470	12239	pg163_def.cx9a2nofpwvic_c8r32
qp1000.L6
qp1000.L6: point queries with 1000 insert/s per client
Performance metrics for all DBMS, not just the ones listed above. Some are normalized by throughput, others are not. Legend for results is here.
ips	qps	rps	rmbps	wps	wmbps	rpq	rkbpq	wpi	wkbpi	csps	cpups	cspq	cpupq	dbgb1	dbgb2	rss	maxop	p50	p99	tag
999	6268	0	0.0	57.7	4.8	0.000	0.000	0.058	4.967	25846	14.4	4.123	184	12.9	32.9	6.4	0.033	6268	6153	pg163_def.cx9a2_c8r32
999	5642	0	0.0	57.4	4.8	0.000	0.000	0.057	4.968	23321	14.6	4.133	207	13.0	33.0	6.4	0.002	5642	5530	pg163_def.cx9a2vic_c8r32
999	6140	0	0.0	41.6	3.1	0.000	0.000	0.042	3.194	25312	14.4	4.123	188	13.0	37.6	10.6	0.002	6137	6073	pg163_def.cx9a2nofpw_c8r32
999	5714	0	0.0	41.3	3.1	0.000	0.000	0.041	3.174	23596	14.6	4.130	204	13.0	35.9	6.4	0.002	5720	5594	pg163_def.cx9a2nofpwvic_c8r32
l.i0
- l.i0: load without secondary indexes
- Legend for results is here.
- Each entry lists the percentage of responses that fit in that bucket (slower than max time for previous bucket, faster than min time for next bucket).
Insert response time histogram
256us	1ms	4ms	16ms	64ms	256ms	1s	4s	16s	gt	max	tag
0.000	99.929	0.071	0.000	0.000	0.000	0.000	0.000	0.000	0.000	0.002	pg163_def.cx9a2_c8r32
0.000	99.917	0.083	0.000	0.000	0.000	0.000	0.000	0.000	0.000	0.003	pg163_def.cx9a2vic_c8r32
0.000	99.935	0.065	0.000	0.000	0.000	0.000	0.000	0.000	0.000	0.002	pg163_def.cx9a2nofpw_c8r32
0.000	99.916	0.084	0.000	0.000	0.000	0.000	0.000	0.000	0.000	0.002	pg163_def.cx9a2nofpwvic_c8r32
l.x
- l.x: create secondary indexes
- Legend for results is here.
- Each entry lists the percentage of responses that fit in that bucket (slower than max time for previous bucket, faster than min time for next bucket).
TODO - determine whether there is data for create index response time
l.i1
- l.i1: continue load after secondary indexes created with 50 inserts per transaction
- Legend for results is here.
- Each entry lists the percentage of responses that fit in that bucket (slower than max time for previous bucket, faster than min time for next bucket).
Insert response time histogram
256us	1ms	4ms	16ms	64ms	256ms	1s	4s	16s	gt	max	tag
0.000	21.577	78.417	0.005	0.002	0.000	0.000	0.000	0.000	0.000	0.020	pg163_def.cx9a2_c8r32
0.000	3.209	96.790	nonzero	0.000	0.000	0.000	0.000	0.000	0.000	0.005	pg163_def.cx9a2vic_c8r32
0.000	21.313	78.687	nonzero	0.000	0.000	0.000	0.000	0.000	0.000	0.011	pg163_def.cx9a2nofpw_c8r32
0.000	1.165	98.835	nonzero	0.000	0.000	0.000	0.000	0.000	0.000	0.014	pg163_def.cx9a2nofpwvic_c8r32
Delete response time histogram
256us	1ms	4ms	16ms	64ms	256ms	1s	4s	16s	gt	max	tag
0.000	14.850	30.126	55.022	0.002	0.000	0.000	0.000	0.000	0.000	0.020	pg163_def.cx9a2_c8r32
0.000	12.356	25.048	62.595	nonzero	0.000	0.000	0.000	0.000	0.000	0.017	pg163_def.cx9a2vic_c8r32
0.000	14.841	37.942	47.217	0.000	0.000	0.000	0.000	0.000	0.000	0.012	pg163_def.cx9a2nofpw_c8r32
0.000	12.283	34.437	53.279	0.000	0.000	0.000	0.000	0.000	0.000	0.015	pg163_def.cx9a2nofpwvic_c8r32
l.i2
- l.i2: continue load after secondary indexes created with 5 inserts per transaction
- Legend for results is here.
- Each entry lists the percentage of responses that fit in that bucket (slower than max time for previous bucket, faster than min time for next bucket).
Insert response time histogram
256us	1ms	4ms	16ms	64ms	256ms	1s	4s	16s	gt	max	tag
26.040	73.960	0.001	nonzero	0.000	0.000	0.000	0.000	0.000	0.000	0.005	pg163_def.cx9a2_c8r32
16.798	83.201	0.001	0.000	0.000	0.000	0.000	0.000	0.000	0.000	0.002	pg163_def.cx9a2vic_c8r32
24.055	75.944	0.001	0.000	0.000	0.000	0.000	0.000	0.000	0.000	0.002	pg163_def.cx9a2nofpw_c8r32
12.687	87.311	0.002	0.000	0.000	0.000	0.000	0.000	0.000	0.000	0.002	pg163_def.cx9a2nofpwvic_c8r32
Delete response time histogram
256us	1ms	4ms	16ms	64ms	256ms	1s	4s	16s	gt	max	tag
0.875	16.652	33.451	49.022	0.000	0.000	0.000	0.000	0.000	0.000	0.013	pg163_def.cx9a2_c8r32
1.225	14.178	33.774	50.824	nonzero	0.000	0.000	0.000	0.000	0.000	0.016	pg163_def.cx9a2vic_c8r32
0.628	16.615	35.695	47.062	0.000	0.000	0.000	0.000	0.000	0.000	0.010	pg163_def.cx9a2nofpw_c8r32
0.697	8.625	45.605	45.073	nonzero	0.000	0.000	0.000	0.000	0.000	0.018	pg163_def.cx9a2nofpwvic_c8r32
qr100.L1
- qr100.L1: range queries with 100 insert/s per client
- Legend for results is here.
- Each entry lists the percentage of responses that fit in that bucket (slower than max time for previous bucket, faster than min time for next bucket).
Query response time histogram
256us	1ms	4ms	16ms	64ms	256ms	1s	4s	16s	gt	max	tag
100.000	nonzero	nonzero	0.000	0.000	0.000	0.000	0.000	0.000	0.000	0.002	pg163_def.cx9a2_c8r32
99.981	0.019	nonzero	nonzero	0.000	0.000	0.000	0.000	0.000	0.000	0.005	pg163_def.cx9a2vic_c8r32
100.000	nonzero	nonzero	0.000	0.000	0.000	0.000	0.000	0.000	0.000	0.002	pg163_def.cx9a2nofpw_c8r32
99.981	0.019	nonzero	0.000	0.000	0.000	0.000	0.000	0.000	0.000	0.001	pg163_def.cx9a2nofpwvic_c8r32
Insert response time histogram
256us	1ms	4ms	16ms	64ms	256ms	1s	4s	16s	gt	max	tag
0.000	0.000	99.972	0.028	0.000	0.000	0.000	0.000	0.000	0.000	0.006	pg163_def.cx9a2_c8r32
0.000	0.000	99.972	0.028	0.000	0.000	0.000	0.000	0.000	0.000	0.006	pg163_def.cx9a2vic_c8r32
0.000	10.819	89.167	0.014	0.000	0.000	0.000	0.000	0.000	0.000	0.005	pg163_def.cx9a2nofpw_c8r32
0.000	0.000	99.972	0.028	0.000	0.000	0.000	0.000	0.000	0.000	0.005	pg163_def.cx9a2nofpwvic_c8r32
Delete response time histogram
256us	1ms	4ms	16ms	64ms	256ms	1s	4s	16s	gt	max	tag
0.000	24.222	75.778	0.000	0.000	0.000	0.000	0.000	0.000	0.000	0.004	pg163_def.cx9a2_c8r32
0.000	22.236	77.764	0.000	0.000	0.000	0.000	0.000	0.000	0.000	0.004	pg163_def.cx9a2vic_c8r32
0.000	29.403	70.597	0.000	0.000	0.000	0.000	0.000	0.000	0.000	0.003	pg163_def.cx9a2nofpw_c8r32
0.000	22.292	77.708	0.000	0.000	0.000	0.000	0.000	0.000	0.000	0.003	pg163_def.cx9a2nofpwvic_c8r32
qp100.L2
- qp100.L2: point queries with 100 insert/s per client
- Legend for results is here.
- Each entry lists the percentage of responses that fit in that bucket (slower than max time for previous bucket, faster than min time for next bucket).
Query response time histogram
256us	1ms	4ms	16ms	64ms	256ms	1s	4s	16s	gt	max	tag
99.985	0.015	nonzero	0.000	0.000	0.000	0.000	0.000	0.000	0.000	0.002	pg163_def.cx9a2_c8r32
95.923	4.077	nonzero	0.000	0.000	0.000	0.000	0.000	0.000	0.000	0.002	pg163_def.cx9a2vic_c8r32
99.986	0.014	nonzero	0.000	0.000	0.000	0.000	0.000	0.000	0.000	0.003	pg163_def.cx9a2nofpw_c8r32
95.828	4.172	nonzero	0.000	0.000	0.000	0.000	0.000	0.000	0.000	0.001	pg163_def.cx9a2nofpwvic_c8r32
Insert response time histogram
256us	1ms	4ms	16ms	64ms	256ms	1s	4s	16s	gt	max	tag
0.000	0.000	99.972	0.028	0.000	0.000	0.000	0.000	0.000	0.000	0.006	pg163_def.cx9a2_c8r32
0.000	0.000	99.972	0.028	0.000	0.000	0.000	0.000	0.000	0.000	0.005	pg163_def.cx9a2vic_c8r32
0.000	0.000	99.986	0.014	0.000	0.000	0.000	0.000	0.000	0.000	0.005	pg163_def.cx9a2nofpw_c8r32
0.000	0.000	99.972	0.028	0.000	0.000	0.000	0.000	0.000	0.000	0.005	pg163_def.cx9a2nofpwvic_c8r32
Delete response time histogram
256us	1ms	4ms	16ms	64ms	256ms	1s	4s	16s	gt	max	tag
0.000	0.000	92.028	7.972	0.000	0.000	0.000	0.000	0.000	0.000	0.011	pg163_def.cx9a2_c8r32
0.000	0.000	95.764	4.236	0.000	0.000	0.000	0.000	0.000	0.000	0.011	pg163_def.cx9a2vic_c8r32
0.000	0.000	97.028	2.972	0.000	0.000	0.000	0.000	0.000	0.000	0.011	pg163_def.cx9a2nofpw_c8r32
0.000	0.000	96.625	3.375	0.000	0.000	0.000	0.000	0.000	0.000	0.011	pg163_def.cx9a2nofpwvic_c8r32
qr500.L3
- qr500.L3: range queries with 500 insert/s per client
- Legend for results is here.
- Each entry lists the percentage of responses that fit in that bucket (slower than max time for previous bucket, faster than min time for next bucket).
Query response time histogram
256us	1ms	4ms	16ms	64ms	256ms	1s	4s	16s	gt	max	tag
99.999	0.001	nonzero	nonzero	nonzero	0.000	0.000	0.000	0.000	0.000	0.019	pg163_def.cx9a2_c8r32
99.980	0.020	nonzero	nonzero	nonzero	0.000	0.000	0.000	0.000	0.000	0.025	pg163_def.cx9a2vic_c8r32
99.999	0.001	nonzero	nonzero	0.000	0.000	0.000	0.000	0.000	0.000	0.005	pg163_def.cx9a2nofpw_c8r32
99.981	0.019	nonzero	nonzero	0.000	0.000	0.000	0.000	0.000	0.000	0.005	pg163_def.cx9a2nofpwvic_c8r32
Insert response time histogram
256us	1ms	4ms	16ms	64ms	256ms	1s	4s	16s	gt	max	tag
0.000	15.250	84.697	0.036	0.017	0.000	0.000	0.000	0.000	0.000	0.032	pg163_def.cx9a2_c8r32
0.000	0.311	99.639	0.017	0.033	0.000	0.000	0.000	0.000	0.000	0.027	pg163_def.cx9a2vic_c8r32
0.000	43.969	56.025	0.006	0.000	0.000	0.000	0.000	0.000	0.000	0.005	pg163_def.cx9a2nofpw_c8r32
0.000	0.742	99.253	0.006	0.000	0.000	0.000	0.000	0.000	0.000	0.005	pg163_def.cx9a2nofpwvic_c8r32
Delete response time histogram
256us	1ms	4ms	16ms	64ms	256ms	1s	4s	16s	gt	max	tag
0.000	0.806	30.686	68.489	0.019	0.000	0.000	0.000	0.000	0.000	0.021	pg163_def.cx9a2_c8r32
0.000	0.947	27.172	71.850	0.031	0.000	0.000	0.000	0.000	0.000	0.026	pg163_def.cx9a2vic_c8r32
0.000	1.022	32.097	66.881	0.000	0.000	0.000	0.000	0.000	0.000	0.015	pg163_def.cx9a2nofpw_c8r32
0.000	0.583	26.950	72.467	0.000	0.000	0.000	0.000	0.000	0.000	0.014	pg163_def.cx9a2nofpwvic_c8r32
qp500.L4
- qp500.L4: point queries with 500 insert/s per client
- Legend for results is here.
- Each entry lists the percentage of responses that fit in that bucket (slower than max time for previous bucket, faster than min time for next bucket).
Query response time histogram
256us	1ms	4ms	16ms	64ms	256ms	1s	4s	16s	gt	max	tag
99.971	0.029	nonzero	0.000	0.000	0.000	0.000	0.000	0.000	0.000	0.002	pg163_def.cx9a2_c8r32
95.887	4.113	nonzero	0.000	0.000	0.000	0.000	0.000	0.000	0.000	0.002	pg163_def.cx9a2vic_c8r32
99.970	0.030	nonzero	0.000	0.000	0.000	0.000	0.000	0.000	0.000	0.002	pg163_def.cx9a2nofpw_c8r32
95.833	4.167	nonzero	0.000	0.000	0.000	0.000	0.000	0.000	0.000	0.002	pg163_def.cx9a2nofpwvic_c8r32
Insert response time histogram
256us	1ms	4ms	16ms	64ms	256ms	1s	4s	16s	gt	max	tag
0.000	12.017	87.981	0.003	0.000	0.000	0.000	0.000	0.000	0.000	0.006	pg163_def.cx9a2_c8r32
0.000	0.339	99.656	0.006	0.000	0.000	0.000	0.000	0.000	0.000	0.006	pg163_def.cx9a2vic_c8r32
0.000	19.944	80.053	0.003	0.000	0.000	0.000	0.000	0.000	0.000	0.006	pg163_def.cx9a2nofpw_c8r32
0.000	0.669	99.325	0.006	0.000	0.000	0.000	0.000	0.000	0.000	0.006	pg163_def.cx9a2nofpwvic_c8r32
Delete response time histogram
256us	1ms	4ms	16ms	64ms	256ms	1s	4s	16s	gt	max	tag
0.000	8.794	63.700	27.506	0.000	0.000	0.000	0.000	0.000	0.000	0.007	pg163_def.cx9a2_c8r32
0.000	6.619	58.542	34.839	0.000	0.000	0.000	0.000	0.000	0.000	0.007	pg163_def.cx9a2vic_c8r32
0.000	8.839	62.858	28.303	0.000	0.000	0.000	0.000	0.000	0.000	0.007	pg163_def.cx9a2nofpw_c8r32
0.000	7.108	59.044	33.847	0.000	0.000	0.000	0.000	0.000	0.000	0.007	pg163_def.cx9a2nofpwvic_c8r32
qr1000.L5
- qr1000.L5: range queries with 1000 insert/s per client
- Legend for results is here.
- Each entry lists the percentage of responses that fit in that bucket (slower than max time for previous bucket, faster than min time for next bucket).
Query response time histogram
256us	1ms	4ms	16ms	64ms	256ms	1s	4s	16s	gt	max	tag
99.999	nonzero	0.001	nonzero	0.000	0.000	0.000	0.000	0.000	0.000	0.013	pg163_def.cx9a2_c8r32
99.975	0.024	0.001	nonzero	0.000	0.000	0.000	0.000	0.000	0.000	0.013	pg163_def.cx9a2vic_c8r32
99.999	nonzero	0.001	nonzero	0.000	0.000	0.000	0.000	0.000	0.000	0.013	pg163_def.cx9a2nofpw_c8r32
99.975	0.024	0.001	nonzero	0.000	0.000	0.000	0.000	0.000	0.000	0.012	pg163_def.cx9a2nofpwvic_c8r32
Insert response time histogram
256us	1ms	4ms	16ms	64ms	256ms	1s	4s	16s	gt	max	tag
0.000	37.297	62.700	0.003	0.000	0.000	0.000	0.000	0.000	0.000	0.006	pg163_def.cx9a2_c8r32
0.000	5.826	94.171	0.003	0.000	0.000	0.000	0.000	0.000	0.000	0.006	pg163_def.cx9a2vic_c8r32
0.000	46.986	53.012	0.001	0.000	0.000	0.000	0.000	0.000	0.000	0.005	pg163_def.cx9a2nofpw_c8r32
0.000	6.207	93.790	0.003	0.000	0.000	0.000	0.000	0.000	0.000	0.005	pg163_def.cx9a2nofpwvic_c8r32
Delete response time histogram
256us	1ms	4ms	16ms	64ms	256ms	1s	4s	16s	gt	max	tag
0.000	9.986	41.219	48.793	0.001	0.000	0.000	0.000	0.000	0.000	0.021	pg163_def.cx9a2_c8r32
0.000	8.072	39.265	52.661	0.001	0.000	0.000	0.000	0.000	0.000	0.019	pg163_def.cx9a2vic_c8r32
0.000	9.818	41.086	49.094	0.001	0.000	0.000	0.000	0.000	0.000	0.020	pg163_def.cx9a2nofpw_c8r32
0.000	7.931	39.103	52.965	0.001	0.000	0.000	0.000	0.000	0.000	0.019	pg163_def.cx9a2nofpwvic_c8r32
qp1000.L6
- qp1000.L6: point queries with 1000 insert/s per client
- Legend for results is here.
- Each entry lists the percentage of responses that fit in that bucket (slower than max time for previous bucket, faster than min time for next bucket).
Query response time histogram
256us	1ms	4ms	16ms	64ms	256ms	1s	4s	16s	gt	max	tag
99.956	0.044	nonzero	nonzero	nonzero	0.000	0.000	0.000	0.000	0.000	0.033	pg163_def.cx9a2_c8r32
95.744	4.256	nonzero	0.000	0.000	0.000	0.000	0.000	0.000	0.000	0.002	pg163_def.cx9a2vic_c8r32
99.950	0.050	nonzero	0.000	0.000	0.000	0.000	0.000	0.000	0.000	0.002	pg163_def.cx9a2nofpw_c8r32
95.866	4.133	nonzero	0.000	0.000	0.000	0.000	0.000	0.000	0.000	0.002	pg163_def.cx9a2nofpwvic_c8r32
Insert response time histogram
256us	1ms	4ms	16ms	64ms	256ms	1s	4s	16s	gt	max	tag
0.000	18.249	81.742	0.006	0.004	0.000	0.000	0.000	0.000	0.000	0.022	pg163_def.cx9a2_c8r32
0.000	2.939	97.051	0.006	0.004	0.000	0.000	0.000	0.000	0.000	0.019	pg163_def.cx9a2vic_c8r32
0.000	24.672	75.326	0.001	0.000	0.000	0.000	0.000	0.000	0.000	0.005	pg163_def.cx9a2nofpw_c8r32
0.000	2.192	97.806	0.003	0.000	0.000	0.000	0.000	0.000	0.000	0.005	pg163_def.cx9a2nofpwvic_c8r32
Delete response time histogram
256us	1ms	4ms	16ms	64ms	256ms	1s	4s	16s	gt	max	tag
0.000	4.849	62.714	32.435	0.003	0.000	0.000	0.000	0.000	0.000	0.019	pg163_def.cx9a2_c8r32
0.000	4.144	52.789	43.064	0.003	0.000	0.000	0.000	0.000	0.000	0.018	pg163_def.cx9a2vic_c8r32
0.000	4.789	62.149	33.062	0.000	0.000	0.000	0.000	0.000	0.000	0.009	pg163_def.cx9a2nofpw_c8r32
0.000	4.131	53.144	42.725	0.000	0.000	0.000	0.000	0.000	0.000	0.009	pg163_def.cx9a2nofpwvic_c8r32