Introduction
This is a report for the insert benchmark with 800M docs and 1 client(s). It is generated by scripts (bash, awk, sed) and Tufte might not be impressed. An overview of the insert benchmark is here and a short update is here. Below, by DBMS, I mean DBMS+version.config. An example is my8020.c10b40 where my means MySQL, 8020 is version 8.0.20 and c10b40 is the name for the configuration file.
The test server has 8 AMD cores, 32G RAM and an NVMe SSD. It is described here as the ASUS PN53. The benchmark was run with 1 client and there were 1 or 3 connections per client (1 for queries or inserts without rate limits, 1+1 for rate limited inserts+deletes). It uses 1 table. It loads 800M rows per table without secondary indexes, creates 3 secondary indexes per table, then inserts 4m+1m rows per table with a delete per insert to avoid growing the table. It then does 6 read+write tests for 1800s each that do queries as fast as possible with 100,100,500,500,1000,1000 inserts/s and the same for deletes/s per client concurrent with the queries. The database is larger than memory. Clients and the DBMS share one server. The per-database configs are in the per-database subdirectories here.
The tested DBMS are:
- ma100433_rel.cz11a_c8r32 - MariaDB 10.4.33
- ma100524_rel.cz11a_c8r32 - MariaDB 10.5.24
- ma100617_rel.cz11a_c8r32 - MariaDB 10.6.17 with the cz11a_c8r32 config that uses innodb_purge_threads=4
- ma100617_rel.cz11apur1_c8r32 - MariaDB 10.6.17 with the cz11apur1_c8r32 config that uses innodb_purge_threads=1
- ma100617_rel_nops.cz11a_c8r32 - MariaDB 10.6.17 with the cz11a_c8r32 config and most perf schema disabled at compile time
- ma100617marko_rel.cz11a_c8r32 - MariaDB 10.6.17 with the cz11a_c8r32 config and the patch from Marko
Contents
- Summary
- l.i0: load without secondary indexes
- l.x: create secondary indexes
- l.i1: continue load after secondary indexes created with 50 inserts per transaction
- l.i2: continue load after secondary indexes created with 5 inserts per transaction
- qr100.L1: range queries with 100 insert/s per client
- qp100.L2: point queries with 100 insert/s per client
- qr500.L3: range queries with 500 insert/s per client
- qp500.L4: point queries with 500 insert/s per client
- qr1000.L5: range queries with 1000 insert/s per client
- qp1000.L6: point queries with 1000 insert/s per client
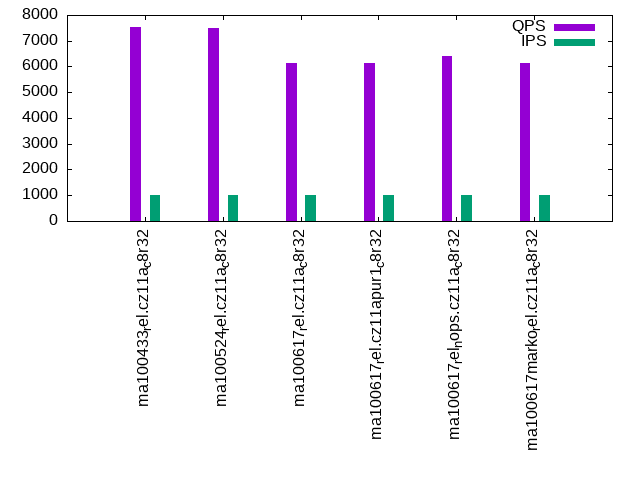
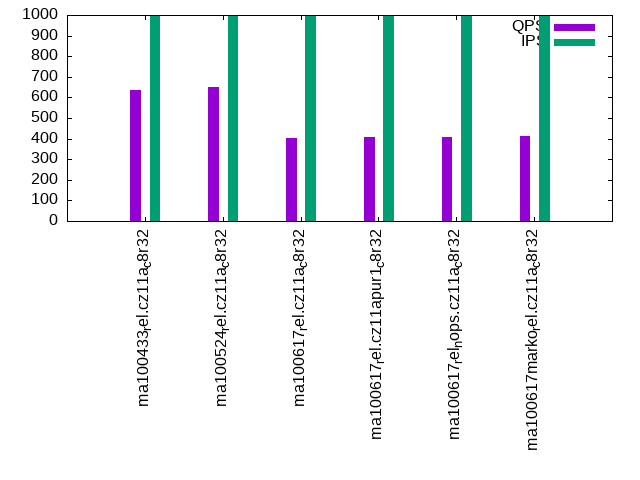
Summary
The numbers are inserts/s for l.i0, l.i1 and l.i2, indexed docs (or rows) /s for l.x and queries/s for qr100, qp100 thru qr1000, qp1000" The values are the average rate over the entire test for inserts (IPS) and queries (QPS). The range of values for IPS and QPS is split into 3 parts: bottom 25%, middle 50%, top 25%. Values in the bottom 25% have a red background, values in the top 25% have a green background and values in the middle have no color. A gray background is used for values that can be ignored because the DBMS did not sustain the target insert rate. Red backgrounds are not used when the minimum value is within 80% of the max value.
| dbms | l.i0 | l.x | l.i1 | l.i2 | qr100 | qp100 | qr500 | qp500 | qr1000 | qp1000 |
|---|---|---|---|---|---|---|---|---|---|---|
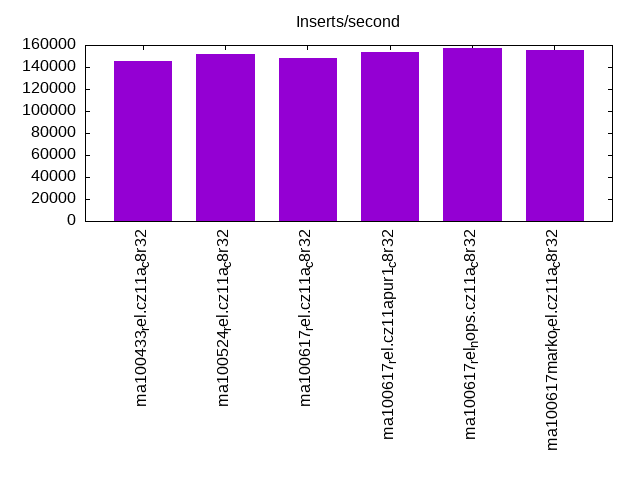
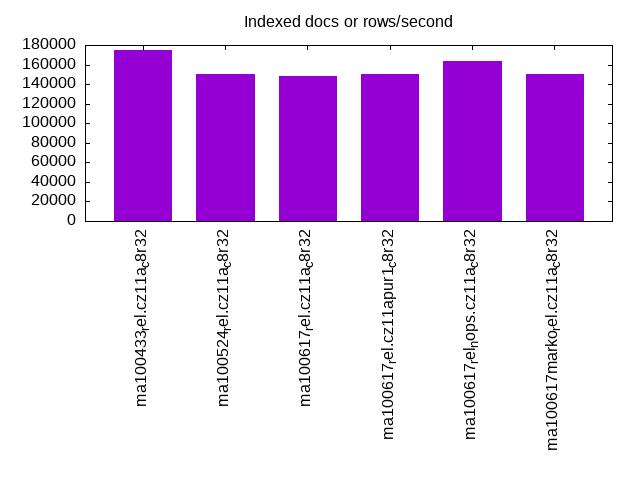
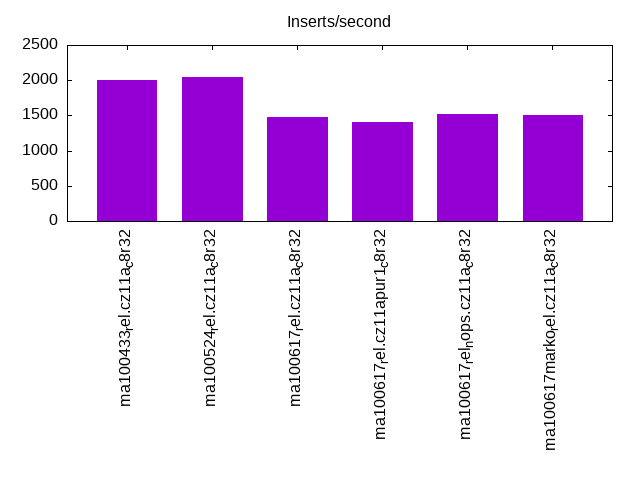
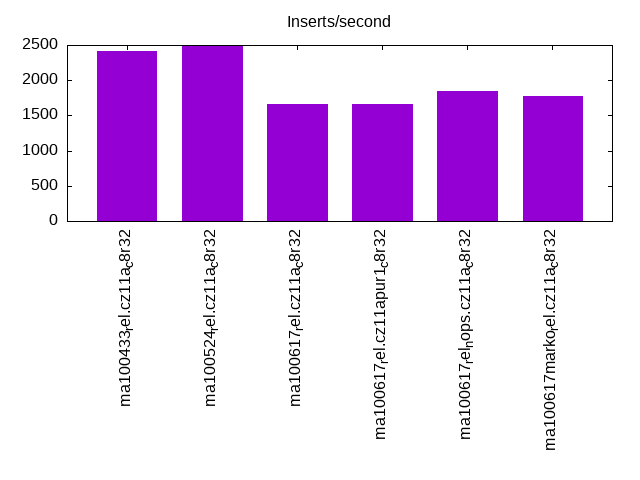
| ma100433_rel.cz11a_c8r32 | 145666 | 175285 | 1998 | 2421 | 7844 | 858 | 7602 | 694 | 7520 | 636 |
| ma100524_rel.cz11a_c8r32 | 151918 | 150517 | 2048 | 2481 | 7823 | 860 | 7635 | 729 | 7476 | 651 |
| ma100617_rel.cz11a_c8r32 | 148561 | 148782 | 1481 | 1664 | 7676 | 772 | 6997 | 537 | 6123 | 404 |
| ma100617_rel.cz11apur1_c8r32 | 153433 | 149925 | 1407 | 1656 | 7704 | 798 | 6924 | 549 | 6117 | 407 |
| ma100617_rel_nops.cz11a_c8r32 | 157325 | 164102 | 1513 | 1852 | 8092 | 798 | 7324 | 552 | 6408 | 410 |
| ma100617marko_rel.cz11a_c8r32 | 155219 | 150009 | 1500 | 1776 | 7637 | 809 | 7004 | 555 | 6141 | 411 |
This table has relative throughput, throughput for the DBMS relative to the DBMS in the first line, using the absolute throughput from the previous table. Values less than 0.95 have a yellow background. Values greater than 1.05 have a blue background.
| dbms | l.i0 | l.x | l.i1 | l.i2 | qr100 | qp100 | qr500 | qp500 | qr1000 | qp1000 |
|---|---|---|---|---|---|---|---|---|---|---|
| ma100433_rel.cz11a_c8r32 | 1.00 | 1.00 | 1.00 | 1.00 | 1.00 | 1.00 | 1.00 | 1.00 | 1.00 | 1.00 |
| ma100524_rel.cz11a_c8r32 | 1.04 | 0.86 | 1.03 | 1.02 | 1.00 | 1.00 | 1.00 | 1.05 | 0.99 | 1.02 |
| ma100617_rel.cz11a_c8r32 | 1.02 | 0.85 | 0.74 | 0.69 | 0.98 | 0.90 | 0.92 | 0.77 | 0.81 | 0.64 |
| ma100617_rel.cz11apur1_c8r32 | 1.05 | 0.86 | 0.70 | 0.68 | 0.98 | 0.93 | 0.91 | 0.79 | 0.81 | 0.64 |
| ma100617_rel_nops.cz11a_c8r32 | 1.08 | 0.94 | 0.76 | 0.76 | 1.03 | 0.93 | 0.96 | 0.80 | 0.85 | 0.64 |
| ma100617marko_rel.cz11a_c8r32 | 1.07 | 0.86 | 0.75 | 0.73 | 0.97 | 0.94 | 0.92 | 0.80 | 0.82 | 0.65 |
This lists the average rate of inserts/s for the tests that do inserts concurrent with queries. For such tests the query rate is listed in the table above. The read+write tests are setup so that the insert rate should match the target rate every second. Cells that are not at least 95% of the target have a red background to indicate a failure to satisfy the target.
| dbms | qr100.L1 | qp100.L2 | qr500.L3 | qp500.L4 | qr1000.L5 | qp1000.L6 |
|---|---|---|---|---|---|---|
| ma100433_rel.cz11a_c8r32 | 100 | 100 | 499 | 499 | 999 | 999 |
| ma100524_rel.cz11a_c8r32 | 100 | 100 | 499 | 499 | 999 | 999 |
| ma100617_rel.cz11a_c8r32 | 100 | 100 | 499 | 499 | 999 | 999 |
| ma100617_rel.cz11apur1_c8r32 | 100 | 100 | 499 | 499 | 999 | 999 |
| ma100617_rel_nops.cz11a_c8r32 | 100 | 100 | 499 | 499 | 999 | 999 |
| ma100617marko_rel.cz11a_c8r32 | 100 | 100 | 499 | 499 | 999 | 999 |
| target | 100 | 100 | 500 | 500 | 1000 | 1000 |
l.i0
l.i0: load without secondary indexes. Graphs for performance per 1-second interval are here.
Average throughput:
Insert response time histogram: each cell has the percentage of responses that take <= the time in the header and max is the max response time in seconds. For the max column values in the top 25% of the range have a red background and in the bottom 25% of the range have a green background. The red background is not used when the min value is within 80% of the max value.
| dbms | 256us | 1ms | 4ms | 16ms | 64ms | 256ms | 1s | 4s | 16s | gt | max |
|---|---|---|---|---|---|---|---|---|---|---|---|
| ma100433_rel.cz11a_c8r32 | 99.207 | 0.349 | 0.336 | 0.104 | 0.004 | 0.187 | |||||
| ma100524_rel.cz11a_c8r32 | 99.434 | 0.225 | 0.199 | 0.137 | 0.004 | 0.182 | |||||
| ma100617_rel.cz11a_c8r32 | 99.516 | 0.267 | 0.111 | 0.101 | 0.005 | 0.184 | |||||
| ma100617_rel.cz11apur1_c8r32 | 99.637 | 0.147 | 0.107 | 0.105 | 0.005 | 0.190 | |||||
| ma100617_rel_nops.cz11a_c8r32 | 99.561 | 0.224 | 0.085 | 0.125 | 0.005 | 0.214 | |||||
| ma100617marko_rel.cz11a_c8r32 | 99.560 | 0.224 | 0.107 | 0.104 | 0.005 | 0.177 |
Performance metrics for the DBMS listed above. Some are normalized by throughput, others are not. Legend for results is here.
ips	qps	rps	rmbps	wps	wmbps	rpq	rkbpq	wpi	wkbpi	csps	cpups	cspq	cpupq	dbgb1	dbgb2	rss	maxop	p50	p99	tag
145666	0	0	0.0	1222.5	62.3	0.000	0.000	0.008	0.438	48930	27.8	0.336	0	52.6	83.4	0.0	0.187	146537	124323	ma100433_rel.cz11a_c8r32
151918	0	0	0.0	1262.3	50.4	0.000	0.000	0.008	0.340	67089	25.0	0.442	0	52.6	83.4	0.0	0.182	153035	129659	ma100524_rel.cz11a_c8r32
148561	0	0	0.0	896.1	41.8	0.000	0.000	0.006	0.288	19728	23.1	0.133	0	52.6	83.4	0.0	0.184	149591	126963	ma100617_rel.cz11a_c8r32
153433	0	0	0.0	924.3	43.1	0.000	0.000	0.006	0.288	19678	23.2	0.128	0	52.6	83.4	0.0	0.190	154430	132359	ma100617_rel.cz11apur1_c8r32
157325	0	0	0.0	948.3	44.3	0.000	0.000	0.006	0.288	20775	23.5	0.132	0	52.6	83.4	0.0	0.214	158225	135552	ma100617_rel_nops.cz11a_c8r32
155219	0	0	0.0	935.4	43.7	0.000	0.000	0.006	0.288	20395	23.5	0.131	0	52.6	83.4	0.0	0.177	156086	134552	ma100617marko_rel.cz11a_c8r32
l.x
l.x: create secondary indexes.
Average throughput:
Performance metrics for the DBMS listed above. Some are normalized by throughput, others are not. Legend for results is here.
ips	qps	rps	rmbps	wps	wmbps	rpq	rkbpq	wpi	wkbpi	csps	cpups	cspq	cpupq	dbgb1	dbgb2	rss	maxop	p50	p99	tag
175285	0	1865	173.8	2327.2	207.1	0.011	1.015	0.013	1.210	9951	11.1	0.057	0	119.9	150.7	0.0	0.002	NA	NA	ma100433_rel.cz11a_c8r32
150517	0	1598	148.9	1926.5	168.5	0.011	1.013	0.013	1.146	6424	11.1	0.043	0	119.9	150.7	0.0	0.001	NA	NA	ma100524_rel.cz11a_c8r32
148782	0	1580	147.4	1955.8	167.3	0.011	1.014	0.013	1.152	6201	10.9	0.042	0	119.9	150.7	0.0	0.001	NA	NA	ma100617_rel.cz11a_c8r32
149925	0	1589	148.1	1969.4	168.6	0.011	1.012	0.013	1.152	6265	11.0	0.042	0	119.9	150.7	0.0	0.002	NA	NA	ma100617_rel.cz11apur1_c8r32
164102	0	1742	162.5	2154.5	184.5	0.011	1.014	0.013	1.152	6802	10.9	0.041	0	119.9	150.7	0.0	0.001	NA	NA	ma100617_rel_nops.cz11a_c8r32
150009	0	1593	148.6	1970.9	168.8	0.011	1.014	0.013	1.152	6265	11.0	0.042	0	119.9	150.7	0.0	0.001	NA	NA	ma100617marko_rel.cz11a_c8r32
l.i1
l.i1: continue load after secondary indexes created with 50 inserts per transaction. Graphs for performance per 1-second interval are here.
Average throughput:
Insert response time histogram: each cell has the percentage of responses that take <= the time in the header and max is the max response time in seconds. For the max column values in the top 25% of the range have a red background and in the bottom 25% of the range have a green background. The red background is not used when the min value is within 80% of the max value.
| dbms | 256us | 1ms | 4ms | 16ms | 64ms | 256ms | 1s | 4s | 16s | gt | max |
|---|---|---|---|---|---|---|---|---|---|---|---|
| ma100433_rel.cz11a_c8r32 | 20.325 | 75.623 | 4.050 | 0.001 | 0.001 | 3.837 | |||||
| ma100524_rel.cz11a_c8r32 | 16.576 | 79.794 | 3.629 | 0.001 | 4.638 | ||||||
| ma100617_rel.cz11a_c8r32 | 26.245 | 65.044 | 8.699 | 0.011 | 0.001 | 3.608 | |||||
| ma100617_rel.cz11apur1_c8r32 | 8.979 | 81.790 | 9.223 | 0.007 | 0.001 | 3.909 | |||||
| ma100617_rel_nops.cz11a_c8r32 | 34.487 | 56.697 | 8.812 | 0.001 | 0.001 | 3.833 | |||||
| ma100617marko_rel.cz11a_c8r32 | 25.051 | 66.164 | 8.783 | 0.001 | 0.001 | 3.567 |
Delete response time histogram: each cell has the percentage of responses that take <= the time in the header and max is the max response time in seconds. For the max column values in the top 25% of the range have a red background and in the bottom 25% of the range have a green background. The red background is not used when the min value is within 80% of the max value.
| dbms | 256us | 1ms | 4ms | 16ms | 64ms | 256ms | 1s | 4s | 16s | gt | max |
|---|---|---|---|---|---|---|---|---|---|---|---|
| ma100433_rel.cz11a_c8r32 | 85.008 | 14.819 | 0.172 | 0.001 | 3.713 | ||||||
| ma100524_rel.cz11a_c8r32 | 90.689 | 8.425 | 0.885 | 0.001 | 4.587 | ||||||
| ma100617_rel.cz11a_c8r32 | 83.716 | 10.151 | 6.131 | 0.001 | 3.511 | ||||||
| ma100617_rel.cz11apur1_c8r32 | 82.455 | 11.056 | 6.486 | 0.001 | 0.001 | 3.859 | |||||
| ma100617_rel_nops.cz11a_c8r32 | 84.642 | 9.218 | 6.139 | 0.001 | 3.786 | ||||||
| ma100617marko_rel.cz11a_c8r32 | 84.519 | 9.252 | 6.228 | 0.001 | 3.520 |
Performance metrics for the DBMS listed above. Some are normalized by throughput, others are not. Legend for results is here.
ips	qps	rps	rmbps	wps	wmbps	rpq	rkbpq	wpi	wkbpi	csps	cpups	cspq	cpupq	dbgb1	dbgb2	rss	maxop	p50	p99	tag
1998	0	9574	149.6	13298.7	384.4	4.792	76.665	6.656	196.985	67162	16.2	33.615	0	144.5	175.3	0.0	3.837	2048	1099	ma100433_rel.cz11a_c8r32
2048	0	9648	150.7	12866.9	348.7	4.711	75.371	6.282	174.353	93293	13.2	45.551	0	144.4	175.3	0.0	4.638	2098	1199	ma100524_rel.cz11a_c8r32
1481	0	7054	110.2	7667.5	209.5	4.763	76.210	5.178	144.868	65340	10.6	44.122	0	144.4	175.2	0.0	3.608	1448	949	ma100617_rel.cz11a_c8r32
1407	0	6704	104.7	7253.1	198.2	4.763	76.214	5.154	144.210	61718	10.1	43.853	0	144.4	175.2	0.0	3.909	1398	949	ma100617_rel.cz11apur1_c8r32
1513	0	7206	112.6	7876.9	215.2	4.761	76.183	5.205	145.630	67253	10.5	44.438	0	144.4	175.2	0.0	3.833	1499	949	ma100617_rel_nops.cz11a_c8r32
1500	0	7140	111.6	7792.8	213.0	4.759	76.150	5.194	145.351	65576	11.2	43.709	0	144.4	175.2	0.0	3.567	1498	999	ma100617marko_rel.cz11a_c8r32
l.i2
l.i2: continue load after secondary indexes created with 5 inserts per transaction. Graphs for performance per 1-second interval are here.
Average throughput:
Insert response time histogram: each cell has the percentage of responses that take <= the time in the header and max is the max response time in seconds. For the max column values in the top 25% of the range have a red background and in the bottom 25% of the range have a green background. The red background is not used when the min value is within 80% of the max value.
| dbms | 256us | 1ms | 4ms | 16ms | 64ms | 256ms | 1s | 4s | 16s | gt | max |
|---|---|---|---|---|---|---|---|---|---|---|---|
| ma100433_rel.cz11a_c8r32 | 4.673 | 87.774 | 7.176 | 0.377 | 0.060 | ||||||
| ma100524_rel.cz11a_c8r32 | 4.641 | 91.679 | 3.508 | 0.171 | 0.001 | 0.204 | |||||
| ma100617_rel.cz11a_c8r32 | 5.123 | 91.429 | 2.102 | 0.628 | 0.718 | 0.209 | |||||
| ma100617_rel.cz11apur1_c8r32 | 0.001 | 2.387 | 94.837 | 1.761 | 0.323 | 0.691 | 0.206 | ||||
| ma100617_rel_nops.cz11a_c8r32 | 5.755 | 92.975 | 0.593 | 0.033 | 0.645 | 0.203 | |||||
| ma100617marko_rel.cz11a_c8r32 | 7.659 | 89.650 | 1.575 | 0.423 | 0.693 | 0.196 |
Delete response time histogram: each cell has the percentage of responses that take <= the time in the header and max is the max response time in seconds. For the max column values in the top 25% of the range have a red background and in the bottom 25% of the range have a green background. The red background is not used when the min value is within 80% of the max value.
| dbms | 256us | 1ms | 4ms | 16ms | 64ms | 256ms | 1s | 4s | 16s | gt | max |
|---|---|---|---|---|---|---|---|---|---|---|---|
| ma100433_rel.cz11a_c8r32 | 0.004 | 30.990 | 64.315 | 4.493 | 0.198 | 0.058 | |||||
| ma100524_rel.cz11a_c8r32 | 0.009 | 29.757 | 67.377 | 2.824 | 0.034 | 0.001 | 0.066 | ||||
| ma100617_rel.cz11a_c8r32 | 0.003 | 20.061 | 76.806 | 2.206 | 0.290 | 0.633 | 0.204 | ||||
| ma100617_rel.cz11apur1_c8r32 | 0.003 | 10.966 | 86.582 | 1.697 | 0.139 | 0.613 | 0.206 | ||||
| ma100617_rel_nops.cz11a_c8r32 | 0.001 | 20.834 | 78.140 | 0.451 | 0.013 | 0.562 | 0.200 | ||||
| ma100617marko_rel.cz11a_c8r32 | 0.002 | 26.569 | 70.962 | 1.639 | 0.202 | 0.626 | 0.190 |
Performance metrics for the DBMS listed above. Some are normalized by throughput, others are not. Legend for results is here.
ips	qps	rps	rmbps	wps	wmbps	rpq	rkbpq	wpi	wkbpi	csps	cpups	cspq	cpupq	dbgb1	dbgb2	rss	maxop	p50	p99	tag
2421	0	10482	163.8	14420.3	414.4	4.329	69.265	5.956	175.255	97521	21.3	40.276	0	144.5	175.3	0.0	0.060	2437	1984	ma100433_rel.cz11a_c8r32
2481	0	10501	164.1	13332.4	370.0	4.232	67.710	5.373	152.689	123299	17.4	49.691	0	144.4	175.3	0.0	0.204	2483	2283	ma100524_rel.cz11a_c8r32
1664	0	7112	111.1	7792.1	217.2	4.274	68.392	4.683	133.668	71346	12.4	42.881	0	144.4	175.2	0.0	0.209	1658	1398	ma100617_rel.cz11a_c8r32
1656	0	7085	110.7	7795.2	217.2	4.279	68.468	4.708	134.313	71090	12.3	42.939	0	144.4	175.2	0.0	0.206	1643	1324	ma100617_rel.cz11apur1_c8r32
1852	0	7946	124.2	8633.3	240.7	4.291	68.653	4.662	133.075	79112	12.9	42.721	0	144.4	175.2	0.0	0.203	1823	1354	ma100617_rel_nops.cz11a_c8r32
1776	0	7623	119.1	8336.9	232.3	4.292	68.674	4.694	133.922	74922	13.8	42.183	0	144.4	175.2	0.0	0.196	1723	1454	ma100617marko_rel.cz11a_c8r32
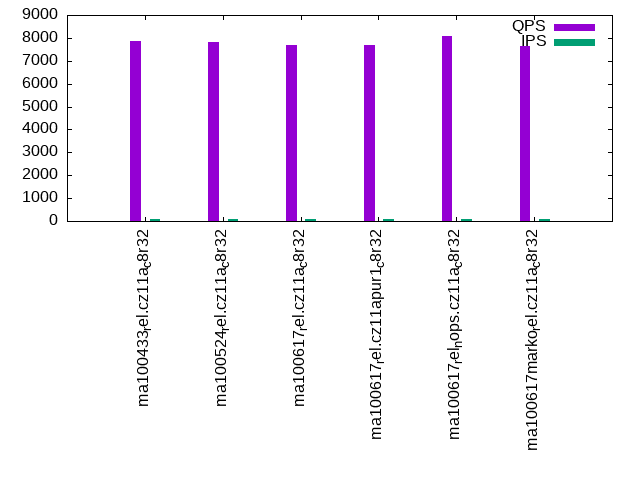
qr100.L1
qr100.L1: range queries with 100 insert/s per client. Graphs for performance per 1-second interval are here.
Average throughput:
Query response time histogram: each cell has the percentage of responses that take <= the time in the header and max is the max response time in seconds. For max values in the top 25% of the range have a red background and in the bottom 25% of the range have a green background. The red background is not used when the min value is within 80% of the max value.
| dbms | 256us | 1ms | 4ms | 16ms | 64ms | 256ms | 1s | 4s | 16s | gt | max |
|---|---|---|---|---|---|---|---|---|---|---|---|
| ma100433_rel.cz11a_c8r32 | 99.795 | 0.163 | 0.036 | 0.006 | nonzero | 0.018 | |||||
| ma100524_rel.cz11a_c8r32 | 99.839 | 0.122 | 0.032 | 0.006 | 0.011 | ||||||
| ma100617_rel.cz11a_c8r32 | 99.481 | 0.477 | 0.033 | 0.009 | nonzero | 0.001 | 0.108 | ||||
| ma100617_rel.cz11apur1_c8r32 | 99.524 | 0.432 | 0.034 | 0.009 | nonzero | 0.001 | 0.115 | ||||
| ma100617_rel_nops.cz11a_c8r32 | 99.698 | 0.283 | 0.010 | 0.008 | nonzero | nonzero | 0.111 | ||||
| ma100617marko_rel.cz11a_c8r32 | 99.543 | 0.414 | 0.034 | 0.008 | nonzero | 0.001 | 0.112 |
Insert response time histogram: each cell has the percentage of responses that take <= the time in the header and max is the max response time in seconds. For max values in the top 25% of the range have a red background and in the bottom 25% of the range have a green background. The red background is not used when the min value is within 80% of the max value.
| dbms | 256us | 1ms | 4ms | 16ms | 64ms | 256ms | 1s | 4s | 16s | gt | max |
|---|---|---|---|---|---|---|---|---|---|---|---|
| ma100433_rel.cz11a_c8r32 | 57.833 | 41.889 | 0.278 | 0.075 | |||||||
| ma100524_rel.cz11a_c8r32 | 53.778 | 46.222 | 0.031 | ||||||||
| ma100617_rel.cz11a_c8r32 | 51.556 | 43.750 | 4.694 | 0.133 | |||||||
| ma100617_rel.cz11apur1_c8r32 | 51.361 | 43.861 | 4.778 | 0.136 | |||||||
| ma100617_rel_nops.cz11a_c8r32 | 55.333 | 40.361 | 4.306 | 0.134 | |||||||
| ma100617marko_rel.cz11a_c8r32 | 53.417 | 42.111 | 4.472 | 0.135 |
Delete response time histogram: each cell has the percentage of responses that take <= the time in the header and max is the max response time in seconds. For max values in the top 25% of the range have a red background and in the bottom 25% of the range have a green background. The red background is not used when the min value is within 80% of the max value.
| dbms | 256us | 1ms | 4ms | 16ms | 64ms | 256ms | 1s | 4s | 16s | gt | max |
|---|---|---|---|---|---|---|---|---|---|---|---|
| ma100433_rel.cz11a_c8r32 | 62.778 | 37.222 | 0.057 | ||||||||
| ma100524_rel.cz11a_c8r32 | 57.333 | 42.667 | 0.025 | ||||||||
| ma100617_rel.cz11a_c8r32 | 56.167 | 40.056 | 3.778 | 0.130 | |||||||
| ma100617_rel.cz11apur1_c8r32 | 56.000 | 39.944 | 4.056 | 0.134 | |||||||
| ma100617_rel_nops.cz11a_c8r32 | 56.639 | 39.778 | 3.583 | 0.130 | |||||||
| ma100617marko_rel.cz11a_c8r32 | 55.722 | 40.417 | 3.861 | 0.127 |
Performance metrics for the DBMS listed above. Some are normalized by throughput, others are not. Legend for results is here.
ips	qps	rps	rmbps	wps	wmbps	rpq	rkbpq	wpi	wkbpi	csps	cpups	cspq	cpupq	dbgb1	dbgb2	rss	maxop	p50	p99	tag
100	7844	469	7.3	1508.6	42.3	0.060	0.957	15.116	433.833	36960	12.6	4.712	0	144.5	175.3	0.0	0.018	7896	6297	ma100433_rel.cz11a_c8r32
100	7823	456	7.1	93.7	3.1	0.058	0.932	0.939	31.579	33116	12.3	4.233	0	144.4	175.3	0.0	0.011	7879	6446	ma100524_rel.cz11a_c8r32
100	7676	457	7.1	88.5	3.0	0.059	0.952	0.887	30.412	31600	12.0	4.117	0	144.4	175.2	0.0	0.108	7752	6345	ma100617_rel.cz11a_c8r32
100	7704	458	7.2	89.4	3.0	0.059	0.951	0.896	30.680	31704	12.1	4.115	0	144.4	175.2	0.0	0.115	7783	6185	ma100617_rel.cz11apur1_c8r32
100	8092	456	7.1	88.4	3.0	0.056	0.903	0.886	30.414	33191	11.5	4.102	0	144.4	175.2	0.0	0.111	8167	7198	ma100617_rel_nops.cz11a_c8r32
100	7637	457	7.1	88.6	3.0	0.060	0.957	0.888	30.444	31412	12.1	4.113	0	144.4	175.2	0.0	0.112	7719	6425	ma100617marko_rel.cz11a_c8r32
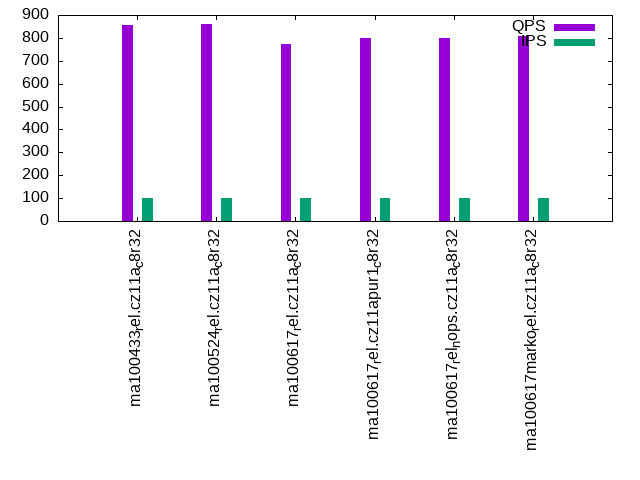
qp100.L2
qp100.L2: point queries with 100 insert/s per client. Graphs for performance per 1-second interval are here.
Average throughput:
Query response time histogram: each cell has the percentage of responses that take <= the time in the header and max is the max response time in seconds. For max values in the top 25% of the range have a red background and in the bottom 25% of the range have a green background. The red background is not used when the min value is within 80% of the max value.
| dbms | 256us | 1ms | 4ms | 16ms | 64ms | 256ms | 1s | 4s | 16s | gt | max |
|---|---|---|---|---|---|---|---|---|---|---|---|
| ma100433_rel.cz11a_c8r32 | 0.004 | 30.950 | 68.771 | 0.274 | 0.002 | 0.046 | |||||
| ma100524_rel.cz11a_c8r32 | 0.004 | 30.696 | 69.292 | 0.007 | 0.001 | 0.026 | |||||
| ma100617_rel.cz11a_c8r32 | 0.002 | 30.385 | 69.242 | 0.064 | 0.211 | 0.096 | 0.110 | ||||
| ma100617_rel.cz11apur1_c8r32 | 0.003 | 36.433 | 63.053 | 0.203 | 0.214 | 0.093 | 0.109 | ||||
| ma100617_rel_nops.cz11a_c8r32 | 0.004 | 36.047 | 63.512 | 0.132 | 0.211 | 0.094 | 0.109 | ||||
| ma100617marko_rel.cz11a_c8r32 | 0.004 | 36.856 | 62.831 | 0.006 | 0.212 | 0.092 | 0.107 |
Insert response time histogram: each cell has the percentage of responses that take <= the time in the header and max is the max response time in seconds. For max values in the top 25% of the range have a red background and in the bottom 25% of the range have a green background. The red background is not used when the min value is within 80% of the max value.
| dbms | 256us | 1ms | 4ms | 16ms | 64ms | 256ms | 1s | 4s | 16s | gt | max |
|---|---|---|---|---|---|---|---|---|---|---|---|
| ma100433_rel.cz11a_c8r32 | 19.444 | 80.194 | 0.361 | 0.138 | |||||||
| ma100524_rel.cz11a_c8r32 | 8.250 | 91.722 | 0.028 | 0.065 | |||||||
| ma100617_rel.cz11a_c8r32 | 25.639 | 68.000 | 6.361 | 0.123 | |||||||
| ma100617_rel.cz11apur1_c8r32 | 8.278 | 84.806 | 6.917 | 0.142 | |||||||
| ma100617_rel_nops.cz11a_c8r32 | 65.583 | 28.583 | 5.833 | 0.123 | |||||||
| ma100617marko_rel.cz11a_c8r32 | 30.611 | 63.917 | 5.472 | 0.125 |
Delete response time histogram: each cell has the percentage of responses that take <= the time in the header and max is the max response time in seconds. For max values in the top 25% of the range have a red background and in the bottom 25% of the range have a green background. The red background is not used when the min value is within 80% of the max value.
| dbms | 256us | 1ms | 4ms | 16ms | 64ms | 256ms | 1s | 4s | 16s | gt | max |
|---|---|---|---|---|---|---|---|---|---|---|---|
| ma100433_rel.cz11a_c8r32 | 96.111 | 3.778 | 0.111 | 0.077 | |||||||
| ma100524_rel.cz11a_c8r32 | 85.194 | 14.806 | 0.057 | ||||||||
| ma100617_rel.cz11a_c8r32 | 83.500 | 11.778 | 4.722 | 0.120 | |||||||
| ma100617_rel.cz11apur1_c8r32 | 67.222 | 27.417 | 5.361 | 0.138 | |||||||
| ma100617_rel_nops.cz11a_c8r32 | 84.778 | 10.972 | 4.250 | 0.118 | |||||||
| ma100617marko_rel.cz11a_c8r32 | 85.139 | 10.611 | 4.250 | 0.117 |
Performance metrics for the DBMS listed above. Some are normalized by throughput, others are not. Legend for results is here.
ips	qps	rps	rmbps	wps	wmbps	rpq	rkbpq	wpi	wkbpi	csps	cpups	cspq	cpupq	dbgb1	dbgb2	rss	maxop	p50	p99	tag
100	858	6478	101.2	1497.0	41.9	7.553	120.841	15.000	430.337	22027	4.5	25.681	0	144.5	175.3	0.0	0.046	879	640	ma100433_rel.cz11a_c8r32
100	860	6467	101.0	944.1	25.5	7.522	120.357	9.460	261.718	22723	4.4	26.431	0	144.4	175.3	0.0	0.026	879	639	ma100524_rel.cz11a_c8r32
100	772	5955	93.0	925.6	25.3	7.717	123.479	9.275	259.212	20023	4.7	25.950	0	144.4	175.2	0.0	0.110	815	511	ma100617_rel.cz11a_c8r32
100	798	6112	95.5	927.3	25.3	7.662	122.585	9.292	259.723	20379	4.4	25.547	0	144.4	175.2	0.0	0.109	847	512	ma100617_rel.cz11apur1_c8r32
100	798	6110	95.5	929.7	25.4	7.660	122.559	9.316	260.392	20477	4.3	25.670	0	144.4	175.2	0.0	0.109	832	527	ma100617_rel_nops.cz11a_c8r32
100	809	6181	96.6	930.7	25.4	7.636	122.181	9.326	260.606	20630	4.4	25.487	0	144.4	175.2	0.0	0.107	863	527	ma100617marko_rel.cz11a_c8r32
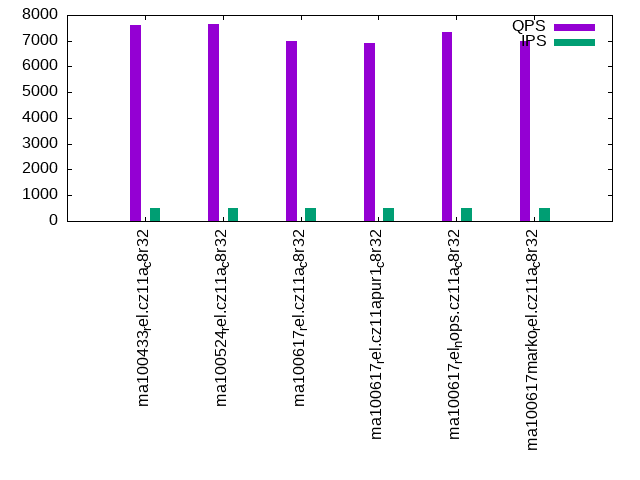
qr500.L3
qr500.L3: range queries with 500 insert/s per client. Graphs for performance per 1-second interval are here.
Average throughput:
Query response time histogram: each cell has the percentage of responses that take <= the time in the header and max is the max response time in seconds. For max values in the top 25% of the range have a red background and in the bottom 25% of the range have a green background. The red background is not used when the min value is within 80% of the max value.
| dbms | 256us | 1ms | 4ms | 16ms | 64ms | 256ms | 1s | 4s | 16s | gt | max |
|---|---|---|---|---|---|---|---|---|---|---|---|
| ma100433_rel.cz11a_c8r32 | 99.586 | 0.326 | 0.073 | 0.016 | nonzero | 0.036 | |||||
| ma100524_rel.cz11a_c8r32 | 99.684 | 0.194 | 0.106 | 0.016 | 0.012 | ||||||
| ma100617_rel.cz11a_c8r32 | 98.020 | 1.865 | 0.085 | 0.023 | 0.002 | 0.005 | 0.169 | ||||
| ma100617_rel.cz11apur1_c8r32 | 97.932 | 1.941 | 0.097 | 0.023 | 0.002 | 0.005 | 0.167 | ||||
| ma100617_rel_nops.cz11a_c8r32 | 98.373 | 1.523 | 0.077 | 0.021 | 0.002 | 0.005 | 0.164 | ||||
| ma100617marko_rel.cz11a_c8r32 | 98.184 | 1.708 | 0.079 | 0.022 | 0.002 | 0.005 | 0.166 |
Insert response time histogram: each cell has the percentage of responses that take <= the time in the header and max is the max response time in seconds. For max values in the top 25% of the range have a red background and in the bottom 25% of the range have a green background. The red background is not used when the min value is within 80% of the max value.
| dbms | 256us | 1ms | 4ms | 16ms | 64ms | 256ms | 1s | 4s | 16s | gt | max |
|---|---|---|---|---|---|---|---|---|---|---|---|
| ma100433_rel.cz11a_c8r32 | 67.606 | 32.194 | 0.200 | 0.125 | |||||||
| ma100524_rel.cz11a_c8r32 | 60.044 | 39.956 | 0.046 | ||||||||
| ma100617_rel.cz11a_c8r32 | 62.844 | 31.556 | 5.600 | 0.189 | |||||||
| ma100617_rel.cz11apur1_c8r32 | 56.844 | 37.150 | 6.006 | 0.187 | |||||||
| ma100617_rel_nops.cz11a_c8r32 | 69.194 | 25.022 | 5.783 | 0.188 | |||||||
| ma100617marko_rel.cz11a_c8r32 | 67.744 | 26.517 | 5.739 | 0.187 |
Delete response time histogram: each cell has the percentage of responses that take <= the time in the header and max is the max response time in seconds. For max values in the top 25% of the range have a red background and in the bottom 25% of the range have a green background. The red background is not used when the min value is within 80% of the max value.
| dbms | 256us | 1ms | 4ms | 16ms | 64ms | 256ms | 1s | 4s | 16s | gt | max |
|---|---|---|---|---|---|---|---|---|---|---|---|
| ma100433_rel.cz11a_c8r32 | 87.822 | 12.161 | 0.017 | 0.075 | |||||||
| ma100524_rel.cz11a_c8r32 | 91.378 | 8.622 | 0.034 | ||||||||
| ma100617_rel.cz11a_c8r32 | 86.828 | 8.467 | 4.706 | 0.185 | |||||||
| ma100617_rel.cz11apur1_c8r32 | 84.950 | 10.133 | 4.917 | 0.184 | |||||||
| ma100617_rel_nops.cz11a_c8r32 | 87.322 | 7.878 | 4.800 | 0.186 | |||||||
| ma100617marko_rel.cz11a_c8r32 | 87.078 | 8.344 | 4.578 | 0.182 |
Performance metrics for the DBMS listed above. Some are normalized by throughput, others are not. Legend for results is here.
ips	qps	rps	rmbps	wps	wmbps	rpq	rkbpq	wpi	wkbpi	csps	cpups	cspq	cpupq	dbgb1	dbgb2	rss	maxop	p50	p99	tag
499	7602	2377	37.1	6155.6	173.3	0.313	5.003	12.333	355.460	59931	16.1	7.884	0	144.5	175.3	0.0	0.036	7690	4139	ma100433_rel.cz11a_c8r32
499	7635	2395	37.4	3216.1	89.1	0.314	5.018	6.440	182.620	54820	14.6	7.180	0	144.4	175.3	0.0	0.012	7704	4427	ma100524_rel.cz11a_c8r32
499	6997	2375	37.1	1725.6	48.9	0.339	5.430	3.455	100.365	43787	13.7	6.258	0	144.4	175.2	0.0	0.169	7179	4395	ma100617_rel.cz11a_c8r32
499	6924	2373	37.1	1724.8	48.9	0.343	5.483	3.454	100.334	43471	13.7	6.278	0	144.4	175.2	0.0	0.167	7083	3580	ma100617_rel.cz11apur1_c8r32
499	7324	2376	37.1	1723.5	48.9	0.324	5.190	3.451	100.255	45165	13.4	6.166	0	144.4	175.2	0.0	0.164	7515	4683	ma100617_rel_nops.cz11a_c8r32
499	7004	2375	37.1	1722.7	48.9	0.339	5.427	3.449	100.220	43752	13.8	6.247	0	144.4	175.2	0.0	0.166	7160	4621	ma100617marko_rel.cz11a_c8r32
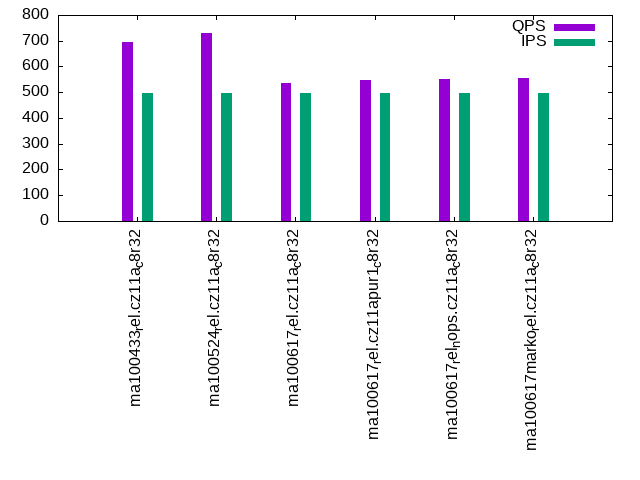
qp500.L4
qp500.L4: point queries with 500 insert/s per client. Graphs for performance per 1-second interval are here.
Average throughput:
Query response time histogram: each cell has the percentage of responses that take <= the time in the header and max is the max response time in seconds. For max values in the top 25% of the range have a red background and in the bottom 25% of the range have a green background. The red background is not used when the min value is within 80% of the max value.
| dbms | 256us | 1ms | 4ms | 16ms | 64ms | 256ms | 1s | 4s | 16s | gt | max |
|---|---|---|---|---|---|---|---|---|---|---|---|
| ma100433_rel.cz11a_c8r32 | nonzero | 8.395 | 89.345 | 2.245 | 0.015 | 0.043 | |||||
| ma100524_rel.cz11a_c8r32 | 9.479 | 89.351 | 1.156 | 0.014 | 0.054 | ||||||
| ma100617_rel.cz11a_c8r32 | nonzero | 6.672 | 91.904 | 0.904 | 0.007 | 0.512 | 0.156 | ||||
| ma100617_rel.cz11apur1_c8r32 | 8.688 | 89.773 | 1.023 | 0.005 | 0.511 | 0.159 | |||||
| ma100617_rel_nops.cz11a_c8r32 | 8.883 | 89.660 | 0.942 | 0.007 | 0.507 | 0.154 | |||||
| ma100617marko_rel.cz11a_c8r32 | 8.930 | 89.679 | 0.879 | 0.006 | 0.506 | 0.154 |
Insert response time histogram: each cell has the percentage of responses that take <= the time in the header and max is the max response time in seconds. For max values in the top 25% of the range have a red background and in the bottom 25% of the range have a green background. The red background is not used when the min value is within 80% of the max value.
| dbms | 256us | 1ms | 4ms | 16ms | 64ms | 256ms | 1s | 4s | 16s | gt | max |
|---|---|---|---|---|---|---|---|---|---|---|---|
| ma100433_rel.cz11a_c8r32 | 59.206 | 39.828 | 0.967 | 0.149 | |||||||
| ma100524_rel.cz11a_c8r32 | 78.189 | 19.811 | 2.000 | 0.156 | |||||||
| ma100617_rel.cz11a_c8r32 | 58.583 | 28.739 | 12.678 | 0.173 | |||||||
| ma100617_rel.cz11apur1_c8r32 | 33.406 | 53.283 | 13.311 | 0.203 | |||||||
| ma100617_rel_nops.cz11a_c8r32 | 73.822 | 14.239 | 11.939 | 0.170 | |||||||
| ma100617marko_rel.cz11a_c8r32 | 60.789 | 26.450 | 12.761 | 0.166 |
Delete response time histogram: each cell has the percentage of responses that take <= the time in the header and max is the max response time in seconds. For max values in the top 25% of the range have a red background and in the bottom 25% of the range have a green background. The red background is not used when the min value is within 80% of the max value.
| dbms | 256us | 1ms | 4ms | 16ms | 64ms | 256ms | 1s | 4s | 16s | gt | max |
|---|---|---|---|---|---|---|---|---|---|---|---|
| ma100433_rel.cz11a_c8r32 | 88.239 | 11.422 | 0.339 | 0.101 | |||||||
| ma100524_rel.cz11a_c8r32 | 95.517 | 3.717 | 0.767 | 0.143 | |||||||
| ma100617_rel.cz11a_c8r32 | 84.767 | 5.550 | 9.683 | 0.165 | |||||||
| ma100617_rel.cz11apur1_c8r32 | 78.067 | 11.183 | 10.750 | 0.197 | |||||||
| ma100617_rel_nops.cz11a_c8r32 | 88.883 | 2.217 | 8.900 | 0.163 | |||||||
| ma100617marko_rel.cz11a_c8r32 | 84.461 | 5.506 | 10.033 | 0.162 |
Performance metrics for the DBMS listed above. Some are normalized by throughput, others are not. Legend for results is here.
ips	qps	rps	rmbps	wps	wmbps	rpq	rkbpq	wpi	wkbpi	csps	cpups	cspq	cpupq	dbgb1	dbgb2	rss	maxop	p50	p99	tag
499	694	8216	128.4	6054.1	170.2	11.845	189.524	12.130	349.296	40956	7.5	59.048	0	144.5	175.3	0.0	0.043	703	575	ma100433_rel.cz11a_c8r32
499	729	8445	131.9	4529.3	125.6	11.582	185.316	9.075	257.756	44718	6.1	61.333	0	144.4	175.3	0.0	0.054	735	639	ma100524_rel.cz11a_c8r32
499	537	7015	109.6	2620.4	72.6	13.053	208.851	5.250	148.886	32621	7.6	60.701	0	144.4	175.2	0.0	0.156	543	416	ma100617_rel.cz11a_c8r32
499	549	7108	111.1	2637.3	73.0	12.949	207.190	5.284	149.846	32900	7.5	59.938	0	144.4	175.2	0.0	0.159	559	400	ma100617_rel.cz11apur1_c8r32
499	552	7115	111.2	2649.2	73.4	12.892	206.276	5.305	150.450	32841	7.3	59.505	0	144.4	175.2	0.0	0.154	560	400	ma100617_rel_nops.cz11a_c8r32
499	555	7145	111.6	2630.5	72.8	12.881	206.099	5.271	149.453	32969	7.5	59.435	0	144.4	175.2	0.0	0.154	560	416	ma100617marko_rel.cz11a_c8r32
qr1000.L5
qr1000.L5: range queries with 1000 insert/s per client. Graphs for performance per 1-second interval are here.
Average throughput:
Query response time histogram: each cell has the percentage of responses that take <= the time in the header and max is the max response time in seconds. For max values in the top 25% of the range have a red background and in the bottom 25% of the range have a green background. The red background is not used when the min value is within 80% of the max value.
| dbms | 256us | 1ms | 4ms | 16ms | 64ms | 256ms | 1s | 4s | 16s | gt | max |
|---|---|---|---|---|---|---|---|---|---|---|---|
| ma100433_rel.cz11a_c8r32 | 99.422 | 0.495 | 0.072 | 0.011 | nonzero | 0.032 | |||||
| ma100524_rel.cz11a_c8r32 | 99.569 | 0.282 | 0.129 | 0.020 | 0.012 | ||||||
| ma100617_rel.cz11a_c8r32 | 96.626 | 3.228 | 0.104 | 0.025 | 0.002 | 0.016 | 0.169 | ||||
| ma100617_rel.cz11apur1_c8r32 | 96.017 | 3.842 | 0.104 | 0.019 | 0.002 | 0.016 | 0.184 | ||||
| ma100617_rel_nops.cz11a_c8r32 | 97.114 | 2.744 | 0.101 | 0.025 | 0.002 | 0.015 | 0.171 | ||||
| ma100617marko_rel.cz11a_c8r32 | 96.879 | 2.969 | 0.110 | 0.025 | 0.002 | 0.016 | 0.172 |
Insert response time histogram: each cell has the percentage of responses that take <= the time in the header and max is the max response time in seconds. For max values in the top 25% of the range have a red background and in the bottom 25% of the range have a green background. The red background is not used when the min value is within 80% of the max value.
| dbms | 256us | 1ms | 4ms | 16ms | 64ms | 256ms | 1s | 4s | 16s | gt | max |
|---|---|---|---|---|---|---|---|---|---|---|---|
| ma100433_rel.cz11a_c8r32 | 86.556 | 13.394 | 0.050 | 0.114 | |||||||
| ma100524_rel.cz11a_c8r32 | 86.569 | 13.431 | 0.053 | ||||||||
| ma100617_rel.cz11a_c8r32 | 81.728 | 12.217 | 6.056 | 0.203 | |||||||
| ma100617_rel.cz11apur1_c8r32 | 75.331 | 18.547 | 6.122 | 0.201 | |||||||
| ma100617_rel_nops.cz11a_c8r32 | 81.656 | 12.231 | 6.114 | 0.212 | |||||||
| ma100617marko_rel.cz11a_c8r32 | 82.317 | 11.631 | 6.053 | 0.221 |
Delete response time histogram: each cell has the percentage of responses that take <= the time in the header and max is the max response time in seconds. For max values in the top 25% of the range have a red background and in the bottom 25% of the range have a green background. The red background is not used when the min value is within 80% of the max value.
| dbms | 256us | 1ms | 4ms | 16ms | 64ms | 256ms | 1s | 4s | 16s | gt | max |
|---|---|---|---|---|---|---|---|---|---|---|---|
| ma100433_rel.cz11a_c8r32 | 95.500 | 4.500 | 0.058 | ||||||||
| ma100524_rel.cz11a_c8r32 | 95.200 | 4.800 | 0.046 | ||||||||
| ma100617_rel.cz11a_c8r32 | 90.969 | 3.708 | 5.322 | 0.204 | |||||||
| ma100617_rel.cz11apur1_c8r32 | 89.906 | 4.744 | 5.350 | 0.201 | |||||||
| ma100617_rel_nops.cz11a_c8r32 | 91.014 | 3.653 | 5.333 | 0.190 | |||||||
| ma100617marko_rel.cz11a_c8r32 | 90.547 | 4.064 | 5.389 | 0.206 |
Performance metrics for the DBMS listed above. Some are normalized by throughput, others are not. Legend for results is here.
ips	qps	rps	rmbps	wps	wmbps	rpq	rkbpq	wpi	wkbpi	csps	cpups	cspq	cpupq	dbgb1	dbgb2	rss	maxop	p50	p99	tag
999	7520	4241	66.3	9163.8	258.5	0.564	9.022	9.175	265.066	77808	19.2	10.346	0	144.5	175.3	0.0	0.032	7594	4651	ma100433_rel.cz11a_c8r32
999	7476	4140	64.7	6784.9	188.4	0.554	8.860	6.793	193.147	77413	17.1	10.354	0	144.4	175.3	0.0	0.012	7544	5372	ma100524_rel.cz11a_c8r32
999	6123	4189	65.5	3802.6	106.6	0.684	10.947	3.807	109.284	56940	15.2	9.299	0	144.4	175.2	0.0	0.169	6185	2269	ma100617_rel.cz11a_c8r32
999	6117	4198	65.6	3813.9	106.9	0.686	10.980	3.818	109.577	57089	15.2	9.333	0	144.4	175.2	0.0	0.184	6140	2495	ma100617_rel.cz11apur1_c8r32
999	6408	4200	65.6	3777.0	105.9	0.655	10.486	3.782	108.551	58398	14.8	9.113	0	144.4	175.2	0.0	0.171	6441	2254	ma100617_rel_nops.cz11a_c8r32
999	6141	4191	65.5	3810.8	106.8	0.682	10.918	3.815	109.517	56874	15.4	9.261	0	144.4	175.2	0.0	0.172	6185	2190	ma100617marko_rel.cz11a_c8r32
qp1000.L6
qp1000.L6: point queries with 1000 insert/s per client. Graphs for performance per 1-second interval are here.
Average throughput:
Query response time histogram: each cell has the percentage of responses that take <= the time in the header and max is the max response time in seconds. For max values in the top 25% of the range have a red background and in the bottom 25% of the range have a green background. The red background is not used when the min value is within 80% of the max value.
| dbms | 256us | 1ms | 4ms | 16ms | 64ms | 256ms | 1s | 4s | 16s | gt | max |
|---|---|---|---|---|---|---|---|---|---|---|---|
| ma100433_rel.cz11a_c8r32 | 2.163 | 94.763 | 3.060 | 0.014 | 0.047 | ||||||
| ma100524_rel.cz11a_c8r32 | 2.774 | 94.951 | 2.246 | 0.029 | 0.054 | ||||||
| ma100617_rel.cz11a_c8r32 | 1.259 | 96.409 | 1.539 | 0.015 | 0.778 | 0.157 | |||||
| ma100617_rel.cz11apur1_c8r32 | 1.676 | 95.577 | 1.950 | 0.010 | 0.787 | 0.159 | |||||
| ma100617_rel_nops.cz11a_c8r32 | 1.544 | 96.127 | 1.535 | 0.019 | 0.774 | 0.162 | |||||
| ma100617marko_rel.cz11a_c8r32 | 1.641 | 95.981 | 1.589 | 0.015 | 0.774 | 0.155 |
Insert response time histogram: each cell has the percentage of responses that take <= the time in the header and max is the max response time in seconds. For max values in the top 25% of the range have a red background and in the bottom 25% of the range have a green background. The red background is not used when the min value is within 80% of the max value.
| dbms | 256us | 1ms | 4ms | 16ms | 64ms | 256ms | 1s | 4s | 16s | gt | max |
|---|---|---|---|---|---|---|---|---|---|---|---|
| ma100433_rel.cz11a_c8r32 | 78.597 | 21.050 | 0.353 | 0.115 | |||||||
| ma100524_rel.cz11a_c8r32 | 91.944 | 6.311 | 1.744 | 0.161 | |||||||
| ma100617_rel.cz11a_c8r32 | 63.786 | 24.794 | 11.419 | 0.208 | |||||||
| ma100617_rel.cz11apur1_c8r32 | 51.644 | 35.944 | 12.411 | 0.214 | |||||||
| ma100617_rel_nops.cz11a_c8r32 | 66.242 | 22.286 | 11.472 | 0.204 | |||||||
| ma100617marko_rel.cz11a_c8r32 | 66.453 | 21.903 | 11.644 | 0.228 |
Delete response time histogram: each cell has the percentage of responses that take <= the time in the header and max is the max response time in seconds. For max values in the top 25% of the range have a red background and in the bottom 25% of the range have a green background. The red background is not used when the min value is within 80% of the max value.
| dbms | 256us | 1ms | 4ms | 16ms | 64ms | 256ms | 1s | 4s | 16s | gt | max |
|---|---|---|---|---|---|---|---|---|---|---|---|
| ma100433_rel.cz11a_c8r32 | 90.144 | 9.767 | 0.089 | 0.082 | |||||||
| ma100524_rel.cz11a_c8r32 | 95.858 | 3.714 | 0.428 | 0.125 | |||||||
| ma100617_rel.cz11a_c8r32 | 86.144 | 4.111 | 9.744 | 0.202 | |||||||
| ma100617_rel.cz11apur1_c8r32 | 84.306 | 5.258 | 10.436 | 0.197 | |||||||
| ma100617_rel_nops.cz11a_c8r32 | 86.772 | 3.550 | 9.678 | 0.200 | |||||||
| ma100617marko_rel.cz11a_c8r32 | 86.836 | 3.344 | 9.819 | 0.226 |
Performance metrics for the DBMS listed above. Some are normalized by throughput, others are not. Legend for results is here.
ips	qps	rps	rmbps	wps	wmbps	rpq	rkbpq	wpi	wkbpi	csps	cpups	cspq	cpupq	dbgb1	dbgb2	rss	maxop	p50	p99	tag
999	636	10287	160.7	7319.5	206.9	16.179	258.864	7.328	212.089	51254	10.2	80.613	0	144.5	175.3	0.0	0.047	655	511	ma100433_rel.cz11a_c8r32
999	651	10343	161.6	7802.2	216.6	15.878	254.043	7.812	222.085	65614	8.6	100.728	0	144.4	175.3	0.0	0.054	655	591	ma100524_rel.cz11a_c8r32
999	404	8255	129.0	4390.2	122.2	20.407	326.510	4.396	125.258	47064	9.7	116.351	0	144.4	175.2	0.0	0.157	400	320	ma100617_rel.cz11a_c8r32
999	407	8282	129.4	4373.9	121.7	20.359	325.742	4.379	124.806	47302	9.6	116.278	0	144.4	175.2	0.0	0.159	416	320	ma100617_rel.cz11apur1_c8r32
999	410	8303	129.7	4396.7	122.4	20.270	324.319	4.402	125.443	47513	9.5	115.998	0	144.4	175.2	0.0	0.162	416	336	ma100617_rel_nops.cz11a_c8r32
999	411	8322	130.0	4390.5	122.2	20.228	323.641	4.396	125.266	46824	10.0	113.817	0	144.4	175.2	0.0	0.155	416	336	ma100617marko_rel.cz11a_c8r32
l.i0
l.i0: load without secondary indexes
Performance metrics for all DBMS, not just the ones listed above. Some are normalized by throughput, others are not. Legend for results is here.
ips	qps	rps	rmbps	wps	wmbps	rpq	rkbpq	wpi	wkbpi	csps	cpups	cspq	cpupq	dbgb1	dbgb2	rss	maxop	p50	p99	tag
145666	0	0	0.0	1222.5	62.3	0.000	0.000	0.008	0.438	48930	27.8	0.336	0	52.6	83.4	0.0	0.187	146537	124323	ma100433_rel.cz11a_c8r32
151918	0	0	0.0	1262.3	50.4	0.000	0.000	0.008	0.340	67089	25.0	0.442	0	52.6	83.4	0.0	0.182	153035	129659	ma100524_rel.cz11a_c8r32
148561	0	0	0.0	896.1	41.8	0.000	0.000	0.006	0.288	19728	23.1	0.133	0	52.6	83.4	0.0	0.184	149591	126963	ma100617_rel.cz11a_c8r32
153433	0	0	0.0	924.3	43.1	0.000	0.000	0.006	0.288	19678	23.2	0.128	0	52.6	83.4	0.0	0.190	154430	132359	ma100617_rel.cz11apur1_c8r32
157325	0	0	0.0	948.3	44.3	0.000	0.000	0.006	0.288	20775	23.5	0.132	0	52.6	83.4	0.0	0.214	158225	135552	ma100617_rel_nops.cz11a_c8r32
155219	0	0	0.0	935.4	43.7	0.000	0.000	0.006	0.288	20395	23.5	0.131	0	52.6	83.4	0.0	0.177	156086	134552	ma100617marko_rel.cz11a_c8r32
l.x
l.x: create secondary indexes
Performance metrics for all DBMS, not just the ones listed above. Some are normalized by throughput, others are not. Legend for results is here.
ips	qps	rps	rmbps	wps	wmbps	rpq	rkbpq	wpi	wkbpi	csps	cpups	cspq	cpupq	dbgb1	dbgb2	rss	maxop	p50	p99	tag
175285	0	1865	173.8	2327.2	207.1	0.011	1.015	0.013	1.210	9951	11.1	0.057	0	119.9	150.7	0.0	0.002	NA	NA	ma100433_rel.cz11a_c8r32
150517	0	1598	148.9	1926.5	168.5	0.011	1.013	0.013	1.146	6424	11.1	0.043	0	119.9	150.7	0.0	0.001	NA	NA	ma100524_rel.cz11a_c8r32
148782	0	1580	147.4	1955.8	167.3	0.011	1.014	0.013	1.152	6201	10.9	0.042	0	119.9	150.7	0.0	0.001	NA	NA	ma100617_rel.cz11a_c8r32
149925	0	1589	148.1	1969.4	168.6	0.011	1.012	0.013	1.152	6265	11.0	0.042	0	119.9	150.7	0.0	0.002	NA	NA	ma100617_rel.cz11apur1_c8r32
164102	0	1742	162.5	2154.5	184.5	0.011	1.014	0.013	1.152	6802	10.9	0.041	0	119.9	150.7	0.0	0.001	NA	NA	ma100617_rel_nops.cz11a_c8r32
150009	0	1593	148.6	1970.9	168.8	0.011	1.014	0.013	1.152	6265	11.0	0.042	0	119.9	150.7	0.0	0.001	NA	NA	ma100617marko_rel.cz11a_c8r32
l.i1
l.i1: continue load after secondary indexes created with 50 inserts per transaction
Performance metrics for all DBMS, not just the ones listed above. Some are normalized by throughput, others are not. Legend for results is here.
ips	qps	rps	rmbps	wps	wmbps	rpq	rkbpq	wpi	wkbpi	csps	cpups	cspq	cpupq	dbgb1	dbgb2	rss	maxop	p50	p99	tag
1998	0	9574	149.6	13298.7	384.4	4.792	76.665	6.656	196.985	67162	16.2	33.615	0	144.5	175.3	0.0	3.837	2048	1099	ma100433_rel.cz11a_c8r32
2048	0	9648	150.7	12866.9	348.7	4.711	75.371	6.282	174.353	93293	13.2	45.551	0	144.4	175.3	0.0	4.638	2098	1199	ma100524_rel.cz11a_c8r32
1481	0	7054	110.2	7667.5	209.5	4.763	76.210	5.178	144.868	65340	10.6	44.122	0	144.4	175.2	0.0	3.608	1448	949	ma100617_rel.cz11a_c8r32
1407	0	6704	104.7	7253.1	198.2	4.763	76.214	5.154	144.210	61718	10.1	43.853	0	144.4	175.2	0.0	3.909	1398	949	ma100617_rel.cz11apur1_c8r32
1513	0	7206	112.6	7876.9	215.2	4.761	76.183	5.205	145.630	67253	10.5	44.438	0	144.4	175.2	0.0	3.833	1499	949	ma100617_rel_nops.cz11a_c8r32
1500	0	7140	111.6	7792.8	213.0	4.759	76.150	5.194	145.351	65576	11.2	43.709	0	144.4	175.2	0.0	3.567	1498	999	ma100617marko_rel.cz11a_c8r32
l.i2
l.i2: continue load after secondary indexes created with 5 inserts per transaction
Performance metrics for all DBMS, not just the ones listed above. Some are normalized by throughput, others are not. Legend for results is here.
ips	qps	rps	rmbps	wps	wmbps	rpq	rkbpq	wpi	wkbpi	csps	cpups	cspq	cpupq	dbgb1	dbgb2	rss	maxop	p50	p99	tag
2421	0	10482	163.8	14420.3	414.4	4.329	69.265	5.956	175.255	97521	21.3	40.276	0	144.5	175.3	0.0	0.060	2437	1984	ma100433_rel.cz11a_c8r32
2481	0	10501	164.1	13332.4	370.0	4.232	67.710	5.373	152.689	123299	17.4	49.691	0	144.4	175.3	0.0	0.204	2483	2283	ma100524_rel.cz11a_c8r32
1664	0	7112	111.1	7792.1	217.2	4.274	68.392	4.683	133.668	71346	12.4	42.881	0	144.4	175.2	0.0	0.209	1658	1398	ma100617_rel.cz11a_c8r32
1656	0	7085	110.7	7795.2	217.2	4.279	68.468	4.708	134.313	71090	12.3	42.939	0	144.4	175.2	0.0	0.206	1643	1324	ma100617_rel.cz11apur1_c8r32
1852	0	7946	124.2	8633.3	240.7	4.291	68.653	4.662	133.075	79112	12.9	42.721	0	144.4	175.2	0.0	0.203	1823	1354	ma100617_rel_nops.cz11a_c8r32
1776	0	7623	119.1	8336.9	232.3	4.292	68.674	4.694	133.922	74922	13.8	42.183	0	144.4	175.2	0.0	0.196	1723	1454	ma100617marko_rel.cz11a_c8r32
qr100.L1
qr100.L1: range queries with 100 insert/s per client
Performance metrics for all DBMS, not just the ones listed above. Some are normalized by throughput, others are not. Legend for results is here.
ips	qps	rps	rmbps	wps	wmbps	rpq	rkbpq	wpi	wkbpi	csps	cpups	cspq	cpupq	dbgb1	dbgb2	rss	maxop	p50	p99	tag
100	7844	469	7.3	1508.6	42.3	0.060	0.957	15.116	433.833	36960	12.6	4.712	0	144.5	175.3	0.0	0.018	7896	6297	ma100433_rel.cz11a_c8r32
100	7823	456	7.1	93.7	3.1	0.058	0.932	0.939	31.579	33116	12.3	4.233	0	144.4	175.3	0.0	0.011	7879	6446	ma100524_rel.cz11a_c8r32
100	7676	457	7.1	88.5	3.0	0.059	0.952	0.887	30.412	31600	12.0	4.117	0	144.4	175.2	0.0	0.108	7752	6345	ma100617_rel.cz11a_c8r32
100	7704	458	7.2	89.4	3.0	0.059	0.951	0.896	30.680	31704	12.1	4.115	0	144.4	175.2	0.0	0.115	7783	6185	ma100617_rel.cz11apur1_c8r32
100	8092	456	7.1	88.4	3.0	0.056	0.903	0.886	30.414	33191	11.5	4.102	0	144.4	175.2	0.0	0.111	8167	7198	ma100617_rel_nops.cz11a_c8r32
100	7637	457	7.1	88.6	3.0	0.060	0.957	0.888	30.444	31412	12.1	4.113	0	144.4	175.2	0.0	0.112	7719	6425	ma100617marko_rel.cz11a_c8r32
qp100.L2
qp100.L2: point queries with 100 insert/s per client
Performance metrics for all DBMS, not just the ones listed above. Some are normalized by throughput, others are not. Legend for results is here.
ips	qps	rps	rmbps	wps	wmbps	rpq	rkbpq	wpi	wkbpi	csps	cpups	cspq	cpupq	dbgb1	dbgb2	rss	maxop	p50	p99	tag
100	858	6478	101.2	1497.0	41.9	7.553	120.841	15.000	430.337	22027	4.5	25.681	0	144.5	175.3	0.0	0.046	879	640	ma100433_rel.cz11a_c8r32
100	860	6467	101.0	944.1	25.5	7.522	120.357	9.460	261.718	22723	4.4	26.431	0	144.4	175.3	0.0	0.026	879	639	ma100524_rel.cz11a_c8r32
100	772	5955	93.0	925.6	25.3	7.717	123.479	9.275	259.212	20023	4.7	25.950	0	144.4	175.2	0.0	0.110	815	511	ma100617_rel.cz11a_c8r32
100	798	6112	95.5	927.3	25.3	7.662	122.585	9.292	259.723	20379	4.4	25.547	0	144.4	175.2	0.0	0.109	847	512	ma100617_rel.cz11apur1_c8r32
100	798	6110	95.5	929.7	25.4	7.660	122.559	9.316	260.392	20477	4.3	25.670	0	144.4	175.2	0.0	0.109	832	527	ma100617_rel_nops.cz11a_c8r32
100	809	6181	96.6	930.7	25.4	7.636	122.181	9.326	260.606	20630	4.4	25.487	0	144.4	175.2	0.0	0.107	863	527	ma100617marko_rel.cz11a_c8r32
qr500.L3
qr500.L3: range queries with 500 insert/s per client
Performance metrics for all DBMS, not just the ones listed above. Some are normalized by throughput, others are not. Legend for results is here.
ips	qps	rps	rmbps	wps	wmbps	rpq	rkbpq	wpi	wkbpi	csps	cpups	cspq	cpupq	dbgb1	dbgb2	rss	maxop	p50	p99	tag
499	7602	2377	37.1	6155.6	173.3	0.313	5.003	12.333	355.460	59931	16.1	7.884	0	144.5	175.3	0.0	0.036	7690	4139	ma100433_rel.cz11a_c8r32
499	7635	2395	37.4	3216.1	89.1	0.314	5.018	6.440	182.620	54820	14.6	7.180	0	144.4	175.3	0.0	0.012	7704	4427	ma100524_rel.cz11a_c8r32
499	6997	2375	37.1	1725.6	48.9	0.339	5.430	3.455	100.365	43787	13.7	6.258	0	144.4	175.2	0.0	0.169	7179	4395	ma100617_rel.cz11a_c8r32
499	6924	2373	37.1	1724.8	48.9	0.343	5.483	3.454	100.334	43471	13.7	6.278	0	144.4	175.2	0.0	0.167	7083	3580	ma100617_rel.cz11apur1_c8r32
499	7324	2376	37.1	1723.5	48.9	0.324	5.190	3.451	100.255	45165	13.4	6.166	0	144.4	175.2	0.0	0.164	7515	4683	ma100617_rel_nops.cz11a_c8r32
499	7004	2375	37.1	1722.7	48.9	0.339	5.427	3.449	100.220	43752	13.8	6.247	0	144.4	175.2	0.0	0.166	7160	4621	ma100617marko_rel.cz11a_c8r32
qp500.L4
qp500.L4: point queries with 500 insert/s per client
Performance metrics for all DBMS, not just the ones listed above. Some are normalized by throughput, others are not. Legend for results is here.
ips	qps	rps	rmbps	wps	wmbps	rpq	rkbpq	wpi	wkbpi	csps	cpups	cspq	cpupq	dbgb1	dbgb2	rss	maxop	p50	p99	tag
499	694	8216	128.4	6054.1	170.2	11.845	189.524	12.130	349.296	40956	7.5	59.048	0	144.5	175.3	0.0	0.043	703	575	ma100433_rel.cz11a_c8r32
499	729	8445	131.9	4529.3	125.6	11.582	185.316	9.075	257.756	44718	6.1	61.333	0	144.4	175.3	0.0	0.054	735	639	ma100524_rel.cz11a_c8r32
499	537	7015	109.6	2620.4	72.6	13.053	208.851	5.250	148.886	32621	7.6	60.701	0	144.4	175.2	0.0	0.156	543	416	ma100617_rel.cz11a_c8r32
499	549	7108	111.1	2637.3	73.0	12.949	207.190	5.284	149.846	32900	7.5	59.938	0	144.4	175.2	0.0	0.159	559	400	ma100617_rel.cz11apur1_c8r32
499	552	7115	111.2	2649.2	73.4	12.892	206.276	5.305	150.450	32841	7.3	59.505	0	144.4	175.2	0.0	0.154	560	400	ma100617_rel_nops.cz11a_c8r32
499	555	7145	111.6	2630.5	72.8	12.881	206.099	5.271	149.453	32969	7.5	59.435	0	144.4	175.2	0.0	0.154	560	416	ma100617marko_rel.cz11a_c8r32
qr1000.L5
qr1000.L5: range queries with 1000 insert/s per client
Performance metrics for all DBMS, not just the ones listed above. Some are normalized by throughput, others are not. Legend for results is here.
ips	qps	rps	rmbps	wps	wmbps	rpq	rkbpq	wpi	wkbpi	csps	cpups	cspq	cpupq	dbgb1	dbgb2	rss	maxop	p50	p99	tag
999	7520	4241	66.3	9163.8	258.5	0.564	9.022	9.175	265.066	77808	19.2	10.346	0	144.5	175.3	0.0	0.032	7594	4651	ma100433_rel.cz11a_c8r32
999	7476	4140	64.7	6784.9	188.4	0.554	8.860	6.793	193.147	77413	17.1	10.354	0	144.4	175.3	0.0	0.012	7544	5372	ma100524_rel.cz11a_c8r32
999	6123	4189	65.5	3802.6	106.6	0.684	10.947	3.807	109.284	56940	15.2	9.299	0	144.4	175.2	0.0	0.169	6185	2269	ma100617_rel.cz11a_c8r32
999	6117	4198	65.6	3813.9	106.9	0.686	10.980	3.818	109.577	57089	15.2	9.333	0	144.4	175.2	0.0	0.184	6140	2495	ma100617_rel.cz11apur1_c8r32
999	6408	4200	65.6	3777.0	105.9	0.655	10.486	3.782	108.551	58398	14.8	9.113	0	144.4	175.2	0.0	0.171	6441	2254	ma100617_rel_nops.cz11a_c8r32
999	6141	4191	65.5	3810.8	106.8	0.682	10.918	3.815	109.517	56874	15.4	9.261	0	144.4	175.2	0.0	0.172	6185	2190	ma100617marko_rel.cz11a_c8r32
qp1000.L6
qp1000.L6: point queries with 1000 insert/s per client
Performance metrics for all DBMS, not just the ones listed above. Some are normalized by throughput, others are not. Legend for results is here.
ips	qps	rps	rmbps	wps	wmbps	rpq	rkbpq	wpi	wkbpi	csps	cpups	cspq	cpupq	dbgb1	dbgb2	rss	maxop	p50	p99	tag
999	636	10287	160.7	7319.5	206.9	16.179	258.864	7.328	212.089	51254	10.2	80.613	0	144.5	175.3	0.0	0.047	655	511	ma100433_rel.cz11a_c8r32
999	651	10343	161.6	7802.2	216.6	15.878	254.043	7.812	222.085	65614	8.6	100.728	0	144.4	175.3	0.0	0.054	655	591	ma100524_rel.cz11a_c8r32
999	404	8255	129.0	4390.2	122.2	20.407	326.510	4.396	125.258	47064	9.7	116.351	0	144.4	175.2	0.0	0.157	400	320	ma100617_rel.cz11a_c8r32
999	407	8282	129.4	4373.9	121.7	20.359	325.742	4.379	124.806	47302	9.6	116.278	0	144.4	175.2	0.0	0.159	416	320	ma100617_rel.cz11apur1_c8r32
999	410	8303	129.7	4396.7	122.4	20.270	324.319	4.402	125.443	47513	9.5	115.998	0	144.4	175.2	0.0	0.162	416	336	ma100617_rel_nops.cz11a_c8r32
999	411	8322	130.0	4390.5	122.2	20.228	323.641	4.396	125.266	46824	10.0	113.817	0	144.4	175.2	0.0	0.155	416	336	ma100617marko_rel.cz11a_c8r32
l.i0
- l.i0: load without secondary indexes
- Legend for results is here.
- Each entry lists the percentage of responses that fit in that bucket (slower than max time for previous bucket, faster than min time for next bucket).
Insert response time histogram
256us	1ms	4ms	16ms	64ms	256ms	1s	4s	16s	gt	max	tag
0.000	99.207	0.349	0.336	0.104	0.004	0.000	0.000	0.000	0.000	0.187	ma100433_rel.cz11a_c8r32
0.000	99.434	0.225	0.199	0.137	0.004	0.000	0.000	0.000	0.000	0.182	ma100524_rel.cz11a_c8r32
0.000	99.516	0.267	0.111	0.101	0.005	0.000	0.000	0.000	0.000	0.184	ma100617_rel.cz11a_c8r32
0.000	99.637	0.147	0.107	0.105	0.005	0.000	0.000	0.000	0.000	0.190	ma100617_rel.cz11apur1_c8r32
0.000	99.561	0.224	0.085	0.125	0.005	0.000	0.000	0.000	0.000	0.214	ma100617_rel_nops.cz11a_c8r32
0.000	99.560	0.224	0.107	0.104	0.005	0.000	0.000	0.000	0.000	0.177	ma100617marko_rel.cz11a_c8r32
l.x
- l.x: create secondary indexes
- Legend for results is here.
- Each entry lists the percentage of responses that fit in that bucket (slower than max time for previous bucket, faster than min time for next bucket).
TODO - determine whether there is data for create index response time
l.i1
- l.i1: continue load after secondary indexes created with 50 inserts per transaction
- Legend for results is here.
- Each entry lists the percentage of responses that fit in that bucket (slower than max time for previous bucket, faster than min time for next bucket).
Insert response time histogram
256us	1ms	4ms	16ms	64ms	256ms	1s	4s	16s	gt	max	tag
0.000	0.000	0.000	20.325	75.623	4.050	0.001	0.001	0.000	0.000	3.837	ma100433_rel.cz11a_c8r32
0.000	0.000	0.000	16.576	79.794	3.629	0.000	0.000	0.001	0.000	4.638	ma100524_rel.cz11a_c8r32
0.000	0.000	0.000	26.245	65.044	8.699	0.011	0.001	0.000	0.000	3.608	ma100617_rel.cz11a_c8r32
0.000	0.000	0.000	8.979	81.790	9.223	0.007	0.001	0.000	0.000	3.909	ma100617_rel.cz11apur1_c8r32
0.000	0.000	0.000	34.487	56.697	8.812	0.001	0.001	0.000	0.000	3.833	ma100617_rel_nops.cz11a_c8r32
0.000	0.000	0.000	25.051	66.164	8.783	0.001	0.001	0.000	0.000	3.567	ma100617marko_rel.cz11a_c8r32
Delete response time histogram
256us	1ms	4ms	16ms	64ms	256ms	1s	4s	16s	gt	max	tag
0.000	0.000	0.000	85.008	14.819	0.172	0.000	0.001	0.000	0.000	3.713	ma100433_rel.cz11a_c8r32
0.000	0.000	0.000	90.689	8.425	0.885	0.000	0.000	0.001	0.000	4.587	ma100524_rel.cz11a_c8r32
0.000	0.000	0.000	83.716	10.151	6.131	0.000	0.001	0.000	0.000	3.511	ma100617_rel.cz11a_c8r32
0.000	0.000	0.000	82.455	11.056	6.486	0.001	0.001	0.000	0.000	3.859	ma100617_rel.cz11apur1_c8r32
0.000	0.000	0.000	84.642	9.218	6.139	0.000	0.001	0.000	0.000	3.786	ma100617_rel_nops.cz11a_c8r32
0.000	0.000	0.000	84.519	9.252	6.228	0.000	0.001	0.000	0.000	3.520	ma100617marko_rel.cz11a_c8r32
l.i2
- l.i2: continue load after secondary indexes created with 5 inserts per transaction
- Legend for results is here.
- Each entry lists the percentage of responses that fit in that bucket (slower than max time for previous bucket, faster than min time for next bucket).
Insert response time histogram
256us	1ms	4ms	16ms	64ms	256ms	1s	4s	16s	gt	max	tag
0.000	4.673	87.774	7.176	0.377	0.000	0.000	0.000	0.000	0.000	0.060	ma100433_rel.cz11a_c8r32
0.000	4.641	91.679	3.508	0.171	0.001	0.000	0.000	0.000	0.000	0.204	ma100524_rel.cz11a_c8r32
0.000	5.123	91.429	2.102	0.628	0.718	0.000	0.000	0.000	0.000	0.209	ma100617_rel.cz11a_c8r32
0.001	2.387	94.837	1.761	0.323	0.691	0.000	0.000	0.000	0.000	0.206	ma100617_rel.cz11apur1_c8r32
0.000	5.755	92.975	0.593	0.033	0.645	0.000	0.000	0.000	0.000	0.203	ma100617_rel_nops.cz11a_c8r32
0.000	7.659	89.650	1.575	0.423	0.693	0.000	0.000	0.000	0.000	0.196	ma100617marko_rel.cz11a_c8r32
Delete response time histogram
256us	1ms	4ms	16ms	64ms	256ms	1s	4s	16s	gt	max	tag
0.004	30.990	64.315	4.493	0.198	0.000	0.000	0.000	0.000	0.000	0.058	ma100433_rel.cz11a_c8r32
0.009	29.757	67.377	2.824	0.034	0.001	0.000	0.000	0.000	0.000	0.066	ma100524_rel.cz11a_c8r32
0.003	20.061	76.806	2.206	0.290	0.633	0.000	0.000	0.000	0.000	0.204	ma100617_rel.cz11a_c8r32
0.003	10.966	86.582	1.697	0.139	0.613	0.000	0.000	0.000	0.000	0.206	ma100617_rel.cz11apur1_c8r32
0.001	20.834	78.140	0.451	0.013	0.562	0.000	0.000	0.000	0.000	0.200	ma100617_rel_nops.cz11a_c8r32
0.002	26.569	70.962	1.639	0.202	0.626	0.000	0.000	0.000	0.000	0.190	ma100617marko_rel.cz11a_c8r32
qr100.L1
- qr100.L1: range queries with 100 insert/s per client
- Legend for results is here.
- Each entry lists the percentage of responses that fit in that bucket (slower than max time for previous bucket, faster than min time for next bucket).
Query response time histogram
256us	1ms	4ms	16ms	64ms	256ms	1s	4s	16s	gt	max	tag
99.795	0.163	0.036	0.006	nonzero	0.000	0.000	0.000	0.000	0.000	0.018	ma100433_rel.cz11a_c8r32
99.839	0.122	0.032	0.006	0.000	0.000	0.000	0.000	0.000	0.000	0.011	ma100524_rel.cz11a_c8r32
99.481	0.477	0.033	0.009	nonzero	0.001	0.000	0.000	0.000	0.000	0.108	ma100617_rel.cz11a_c8r32
99.524	0.432	0.034	0.009	nonzero	0.001	0.000	0.000	0.000	0.000	0.115	ma100617_rel.cz11apur1_c8r32
99.698	0.283	0.010	0.008	nonzero	nonzero	0.000	0.000	0.000	0.000	0.111	ma100617_rel_nops.cz11a_c8r32
99.543	0.414	0.034	0.008	nonzero	0.001	0.000	0.000	0.000	0.000	0.112	ma100617marko_rel.cz11a_c8r32
Insert response time histogram
256us	1ms	4ms	16ms	64ms	256ms	1s	4s	16s	gt	max	tag
0.000	0.000	0.000	57.833	41.889	0.278	0.000	0.000	0.000	0.000	0.075	ma100433_rel.cz11a_c8r32
0.000	0.000	0.000	53.778	46.222	0.000	0.000	0.000	0.000	0.000	0.031	ma100524_rel.cz11a_c8r32
0.000	0.000	0.000	51.556	43.750	4.694	0.000	0.000	0.000	0.000	0.133	ma100617_rel.cz11a_c8r32
0.000	0.000	0.000	51.361	43.861	4.778	0.000	0.000	0.000	0.000	0.136	ma100617_rel.cz11apur1_c8r32
0.000	0.000	0.000	55.333	40.361	4.306	0.000	0.000	0.000	0.000	0.134	ma100617_rel_nops.cz11a_c8r32
0.000	0.000	0.000	53.417	42.111	4.472	0.000	0.000	0.000	0.000	0.135	ma100617marko_rel.cz11a_c8r32
Delete response time histogram
256us	1ms	4ms	16ms	64ms	256ms	1s	4s	16s	gt	max	tag
0.000	0.000	0.000	62.778	37.222	0.000	0.000	0.000	0.000	0.000	0.057	ma100433_rel.cz11a_c8r32
0.000	0.000	0.000	57.333	42.667	0.000	0.000	0.000	0.000	0.000	0.025	ma100524_rel.cz11a_c8r32
0.000	0.000	0.000	56.167	40.056	3.778	0.000	0.000	0.000	0.000	0.130	ma100617_rel.cz11a_c8r32
0.000	0.000	0.000	56.000	39.944	4.056	0.000	0.000	0.000	0.000	0.134	ma100617_rel.cz11apur1_c8r32
0.000	0.000	0.000	56.639	39.778	3.583	0.000	0.000	0.000	0.000	0.130	ma100617_rel_nops.cz11a_c8r32
0.000	0.000	0.000	55.722	40.417	3.861	0.000	0.000	0.000	0.000	0.127	ma100617marko_rel.cz11a_c8r32
qp100.L2
- qp100.L2: point queries with 100 insert/s per client
- Legend for results is here.
- Each entry lists the percentage of responses that fit in that bucket (slower than max time for previous bucket, faster than min time for next bucket).
Query response time histogram
256us	1ms	4ms	16ms	64ms	256ms	1s	4s	16s	gt	max	tag
0.004	30.950	68.771	0.274	0.002	0.000	0.000	0.000	0.000	0.000	0.046	ma100433_rel.cz11a_c8r32
0.004	30.696	69.292	0.007	0.001	0.000	0.000	0.000	0.000	0.000	0.026	ma100524_rel.cz11a_c8r32
0.002	30.385	69.242	0.064	0.211	0.096	0.000	0.000	0.000	0.000	0.110	ma100617_rel.cz11a_c8r32
0.003	36.433	63.053	0.203	0.214	0.093	0.000	0.000	0.000	0.000	0.109	ma100617_rel.cz11apur1_c8r32
0.004	36.047	63.512	0.132	0.211	0.094	0.000	0.000	0.000	0.000	0.109	ma100617_rel_nops.cz11a_c8r32
0.004	36.856	62.831	0.006	0.212	0.092	0.000	0.000	0.000	0.000	0.107	ma100617marko_rel.cz11a_c8r32
Insert response time histogram
256us	1ms	4ms	16ms	64ms	256ms	1s	4s	16s	gt	max	tag
0.000	0.000	0.000	19.444	80.194	0.361	0.000	0.000	0.000	0.000	0.138	ma100433_rel.cz11a_c8r32
0.000	0.000	0.000	8.250	91.722	0.028	0.000	0.000	0.000	0.000	0.065	ma100524_rel.cz11a_c8r32
0.000	0.000	0.000	25.639	68.000	6.361	0.000	0.000	0.000	0.000	0.123	ma100617_rel.cz11a_c8r32
0.000	0.000	0.000	8.278	84.806	6.917	0.000	0.000	0.000	0.000	0.142	ma100617_rel.cz11apur1_c8r32
0.000	0.000	0.000	65.583	28.583	5.833	0.000	0.000	0.000	0.000	0.123	ma100617_rel_nops.cz11a_c8r32
0.000	0.000	0.000	30.611	63.917	5.472	0.000	0.000	0.000	0.000	0.125	ma100617marko_rel.cz11a_c8r32
Delete response time histogram
256us	1ms	4ms	16ms	64ms	256ms	1s	4s	16s	gt	max	tag
0.000	0.000	0.000	96.111	3.778	0.111	0.000	0.000	0.000	0.000	0.077	ma100433_rel.cz11a_c8r32
0.000	0.000	0.000	85.194	14.806	0.000	0.000	0.000	0.000	0.000	0.057	ma100524_rel.cz11a_c8r32
0.000	0.000	0.000	83.500	11.778	4.722	0.000	0.000	0.000	0.000	0.120	ma100617_rel.cz11a_c8r32
0.000	0.000	0.000	67.222	27.417	5.361	0.000	0.000	0.000	0.000	0.138	ma100617_rel.cz11apur1_c8r32
0.000	0.000	0.000	84.778	10.972	4.250	0.000	0.000	0.000	0.000	0.118	ma100617_rel_nops.cz11a_c8r32
0.000	0.000	0.000	85.139	10.611	4.250	0.000	0.000	0.000	0.000	0.117	ma100617marko_rel.cz11a_c8r32
qr500.L3
- qr500.L3: range queries with 500 insert/s per client
- Legend for results is here.
- Each entry lists the percentage of responses that fit in that bucket (slower than max time for previous bucket, faster than min time for next bucket).
Query response time histogram
256us	1ms	4ms	16ms	64ms	256ms	1s	4s	16s	gt	max	tag
99.586	0.326	0.073	0.016	nonzero	0.000	0.000	0.000	0.000	0.000	0.036	ma100433_rel.cz11a_c8r32
99.684	0.194	0.106	0.016	0.000	0.000	0.000	0.000	0.000	0.000	0.012	ma100524_rel.cz11a_c8r32
98.020	1.865	0.085	0.023	0.002	0.005	0.000	0.000	0.000	0.000	0.169	ma100617_rel.cz11a_c8r32
97.932	1.941	0.097	0.023	0.002	0.005	0.000	0.000	0.000	0.000	0.167	ma100617_rel.cz11apur1_c8r32
98.373	1.523	0.077	0.021	0.002	0.005	0.000	0.000	0.000	0.000	0.164	ma100617_rel_nops.cz11a_c8r32
98.184	1.708	0.079	0.022	0.002	0.005	0.000	0.000	0.000	0.000	0.166	ma100617marko_rel.cz11a_c8r32
Insert response time histogram
256us	1ms	4ms	16ms	64ms	256ms	1s	4s	16s	gt	max	tag
0.000	0.000	0.000	67.606	32.194	0.200	0.000	0.000	0.000	0.000	0.125	ma100433_rel.cz11a_c8r32
0.000	0.000	0.000	60.044	39.956	0.000	0.000	0.000	0.000	0.000	0.046	ma100524_rel.cz11a_c8r32
0.000	0.000	0.000	62.844	31.556	5.600	0.000	0.000	0.000	0.000	0.189	ma100617_rel.cz11a_c8r32
0.000	0.000	0.000	56.844	37.150	6.006	0.000	0.000	0.000	0.000	0.187	ma100617_rel.cz11apur1_c8r32
0.000	0.000	0.000	69.194	25.022	5.783	0.000	0.000	0.000	0.000	0.188	ma100617_rel_nops.cz11a_c8r32
0.000	0.000	0.000	67.744	26.517	5.739	0.000	0.000	0.000	0.000	0.187	ma100617marko_rel.cz11a_c8r32
Delete response time histogram
256us	1ms	4ms	16ms	64ms	256ms	1s	4s	16s	gt	max	tag
0.000	0.000	0.000	87.822	12.161	0.017	0.000	0.000	0.000	0.000	0.075	ma100433_rel.cz11a_c8r32
0.000	0.000	0.000	91.378	8.622	0.000	0.000	0.000	0.000	0.000	0.034	ma100524_rel.cz11a_c8r32
0.000	0.000	0.000	86.828	8.467	4.706	0.000	0.000	0.000	0.000	0.185	ma100617_rel.cz11a_c8r32
0.000	0.000	0.000	84.950	10.133	4.917	0.000	0.000	0.000	0.000	0.184	ma100617_rel.cz11apur1_c8r32
0.000	0.000	0.000	87.322	7.878	4.800	0.000	0.000	0.000	0.000	0.186	ma100617_rel_nops.cz11a_c8r32
0.000	0.000	0.000	87.078	8.344	4.578	0.000	0.000	0.000	0.000	0.182	ma100617marko_rel.cz11a_c8r32
qp500.L4
- qp500.L4: point queries with 500 insert/s per client
- Legend for results is here.
- Each entry lists the percentage of responses that fit in that bucket (slower than max time for previous bucket, faster than min time for next bucket).
Query response time histogram
256us	1ms	4ms	16ms	64ms	256ms	1s	4s	16s	gt	max	tag
nonzero	8.395	89.345	2.245	0.015	0.000	0.000	0.000	0.000	0.000	0.043	ma100433_rel.cz11a_c8r32
0.000	9.479	89.351	1.156	0.014	0.000	0.000	0.000	0.000	0.000	0.054	ma100524_rel.cz11a_c8r32
nonzero	6.672	91.904	0.904	0.007	0.512	0.000	0.000	0.000	0.000	0.156	ma100617_rel.cz11a_c8r32
0.000	8.688	89.773	1.023	0.005	0.511	0.000	0.000	0.000	0.000	0.159	ma100617_rel.cz11apur1_c8r32
0.000	8.883	89.660	0.942	0.007	0.507	0.000	0.000	0.000	0.000	0.154	ma100617_rel_nops.cz11a_c8r32
0.000	8.930	89.679	0.879	0.006	0.506	0.000	0.000	0.000	0.000	0.154	ma100617marko_rel.cz11a_c8r32
Insert response time histogram
256us	1ms	4ms	16ms	64ms	256ms	1s	4s	16s	gt	max	tag
0.000	0.000	0.000	59.206	39.828	0.967	0.000	0.000	0.000	0.000	0.149	ma100433_rel.cz11a_c8r32
0.000	0.000	0.000	78.189	19.811	2.000	0.000	0.000	0.000	0.000	0.156	ma100524_rel.cz11a_c8r32
0.000	0.000	0.000	58.583	28.739	12.678	0.000	0.000	0.000	0.000	0.173	ma100617_rel.cz11a_c8r32
0.000	0.000	0.000	33.406	53.283	13.311	0.000	0.000	0.000	0.000	0.203	ma100617_rel.cz11apur1_c8r32
0.000	0.000	0.000	73.822	14.239	11.939	0.000	0.000	0.000	0.000	0.170	ma100617_rel_nops.cz11a_c8r32
0.000	0.000	0.000	60.789	26.450	12.761	0.000	0.000	0.000	0.000	0.166	ma100617marko_rel.cz11a_c8r32
Delete response time histogram
256us	1ms	4ms	16ms	64ms	256ms	1s	4s	16s	gt	max	tag
0.000	0.000	0.000	88.239	11.422	0.339	0.000	0.000	0.000	0.000	0.101	ma100433_rel.cz11a_c8r32
0.000	0.000	0.000	95.517	3.717	0.767	0.000	0.000	0.000	0.000	0.143	ma100524_rel.cz11a_c8r32
0.000	0.000	0.000	84.767	5.550	9.683	0.000	0.000	0.000	0.000	0.165	ma100617_rel.cz11a_c8r32
0.000	0.000	0.000	78.067	11.183	10.750	0.000	0.000	0.000	0.000	0.197	ma100617_rel.cz11apur1_c8r32
0.000	0.000	0.000	88.883	2.217	8.900	0.000	0.000	0.000	0.000	0.163	ma100617_rel_nops.cz11a_c8r32
0.000	0.000	0.000	84.461	5.506	10.033	0.000	0.000	0.000	0.000	0.162	ma100617marko_rel.cz11a_c8r32
qr1000.L5
- qr1000.L5: range queries with 1000 insert/s per client
- Legend for results is here.
- Each entry lists the percentage of responses that fit in that bucket (slower than max time for previous bucket, faster than min time for next bucket).
Query response time histogram
256us	1ms	4ms	16ms	64ms	256ms	1s	4s	16s	gt	max	tag
99.422	0.495	0.072	0.011	nonzero	0.000	0.000	0.000	0.000	0.000	0.032	ma100433_rel.cz11a_c8r32
99.569	0.282	0.129	0.020	0.000	0.000	0.000	0.000	0.000	0.000	0.012	ma100524_rel.cz11a_c8r32
96.626	3.228	0.104	0.025	0.002	0.016	0.000	0.000	0.000	0.000	0.169	ma100617_rel.cz11a_c8r32
96.017	3.842	0.104	0.019	0.002	0.016	0.000	0.000	0.000	0.000	0.184	ma100617_rel.cz11apur1_c8r32
97.114	2.744	0.101	0.025	0.002	0.015	0.000	0.000	0.000	0.000	0.171	ma100617_rel_nops.cz11a_c8r32
96.879	2.969	0.110	0.025	0.002	0.016	0.000	0.000	0.000	0.000	0.172	ma100617marko_rel.cz11a_c8r32
Insert response time histogram
256us	1ms	4ms	16ms	64ms	256ms	1s	4s	16s	gt	max	tag
0.000	0.000	0.000	86.556	13.394	0.050	0.000	0.000	0.000	0.000	0.114	ma100433_rel.cz11a_c8r32
0.000	0.000	0.000	86.569	13.431	0.000	0.000	0.000	0.000	0.000	0.053	ma100524_rel.cz11a_c8r32
0.000	0.000	0.000	81.728	12.217	6.056	0.000	0.000	0.000	0.000	0.203	ma100617_rel.cz11a_c8r32
0.000	0.000	0.000	75.331	18.547	6.122	0.000	0.000	0.000	0.000	0.201	ma100617_rel.cz11apur1_c8r32
0.000	0.000	0.000	81.656	12.231	6.114	0.000	0.000	0.000	0.000	0.212	ma100617_rel_nops.cz11a_c8r32
0.000	0.000	0.000	82.317	11.631	6.053	0.000	0.000	0.000	0.000	0.221	ma100617marko_rel.cz11a_c8r32
Delete response time histogram
256us	1ms	4ms	16ms	64ms	256ms	1s	4s	16s	gt	max	tag
0.000	0.000	0.000	95.500	4.500	0.000	0.000	0.000	0.000	0.000	0.058	ma100433_rel.cz11a_c8r32
0.000	0.000	0.000	95.200	4.800	0.000	0.000	0.000	0.000	0.000	0.046	ma100524_rel.cz11a_c8r32
0.000	0.000	0.000	90.969	3.708	5.322	0.000	0.000	0.000	0.000	0.204	ma100617_rel.cz11a_c8r32
0.000	0.000	0.000	89.906	4.744	5.350	0.000	0.000	0.000	0.000	0.201	ma100617_rel.cz11apur1_c8r32
0.000	0.000	0.000	91.014	3.653	5.333	0.000	0.000	0.000	0.000	0.190	ma100617_rel_nops.cz11a_c8r32
0.000	0.000	0.000	90.547	4.064	5.389	0.000	0.000	0.000	0.000	0.206	ma100617marko_rel.cz11a_c8r32
qp1000.L6
- qp1000.L6: point queries with 1000 insert/s per client
- Legend for results is here.
- Each entry lists the percentage of responses that fit in that bucket (slower than max time for previous bucket, faster than min time for next bucket).
Query response time histogram
256us	1ms	4ms	16ms	64ms	256ms	1s	4s	16s	gt	max	tag
0.000	2.163	94.763	3.060	0.014	0.000	0.000	0.000	0.000	0.000	0.047	ma100433_rel.cz11a_c8r32
0.000	2.774	94.951	2.246	0.029	0.000	0.000	0.000	0.000	0.000	0.054	ma100524_rel.cz11a_c8r32
0.000	1.259	96.409	1.539	0.015	0.778	0.000	0.000	0.000	0.000	0.157	ma100617_rel.cz11a_c8r32
0.000	1.676	95.577	1.950	0.010	0.787	0.000	0.000	0.000	0.000	0.159	ma100617_rel.cz11apur1_c8r32
0.000	1.544	96.127	1.535	0.019	0.774	0.000	0.000	0.000	0.000	0.162	ma100617_rel_nops.cz11a_c8r32
0.000	1.641	95.981	1.589	0.015	0.774	0.000	0.000	0.000	0.000	0.155	ma100617marko_rel.cz11a_c8r32
Insert response time histogram
256us	1ms	4ms	16ms	64ms	256ms	1s	4s	16s	gt	max	tag
0.000	0.000	0.000	78.597	21.050	0.353	0.000	0.000	0.000	0.000	0.115	ma100433_rel.cz11a_c8r32
0.000	0.000	0.000	91.944	6.311	1.744	0.000	0.000	0.000	0.000	0.161	ma100524_rel.cz11a_c8r32
0.000	0.000	0.000	63.786	24.794	11.419	0.000	0.000	0.000	0.000	0.208	ma100617_rel.cz11a_c8r32
0.000	0.000	0.000	51.644	35.944	12.411	0.000	0.000	0.000	0.000	0.214	ma100617_rel.cz11apur1_c8r32
0.000	0.000	0.000	66.242	22.286	11.472	0.000	0.000	0.000	0.000	0.204	ma100617_rel_nops.cz11a_c8r32
0.000	0.000	0.000	66.453	21.903	11.644	0.000	0.000	0.000	0.000	0.228	ma100617marko_rel.cz11a_c8r32
Delete response time histogram
256us	1ms	4ms	16ms	64ms	256ms	1s	4s	16s	gt	max	tag
0.000	0.000	0.000	90.144	9.767	0.089	0.000	0.000	0.000	0.000	0.082	ma100433_rel.cz11a_c8r32
0.000	0.000	0.000	95.858	3.714	0.428	0.000	0.000	0.000	0.000	0.125	ma100524_rel.cz11a_c8r32
0.000	0.000	0.000	86.144	4.111	9.744	0.000	0.000	0.000	0.000	0.202	ma100617_rel.cz11a_c8r32
0.000	0.000	0.000	84.306	5.258	10.436	0.000	0.000	0.000	0.000	0.197	ma100617_rel.cz11apur1_c8r32
0.000	0.000	0.000	86.772	3.550	9.678	0.000	0.000	0.000	0.000	0.200	ma100617_rel_nops.cz11a_c8r32
0.000	0.000	0.000	86.836	3.344	9.819	0.000	0.000	0.000	0.000	0.226	ma100617marko_rel.cz11a_c8r32