Introduction
This is a report for the insert benchmark with 800M docs and 4 client(s). It is generated by scripts (bash, awk, sed) and Tufte might not be impressed. An overview of the insert benchmark is here and a short update is here. Below, by DBMS, I mean DBMS+version.config. An example is my8020.c10b40 where my means MySQL, 8020 is version 8.0.20 and c10b40 is the name for the configuration file.
The test server has 8 AMD cores, 16G RAM and an NVMe SSD. It is described here as the Beelink. The benchmark was run with 4 clients and there were 1 or 3 connections per client (1 for queries or inserts without rate limits, 1+1 for rate limited inserts+deletes). It uses 4 tables with a table per client. It loads 800M rows per table without secondary indexes, creates 3 secondary indexes per table, then inserts 2m rows per table with a delete per insert to avoid growing the table. It then does 6 read+write tests for 1800s each that do queries as fast as possible with 100,100,500,500,1000,1000 inserts/s and the same for deletes/s per client concurrent with the queries. The database is larger than memory. Clients and the DBMS share one server. The per-database configs are in the per-database subdirectories here.
The tested DBMS are:
- my5651_rel.cz11a_bee - MySQL 5.6.51 with the cz11a_bee config
- my5744_rel.cz11a_bee - MySQL 5.7.44 with the cz11a_bee config
- my8036_rel.cz11a_bee - MySQL 8.0.36 with the cz11a_bee config
- my8036_rel.cz11b_bee - MySQL 8.0.36 with the cz11b_bee config that uses innodb_flush_method=O_DIRECT
- my8036_rel.cz11c_bee - MySQL 8.0.36 with the cz11c_bee config that uses innodb_flush_method=fsync
- my8036_rel.cz11d_bee - MySQL 8.0.36 with the cz11d_bee config that uses innodb_change_buffering=none
Contents
- Summary
- l.i0: load without secondary indexes
- l.x: create secondary indexes
- l.i1: continue load after secondary indexes created with 50 inserts per transaction
- l.i2: continue load after secondary indexes created with 5 inserts per transaction
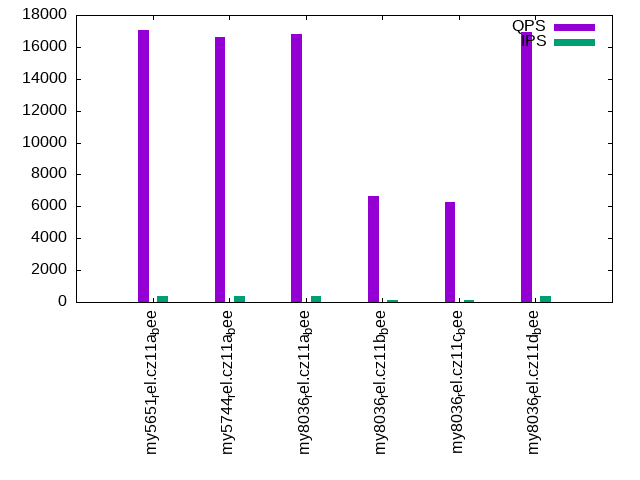
- qr100.L1: range queries with 100 insert/s per client
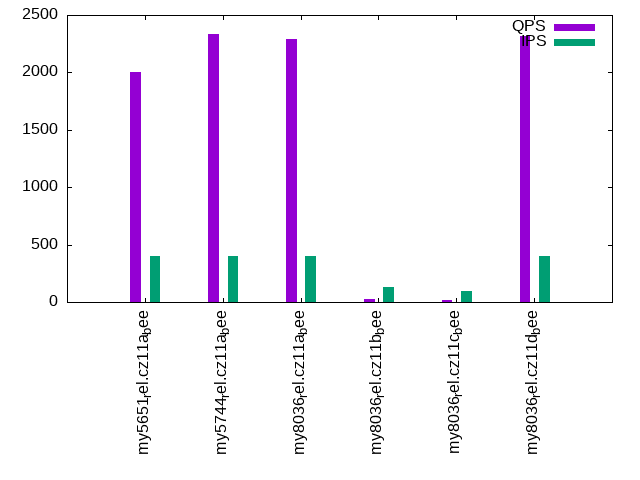
- qp100.L2: point queries with 100 insert/s per client
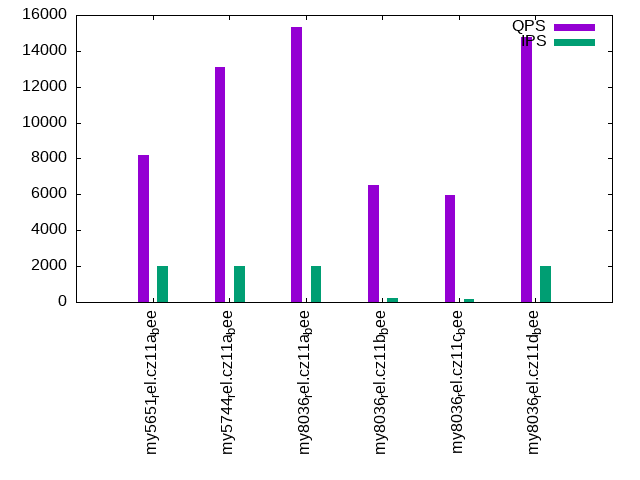
- qr500.L3: range queries with 500 insert/s per client
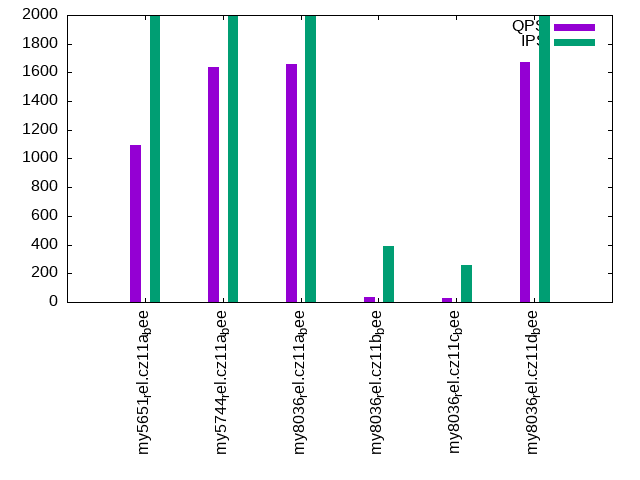
- qp500.L4: point queries with 500 insert/s per client
- qr1000.L5: range queries with 1000 insert/s per client
- qp1000.L6: point queries with 1000 insert/s per client
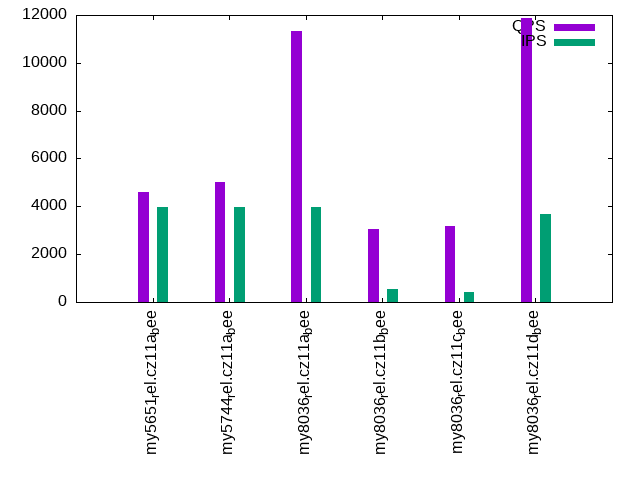
Summary
The numbers are inserts/s for l.i0, l.i1 and l.i2, indexed docs (or rows) /s for l.x and queries/s for qr100, qp100 thru qr1000, qp1000" The values are the average rate over the entire test for inserts (IPS) and queries (QPS). The range of values for IPS and QPS is split into 3 parts: bottom 25%, middle 50%, top 25%. Values in the bottom 25% have a red background, values in the top 25% have a green background and values in the middle have no color. A gray background is used for values that can be ignored because the DBMS did not sustain the target insert rate. Red backgrounds are not used when the minimum value is within 80% of the max value.
| dbms | l.i0 | l.x | l.i1 | l.i2 | qr100 | qp100 | qr500 | qp500 | qr1000 | qp1000 |
|---|---|---|---|---|---|---|---|---|---|---|
| my5651_rel.cz11a_bee | 292077 | 212936 | 3540 | 4665 | 17082 | 2005 | 8194 | 1094 | 4592 | 1020 |
| my5744_rel.cz11a_bee | 286533 | 423504 | 4798 | 5405 | 16593 | 2332 | 13106 | 1640 | 5018 | 1185 |
| my8036_rel.cz11a_bee | 198462 | 312867 | 4594 | 4040 | 16817 | 2294 | 15331 | 1660 | 11338 | 1175 |
| my8036_rel.cz11b_bee | 181653 | 52934 | 55 | 101 | 6626 | 28 | 6498 | 37 | 3038 | 44 |
| my8036_rel.cz11c_bee | 128970 | 43900 | 44 | 81 | 6249 | 21 | 5945 | 30 | 3176 | 39 |
| my8036_rel.cz11d_bee | 199054 | 310198 | 3610 | 3532 | 16917 | 2314 | 14778 | 1669 | 11877 | 1085 |
This table has relative throughput, throughput for the DBMS relative to the DBMS in the first line, using the absolute throughput from the previous table. Values less than 0.95 have a yellow background. Values greater than 1.05 have a blue background.
| dbms | l.i0 | l.x | l.i1 | l.i2 | qr100 | qp100 | qr500 | qp500 | qr1000 | qp1000 |
|---|---|---|---|---|---|---|---|---|---|---|
| my5651_rel.cz11a_bee | 1.00 | 1.00 | 1.00 | 1.00 | 1.00 | 1.00 | 1.00 | 1.00 | 1.00 | 1.00 |
| my5744_rel.cz11a_bee | 0.98 | 1.99 | 1.36 | 1.16 | 0.97 | 1.16 | 1.60 | 1.50 | 1.09 | 1.16 |
| my8036_rel.cz11a_bee | 0.68 | 1.47 | 1.30 | 0.87 | 0.98 | 1.14 | 1.87 | 1.52 | 2.47 | 1.15 |
| my8036_rel.cz11b_bee | 0.62 | 0.25 | 0.02 | 0.02 | 0.39 | 0.01 | 0.79 | 0.03 | 0.66 | 0.04 |
| my8036_rel.cz11c_bee | 0.44 | 0.21 | 0.01 | 0.02 | 0.37 | 0.01 | 0.73 | 0.03 | 0.69 | 0.04 |
| my8036_rel.cz11d_bee | 0.68 | 1.46 | 1.02 | 0.76 | 0.99 | 1.15 | 1.80 | 1.53 | 2.59 | 1.06 |
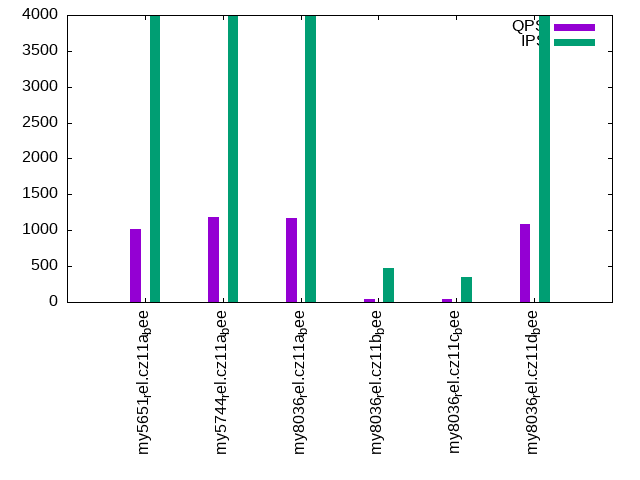
This lists the average rate of inserts/s for the tests that do inserts concurrent with queries. For such tests the query rate is listed in the table above. The read+write tests are setup so that the insert rate should match the target rate every second. Cells that are not at least 95% of the target have a red background to indicate a failure to satisfy the target.
| dbms | qr100.L1 | qp100.L2 | qr500.L3 | qp500.L4 | qr1000.L5 | qp1000.L6 |
|---|---|---|---|---|---|---|
| my5651_rel.cz11a_bee | 399 | 399 | 1993 | 1994 | 3989 | 3987 |
| my5744_rel.cz11a_bee | 399 | 399 | 1994 | 1993 | 3989 | 3989 |
| my8036_rel.cz11a_bee | 399 | 399 | 1994 | 1994 | 3989 | 3989 |
| my8036_rel.cz11b_bee | 127 | 134 | 210 | 390 | 550 | 469 |
| my8036_rel.cz11c_bee | 100 | 100 | 156 | 257 | 406 | 352 |
| my8036_rel.cz11d_bee | 399 | 399 | 1993 | 1994 | 3700 | 3987 |
| target | 400 | 400 | 2000 | 2000 | 4000 | 4000 |
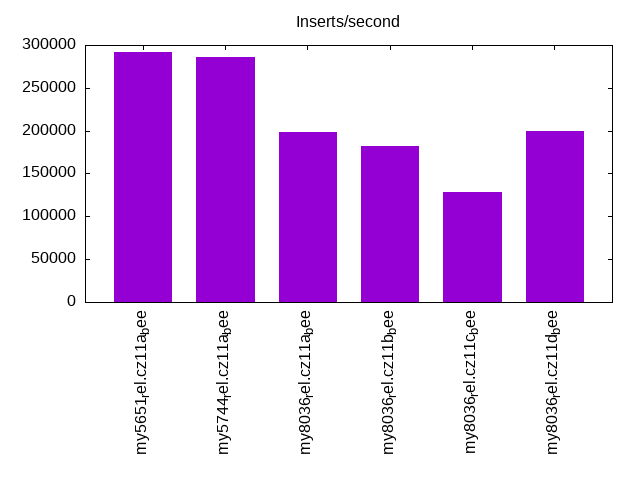
l.i0
l.i0: load without secondary indexes. Graphs for performance per 1-second interval are here.
Average throughput:
Insert response time histogram: each cell has the percentage of responses that take <= the time in the header and max is the max response time in seconds. For the max column values in the top 25% of the range have a red background and in the bottom 25% of the range have a green background. The red background is not used when the min value is within 80% of the max value.
| dbms | 256us | 1ms | 4ms | 16ms | 64ms | 256ms | 1s | 4s | 16s | gt | max |
|---|---|---|---|---|---|---|---|---|---|---|---|
| my5651_rel.cz11a_bee | 0.744 | 98.688 | 0.392 | 0.169 | 0.007 | 0.191 | |||||
| my5744_rel.cz11a_bee | 0.013 | 99.433 | 0.462 | 0.085 | 0.007 | 0.176 | |||||
| my8036_rel.cz11a_bee | 99.213 | 0.663 | 0.113 | 0.011 | 0.180 | ||||||
| my8036_rel.cz11b_bee | 99.164 | 0.704 | 0.086 | 0.033 | 0.005 | 0.007 | nonzero | 33.471 | |||
| my8036_rel.cz11c_bee | 99.186 | 0.471 | 0.113 | 0.059 | 0.150 | 0.022 | 1.118 | ||||
| my8036_rel.cz11d_bee | 99.211 | 0.690 | 0.089 | 0.010 | 0.171 |
Performance metrics for the DBMS listed above. Some are normalized by throughput, others are not. Legend for results is here.
ips	qps	rps	rmbps	wps	wmbps	rpq	rkbpq	wpi	wkbpi	csps	cpups	cspq	cpupq	dbgb1	dbgb2	rss	maxop	p50	p99	tag
292077	0	2377	9.3	1448.5	105.2	0.008	0.033	0.005	0.369	36249	77.0	0.124	21	52.6	68.1	10.7	0.191	72621	60535	my5651_rel.cz11a_bee
286533	0	1	0.0	1432.1	103.2	0.000	0.000	0.005	0.369	32472	79.0	0.113	22	52.6	68.2	11.0	0.176	72269	63231	my5744_rel.cz11a_bee
198462	0	1	0.0	1199.5	75.0	0.000	0.000	0.006	0.387	23629	74.0	0.119	30	52.5	68.1	11.1	0.180	50144	43453	my8036_rel.cz11a_bee
181653	0	1	0.0	1302.9	66.0	0.000	0.000	0.007	0.372	21415	70.0	0.118	31	52.5	68.0	11.2	33.471	49464	0	my8036_rel.cz11b_bee
128970	0	0	0.0	798.2	46.9	0.000	0.000	0.006	0.372	16545	51.1	0.128	32	52.5	68.0	11.2	1.118	31957	2097	my8036_rel.cz11c_bee
199054	0	1	0.0	1203.8	75.2	0.000	0.000	0.006	0.387	23871	74.5	0.120	30	52.5	68.1	11.1	0.171	50245	43352	my8036_rel.cz11d_bee
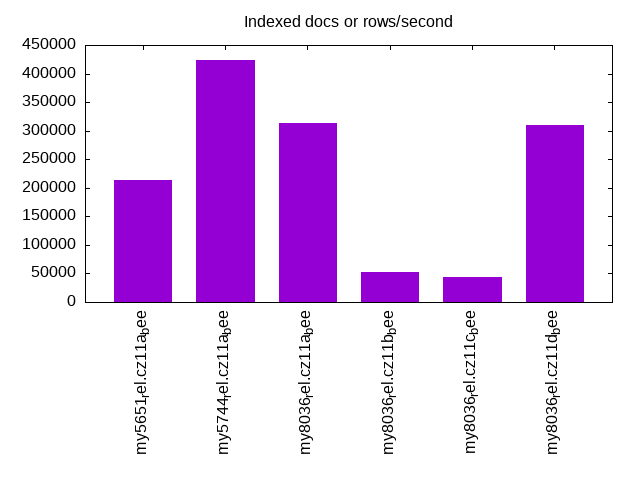
l.x
l.x: create secondary indexes.
Average throughput:
Performance metrics for the DBMS listed above. Some are normalized by throughput, others are not. Legend for results is here.
ips	qps	rps	rmbps	wps	wmbps	rpq	rkbpq	wpi	wkbpi	csps	cpups	cspq	cpupq	dbgb1	dbgb2	rss	maxop	p50	p99	tag
212936	0	1361	188.9	1833.7	249.1	0.006	0.909	0.009	1.198	5241	38.4	0.025	14	111.5	127.0	10.9	0.003	NA	NA	my5651_rel.cz11a_bee
423504	0	2550	373.7	3513.0	449.7	0.006	0.904	0.008	1.087	12061	45.9	0.028	9	121.2	136.7	11.1	0.002	NA	NA	my5744_rel.cz11a_bee
312867	0	4946	458.9	6281.3	408.6	0.016	1.502	0.020	1.337	18931	90.2	0.061	23	120.7	136.3	11.2	0.008	NA	NA	my8036_rel.cz11a_bee
52934	0	836	77.5	1316.7	70.1	0.016	1.499	0.025	1.357	7135	24.5	0.135	37	120.7	136.3	11.2	0.009	NA	NA	my8036_rel.cz11b_bee
43900	0	552	64.4	1102.7	58.2	0.013	1.503	0.025	1.358	6673	18.8	0.152	34	120.7	136.3	10.6	0.024	NA	NA	my8036_rel.cz11c_bee
310198	0	4908	455.3	6272.0	405.4	0.016	1.503	0.020	1.338	18721	90.4	0.060	23	120.7	136.3	11.2	0.009	NA	NA	my8036_rel.cz11d_bee
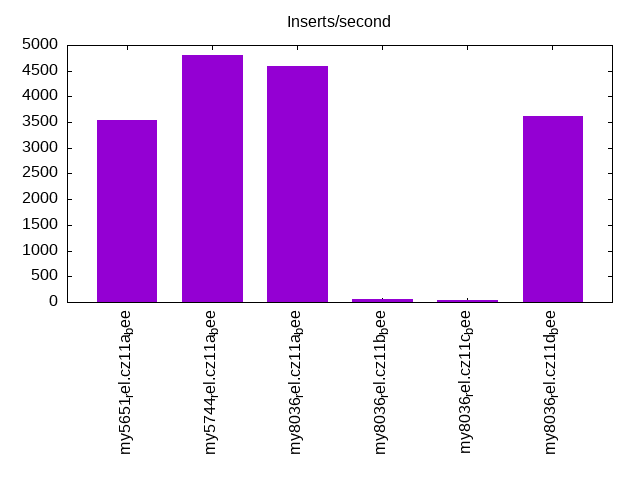
l.i1
l.i1: continue load after secondary indexes created with 50 inserts per transaction. Graphs for performance per 1-second interval are here.
Average throughput:
Insert response time histogram: each cell has the percentage of responses that take <= the time in the header and max is the max response time in seconds. For the max column values in the top 25% of the range have a red background and in the bottom 25% of the range have a green background. The red background is not used when the min value is within 80% of the max value.
| dbms | 256us | 1ms | 4ms | 16ms | 64ms | 256ms | 1s | 4s | 16s | gt | max |
|---|---|---|---|---|---|---|---|---|---|---|---|
| my5651_rel.cz11a_bee | 1.720 | 64.656 | 33.596 | 0.027 | 0.788 | ||||||
| my5744_rel.cz11a_bee | 11.283 | 71.025 | 17.691 | 0.001 | 0.323 | ||||||
| my8036_rel.cz11a_bee | 7.341 | 74.794 | 17.855 | 0.010 | 0.345 | ||||||
| my8036_rel.cz11b_bee | 0.636 | 0.127 | 0.268 | 63.499 | 35.470 | 10.888 | |||||
| my8036_rel.cz11c_bee | 0.023 | 0.616 | 0.084 | 47.270 | 52.007 | 14.718 | |||||
| my8036_rel.cz11d_bee | 0.010 | 65.422 | 34.562 | 0.005 | 0.464 |
Delete response time histogram: each cell has the percentage of responses that take <= the time in the header and max is the max response time in seconds. For the max column values in the top 25% of the range have a red background and in the bottom 25% of the range have a green background. The red background is not used when the min value is within 80% of the max value.
| dbms | 256us | 1ms | 4ms | 16ms | 64ms | 256ms | 1s | 4s | 16s | gt | max |
|---|---|---|---|---|---|---|---|---|---|---|---|
| my5651_rel.cz11a_bee | 12.957 | 65.575 | 21.360 | 0.106 | 0.002 | 0.344 | |||||
| my5744_rel.cz11a_bee | 67.806 | 30.735 | 1.448 | 0.010 | 0.103 | ||||||
| my8036_rel.cz11a_bee | 53.660 | 42.938 | 2.958 | 0.444 | 0.164 | ||||||
| my8036_rel.cz11b_bee | 20.566 | 1.733 | 16.733 | 36.210 | 24.486 | 0.273 | 2.319 | ||||
| my8036_rel.cz11c_bee | 5.324 | 14.836 | 7.703 | 36.480 | 35.349 | 0.307 | 3.298 | ||||
| my8036_rel.cz11d_bee | 24.547 | 67.059 | 8.393 | 0.001 | 0.330 |
Performance metrics for the DBMS listed above. Some are normalized by throughput, others are not. Legend for results is here.
ips	qps	rps	rmbps	wps	wmbps	rpq	rkbpq	wpi	wkbpi	csps	cpups	cspq	cpupq	dbgb1	dbgb2	rss	maxop	p50	p99	tag
3540	0	12981	201.4	24846.1	538.6	3.667	58.259	7.019	155.806	90397	33.0	25.537	746	157.5	174.0	10.5	0.788	750	449	my5651_rel.cz11a_bee
4798	0	18354	286.8	23589.6	741.7	3.826	61.209	4.917	158.303	116454	47.5	24.273	792	156.3	172.6	10.7	0.323	1099	549	my5744_rel.cz11a_bee
4594	0	18874	294.9	28283.7	776.1	4.108	65.727	6.156	172.972	111639	53.0	24.299	923	153.7	170.0	10.8	0.345	1099	599	my8036_rel.cz11a_bee
55	0	282	4.4	768.5	11.1	5.159	82.537	14.074	209.049	11729	3.1	214.825	4542	151.3	167.3	10.7	10.888	0	0	my8036_rel.cz11b_bee
44	0	223	4.0	737.5	9.1	5.086	93.607	16.838	212.290	12707	3.6	290.125	6575	151.0	167.0	10.6	14.718	0	0	my8036_rel.cz11c_bee
3610	0	22080	345.0	31203.9	840.9	6.117	97.870	8.644	238.544	134369	48.8	37.224	1082	144.0	159.6	10.7	0.464	944	599	my8036_rel.cz11d_bee
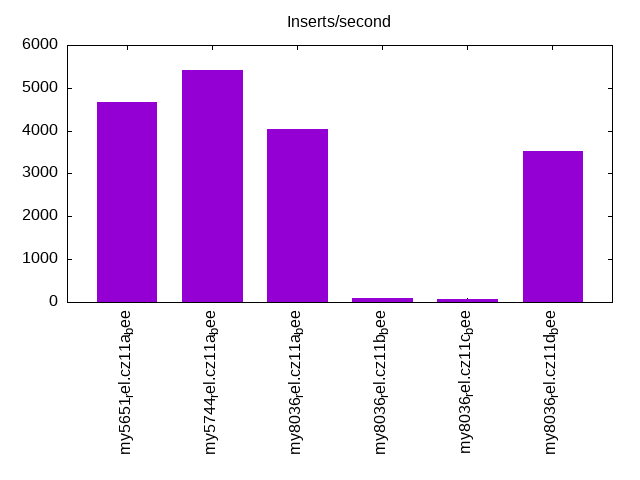
l.i2
l.i2: continue load after secondary indexes created with 5 inserts per transaction. Graphs for performance per 1-second interval are here.
Average throughput:
Insert response time histogram: each cell has the percentage of responses that take <= the time in the header and max is the max response time in seconds. For the max column values in the top 25% of the range have a red background and in the bottom 25% of the range have a green background. The red background is not used when the min value is within 80% of the max value.
| dbms | 256us | 1ms | 4ms | 16ms | 64ms | 256ms | 1s | 4s | 16s | gt | max |
|---|---|---|---|---|---|---|---|---|---|---|---|
| my5651_rel.cz11a_bee | 11.064 | 53.145 | 34.187 | 1.599 | 0.005 | 0.101 | |||||
| my5744_rel.cz11a_bee | 9.545 | 65.633 | 23.439 | 1.382 | 0.001 | 0.068 | |||||
| my8036_rel.cz11a_bee | 1.999 | 65.667 | 29.521 | 2.192 | 0.622 | 0.210 | |||||
| my8036_rel.cz11b_bee | 2.649 | 3.429 | 1.112 | 11.481 | 52.513 | 28.803 | 0.011 | 1.272 | |||
| my8036_rel.cz11c_bee | 1.433 | 5.199 | 1.511 | 8.823 | 44.102 | 38.473 | 0.459 | 1.809 | |||
| my8036_rel.cz11d_bee | 61.135 | 35.541 | 2.882 | 0.443 | 0.119 |
Delete response time histogram: each cell has the percentage of responses that take <= the time in the header and max is the max response time in seconds. For the max column values in the top 25% of the range have a red background and in the bottom 25% of the range have a green background. The red background is not used when the min value is within 80% of the max value.
| dbms | 256us | 1ms | 4ms | 16ms | 64ms | 256ms | 1s | 4s | 16s | gt | max |
|---|---|---|---|---|---|---|---|---|---|---|---|
| my5651_rel.cz11a_bee | 20.069 | 60.684 | 18.446 | 0.800 | 0.002 | 0.084 | |||||
| my5744_rel.cz11a_bee | 38.707 | 54.173 | 6.921 | 0.198 | 0.001 | 0.064 | |||||
| my8036_rel.cz11a_bee | 18.626 | 74.337 | 6.059 | 0.529 | 0.449 | 0.207 | |||||
| my8036_rel.cz11b_bee | 23.380 | 36.482 | 4.364 | 21.924 | 13.675 | 0.153 | 0.022 | 1.915 | |||
| my8036_rel.cz11c_bee | 13.402 | 40.672 | 5.800 | 21.106 | 18.476 | 0.525 | 0.018 | 2.743 | |||
| my8036_rel.cz11d_bee | 0.001 | 71.793 | 26.085 | 1.764 | 0.357 | 0.145 |
Performance metrics for the DBMS listed above. Some are normalized by throughput, others are not. Legend for results is here.
ips	qps	rps	rmbps	wps	wmbps	rpq	rkbpq	wpi	wkbpi	csps	cpups	cspq	cpupq	dbgb1	dbgb2	rss	maxop	p50	p99	tag
4665	0	10823	155.4	17262.7	402.4	2.320	34.122	3.701	88.329	86945	50.2	18.639	861	158.6	175.6	10.5	0.101	1164	904	my5651_rel.cz11a_bee
5405	0	13421	209.7	17865.7	552.3	2.483	39.727	3.305	104.619	102226	62.2	18.912	921	156.8	173.7	10.7	0.068	1359	1090	my5744_rel.cz11a_bee
4040	0	15058	235.3	22662.7	600.1	3.727	59.629	5.609	152.095	97580	63.3	24.151	1253	153.7	170.2	10.8	0.210	1009	614	my8036_rel.cz11a_bee
101	0	295	4.6	799.6	11.6	2.930	46.880	7.933	117.581	6204	5.7	61.549	4524	154.1	170.2	10.8	1.272	25	10	my8036_rel.cz11b_bee
81	0	232	4.6	762.8	9.5	2.875	58.099	9.463	120.761	7012	6.8	87.002	6749	153.8	169.9	8.3	1.809	20	5	my8036_rel.cz11c_bee
3532	0	19754	308.7	27187.5	710.6	5.593	89.487	7.697	206.013	121212	52.0	34.318	1178	144.0	159.6	10.7	0.119	904	655	my8036_rel.cz11d_bee
qr100.L1
qr100.L1: range queries with 100 insert/s per client. Graphs for performance per 1-second interval are here.
Average throughput:
Query response time histogram: each cell has the percentage of responses that take <= the time in the header and max is the max response time in seconds. For max values in the top 25% of the range have a red background and in the bottom 25% of the range have a green background. The red background is not used when the min value is within 80% of the max value.
| dbms | 256us | 1ms | 4ms | 16ms | 64ms | 256ms | 1s | 4s | 16s | gt | max |
|---|---|---|---|---|---|---|---|---|---|---|---|
| my5651_rel.cz11a_bee | 89.659 | 8.564 | 1.554 | 0.222 | 0.002 | nonzero | 0.070 | ||||
| my5744_rel.cz11a_bee | 83.500 | 15.710 | 0.646 | 0.143 | 0.002 | 0.058 | |||||
| my8036_rel.cz11a_bee | 76.133 | 23.738 | 0.125 | 0.004 | nonzero | 0.034 | |||||
| my8036_rel.cz11b_bee | 38.357 | 57.869 | 3.103 | 0.226 | 0.382 | 0.057 | 0.007 | nonzero | 1.364 | ||
| my8036_rel.cz11c_bee | 40.723 | 55.571 | 3.059 | 0.200 | 0.344 | 0.095 | 0.008 | nonzero | 1.422 | ||
| my8036_rel.cz11d_bee | 75.114 | 24.838 | 0.043 | 0.005 | nonzero | 0.028 |
Insert response time histogram: each cell has the percentage of responses that take <= the time in the header and max is the max response time in seconds. For max values in the top 25% of the range have a red background and in the bottom 25% of the range have a green background. The red background is not used when the min value is within 80% of the max value.
| dbms | 256us | 1ms | 4ms | 16ms | 64ms | 256ms | 1s | 4s | 16s | gt | max |
|---|---|---|---|---|---|---|---|---|---|---|---|
| my5651_rel.cz11a_bee | 0.160 | 88.181 | 11.660 | 0.149 | |||||||
| my5744_rel.cz11a_bee | 9.507 | 83.271 | 7.222 | 0.177 | |||||||
| my8036_rel.cz11a_bee | 0.438 | 96.458 | 3.104 | 0.185 | |||||||
| my8036_rel.cz11b_bee | 12.403 | 87.583 | 0.014 | 4.280 | |||||||
| my8036_rel.cz11c_bee | 0.021 | 6.729 | 91.361 | 1.889 | 5.680 | ||||||
| my8036_rel.cz11d_bee | 0.104 | 99.090 | 0.806 | 0.153 |
Delete response time histogram: each cell has the percentage of responses that take <= the time in the header and max is the max response time in seconds. For max values in the top 25% of the range have a red background and in the bottom 25% of the range have a green background. The red background is not used when the min value is within 80% of the max value.
| dbms | 256us | 1ms | 4ms | 16ms | 64ms | 256ms | 1s | 4s | 16s | gt | max |
|---|---|---|---|---|---|---|---|---|---|---|---|
| my5651_rel.cz11a_bee | 40.951 | 49.188 | 9.840 | 0.021 | 0.077 | ||||||
| my5744_rel.cz11a_bee | 88.931 | 10.312 | 0.750 | 0.007 | 0.071 | ||||||
| my8036_rel.cz11a_bee | 90.014 | 9.229 | 0.556 | 0.201 | 0.110 | ||||||
| my8036_rel.cz11b_bee | 12.028 | 1.292 | 13.896 | 46.299 | 26.472 | 0.014 | 1.089 | ||||
| my8036_rel.cz11c_bee | 2.819 | 7.778 | 5.590 | 41.417 | 42.354 | 0.042 | 1.208 | ||||
| my8036_rel.cz11d_bee | 46.799 | 52.743 | 0.458 | 0.130 |
Performance metrics for the DBMS listed above. Some are normalized by throughput, others are not. Legend for results is here.
ips	qps	rps	rmbps	wps	wmbps	rpq	rkbpq	wpi	wkbpi	csps	cpups	cspq	cpupq	dbgb1	dbgb2	rss	maxop	p50	p99	tag
399	17082	7371	115.0	10759.6	226.4	0.432	6.893	26.980	581.360	102641	50.4	6.009	236	158.6	175.6	10.5	0.070	3788	784	my5651_rel.cz11a_bee
399	16593	5432	84.9	6230.7	181.2	0.327	5.237	15.624	465.350	89916	54.5	5.419	263	156.8	173.7	10.7	0.058	4491	1055	my5744_rel.cz11a_bee
399	16817	3403	53.2	4924.2	127.9	0.202	3.237	12.348	328.352	78626	56.3	4.676	268	153.7	170.2	10.8	0.034	4251	3181	my8036_rel.cz11a_bee
127	6626	330	5.1	852.5	12.2	0.050	0.795	6.702	98.153	31910	36.3	4.815	438	155.2	171.4	10.8	1.364	1759	48	my8036_rel.cz11b_bee
100	6249	245	4.9	780.0	9.7	0.039	0.811	7.839	99.931	30694	35.4	4.912	453	155.0	171.3	8.7	1.422	1550	32	my8036_rel.cz11c_bee
399	16917	2215	34.6	2881.9	75.2	0.131	2.095	7.226	192.991	74228	53.6	4.388	253	144.0	159.6	10.8	0.028	4237	3516	my8036_rel.cz11d_bee
qp100.L2
qp100.L2: point queries with 100 insert/s per client. Graphs for performance per 1-second interval are here.
Average throughput:
Query response time histogram: each cell has the percentage of responses that take <= the time in the header and max is the max response time in seconds. For max values in the top 25% of the range have a red background and in the bottom 25% of the range have a green background. The red background is not used when the min value is within 80% of the max value.
| dbms | 256us | 1ms | 4ms | 16ms | 64ms | 256ms | 1s | 4s | 16s | gt | max |
|---|---|---|---|---|---|---|---|---|---|---|---|
| my5651_rel.cz11a_bee | 0.259 | 97.159 | 2.574 | 0.007 | 0.045 | ||||||
| my5744_rel.cz11a_bee | 0.416 | 97.669 | 1.909 | 0.006 | 0.043 | ||||||
| my8036_rel.cz11a_bee | 0.187 | 98.150 | 1.652 | 0.011 | 0.053 | ||||||
| my8036_rel.cz11b_bee | 0.886 | 0.788 | 12.912 | 76.021 | 9.393 | 0.712 | |||||
| my8036_rel.cz11c_bee | 1.301 | 1.060 | 7.739 | 65.883 | 24.017 | 0.888 | |||||
| my8036_rel.cz11d_bee | 0.190 | 98.366 | 1.431 | 0.014 | 0.052 |
Insert response time histogram: each cell has the percentage of responses that take <= the time in the header and max is the max response time in seconds. For max values in the top 25% of the range have a red background and in the bottom 25% of the range have a green background. The red background is not used when the min value is within 80% of the max value.
| dbms | 256us | 1ms | 4ms | 16ms | 64ms | 256ms | 1s | 4s | 16s | gt | max |
|---|---|---|---|---|---|---|---|---|---|---|---|
| my5651_rel.cz11a_bee | 2.000 | 97.799 | 0.201 | 0.087 | |||||||
| my5744_rel.cz11a_bee | 24.722 | 75.215 | 0.062 | 0.076 | |||||||
| my8036_rel.cz11a_bee | 6.438 | 93.458 | 0.104 | 0.122 | |||||||
| my8036_rel.cz11b_bee | 0.007 | 0.049 | 15.931 | 83.965 | 0.049 | 4.346 | |||||
| my8036_rel.cz11c_bee | 0.035 | 3.931 | 94.660 | 1.375 | 6.710 | ||||||
| my8036_rel.cz11d_bee | 0.069 | 99.812 | 0.118 | 0.139 |
Delete response time histogram: each cell has the percentage of responses that take <= the time in the header and max is the max response time in seconds. For max values in the top 25% of the range have a red background and in the bottom 25% of the range have a green background. The red background is not used when the min value is within 80% of the max value.
| dbms | 256us | 1ms | 4ms | 16ms | 64ms | 256ms | 1s | 4s | 16s | gt | max |
|---|---|---|---|---|---|---|---|---|---|---|---|
| my5651_rel.cz11a_bee | 64.389 | 32.778 | 2.833 | 0.037 | |||||||
| my5744_rel.cz11a_bee | 89.889 | 10.076 | 0.035 | 0.026 | |||||||
| my8036_rel.cz11a_bee | 85.812 | 14.069 | 0.090 | 0.028 | 0.111 | ||||||
| my8036_rel.cz11b_bee | 5.910 | 9.361 | 12.556 | 27.417 | 43.493 | 1.264 | 1.956 | ||||
| my8036_rel.cz11c_bee | 0.188 | 9.118 | 3.639 | 19.736 | 64.347 | 2.972 | 2.433 | ||||
| my8036_rel.cz11d_bee | 22.611 | 77.347 | 0.042 | 0.121 |
Performance metrics for the DBMS listed above. Some are normalized by throughput, others are not. Legend for results is here.
ips	qps	rps	rmbps	wps	wmbps	rpq	rkbpq	wpi	wkbpi	csps	cpups	cspq	cpupq	dbgb1	dbgb2	rss	maxop	p50	p99	tag
399	2005	20097	313.8	3302.2	99.7	10.025	160.303	8.280	256.053	57763	24.9	28.812	994	158.6	175.6	10.5	0.045	496	447	my5651_rel.cz11a_bee
399	2332	22732	355.2	3743.2	99.1	9.750	156.000	9.386	254.374	66996	21.1	28.735	724	156.8	173.7	10.7	0.043	591	543	my5744_rel.cz11a_bee
399	2294	22307	348.5	3984.4	103.4	9.724	155.582	9.991	265.399	63119	23.1	27.515	806	153.7	170.2	10.8	0.053	575	543	my8036_rel.cz11a_bee
134	28	582	9.1	878.8	12.8	21.183	338.921	6.544	97.507	7016	5.8	255.144	16873	156.5	172.9	10.8	0.712	0	0	my8036_rel.cz11b_bee
100	21	432	8.1	794.3	9.8	20.647	398.772	7.919	100.450	7622	5.4	364.687	20670	156.3	172.7	8.6	0.888	0	0	my8036_rel.cz11c_bee
399	2314	22326	348.8	3722.4	95.8	9.650	154.400	9.334	245.909	62831	22.0	27.157	761	144.0	159.6	10.8	0.052	576	543	my8036_rel.cz11d_bee
qr500.L3
qr500.L3: range queries with 500 insert/s per client. Graphs for performance per 1-second interval are here.
Average throughput:
Query response time histogram: each cell has the percentage of responses that take <= the time in the header and max is the max response time in seconds. For max values in the top 25% of the range have a red background and in the bottom 25% of the range have a green background. The red background is not used when the min value is within 80% of the max value.
| dbms | 256us | 1ms | 4ms | 16ms | 64ms | 256ms | 1s | 4s | 16s | gt | max |
|---|---|---|---|---|---|---|---|---|---|---|---|
| my5651_rel.cz11a_bee | 73.482 | 17.127 | 7.476 | 1.899 | 0.016 | nonzero | 0.065 | ||||
| my5744_rel.cz11a_bee | 80.898 | 16.208 | 2.394 | 0.493 | 0.007 | nonzero | 0.071 | ||||
| my8036_rel.cz11a_bee | 69.920 | 29.769 | 0.292 | 0.018 | nonzero | 0.045 | |||||
| my8036_rel.cz11b_bee | 37.780 | 58.253 | 3.320 | 0.259 | 0.328 | 0.057 | 0.005 | 0.648 | |||
| my8036_rel.cz11c_bee | 39.160 | 56.899 | 3.244 | 0.246 | 0.355 | 0.090 | 0.007 | 0.943 | |||
| my8036_rel.cz11d_bee | 66.799 | 32.620 | 0.534 | 0.046 | 0.001 | 0.042 |
Insert response time histogram: each cell has the percentage of responses that take <= the time in the header and max is the max response time in seconds. For max values in the top 25% of the range have a red background and in the bottom 25% of the range have a green background. The red background is not used when the min value is within 80% of the max value.
| dbms | 256us | 1ms | 4ms | 16ms | 64ms | 256ms | 1s | 4s | 16s | gt | max |
|---|---|---|---|---|---|---|---|---|---|---|---|
| my5651_rel.cz11a_bee | 2.151 | 82.903 | 14.946 | 0.197 | |||||||
| my5744_rel.cz11a_bee | 16.782 | 81.703 | 1.515 | 0.127 | |||||||
| my8036_rel.cz11a_bee | 6.663 | 89.565 | 3.772 | 0.233 | |||||||
| my8036_rel.cz11b_bee | 0.001 | 0.004 | 0.032 | 1.746 | 58.232 | 39.985 | 3.263 | ||||
| my8036_rel.cz11c_bee | 0.008 | 0.017 | 0.682 | 38.417 | 60.804 | 0.072 | 5.487 | ||||
| my8036_rel.cz11d_bee | 3.667 | 90.169 | 6.164 | 0.198 |
Delete response time histogram: each cell has the percentage of responses that take <= the time in the header and max is the max response time in seconds. For max values in the top 25% of the range have a red background and in the bottom 25% of the range have a green background. The red background is not used when the min value is within 80% of the max value.
| dbms | 256us | 1ms | 4ms | 16ms | 64ms | 256ms | 1s | 4s | 16s | gt | max |
|---|---|---|---|---|---|---|---|---|---|---|---|
| my5651_rel.cz11a_bee | 33.011 | 54.674 | 12.253 | 0.062 | 0.098 | ||||||
| my5744_rel.cz11a_bee | 86.469 | 12.912 | 0.618 | 0.051 | |||||||
| my8036_rel.cz11a_bee | 68.396 | 29.039 | 1.638 | 0.928 | 0.134 | ||||||
| my8036_rel.cz11b_bee | 13.732 | 3.343 | 15.228 | 46.565 | 21.126 | 0.006 | 1.334 | ||||
| my8036_rel.cz11c_bee | 3.931 | 7.636 | 5.317 | 42.418 | 40.617 | 0.082 | 1.678 | ||||
| my8036_rel.cz11d_bee | 29.750 | 67.536 | 2.714 | 0.178 |
Performance metrics for the DBMS listed above. Some are normalized by throughput, others are not. Legend for results is here.
ips	qps	rps	rmbps	wps	wmbps	rpq	rkbpq	wpi	wkbpi	csps	cpups	cspq	cpupq	dbgb1	dbgb2	rss	maxop	p50	p99	tag
1993	8194	14656	228.2	21897.5	400.2	1.789	28.518	10.986	205.614	106166	47.8	12.957	467	158.6	175.6	10.5	0.065	2111	799	my5651_rel.cz11a_bee
1994	13106	14212	222.1	13713.7	411.8	1.084	17.350	6.876	211.430	109978	59.8	8.392	365	156.8	173.7	10.7	0.071	3404	1439	my5744_rel.cz11a_bee
1994	15331	10925	170.7	14939.5	389.7	0.713	11.402	7.491	200.074	100169	71.7	6.534	374	153.7	170.2	10.8	0.045	3837	3324	my8036_rel.cz11a_bee
210	6498	309	4.8	848.4	12.4	0.048	0.761	4.032	60.479	30847	38.5	4.747	474	161.8	179.2	10.8	0.648	1694	368	my8036_rel.cz11b_bee
156	5945	224	5.0	763.7	9.8	0.038	0.857	4.908	64.456	29289	37.0	4.927	498	161.6	179.0	9.0	0.943	1390	256	my8036_rel.cz11c_bee
1993	14778	10805	168.8	14768.5	381.6	0.731	11.698	7.409	196.025	106188	67.1	7.185	363	144.0	159.6	10.8	0.042	3694	3117	my8036_rel.cz11d_bee
qp500.L4
qp500.L4: point queries with 500 insert/s per client. Graphs for performance per 1-second interval are here.
Average throughput:
Query response time histogram: each cell has the percentage of responses that take <= the time in the header and max is the max response time in seconds. For max values in the top 25% of the range have a red background and in the bottom 25% of the range have a green background. The red background is not used when the min value is within 80% of the max value.
| dbms | 256us | 1ms | 4ms | 16ms | 64ms | 256ms | 1s | 4s | 16s | gt | max |
|---|---|---|---|---|---|---|---|---|---|---|---|
| my5651_rel.cz11a_bee | 0.002 | 61.484 | 38.450 | 0.065 | nonzero | 0.078 | |||||
| my5744_rel.cz11a_bee | 0.017 | 87.419 | 12.522 | 0.042 | 0.052 | ||||||
| my8036_rel.cz11a_bee | 0.006 | 90.075 | 9.829 | 0.090 | nonzero | 0.078 | |||||
| my8036_rel.cz11b_bee | 2.985 | 2.219 | 27.114 | 64.648 | 3.034 | 0.845 | |||||
| my8036_rel.cz11c_bee | 4.463 | 3.682 | 20.448 | 60.499 | 10.907 | 0.809 | |||||
| my8036_rel.cz11d_bee | 0.006 | 90.934 | 8.875 | 0.186 | nonzero | 0.073 |
Insert response time histogram: each cell has the percentage of responses that take <= the time in the header and max is the max response time in seconds. For max values in the top 25% of the range have a red background and in the bottom 25% of the range have a green background. The red background is not used when the min value is within 80% of the max value.
| dbms | 256us | 1ms | 4ms | 16ms | 64ms | 256ms | 1s | 4s | 16s | gt | max |
|---|---|---|---|---|---|---|---|---|---|---|---|
| my5651_rel.cz11a_bee | 2.292 | 67.579 | 30.129 | 0.231 | |||||||
| my5744_rel.cz11a_bee | 27.396 | 71.964 | 0.640 | 0.121 | |||||||
| my8036_rel.cz11a_bee | 7.639 | 90.569 | 1.792 | 0.171 | |||||||
| my8036_rel.cz11b_bee | 0.018 | 2.457 | 3.772 | 23.106 | 61.479 | 9.167 | 0.001 | 4.040 | |||
| my8036_rel.cz11c_bee | 0.019 | 2.865 | 1.172 | 11.561 | 56.200 | 28.171 | 0.011 | 5.113 | |||
| my8036_rel.cz11d_bee | 0.340 | 90.818 | 8.842 | 0.180 |
Delete response time histogram: each cell has the percentage of responses that take <= the time in the header and max is the max response time in seconds. For max values in the top 25% of the range have a red background and in the bottom 25% of the range have a green background. The red background is not used when the min value is within 80% of the max value.
| dbms | 256us | 1ms | 4ms | 16ms | 64ms | 256ms | 1s | 4s | 16s | gt | max |
|---|---|---|---|---|---|---|---|---|---|---|---|
| my5651_rel.cz11a_bee | 37.896 | 50.774 | 11.306 | 0.025 | 0.105 | ||||||
| my5744_rel.cz11a_bee | 90.604 | 9.175 | 0.221 | 0.045 | |||||||
| my8036_rel.cz11a_bee | 73.218 | 25.918 | 0.379 | 0.485 | 0.115 | ||||||
| my8036_rel.cz11b_bee | 0.342 | 23.468 | 16.137 | 34.400 | 24.049 | 1.603 | 0.001 | 4.046 | |||
| my8036_rel.cz11c_bee | 0.082 | 18.029 | 5.083 | 26.742 | 45.310 | 4.754 | 3.184 | ||||
| my8036_rel.cz11d_bee | 5.844 | 91.010 | 3.146 | 0.174 |
Performance metrics for the DBMS listed above. Some are normalized by throughput, others are not. Legend for results is here.
ips	qps	rps	rmbps	wps	wmbps	rpq	rkbpq	wpi	wkbpi	csps	cpups	cspq	cpupq	dbgb1	dbgb2	rss	maxop	p50	p99	tag
1994	1094	21458	334.5	22621.6	371.9	19.621	313.171	11.343	190.962	94887	40.9	86.765	2992	158.6	175.6	10.5	0.078	272	240	my5651_rel.cz11a_bee
1993	1640	26692	417.1	13755.0	387.6	16.271	260.343	6.901	199.130	105473	34.0	64.297	1658	156.8	173.7	10.7	0.052	416	336	my5744_rel.cz11a_bee
1994	1660	26881	420.0	15491.0	399.8	16.192	259.064	7.767	205.274	98233	38.7	59.169	1865	153.7	170.2	10.8	0.078	416	368	my8036_rel.cz11a_bee
390	37	651	10.2	861.0	13.0	17.594	281.501	2.207	34.239	12725	5.9	343.912	12757	164.7	183.8	10.8	0.845	16	0	my8036_rel.cz11b_bee
257	30	487	10.2	740.4	9.9	15.961	343.664	2.885	39.642	12131	5.9	397.723	15475	164.5	183.4	9.0	0.809	0	0	my8036_rel.cz11c_bee
1994	1669	27032	422.4	15461.4	397.8	16.200	259.193	7.752	204.226	98827	36.3	59.224	1740	144.0	159.6	10.8	0.073	416	384	my8036_rel.cz11d_bee
qr1000.L5
qr1000.L5: range queries with 1000 insert/s per client. Graphs for performance per 1-second interval are here.
Average throughput:
Query response time histogram: each cell has the percentage of responses that take <= the time in the header and max is the max response time in seconds. For max values in the top 25% of the range have a red background and in the bottom 25% of the range have a green background. The red background is not used when the min value is within 80% of the max value.
| dbms | 256us | 1ms | 4ms | 16ms | 64ms | 256ms | 1s | 4s | 16s | gt | max |
|---|---|---|---|---|---|---|---|---|---|---|---|
| my5651_rel.cz11a_bee | 53.651 | 26.866 | 13.721 | 5.716 | 0.046 | nonzero | 0.075 | ||||
| my5744_rel.cz11a_bee | 45.733 | 37.056 | 12.498 | 4.673 | 0.039 | nonzero | 0.068 | ||||
| my8036_rel.cz11a_bee | 48.035 | 49.091 | 2.713 | 0.156 | 0.005 | nonzero | 0.101 | ||||
| my8036_rel.cz11b_bee | 28.284 | 55.960 | 14.317 | 0.627 | 0.489 | 0.281 | 0.043 | nonzero | 3.681 | ||
| my8036_rel.cz11c_bee | 31.418 | 54.014 | 13.200 | 0.575 | 0.503 | 0.248 | 0.042 | nonzero | nonzero | 4.760 | |
| my8036_rel.cz11d_bee | 46.308 | 52.085 | 1.572 | 0.030 | 0.005 | 0.053 |
Insert response time histogram: each cell has the percentage of responses that take <= the time in the header and max is the max response time in seconds. For max values in the top 25% of the range have a red background and in the bottom 25% of the range have a green background. The red background is not used when the min value is within 80% of the max value.
| dbms | 256us | 1ms | 4ms | 16ms | 64ms | 256ms | 1s | 4s | 16s | gt | max |
|---|---|---|---|---|---|---|---|---|---|---|---|
| my5651_rel.cz11a_bee | 3.374 | 90.203 | 6.423 | 0.192 | |||||||
| my5744_rel.cz11a_bee | 8.190 | 90.835 | 0.976 | 0.139 | |||||||
| my8036_rel.cz11a_bee | 4.340 | 88.696 | 6.965 | 0.242 | |||||||
| my8036_rel.cz11b_bee | 0.472 | 6.148 | 7.848 | 33.906 | 46.297 | 5.322 | 0.009 | 5.600 | |||
| my8036_rel.cz11c_bee | 0.215 | 6.040 | 2.346 | 21.593 | 61.214 | 8.578 | 0.013 | 5.201 | |||
| my8036_rel.cz11d_bee | 0.012 | 72.845 | 27.143 | 0.214 |
Delete response time histogram: each cell has the percentage of responses that take <= the time in the header and max is the max response time in seconds. For max values in the top 25% of the range have a red background and in the bottom 25% of the range have a green background. The red background is not used when the min value is within 80% of the max value.
| dbms | 256us | 1ms | 4ms | 16ms | 64ms | 256ms | 1s | 4s | 16s | gt | max |
|---|---|---|---|---|---|---|---|---|---|---|---|
| my5651_rel.cz11a_bee | 33.590 | 56.477 | 9.883 | 0.049 | 0.151 | ||||||
| my5744_rel.cz11a_bee | 82.301 | 17.024 | 0.672 | 0.003 | 0.078 | ||||||
| my8036_rel.cz11a_bee | 39.001 | 50.431 | 9.679 | 0.889 | 0.144 | ||||||
| my8036_rel.cz11b_bee | 3.174 | 14.128 | 13.775 | 35.203 | 30.246 | 3.469 | 0.005 | 6.922 | |||
| my8036_rel.cz11c_bee | 2.415 | 12.197 | 4.658 | 29.698 | 46.691 | 4.338 | 0.004 | 4.839 | |||
| my8036_rel.cz11d_bee | 5.112 | 88.717 | 6.171 | 0.199 |
Performance metrics for the DBMS listed above. Some are normalized by throughput, others are not. Legend for results is here.
ips	qps	rps	rmbps	wps	wmbps	rpq	rkbpq	wpi	wkbpi	csps	cpups	cspq	cpupq	dbgb1	dbgb2	rss	maxop	p50	p99	tag
3989	4592	16477	255.9	25404.6	446.4	3.588	57.067	6.369	114.590	103731	48.4	22.589	843	158.6	175.6	10.5	0.075	1167	559	my5651_rel.cz11a_bee
3989	5018	24910	389.2	22179.7	669.5	4.964	79.417	5.560	171.879	135373	57.5	26.975	917	156.8	173.7	10.7	0.068	1263	991	my5744_rel.cz11a_bee
3989	11338	15280	238.8	21845.1	565.3	1.348	21.562	5.476	145.126	99647	83.4	8.788	588	153.7	170.2	10.8	0.101	2845	2206	my8036_rel.cz11a_bee
550	3038	290	4.5	826.9	12.7	0.095	1.526	1.503	23.654	20288	28.1	6.677	740	166.7	187.6	10.8	3.681	671	48	my8036_rel.cz11b_bee
406	3176	177	6.6	710.9	10.2	0.056	2.140	1.749	25.660	21919	30.3	6.902	763	166.6	187.6	9.7	4.760	655	64	my8036_rel.cz11c_bee
3700	11877	19356	302.4	26445.6	674.4	1.630	26.075	7.148	186.658	123513	83.9	10.399	565	144.0	159.6	10.8	0.053	2989	2206	my8036_rel.cz11d_bee
qp1000.L6
qp1000.L6: point queries with 1000 insert/s per client. Graphs for performance per 1-second interval are here.
Average throughput:
Query response time histogram: each cell has the percentage of responses that take <= the time in the header and max is the max response time in seconds. For max values in the top 25% of the range have a red background and in the bottom 25% of the range have a green background. The red background is not used when the min value is within 80% of the max value.
| dbms | 256us | 1ms | 4ms | 16ms | 64ms | 256ms | 1s | 4s | 16s | gt | max |
|---|---|---|---|---|---|---|---|---|---|---|---|
| my5651_rel.cz11a_bee | 0.007 | 60.609 | 39.308 | 0.077 | nonzero | 0.076 | |||||
| my5744_rel.cz11a_bee | 0.001 | 70.119 | 29.772 | 0.108 | nonzero | 0.077 | |||||
| my8036_rel.cz11a_bee | nonzero | 75.266 | 24.541 | 0.192 | nonzero | 0.071 | |||||
| my8036_rel.cz11b_bee | nonzero | 5.572 | 3.245 | 33.197 | 56.530 | 1.454 | 0.911 | ||||
| my8036_rel.cz11c_bee | 7.955 | 6.595 | 27.845 | 50.809 | 6.797 | 0.938 | |||||
| my8036_rel.cz11d_bee | nonzero | 71.472 | 28.285 | 0.242 | nonzero | 0.076 |
Insert response time histogram: each cell has the percentage of responses that take <= the time in the header and max is the max response time in seconds. For max values in the top 25% of the range have a red background and in the bottom 25% of the range have a green background. The red background is not used when the min value is within 80% of the max value.
| dbms | 256us | 1ms | 4ms | 16ms | 64ms | 256ms | 1s | 4s | 16s | gt | max |
|---|---|---|---|---|---|---|---|---|---|---|---|
| my5651_rel.cz11a_bee | 16.567 | 76.758 | 6.676 | 0.225 | |||||||
| my5744_rel.cz11a_bee | 13.566 | 85.758 | 0.676 | 0.120 | |||||||
| my8036_rel.cz11a_bee | 11.242 | 85.933 | 2.825 | 0.208 | |||||||
| my8036_rel.cz11b_bee | 0.022 | 4.359 | 14.888 | 32.517 | 39.649 | 8.248 | 0.315 | 0.001 | 17.056 | ||
| my8036_rel.cz11c_bee | 0.194 | 21.438 | 4.740 | 21.160 | 33.935 | 18.194 | 0.339 | 8.995 | |||
| my8036_rel.cz11d_bee | 0.119 | 79.885 | 19.996 | 0.200 |
Delete response time histogram: each cell has the percentage of responses that take <= the time in the header and max is the max response time in seconds. For max values in the top 25% of the range have a red background and in the bottom 25% of the range have a green background. The red background is not used when the min value is within 80% of the max value.
| dbms | 256us | 1ms | 4ms | 16ms | 64ms | 256ms | 1s | 4s | 16s | gt | max |
|---|---|---|---|---|---|---|---|---|---|---|---|
| my5651_rel.cz11a_bee | 6.872 | 73.150 | 19.875 | 0.103 | 0.117 | ||||||
| my5744_rel.cz11a_bee | 78.545 | 20.840 | 0.611 | 0.003 | 0.079 | ||||||
| my8036_rel.cz11a_bee | 22.451 | 73.477 | 3.430 | 0.642 | 0.207 | ||||||
| my8036_rel.cz11b_bee | 0.026 | 3.867 | 16.613 | 35.267 | 36.744 | 7.208 | 0.274 | 0.001 | 19.029 | ||
| my8036_rel.cz11c_bee | 0.011 | 19.452 | 6.154 | 24.168 | 33.221 | 16.695 | 0.299 | 8.245 | |||
| my8036_rel.cz11d_bee | 2.951 | 91.323 | 5.726 | 0.175 |
Performance metrics for the DBMS listed above. Some are normalized by throughput, others are not. Legend for results is here.
ips	qps	rps	rmbps	wps	wmbps	rpq	rkbpq	wpi	wkbpi	csps	cpups	cspq	cpupq	dbgb1	dbgb2	rss	maxop	p50	p99	tag
3987	1020	19903	309.4	21095.5	356.3	19.523	310.791	5.291	91.528	90711	47.9	88.976	3759	158.6	175.9	10.5	0.076	256	224	my5651_rel.cz11a_bee
3989	1185	30008	468.9	21227.9	628.6	25.331	405.301	5.322	161.371	134029	48.8	113.143	3296	156.8	173.7	10.7	0.077	304	256	my5744_rel.cz11a_bee
3989	1175	28609	447.0	23282.0	600.8	24.342	389.468	5.837	154.228	110497	57.5	94.016	3914	153.7	170.2	10.8	0.071	288	256	my8036_rel.cz11a_bee
469	44	726	11.3	840.5	12.8	16.496	263.929	1.791	27.816	11216	6.7	254.901	12182	167.5	188.9	10.8	0.911	16	0	my8036_rel.cz11b_bee
352	39	542	13.5	713.5	9.9	13.960	355.976	2.029	28.911	11384	6.7	293.394	13814	167.5	188.9	9.5	0.938	16	0	my8036_rel.cz11c_bee
3987	1085	31958	499.3	28240.5	723.0	29.451	471.218	7.084	185.718	132319	54.4	121.942	4011	144.0	159.6	10.8	0.076	272	240	my8036_rel.cz11d_bee
l.i0
l.i0: load without secondary indexes
Performance metrics for all DBMS, not just the ones listed above. Some are normalized by throughput, others are not. Legend for results is here.
ips	qps	rps	rmbps	wps	wmbps	rpq	rkbpq	wpi	wkbpi	csps	cpups	cspq	cpupq	dbgb1	dbgb2	rss	maxop	p50	p99	tag
292077	0	2377	9.3	1448.5	105.2	0.008	0.033	0.005	0.369	36249	77.0	0.124	21	52.6	68.1	10.7	0.191	72621	60535	my5651_rel.cz11a_bee
286533	0	1	0.0	1432.1	103.2	0.000	0.000	0.005	0.369	32472	79.0	0.113	22	52.6	68.2	11.0	0.176	72269	63231	my5744_rel.cz11a_bee
198462	0	1	0.0	1199.5	75.0	0.000	0.000	0.006	0.387	23629	74.0	0.119	30	52.5	68.1	11.1	0.180	50144	43453	my8036_rel.cz11a_bee
181653	0	1	0.0	1302.9	66.0	0.000	0.000	0.007	0.372	21415	70.0	0.118	31	52.5	68.0	11.2	33.471	49464	0	my8036_rel.cz11b_bee
128970	0	0	0.0	798.2	46.9	0.000	0.000	0.006	0.372	16545	51.1	0.128	32	52.5	68.0	11.2	1.118	31957	2097	my8036_rel.cz11c_bee
199054	0	1	0.0	1203.8	75.2	0.000	0.000	0.006	0.387	23871	74.5	0.120	30	52.5	68.1	11.1	0.171	50245	43352	my8036_rel.cz11d_bee
l.x
l.x: create secondary indexes
Performance metrics for all DBMS, not just the ones listed above. Some are normalized by throughput, others are not. Legend for results is here.
ips	qps	rps	rmbps	wps	wmbps	rpq	rkbpq	wpi	wkbpi	csps	cpups	cspq	cpupq	dbgb1	dbgb2	rss	maxop	p50	p99	tag
212936	0	1361	188.9	1833.7	249.1	0.006	0.909	0.009	1.198	5241	38.4	0.025	14	111.5	127.0	10.9	0.003	NA	NA	my5651_rel.cz11a_bee
423504	0	2550	373.7	3513.0	449.7	0.006	0.904	0.008	1.087	12061	45.9	0.028	9	121.2	136.7	11.1	0.002	NA	NA	my5744_rel.cz11a_bee
312867	0	4946	458.9	6281.3	408.6	0.016	1.502	0.020	1.337	18931	90.2	0.061	23	120.7	136.3	11.2	0.008	NA	NA	my8036_rel.cz11a_bee
52934	0	836	77.5	1316.7	70.1	0.016	1.499	0.025	1.357	7135	24.5	0.135	37	120.7	136.3	11.2	0.009	NA	NA	my8036_rel.cz11b_bee
43900	0	552	64.4	1102.7	58.2	0.013	1.503	0.025	1.358	6673	18.8	0.152	34	120.7	136.3	10.6	0.024	NA	NA	my8036_rel.cz11c_bee
310198	0	4908	455.3	6272.0	405.4	0.016	1.503	0.020	1.338	18721	90.4	0.060	23	120.7	136.3	11.2	0.009	NA	NA	my8036_rel.cz11d_bee
l.i1
l.i1: continue load after secondary indexes created with 50 inserts per transaction
Performance metrics for all DBMS, not just the ones listed above. Some are normalized by throughput, others are not. Legend for results is here.
ips	qps	rps	rmbps	wps	wmbps	rpq	rkbpq	wpi	wkbpi	csps	cpups	cspq	cpupq	dbgb1	dbgb2	rss	maxop	p50	p99	tag
3540	0	12981	201.4	24846.1	538.6	3.667	58.259	7.019	155.806	90397	33.0	25.537	746	157.5	174.0	10.5	0.788	750	449	my5651_rel.cz11a_bee
4798	0	18354	286.8	23589.6	741.7	3.826	61.209	4.917	158.303	116454	47.5	24.273	792	156.3	172.6	10.7	0.323	1099	549	my5744_rel.cz11a_bee
4594	0	18874	294.9	28283.7	776.1	4.108	65.727	6.156	172.972	111639	53.0	24.299	923	153.7	170.0	10.8	0.345	1099	599	my8036_rel.cz11a_bee
55	0	282	4.4	768.5	11.1	5.159	82.537	14.074	209.049	11729	3.1	214.825	4542	151.3	167.3	10.7	10.888	0	0	my8036_rel.cz11b_bee
44	0	223	4.0	737.5	9.1	5.086	93.607	16.838	212.290	12707	3.6	290.125	6575	151.0	167.0	10.6	14.718	0	0	my8036_rel.cz11c_bee
3610	0	22080	345.0	31203.9	840.9	6.117	97.870	8.644	238.544	134369	48.8	37.224	1082	144.0	159.6	10.7	0.464	944	599	my8036_rel.cz11d_bee
l.i2
l.i2: continue load after secondary indexes created with 5 inserts per transaction
Performance metrics for all DBMS, not just the ones listed above. Some are normalized by throughput, others are not. Legend for results is here.
ips	qps	rps	rmbps	wps	wmbps	rpq	rkbpq	wpi	wkbpi	csps	cpups	cspq	cpupq	dbgb1	dbgb2	rss	maxop	p50	p99	tag
4665	0	10823	155.4	17262.7	402.4	2.320	34.122	3.701	88.329	86945	50.2	18.639	861	158.6	175.6	10.5	0.101	1164	904	my5651_rel.cz11a_bee
5405	0	13421	209.7	17865.7	552.3	2.483	39.727	3.305	104.619	102226	62.2	18.912	921	156.8	173.7	10.7	0.068	1359	1090	my5744_rel.cz11a_bee
4040	0	15058	235.3	22662.7	600.1	3.727	59.629	5.609	152.095	97580	63.3	24.151	1253	153.7	170.2	10.8	0.210	1009	614	my8036_rel.cz11a_bee
101	0	295	4.6	799.6	11.6	2.930	46.880	7.933	117.581	6204	5.7	61.549	4524	154.1	170.2	10.8	1.272	25	10	my8036_rel.cz11b_bee
81	0	232	4.6	762.8	9.5	2.875	58.099	9.463	120.761	7012	6.8	87.002	6749	153.8	169.9	8.3	1.809	20	5	my8036_rel.cz11c_bee
3532	0	19754	308.7	27187.5	710.6	5.593	89.487	7.697	206.013	121212	52.0	34.318	1178	144.0	159.6	10.7	0.119	904	655	my8036_rel.cz11d_bee
qr100.L1
qr100.L1: range queries with 100 insert/s per client
Performance metrics for all DBMS, not just the ones listed above. Some are normalized by throughput, others are not. Legend for results is here.
ips	qps	rps	rmbps	wps	wmbps	rpq	rkbpq	wpi	wkbpi	csps	cpups	cspq	cpupq	dbgb1	dbgb2	rss	maxop	p50	p99	tag
399	17082	7371	115.0	10759.6	226.4	0.432	6.893	26.980	581.360	102641	50.4	6.009	236	158.6	175.6	10.5	0.070	3788	784	my5651_rel.cz11a_bee
399	16593	5432	84.9	6230.7	181.2	0.327	5.237	15.624	465.350	89916	54.5	5.419	263	156.8	173.7	10.7	0.058	4491	1055	my5744_rel.cz11a_bee
399	16817	3403	53.2	4924.2	127.9	0.202	3.237	12.348	328.352	78626	56.3	4.676	268	153.7	170.2	10.8	0.034	4251	3181	my8036_rel.cz11a_bee
127	6626	330	5.1	852.5	12.2	0.050	0.795	6.702	98.153	31910	36.3	4.815	438	155.2	171.4	10.8	1.364	1759	48	my8036_rel.cz11b_bee
100	6249	245	4.9	780.0	9.7	0.039	0.811	7.839	99.931	30694	35.4	4.912	453	155.0	171.3	8.7	1.422	1550	32	my8036_rel.cz11c_bee
399	16917	2215	34.6	2881.9	75.2	0.131	2.095	7.226	192.991	74228	53.6	4.388	253	144.0	159.6	10.8	0.028	4237	3516	my8036_rel.cz11d_bee
qp100.L2
qp100.L2: point queries with 100 insert/s per client
Performance metrics for all DBMS, not just the ones listed above. Some are normalized by throughput, others are not. Legend for results is here.
ips	qps	rps	rmbps	wps	wmbps	rpq	rkbpq	wpi	wkbpi	csps	cpups	cspq	cpupq	dbgb1	dbgb2	rss	maxop	p50	p99	tag
399	2005	20097	313.8	3302.2	99.7	10.025	160.303	8.280	256.053	57763	24.9	28.812	994	158.6	175.6	10.5	0.045	496	447	my5651_rel.cz11a_bee
399	2332	22732	355.2	3743.2	99.1	9.750	156.000	9.386	254.374	66996	21.1	28.735	724	156.8	173.7	10.7	0.043	591	543	my5744_rel.cz11a_bee
399	2294	22307	348.5	3984.4	103.4	9.724	155.582	9.991	265.399	63119	23.1	27.515	806	153.7	170.2	10.8	0.053	575	543	my8036_rel.cz11a_bee
134	28	582	9.1	878.8	12.8	21.183	338.921	6.544	97.507	7016	5.8	255.144	16873	156.5	172.9	10.8	0.712	0	0	my8036_rel.cz11b_bee
100	21	432	8.1	794.3	9.8	20.647	398.772	7.919	100.450	7622	5.4	364.687	20670	156.3	172.7	8.6	0.888	0	0	my8036_rel.cz11c_bee
399	2314	22326	348.8	3722.4	95.8	9.650	154.400	9.334	245.909	62831	22.0	27.157	761	144.0	159.6	10.8	0.052	576	543	my8036_rel.cz11d_bee
qr500.L3
qr500.L3: range queries with 500 insert/s per client
Performance metrics for all DBMS, not just the ones listed above. Some are normalized by throughput, others are not. Legend for results is here.
ips	qps	rps	rmbps	wps	wmbps	rpq	rkbpq	wpi	wkbpi	csps	cpups	cspq	cpupq	dbgb1	dbgb2	rss	maxop	p50	p99	tag
1993	8194	14656	228.2	21897.5	400.2	1.789	28.518	10.986	205.614	106166	47.8	12.957	467	158.6	175.6	10.5	0.065	2111	799	my5651_rel.cz11a_bee
1994	13106	14212	222.1	13713.7	411.8	1.084	17.350	6.876	211.430	109978	59.8	8.392	365	156.8	173.7	10.7	0.071	3404	1439	my5744_rel.cz11a_bee
1994	15331	10925	170.7	14939.5	389.7	0.713	11.402	7.491	200.074	100169	71.7	6.534	374	153.7	170.2	10.8	0.045	3837	3324	my8036_rel.cz11a_bee
210	6498	309	4.8	848.4	12.4	0.048	0.761	4.032	60.479	30847	38.5	4.747	474	161.8	179.2	10.8	0.648	1694	368	my8036_rel.cz11b_bee
156	5945	224	5.0	763.7	9.8	0.038	0.857	4.908	64.456	29289	37.0	4.927	498	161.6	179.0	9.0	0.943	1390	256	my8036_rel.cz11c_bee
1993	14778	10805	168.8	14768.5	381.6	0.731	11.698	7.409	196.025	106188	67.1	7.185	363	144.0	159.6	10.8	0.042	3694	3117	my8036_rel.cz11d_bee
qp500.L4
qp500.L4: point queries with 500 insert/s per client
Performance metrics for all DBMS, not just the ones listed above. Some are normalized by throughput, others are not. Legend for results is here.
ips	qps	rps	rmbps	wps	wmbps	rpq	rkbpq	wpi	wkbpi	csps	cpups	cspq	cpupq	dbgb1	dbgb2	rss	maxop	p50	p99	tag
1994	1094	21458	334.5	22621.6	371.9	19.621	313.171	11.343	190.962	94887	40.9	86.765	2992	158.6	175.6	10.5	0.078	272	240	my5651_rel.cz11a_bee
1993	1640	26692	417.1	13755.0	387.6	16.271	260.343	6.901	199.130	105473	34.0	64.297	1658	156.8	173.7	10.7	0.052	416	336	my5744_rel.cz11a_bee
1994	1660	26881	420.0	15491.0	399.8	16.192	259.064	7.767	205.274	98233	38.7	59.169	1865	153.7	170.2	10.8	0.078	416	368	my8036_rel.cz11a_bee
390	37	651	10.2	861.0	13.0	17.594	281.501	2.207	34.239	12725	5.9	343.912	12757	164.7	183.8	10.8	0.845	16	0	my8036_rel.cz11b_bee
257	30	487	10.2	740.4	9.9	15.961	343.664	2.885	39.642	12131	5.9	397.723	15475	164.5	183.4	9.0	0.809	0	0	my8036_rel.cz11c_bee
1994	1669	27032	422.4	15461.4	397.8	16.200	259.193	7.752	204.226	98827	36.3	59.224	1740	144.0	159.6	10.8	0.073	416	384	my8036_rel.cz11d_bee
qr1000.L5
qr1000.L5: range queries with 1000 insert/s per client
Performance metrics for all DBMS, not just the ones listed above. Some are normalized by throughput, others are not. Legend for results is here.
ips	qps	rps	rmbps	wps	wmbps	rpq	rkbpq	wpi	wkbpi	csps	cpups	cspq	cpupq	dbgb1	dbgb2	rss	maxop	p50	p99	tag
3989	4592	16477	255.9	25404.6	446.4	3.588	57.067	6.369	114.590	103731	48.4	22.589	843	158.6	175.6	10.5	0.075	1167	559	my5651_rel.cz11a_bee
3989	5018	24910	389.2	22179.7	669.5	4.964	79.417	5.560	171.879	135373	57.5	26.975	917	156.8	173.7	10.7	0.068	1263	991	my5744_rel.cz11a_bee
3989	11338	15280	238.8	21845.1	565.3	1.348	21.562	5.476	145.126	99647	83.4	8.788	588	153.7	170.2	10.8	0.101	2845	2206	my8036_rel.cz11a_bee
550	3038	290	4.5	826.9	12.7	0.095	1.526	1.503	23.654	20288	28.1	6.677	740	166.7	187.6	10.8	3.681	671	48	my8036_rel.cz11b_bee
406	3176	177	6.6	710.9	10.2	0.056	2.140	1.749	25.660	21919	30.3	6.902	763	166.6	187.6	9.7	4.760	655	64	my8036_rel.cz11c_bee
3700	11877	19356	302.4	26445.6	674.4	1.630	26.075	7.148	186.658	123513	83.9	10.399	565	144.0	159.6	10.8	0.053	2989	2206	my8036_rel.cz11d_bee
qp1000.L6
qp1000.L6: point queries with 1000 insert/s per client
Performance metrics for all DBMS, not just the ones listed above. Some are normalized by throughput, others are not. Legend for results is here.
ips	qps	rps	rmbps	wps	wmbps	rpq	rkbpq	wpi	wkbpi	csps	cpups	cspq	cpupq	dbgb1	dbgb2	rss	maxop	p50	p99	tag
3987	1020	19903	309.4	21095.5	356.3	19.523	310.791	5.291	91.528	90711	47.9	88.976	3759	158.6	175.9	10.5	0.076	256	224	my5651_rel.cz11a_bee
3989	1185	30008	468.9	21227.9	628.6	25.331	405.301	5.322	161.371	134029	48.8	113.143	3296	156.8	173.7	10.7	0.077	304	256	my5744_rel.cz11a_bee
3989	1175	28609	447.0	23282.0	600.8	24.342	389.468	5.837	154.228	110497	57.5	94.016	3914	153.7	170.2	10.8	0.071	288	256	my8036_rel.cz11a_bee
469	44	726	11.3	840.5	12.8	16.496	263.929	1.791	27.816	11216	6.7	254.901	12182	167.5	188.9	10.8	0.911	16	0	my8036_rel.cz11b_bee
352	39	542	13.5	713.5	9.9	13.960	355.976	2.029	28.911	11384	6.7	293.394	13814	167.5	188.9	9.5	0.938	16	0	my8036_rel.cz11c_bee
3987	1085	31958	499.3	28240.5	723.0	29.451	471.218	7.084	185.718	132319	54.4	121.942	4011	144.0	159.6	10.8	0.076	272	240	my8036_rel.cz11d_bee
l.i0
- l.i0: load without secondary indexes
- Legend for results is here.
- Each entry lists the percentage of responses that fit in that bucket (slower than max time for previous bucket, faster than min time for next bucket).
Insert response time histogram
256us	1ms	4ms	16ms	64ms	256ms	1s	4s	16s	gt	max	tag
0.000	0.744	98.688	0.392	0.169	0.007	0.000	0.000	0.000	0.000	0.191	my5651_rel.cz11a_bee
0.000	0.013	99.433	0.462	0.085	0.007	0.000	0.000	0.000	0.000	0.176	my5744_rel.cz11a_bee
0.000	0.000	99.213	0.663	0.113	0.011	0.000	0.000	0.000	0.000	0.180	my8036_rel.cz11a_bee
0.000	0.000	99.164	0.704	0.086	0.033	0.005	0.007	0.000	nonzero	33.471	my8036_rel.cz11b_bee
0.000	0.000	99.186	0.471	0.113	0.059	0.150	0.022	0.000	0.000	1.118	my8036_rel.cz11c_bee
0.000	0.000	99.211	0.690	0.089	0.010	0.000	0.000	0.000	0.000	0.171	my8036_rel.cz11d_bee
l.x
- l.x: create secondary indexes
- Legend for results is here.
- Each entry lists the percentage of responses that fit in that bucket (slower than max time for previous bucket, faster than min time for next bucket).
TODO - determine whether there is data for create index response time
l.i1
- l.i1: continue load after secondary indexes created with 50 inserts per transaction
- Legend for results is here.
- Each entry lists the percentage of responses that fit in that bucket (slower than max time for previous bucket, faster than min time for next bucket).
Insert response time histogram
256us	1ms	4ms	16ms	64ms	256ms	1s	4s	16s	gt	max	tag
0.000	0.000	0.000	1.720	64.656	33.596	0.027	0.000	0.000	0.000	0.788	my5651_rel.cz11a_bee
0.000	0.000	0.000	11.283	71.025	17.691	0.001	0.000	0.000	0.000	0.323	my5744_rel.cz11a_bee
0.000	0.000	0.000	7.341	74.794	17.855	0.010	0.000	0.000	0.000	0.345	my8036_rel.cz11a_bee
0.000	0.000	0.000	0.000	0.636	0.127	0.268	63.499	35.470	0.000	10.888	my8036_rel.cz11b_bee
0.000	0.000	0.000	0.000	0.023	0.616	0.084	47.270	52.007	0.000	14.718	my8036_rel.cz11c_bee
0.000	0.000	0.000	0.010	65.422	34.562	0.005	0.000	0.000	0.000	0.464	my8036_rel.cz11d_bee
Delete response time histogram
256us	1ms	4ms	16ms	64ms	256ms	1s	4s	16s	gt	max	tag
0.000	0.000	12.957	65.575	21.360	0.106	0.002	0.000	0.000	0.000	0.344	my5651_rel.cz11a_bee
0.000	0.000	67.806	30.735	1.448	0.010	0.000	0.000	0.000	0.000	0.103	my5744_rel.cz11a_bee
0.000	0.000	53.660	42.938	2.958	0.444	0.000	0.000	0.000	0.000	0.164	my8036_rel.cz11a_bee
0.000	0.000	20.566	1.733	16.733	36.210	24.486	0.273	0.000	0.000	2.319	my8036_rel.cz11b_bee
0.000	0.000	5.324	14.836	7.703	36.480	35.349	0.307	0.000	0.000	3.298	my8036_rel.cz11c_bee
0.000	0.000	0.000	24.547	67.059	8.393	0.001	0.000	0.000	0.000	0.330	my8036_rel.cz11d_bee
l.i2
- l.i2: continue load after secondary indexes created with 5 inserts per transaction
- Legend for results is here.
- Each entry lists the percentage of responses that fit in that bucket (slower than max time for previous bucket, faster than min time for next bucket).
Insert response time histogram
256us	1ms	4ms	16ms	64ms	256ms	1s	4s	16s	gt	max	tag
0.000	11.064	53.145	34.187	1.599	0.005	0.000	0.000	0.000	0.000	0.101	my5651_rel.cz11a_bee
0.000	9.545	65.633	23.439	1.382	0.001	0.000	0.000	0.000	0.000	0.068	my5744_rel.cz11a_bee
0.000	1.999	65.667	29.521	2.192	0.622	0.000	0.000	0.000	0.000	0.210	my8036_rel.cz11a_bee
0.000	2.649	3.429	1.112	11.481	52.513	28.803	0.011	0.000	0.000	1.272	my8036_rel.cz11b_bee
0.000	1.433	5.199	1.511	8.823	44.102	38.473	0.459	0.000	0.000	1.809	my8036_rel.cz11c_bee
0.000	0.000	61.135	35.541	2.882	0.443	0.000	0.000	0.000	0.000	0.119	my8036_rel.cz11d_bee
Delete response time histogram
256us	1ms	4ms	16ms	64ms	256ms	1s	4s	16s	gt	max	tag
0.000	20.069	60.684	18.446	0.800	0.002	0.000	0.000	0.000	0.000	0.084	my5651_rel.cz11a_bee
0.000	38.707	54.173	6.921	0.198	0.001	0.000	0.000	0.000	0.000	0.064	my5744_rel.cz11a_bee
0.000	18.626	74.337	6.059	0.529	0.449	0.000	0.000	0.000	0.000	0.207	my8036_rel.cz11a_bee
0.000	23.380	36.482	4.364	21.924	13.675	0.153	0.022	0.000	0.000	1.915	my8036_rel.cz11b_bee
0.000	13.402	40.672	5.800	21.106	18.476	0.525	0.018	0.000	0.000	2.743	my8036_rel.cz11c_bee
0.000	0.001	71.793	26.085	1.764	0.357	0.000	0.000	0.000	0.000	0.145	my8036_rel.cz11d_bee
qr100.L1
- qr100.L1: range queries with 100 insert/s per client
- Legend for results is here.
- Each entry lists the percentage of responses that fit in that bucket (slower than max time for previous bucket, faster than min time for next bucket).
Query response time histogram
256us	1ms	4ms	16ms	64ms	256ms	1s	4s	16s	gt	max	tag
89.659	8.564	1.554	0.222	0.002	nonzero	0.000	0.000	0.000	0.000	0.070	my5651_rel.cz11a_bee
83.500	15.710	0.646	0.143	0.002	0.000	0.000	0.000	0.000	0.000	0.058	my5744_rel.cz11a_bee
76.133	23.738	0.125	0.004	nonzero	0.000	0.000	0.000	0.000	0.000	0.034	my8036_rel.cz11a_bee
38.357	57.869	3.103	0.226	0.382	0.057	0.007	nonzero	0.000	0.000	1.364	my8036_rel.cz11b_bee
40.723	55.571	3.059	0.200	0.344	0.095	0.008	nonzero	0.000	0.000	1.422	my8036_rel.cz11c_bee
75.114	24.838	0.043	0.005	nonzero	0.000	0.000	0.000	0.000	0.000	0.028	my8036_rel.cz11d_bee
Insert response time histogram
256us	1ms	4ms	16ms	64ms	256ms	1s	4s	16s	gt	max	tag
0.000	0.000	0.000	0.160	88.181	11.660	0.000	0.000	0.000	0.000	0.149	my5651_rel.cz11a_bee
0.000	0.000	0.000	9.507	83.271	7.222	0.000	0.000	0.000	0.000	0.177	my5744_rel.cz11a_bee
0.000	0.000	0.000	0.438	96.458	3.104	0.000	0.000	0.000	0.000	0.185	my8036_rel.cz11a_bee
0.000	0.000	0.000	0.000	0.000	0.000	12.403	87.583	0.014	0.000	4.280	my8036_rel.cz11b_bee
0.000	0.000	0.000	0.000	0.000	0.021	6.729	91.361	1.889	0.000	5.680	my8036_rel.cz11c_bee
0.000	0.000	0.000	0.104	99.090	0.806	0.000	0.000	0.000	0.000	0.153	my8036_rel.cz11d_bee
Delete response time histogram
256us	1ms	4ms	16ms	64ms	256ms	1s	4s	16s	gt	max	tag
0.000	0.000	40.951	49.188	9.840	0.021	0.000	0.000	0.000	0.000	0.077	my5651_rel.cz11a_bee
0.000	0.000	88.931	10.312	0.750	0.007	0.000	0.000	0.000	0.000	0.071	my5744_rel.cz11a_bee
0.000	0.000	90.014	9.229	0.556	0.201	0.000	0.000	0.000	0.000	0.110	my8036_rel.cz11a_bee
0.000	0.000	12.028	1.292	13.896	46.299	26.472	0.014	0.000	0.000	1.089	my8036_rel.cz11b_bee
0.000	0.000	2.819	7.778	5.590	41.417	42.354	0.042	0.000	0.000	1.208	my8036_rel.cz11c_bee
0.000	0.000	0.000	46.799	52.743	0.458	0.000	0.000	0.000	0.000	0.130	my8036_rel.cz11d_bee
qp100.L2
- qp100.L2: point queries with 100 insert/s per client
- Legend for results is here.
- Each entry lists the percentage of responses that fit in that bucket (slower than max time for previous bucket, faster than min time for next bucket).
Query response time histogram
256us	1ms	4ms	16ms	64ms	256ms	1s	4s	16s	gt	max	tag
0.000	0.259	97.159	2.574	0.007	0.000	0.000	0.000	0.000	0.000	0.045	my5651_rel.cz11a_bee
0.000	0.416	97.669	1.909	0.006	0.000	0.000	0.000	0.000	0.000	0.043	my5744_rel.cz11a_bee
0.000	0.187	98.150	1.652	0.011	0.000	0.000	0.000	0.000	0.000	0.053	my8036_rel.cz11a_bee
0.000	0.000	0.886	0.788	12.912	76.021	9.393	0.000	0.000	0.000	0.712	my8036_rel.cz11b_bee
0.000	0.000	1.301	1.060	7.739	65.883	24.017	0.000	0.000	0.000	0.888	my8036_rel.cz11c_bee
0.000	0.190	98.366	1.431	0.014	0.000	0.000	0.000	0.000	0.000	0.052	my8036_rel.cz11d_bee
Insert response time histogram
256us	1ms	4ms	16ms	64ms	256ms	1s	4s	16s	gt	max	tag
0.000	0.000	0.000	2.000	97.799	0.201	0.000	0.000	0.000	0.000	0.087	my5651_rel.cz11a_bee
0.000	0.000	0.000	24.722	75.215	0.062	0.000	0.000	0.000	0.000	0.076	my5744_rel.cz11a_bee
0.000	0.000	0.000	6.438	93.458	0.104	0.000	0.000	0.000	0.000	0.122	my8036_rel.cz11a_bee
0.000	0.000	0.000	0.000	0.007	0.049	15.931	83.965	0.049	0.000	4.346	my8036_rel.cz11b_bee
0.000	0.000	0.000	0.000	0.000	0.035	3.931	94.660	1.375	0.000	6.710	my8036_rel.cz11c_bee
0.000	0.000	0.000	0.069	99.812	0.118	0.000	0.000	0.000	0.000	0.139	my8036_rel.cz11d_bee
Delete response time histogram
256us	1ms	4ms	16ms	64ms	256ms	1s	4s	16s	gt	max	tag
0.000	0.000	64.389	32.778	2.833	0.000	0.000	0.000	0.000	0.000	0.037	my5651_rel.cz11a_bee
0.000	0.000	89.889	10.076	0.035	0.000	0.000	0.000	0.000	0.000	0.026	my5744_rel.cz11a_bee
0.000	0.000	85.812	14.069	0.090	0.028	0.000	0.000	0.000	0.000	0.111	my8036_rel.cz11a_bee
0.000	0.000	5.910	9.361	12.556	27.417	43.493	1.264	0.000	0.000	1.956	my8036_rel.cz11b_bee
0.000	0.000	0.188	9.118	3.639	19.736	64.347	2.972	0.000	0.000	2.433	my8036_rel.cz11c_bee
0.000	0.000	0.000	22.611	77.347	0.042	0.000	0.000	0.000	0.000	0.121	my8036_rel.cz11d_bee
qr500.L3
- qr500.L3: range queries with 500 insert/s per client
- Legend for results is here.
- Each entry lists the percentage of responses that fit in that bucket (slower than max time for previous bucket, faster than min time for next bucket).
Query response time histogram
256us	1ms	4ms	16ms	64ms	256ms	1s	4s	16s	gt	max	tag
73.482	17.127	7.476	1.899	0.016	nonzero	0.000	0.000	0.000	0.000	0.065	my5651_rel.cz11a_bee
80.898	16.208	2.394	0.493	0.007	nonzero	0.000	0.000	0.000	0.000	0.071	my5744_rel.cz11a_bee
69.920	29.769	0.292	0.018	nonzero	0.000	0.000	0.000	0.000	0.000	0.045	my8036_rel.cz11a_bee
37.780	58.253	3.320	0.259	0.328	0.057	0.005	0.000	0.000	0.000	0.648	my8036_rel.cz11b_bee
39.160	56.899	3.244	0.246	0.355	0.090	0.007	0.000	0.000	0.000	0.943	my8036_rel.cz11c_bee
66.799	32.620	0.534	0.046	0.001	0.000	0.000	0.000	0.000	0.000	0.042	my8036_rel.cz11d_bee
Insert response time histogram
256us	1ms	4ms	16ms	64ms	256ms	1s	4s	16s	gt	max	tag
0.000	0.000	0.000	2.151	82.903	14.946	0.000	0.000	0.000	0.000	0.197	my5651_rel.cz11a_bee
0.000	0.000	0.000	16.782	81.703	1.515	0.000	0.000	0.000	0.000	0.127	my5744_rel.cz11a_bee
0.000	0.000	0.000	6.663	89.565	3.772	0.000	0.000	0.000	0.000	0.233	my8036_rel.cz11a_bee
0.000	0.000	0.001	0.004	0.032	1.746	58.232	39.985	0.000	0.000	3.263	my8036_rel.cz11b_bee
0.000	0.000	0.000	0.008	0.017	0.682	38.417	60.804	0.072	0.000	5.487	my8036_rel.cz11c_bee
0.000	0.000	0.000	3.667	90.169	6.164	0.000	0.000	0.000	0.000	0.198	my8036_rel.cz11d_bee
Delete response time histogram
256us	1ms	4ms	16ms	64ms	256ms	1s	4s	16s	gt	max	tag
0.000	0.000	33.011	54.674	12.253	0.062	0.000	0.000	0.000	0.000	0.098	my5651_rel.cz11a_bee
0.000	0.000	86.469	12.912	0.618	0.000	0.000	0.000	0.000	0.000	0.051	my5744_rel.cz11a_bee
0.000	0.000	68.396	29.039	1.638	0.928	0.000	0.000	0.000	0.000	0.134	my8036_rel.cz11a_bee
0.000	0.000	13.732	3.343	15.228	46.565	21.126	0.006	0.000	0.000	1.334	my8036_rel.cz11b_bee
0.000	0.000	3.931	7.636	5.317	42.418	40.617	0.082	0.000	0.000	1.678	my8036_rel.cz11c_bee
0.000	0.000	0.000	29.750	67.536	2.714	0.000	0.000	0.000	0.000	0.178	my8036_rel.cz11d_bee
qp500.L4
- qp500.L4: point queries with 500 insert/s per client
- Legend for results is here.
- Each entry lists the percentage of responses that fit in that bucket (slower than max time for previous bucket, faster than min time for next bucket).
Query response time histogram
256us	1ms	4ms	16ms	64ms	256ms	1s	4s	16s	gt	max	tag
0.000	0.002	61.484	38.450	0.065	nonzero	0.000	0.000	0.000	0.000	0.078	my5651_rel.cz11a_bee
0.000	0.017	87.419	12.522	0.042	0.000	0.000	0.000	0.000	0.000	0.052	my5744_rel.cz11a_bee
0.000	0.006	90.075	9.829	0.090	nonzero	0.000	0.000	0.000	0.000	0.078	my8036_rel.cz11a_bee
0.000	0.000	2.985	2.219	27.114	64.648	3.034	0.000	0.000	0.000	0.845	my8036_rel.cz11b_bee
0.000	0.000	4.463	3.682	20.448	60.499	10.907	0.000	0.000	0.000	0.809	my8036_rel.cz11c_bee
0.000	0.006	90.934	8.875	0.186	nonzero	0.000	0.000	0.000	0.000	0.073	my8036_rel.cz11d_bee
Insert response time histogram
256us	1ms	4ms	16ms	64ms	256ms	1s	4s	16s	gt	max	tag
0.000	0.000	0.000	2.292	67.579	30.129	0.000	0.000	0.000	0.000	0.231	my5651_rel.cz11a_bee
0.000	0.000	0.000	27.396	71.964	0.640	0.000	0.000	0.000	0.000	0.121	my5744_rel.cz11a_bee
0.000	0.000	0.000	7.639	90.569	1.792	0.000	0.000	0.000	0.000	0.171	my8036_rel.cz11a_bee
0.000	0.000	0.018	2.457	3.772	23.106	61.479	9.167	0.001	0.000	4.040	my8036_rel.cz11b_bee
0.000	0.000	0.019	2.865	1.172	11.561	56.200	28.171	0.011	0.000	5.113	my8036_rel.cz11c_bee
0.000	0.000	0.000	0.340	90.818	8.842	0.000	0.000	0.000	0.000	0.180	my8036_rel.cz11d_bee
Delete response time histogram
256us	1ms	4ms	16ms	64ms	256ms	1s	4s	16s	gt	max	tag
0.000	0.000	37.896	50.774	11.306	0.025	0.000	0.000	0.000	0.000	0.105	my5651_rel.cz11a_bee
0.000	0.000	90.604	9.175	0.221	0.000	0.000	0.000	0.000	0.000	0.045	my5744_rel.cz11a_bee
0.000	0.000	73.218	25.918	0.379	0.485	0.000	0.000	0.000	0.000	0.115	my8036_rel.cz11a_bee
0.000	0.000	0.342	23.468	16.137	34.400	24.049	1.603	0.001	0.000	4.046	my8036_rel.cz11b_bee
0.000	0.000	0.082	18.029	5.083	26.742	45.310	4.754	0.000	0.000	3.184	my8036_rel.cz11c_bee
0.000	0.000	0.000	5.844	91.010	3.146	0.000	0.000	0.000	0.000	0.174	my8036_rel.cz11d_bee
qr1000.L5
- qr1000.L5: range queries with 1000 insert/s per client
- Legend for results is here.
- Each entry lists the percentage of responses that fit in that bucket (slower than max time for previous bucket, faster than min time for next bucket).
Query response time histogram
256us	1ms	4ms	16ms	64ms	256ms	1s	4s	16s	gt	max	tag
53.651	26.866	13.721	5.716	0.046	nonzero	0.000	0.000	0.000	0.000	0.075	my5651_rel.cz11a_bee
45.733	37.056	12.498	4.673	0.039	nonzero	0.000	0.000	0.000	0.000	0.068	my5744_rel.cz11a_bee
48.035	49.091	2.713	0.156	0.005	nonzero	0.000	0.000	0.000	0.000	0.101	my8036_rel.cz11a_bee
28.284	55.960	14.317	0.627	0.489	0.281	0.043	nonzero	0.000	0.000	3.681	my8036_rel.cz11b_bee
31.418	54.014	13.200	0.575	0.503	0.248	0.042	nonzero	nonzero	0.000	4.760	my8036_rel.cz11c_bee
46.308	52.085	1.572	0.030	0.005	0.000	0.000	0.000	0.000	0.000	0.053	my8036_rel.cz11d_bee
Insert response time histogram
256us	1ms	4ms	16ms	64ms	256ms	1s	4s	16s	gt	max	tag
0.000	0.000	0.000	3.374	90.203	6.423	0.000	0.000	0.000	0.000	0.192	my5651_rel.cz11a_bee
0.000	0.000	0.000	8.190	90.835	0.976	0.000	0.000	0.000	0.000	0.139	my5744_rel.cz11a_bee
0.000	0.000	0.000	4.340	88.696	6.965	0.000	0.000	0.000	0.000	0.242	my8036_rel.cz11a_bee
0.000	0.000	0.472	6.148	7.848	33.906	46.297	5.322	0.009	0.000	5.600	my8036_rel.cz11b_bee
0.000	0.000	0.215	6.040	2.346	21.593	61.214	8.578	0.013	0.000	5.201	my8036_rel.cz11c_bee
0.000	0.000	0.000	0.012	72.845	27.143	0.000	0.000	0.000	0.000	0.214	my8036_rel.cz11d_bee
Delete response time histogram
256us	1ms	4ms	16ms	64ms	256ms	1s	4s	16s	gt	max	tag
0.000	0.000	33.590	56.477	9.883	0.049	0.000	0.000	0.000	0.000	0.151	my5651_rel.cz11a_bee
0.000	0.000	82.301	17.024	0.672	0.003	0.000	0.000	0.000	0.000	0.078	my5744_rel.cz11a_bee
0.000	0.000	39.001	50.431	9.679	0.889	0.000	0.000	0.000	0.000	0.144	my8036_rel.cz11a_bee
0.000	0.000	3.174	14.128	13.775	35.203	30.246	3.469	0.005	0.000	6.922	my8036_rel.cz11b_bee
0.000	0.000	2.415	12.197	4.658	29.698	46.691	4.338	0.004	0.000	4.839	my8036_rel.cz11c_bee
0.000	0.000	0.000	5.112	88.717	6.171	0.000	0.000	0.000	0.000	0.199	my8036_rel.cz11d_bee
qp1000.L6
- qp1000.L6: point queries with 1000 insert/s per client
- Legend for results is here.
- Each entry lists the percentage of responses that fit in that bucket (slower than max time for previous bucket, faster than min time for next bucket).
Query response time histogram
256us	1ms	4ms	16ms	64ms	256ms	1s	4s	16s	gt	max	tag
0.000	0.007	60.609	39.308	0.077	nonzero	0.000	0.000	0.000	0.000	0.076	my5651_rel.cz11a_bee
0.000	0.001	70.119	29.772	0.108	nonzero	0.000	0.000	0.000	0.000	0.077	my5744_rel.cz11a_bee
0.000	nonzero	75.266	24.541	0.192	nonzero	0.000	0.000	0.000	0.000	0.071	my8036_rel.cz11a_bee
0.000	nonzero	5.572	3.245	33.197	56.530	1.454	0.000	0.000	0.000	0.911	my8036_rel.cz11b_bee
0.000	0.000	7.955	6.595	27.845	50.809	6.797	0.000	0.000	0.000	0.938	my8036_rel.cz11c_bee
0.000	nonzero	71.472	28.285	0.242	nonzero	0.000	0.000	0.000	0.000	0.076	my8036_rel.cz11d_bee
Insert response time histogram
256us	1ms	4ms	16ms	64ms	256ms	1s	4s	16s	gt	max	tag
0.000	0.000	0.000	16.567	76.758	6.676	0.000	0.000	0.000	0.000	0.225	my5651_rel.cz11a_bee
0.000	0.000	0.000	13.566	85.758	0.676	0.000	0.000	0.000	0.000	0.120	my5744_rel.cz11a_bee
0.000	0.000	0.000	11.242	85.933	2.825	0.000	0.000	0.000	0.000	0.208	my8036_rel.cz11a_bee
0.000	0.000	0.022	4.359	14.888	32.517	39.649	8.248	0.315	0.001	17.056	my8036_rel.cz11b_bee
0.000	0.000	0.194	21.438	4.740	21.160	33.935	18.194	0.339	0.000	8.995	my8036_rel.cz11c_bee
0.000	0.000	0.000	0.119	79.885	19.996	0.000	0.000	0.000	0.000	0.200	my8036_rel.cz11d_bee
Delete response time histogram
256us	1ms	4ms	16ms	64ms	256ms	1s	4s	16s	gt	max	tag
0.000	0.000	6.872	73.150	19.875	0.103	0.000	0.000	0.000	0.000	0.117	my5651_rel.cz11a_bee
0.000	0.000	78.545	20.840	0.611	0.003	0.000	0.000	0.000	0.000	0.079	my5744_rel.cz11a_bee
0.000	0.000	22.451	73.477	3.430	0.642	0.000	0.000	0.000	0.000	0.207	my8036_rel.cz11a_bee
0.000	0.000	0.026	3.867	16.613	35.267	36.744	7.208	0.274	0.001	19.029	my8036_rel.cz11b_bee
0.000	0.000	0.011	19.452	6.154	24.168	33.221	16.695	0.299	0.000	8.245	my8036_rel.cz11c_bee
0.000	0.000	0.000	2.951	91.323	5.726	0.000	0.000	0.000	0.000	0.175	my8036_rel.cz11d_bee