Introduction
This is a report for the insert benchmark with 800M docs and 4 client(s). It is generated by scripts (bash, awk, sed) and Tufte might not be impressed. An overview of the insert benchmark is here and a short update is here. Below, by DBMS, I mean DBMS+version.config. An example is my8020.c10b40 where my means MySQL, 8020 is version 8.0.20 and c10b40 is the name for the configuration file.
The test server has 8 AMD cores, 16G RAM and an NVMe SSD. It is described here as the Beelink. The benchmark was run with 4 clients and there were 1 or 3 connections per client (1 for queries or inserts without rate limits, 1+1 for rate limited inserts+deletes). It uses 4 tables with a table per client. It loads 800M rows per table without secondary indexes, creates 3 secondary indexes per table, then inserts 2m rows per table with a delete per insert to avoid growing the table. It then does 6 read+write tests for 1800s each that do queries as fast as possible with 100,100,500,500,1000,1000 inserts/s and the same for deletes/s per client concurrent with the queries. The database is larger than memory. Clients and the DBMS share one server. The per-database configs are in the per-database subdirectories here.
The tested DBMS are:
- ma110401_rel.cz11b_bee - MariaDB 11.4.1 with the cz11b_bee config that uses innodb_flush_method=O_DIRECT
- ma110401_rel.cz11bpur1_bee - MariaDB 11.4.1 with the cz11bpur1_bee config that uses innodb_flush_method=O_DIRECT, innodb_purge_threads=1
- ma110401_rel.cz11c_bee - MariaDB 11.4.1 with the cz11c_bee config that uses innodb_flush_method=fsync
Contents
- Summary
- l.i0: load without secondary indexes
- l.x: create secondary indexes
- l.i1: continue load after secondary indexes created with 50 inserts per transaction
- l.i2: continue load after secondary indexes created with 5 inserts per transaction
- qr100.L1: range queries with 100 insert/s per client
- qp100.L2: point queries with 100 insert/s per client
- qr500.L3: range queries with 500 insert/s per client
- qp500.L4: point queries with 500 insert/s per client
- qr1000.L5: range queries with 1000 insert/s per client
- qp1000.L6: point queries with 1000 insert/s per client
Summary
The numbers are inserts/s for l.i0, l.i1 and l.i2, indexed docs (or rows) /s for l.x and queries/s for qr100, qp100 thru qr1000, qp1000" The values are the average rate over the entire test for inserts (IPS) and queries (QPS). The range of values for IPS and QPS is split into 3 parts: bottom 25%, middle 50%, top 25%. Values in the bottom 25% have a red background, values in the top 25% have a green background and values in the middle have no color. A gray background is used for values that can be ignored because the DBMS did not sustain the target insert rate. Red backgrounds are not used when the minimum value is within 80% of the max value.
| dbms | l.i0 | l.x | l.i1 | l.i2 | qr100 | qp100 | qr500 | qp500 | qr1000 | qp1000 |
|---|---|---|---|---|---|---|---|---|---|---|
| ma110401_rel.cz11b_bee | 247295 | 303145 | 1425 | 2162 | 14996 | 2082 | 7724 | 1202 | 3504 | 653 |
| ma110401_rel.cz11bpur1_bee | 257566 | 315582 | 1541 | 648 | 12371 | 1596 | 1744 | 400 | 4070 | 1431 |
| ma110401_rel.cz11c_bee | 235571 | 323887 | 652 | 1043 | 15272 | 1318 | 1480 | 310 | 1386 | 261 |
This table has relative throughput, throughput for the DBMS relative to the DBMS in the first line, using the absolute throughput from the previous table. Values less than 0.95 have a yellow background. Values greater than 1.05 have a blue background.
| dbms | l.i0 | l.x | l.i1 | l.i2 | qr100 | qp100 | qr500 | qp500 | qr1000 | qp1000 |
|---|---|---|---|---|---|---|---|---|---|---|
| ma110401_rel.cz11b_bee | 1.00 | 1.00 | 1.00 | 1.00 | 1.00 | 1.00 | 1.00 | 1.00 | 1.00 | 1.00 |
| ma110401_rel.cz11bpur1_bee | 1.04 | 1.04 | 1.08 | 0.30 | 0.82 | 0.77 | 0.23 | 0.33 | 1.16 | 2.19 |
| ma110401_rel.cz11c_bee | 0.95 | 1.07 | 0.46 | 0.48 | 1.02 | 0.63 | 0.19 | 0.26 | 0.40 | 0.40 |
This lists the average rate of inserts/s for the tests that do inserts concurrent with queries. For such tests the query rate is listed in the table above. The read+write tests are setup so that the insert rate should match the target rate every second. Cells that are not at least 95% of the target have a red background to indicate a failure to satisfy the target.
| dbms | qr100.L1 | qp100.L2 | qr500.L3 | qp500.L4 | qr1000.L5 | qp1000.L6 |
|---|---|---|---|---|---|---|
| ma110401_rel.cz11b_bee | 399 | 399 | 1994 | 1994 | 2399 | 2503 |
| ma110401_rel.cz11bpur1_bee | 389 | 399 | 1737 | 1837 | 1372 | 851 |
| ma110401_rel.cz11c_bee | 398 | 399 | 1042 | 1081 | 1072 | 1012 |
| target | 400 | 400 | 2000 | 2000 | 4000 | 4000 |
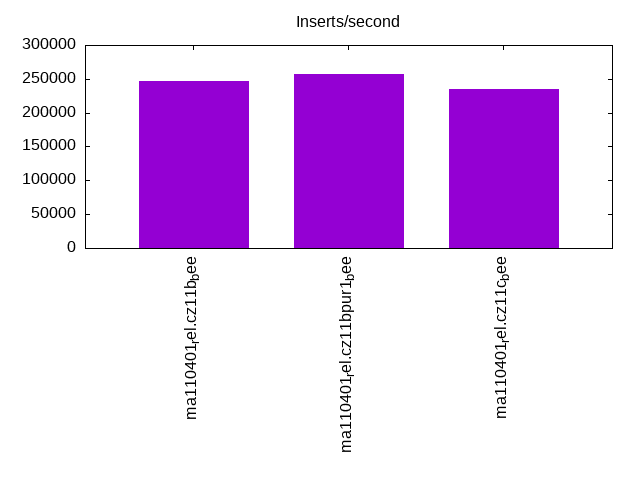
l.i0
l.i0: load without secondary indexes. Graphs for performance per 1-second interval are here.
Average throughput:
Insert response time histogram: each cell has the percentage of responses that take <= the time in the header and max is the max response time in seconds. For the max column values in the top 25% of the range have a red background and in the bottom 25% of the range have a green background. The red background is not used when the min value is within 80% of the max value.
| dbms | 256us | 1ms | 4ms | 16ms | 64ms | 256ms | 1s | 4s | 16s | gt | max |
|---|---|---|---|---|---|---|---|---|---|---|---|
| ma110401_rel.cz11b_bee | 0.051 | 97.411 | 2.445 | 0.070 | 0.023 | nonzero | nonzero | 16.336 | |||
| ma110401_rel.cz11bpur1_bee | 0.075 | 98.944 | 0.915 | 0.045 | 0.021 | nonzero | nonzero | nonzero | 9.994 | ||
| ma110401_rel.cz11c_bee | 0.015 | 97.559 | 2.317 | 0.071 | 0.037 | 0.001 | nonzero | 15.797 |
Performance metrics for the DBMS listed above. Some are normalized by throughput, others are not. Legend for results is here.
ips	qps	rps	rmbps	wps	wmbps	rpq	rkbpq	wpi	wkbpi	csps	cpups	cspq	cpupq	dbgb1	dbgb2	rss	maxop	p50	p99	tag
247295	0	1680	6.6	1259.5	72.2	0.007	0.027	0.005	0.299	35910	76.5	0.145	25	52.6	68.5	10.3	16.336	63865	0	ma110401_rel.cz11b_bee
257566	0	1687	6.6	1316.2	75.1	0.007	0.026	0.005	0.298	35585	78.1	0.138	24	52.6	68.5	10.3	9.994	65750	42144	ma110401_rel.cz11bpur1_bee
235571	0	1614	6.3	252.7	68.7	0.007	0.027	0.001	0.299	34037	73.8	0.144	25	52.6	68.5	10.3	15.797	63265	42355	ma110401_rel.cz11c_bee
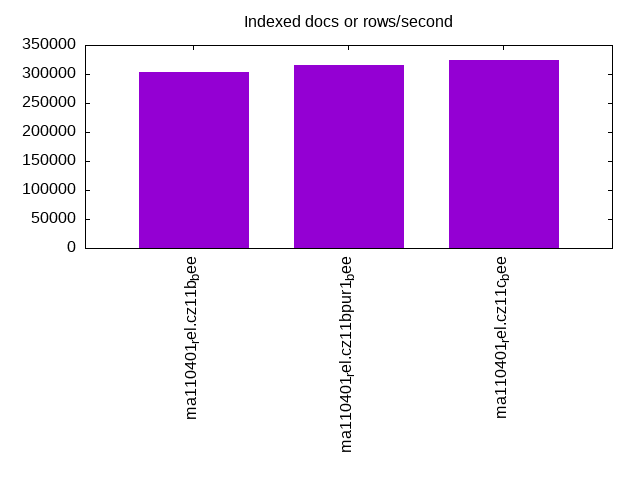
l.x
l.x: create secondary indexes.
Average throughput:
Performance metrics for the DBMS listed above. Some are normalized by throughput, others are not. Legend for results is here.
ips	qps	rps	rmbps	wps	wmbps	rpq	rkbpq	wpi	wkbpi	csps	cpups	cspq	cpupq	dbgb1	dbgb2	rss	maxop	p50	p99	tag
303145	0	2049	270.7	2045.4	300.4	0.007	0.914	0.007	1.015	12256	40.5	0.040	11	119.9	135.8	10.4	0.004	NA	NA	ma110401_rel.cz11b_bee
315582	0	2113	281.7	2173.3	313.5	0.007	0.914	0.007	1.017	11915	41.2	0.038	10	119.9	135.8	10.4	0.004	NA	NA	ma110401_rel.cz11bpur1_bee
323887	0	964	286.9	885.0	322.9	0.003	0.907	0.003	1.021	9235	42.4	0.029	10	119.9	135.8	10.4	0.004	NA	NA	ma110401_rel.cz11c_bee
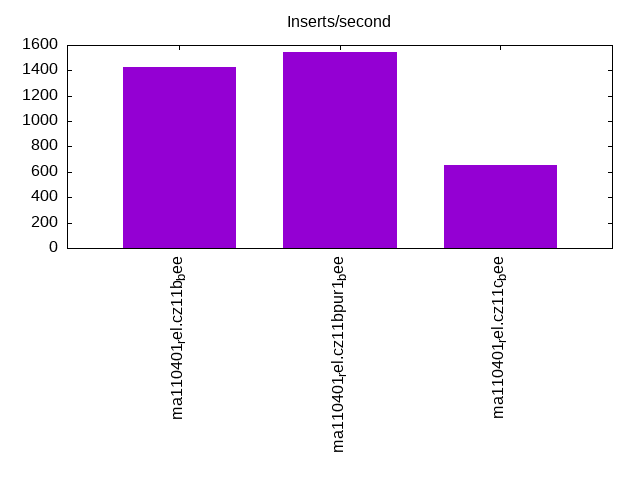
l.i1
l.i1: continue load after secondary indexes created with 50 inserts per transaction. Graphs for performance per 1-second interval are here.
Average throughput:
Insert response time histogram: each cell has the percentage of responses that take <= the time in the header and max is the max response time in seconds. For the max column values in the top 25% of the range have a red background and in the bottom 25% of the range have a green background. The red background is not used when the min value is within 80% of the max value.
| dbms | 256us | 1ms | 4ms | 16ms | 64ms | 256ms | 1s | 4s | 16s | gt | max |
|---|---|---|---|---|---|---|---|---|---|---|---|
| ma110401_rel.cz11b_bee | 0.001 | 12.065 | 85.398 | 1.952 | 0.449 | 0.127 | 0.009 | 89.476 | |||
| ma110401_rel.cz11bpur1_bee | 0.195 | 57.791 | 36.084 | 2.536 | 3.354 | 0.013 | 0.026 | 55.988 | |||
| ma110401_rel.cz11c_bee | 1.568 | 58.202 | 39.630 | 0.314 | 0.217 | 0.068 | 59.685 |
Delete response time histogram: each cell has the percentage of responses that take <= the time in the header and max is the max response time in seconds. For the max column values in the top 25% of the range have a red background and in the bottom 25% of the range have a green background. The red background is not used when the min value is within 80% of the max value.
| dbms | 256us | 1ms | 4ms | 16ms | 64ms | 256ms | 1s | 4s | 16s | gt | max |
|---|---|---|---|---|---|---|---|---|---|---|---|
| ma110401_rel.cz11b_bee | 0.179 | 30.652 | 67.982 | 0.843 | 0.262 | 0.076 | 0.006 | 69.143 | |||
| ma110401_rel.cz11bpur1_bee | 1.982 | 66.823 | 26.947 | 1.472 | 2.745 | 0.014 | 0.017 | 36.846 | |||
| ma110401_rel.cz11c_bee | 0.148 | 6.216 | 87.035 | 6.158 | 0.215 | 0.197 | 0.031 | 26.866 |
Performance metrics for the DBMS listed above. Some are normalized by throughput, others are not. Legend for results is here.
ips	qps	rps	rmbps	wps	wmbps	rpq	rkbpq	wpi	wkbpi	csps	cpups	cspq	cpupq	dbgb1	dbgb2	rss	maxop	p50	p99	tag
1425	0	8914	138.3	8103.4	232.3	6.256	99.386	5.688	166.962	83563	15.1	58.653	848	144.5	160.3	10.1	89.476	350	0	ma110401_rel.cz11b_bee
1541	0	7765	120.4	8212.8	231.1	5.040	80.055	5.331	153.639	84178	13.0	54.640	675	163.8	180.0	10.2	55.988	300	0	ma110401_rel.cz11bpur1_bee
652	0	3962	67.9	3344.8	105.4	6.077	106.647	5.129	165.474	58153	14.2	89.178	1742	144.5	160.3	10.1	59.685	150	0	ma110401_rel.cz11c_bee
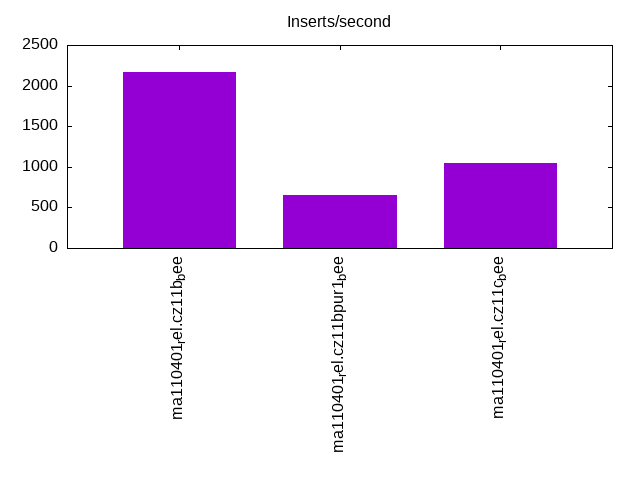
l.i2
l.i2: continue load after secondary indexes created with 5 inserts per transaction. Graphs for performance per 1-second interval are here.
Average throughput:
Insert response time histogram: each cell has the percentage of responses that take <= the time in the header and max is the max response time in seconds. For the max column values in the top 25% of the range have a red background and in the bottom 25% of the range have a green background. The red background is not used when the min value is within 80% of the max value.
| dbms | 256us | 1ms | 4ms | 16ms | 64ms | 256ms | 1s | 4s | 16s | gt | max |
|---|---|---|---|---|---|---|---|---|---|---|---|
| ma110401_rel.cz11b_bee | 19.977 | 66.280 | 12.893 | 0.832 | 0.018 | 0.961 | |||||
| ma110401_rel.cz11bpur1_bee | 0.001 | 31.142 | 17.634 | 45.286 | 5.627 | 0.238 | 0.073 | 1.334 | |||
| ma110401_rel.cz11c_bee | 13.906 | 32.441 | 52.543 | 0.823 | 0.279 | 0.009 | 1.408 |
Delete response time histogram: each cell has the percentage of responses that take <= the time in the header and max is the max response time in seconds. For the max column values in the top 25% of the range have a red background and in the bottom 25% of the range have a green background. The red background is not used when the min value is within 80% of the max value.
| dbms | 256us | 1ms | 4ms | 16ms | 64ms | 256ms | 1s | 4s | 16s | gt | max |
|---|---|---|---|---|---|---|---|---|---|---|---|
| ma110401_rel.cz11b_bee | nonzero | 32.169 | 57.108 | 9.961 | 0.755 | 0.007 | 0.788 | ||||
| ma110401_rel.cz11bpur1_bee | 0.001 | 32.748 | 16.122 | 45.273 | 5.551 | 0.237 | 0.069 | 1.313 | |||
| ma110401_rel.cz11c_bee | 30.959 | 25.860 | 42.296 | 0.639 | 0.244 | 0.002 | 1.522 |
Performance metrics for the DBMS listed above. Some are normalized by throughput, others are not. Legend for results is here.
ips	qps	rps	rmbps	wps	wmbps	rpq	rkbpq	wpi	wkbpi	csps	cpups	cspq	cpupq	dbgb1	dbgb2	rss	maxop	p50	p99	tag
2162	0	12869	193.2	10338.0	301.0	5.952	91.480	4.781	142.565	110399	25.3	51.061	936	144.5	160.3	10.1	0.961	549	30	ma110401_rel.cz11b_bee
648	0	7241	111.7	5040.7	146.3	11.179	176.522	7.782	231.361	56629	11.1	87.431	1371	164.3	180.8	10.2	1.334	95	5	ma110401_rel.cz11bpur1_bee
1043	0	6040	92.8	4947.9	145.2	5.791	91.092	4.744	142.577	74414	20.7	71.346	1588	144.5	160.3	9.9	1.408	275	5	ma110401_rel.cz11c_bee
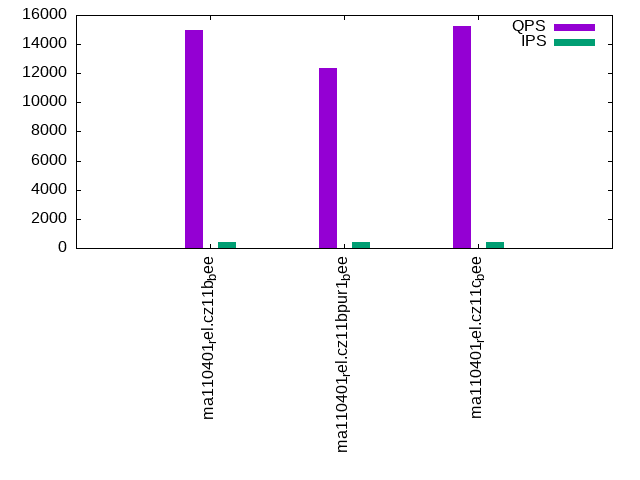
qr100.L1
qr100.L1: range queries with 100 insert/s per client. Graphs for performance per 1-second interval are here.
Average throughput:
Query response time histogram: each cell has the percentage of responses that take <= the time in the header and max is the max response time in seconds. For max values in the top 25% of the range have a red background and in the bottom 25% of the range have a green background. The red background is not used when the min value is within 80% of the max value.
| dbms | 256us | 1ms | 4ms | 16ms | 64ms | 256ms | 1s | 4s | 16s | gt | max |
|---|---|---|---|---|---|---|---|---|---|---|---|
| ma110401_rel.cz11b_bee | 64.950 | 34.737 | 0.269 | 0.032 | 0.012 | 0.050 | |||||
| ma110401_rel.cz11bpur1_bee | 62.328 | 35.160 | 2.354 | 0.088 | 0.070 | nonzero | 0.080 | ||||
| ma110401_rel.cz11c_bee | 67.942 | 31.746 | 0.264 | 0.036 | 0.012 | nonzero | 0.110 |
Insert response time histogram: each cell has the percentage of responses that take <= the time in the header and max is the max response time in seconds. For max values in the top 25% of the range have a red background and in the bottom 25% of the range have a green background. The red background is not used when the min value is within 80% of the max value.
| dbms | 256us | 1ms | 4ms | 16ms | 64ms | 256ms | 1s | 4s | 16s | gt | max |
|---|---|---|---|---|---|---|---|---|---|---|---|
| ma110401_rel.cz11b_bee | 2.528 | 91.500 | 5.972 | 0.103 | |||||||
| ma110401_rel.cz11bpur1_bee | 2.688 | 0.312 | 97.000 | 0.621 | |||||||
| ma110401_rel.cz11c_bee | 0.021 | 83.882 | 16.097 | 0.163 |
Delete response time histogram: each cell has the percentage of responses that take <= the time in the header and max is the max response time in seconds. For max values in the top 25% of the range have a red background and in the bottom 25% of the range have a green background. The red background is not used when the min value is within 80% of the max value.
| dbms | 256us | 1ms | 4ms | 16ms | 64ms | 256ms | 1s | 4s | 16s | gt | max |
|---|---|---|---|---|---|---|---|---|---|---|---|
| ma110401_rel.cz11b_bee | 38.222 | 60.222 | 1.556 | 0.086 | |||||||
| ma110401_rel.cz11bpur1_bee | 0.042 | 2.882 | 0.076 | 97.000 | 0.600 | ||||||
| ma110401_rel.cz11c_bee | 17.799 | 78.410 | 3.792 | 0.140 |
Performance metrics for the DBMS listed above. Some are normalized by throughput, others are not. Legend for results is here.
ips	qps	rps	rmbps	wps	wmbps	rpq	rkbpq	wpi	wkbpi	csps	cpups	cspq	cpupq	dbgb1	dbgb2	rss	maxop	p50	p99	tag
399	14996	2534	39.4	1989.8	57.6	0.169	2.689	4.992	147.863	72772	50.9	4.853	272	144.5	160.3	10.1	0.050	3788	2126	ma110401_rel.cz11b_bee
389	12371	7844	122.3	5075.3	147.8	0.634	10.126	13.044	388.880	95170	49.3	7.693	319	164.3	180.8	10.2	0.080	3133	1535	ma110401_rel.cz11bpur1_bee
398	15272	2461	40.3	1971.5	57.4	0.161	2.704	4.948	147.607	72734	51.9	4.763	272	144.5	160.3	9.9	0.110	3884	1870	ma110401_rel.cz11c_bee
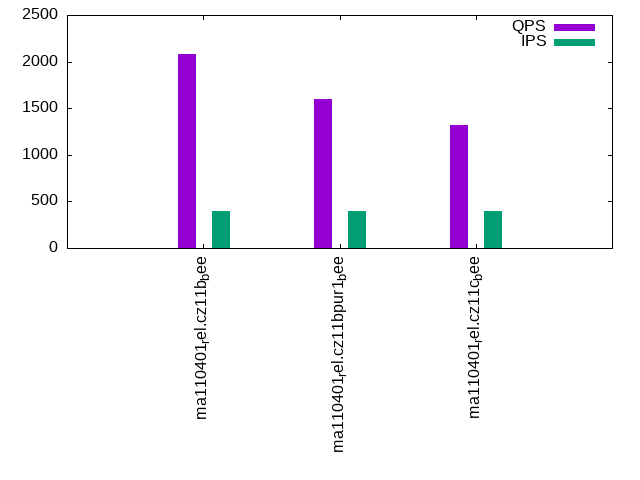
qp100.L2
qp100.L2: point queries with 100 insert/s per client. Graphs for performance per 1-second interval are here.
Average throughput:
Query response time histogram: each cell has the percentage of responses that take <= the time in the header and max is the max response time in seconds. For max values in the top 25% of the range have a red background and in the bottom 25% of the range have a green background. The red background is not used when the min value is within 80% of the max value.
| dbms | 256us | 1ms | 4ms | 16ms | 64ms | 256ms | 1s | 4s | 16s | gt | max |
|---|---|---|---|---|---|---|---|---|---|---|---|
| ma110401_rel.cz11b_bee | 0.437 | 96.316 | 2.919 | 0.328 | 0.054 | ||||||
| ma110401_rel.cz11bpur1_bee | 0.134 | 92.146 | 6.143 | 1.574 | 0.002 | 0.001 | 0.323 | ||||
| ma110401_rel.cz11c_bee | 0.042 | 87.366 | 10.916 | 1.666 | 0.007 | 0.002 | 0.796 |
Insert response time histogram: each cell has the percentage of responses that take <= the time in the header and max is the max response time in seconds. For max values in the top 25% of the range have a red background and in the bottom 25% of the range have a green background. The red background is not used when the min value is within 80% of the max value.
| dbms | 256us | 1ms | 4ms | 16ms | 64ms | 256ms | 1s | 4s | 16s | gt | max |
|---|---|---|---|---|---|---|---|---|---|---|---|
| ma110401_rel.cz11b_bee | 0.111 | 99.819 | 0.069 | 0.102 | |||||||
| ma110401_rel.cz11bpur1_bee | 64.438 | 33.701 | 1.861 | 0.525 | |||||||
| ma110401_rel.cz11c_bee | 73.903 | 25.861 | 0.236 | 0.553 |
Delete response time histogram: each cell has the percentage of responses that take <= the time in the header and max is the max response time in seconds. For max values in the top 25% of the range have a red background and in the bottom 25% of the range have a green background. The red background is not used when the min value is within 80% of the max value.
| dbms | 256us | 1ms | 4ms | 16ms | 64ms | 256ms | 1s | 4s | 16s | gt | max |
|---|---|---|---|---|---|---|---|---|---|---|---|
| ma110401_rel.cz11b_bee | 17.799 | 82.188 | 0.014 | 0.091 | |||||||
| ma110401_rel.cz11bpur1_bee | 0.007 | 93.049 | 5.111 | 1.833 | 0.503 | ||||||
| ma110401_rel.cz11c_bee | 3.208 | 87.708 | 8.917 | 0.167 | 0.531 |
Performance metrics for the DBMS listed above. Some are normalized by throughput, others are not. Legend for results is here.
ips	qps	rps	rmbps	wps	wmbps	rpq	rkbpq	wpi	wkbpi	csps	cpups	cspq	cpupq	dbgb1	dbgb2	rss	maxop	p50	p99	tag
399	2082	20345	317.7	2270.9	65.3	9.771	156.217	5.694	167.628	63395	17.2	30.445	661	144.5	160.3	10.1	0.054	527	463	ma110401_rel.cz11b_bee
399	1596	20302	316.9	4837.7	140.3	12.716	203.266	12.131	360.254	80116	18.3	50.182	917	164.3	180.8	10.2	0.323	400	288	ma110401_rel.cz11bpur1_bee
399	1318	13947	220.0	2234.1	64.4	10.578	170.828	5.602	165.247	58636	20.6	44.472	1250	144.5	160.3	9.4	0.796	336	208	ma110401_rel.cz11c_bee
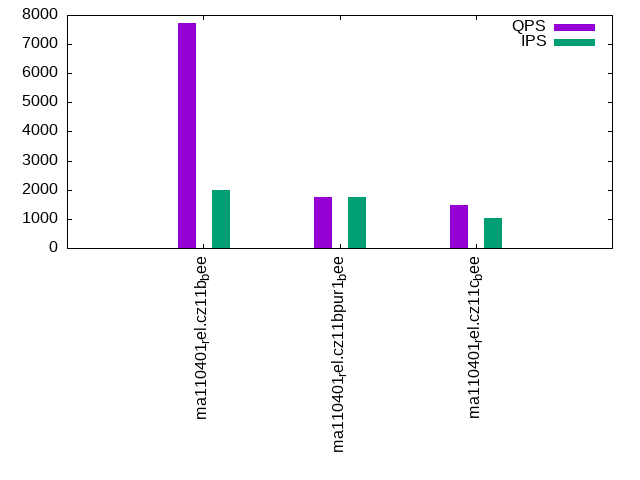
qr500.L3
qr500.L3: range queries with 500 insert/s per client. Graphs for performance per 1-second interval are here.
Average throughput:
Query response time histogram: each cell has the percentage of responses that take <= the time in the header and max is the max response time in seconds. For max values in the top 25% of the range have a red background and in the bottom 25% of the range have a green background. The red background is not used when the min value is within 80% of the max value.
| dbms | 256us | 1ms | 4ms | 16ms | 64ms | 256ms | 1s | 4s | 16s | gt | max |
|---|---|---|---|---|---|---|---|---|---|---|---|
| ma110401_rel.cz11b_bee | 47.105 | 44.564 | 7.392 | 0.832 | 0.104 | 0.002 | nonzero | 0.567 | |||
| ma110401_rel.cz11bpur1_bee | 15.173 | 62.193 | 14.377 | 4.204 | 3.914 | 0.134 | 0.005 | 0.565 | |||
| ma110401_rel.cz11c_bee | 9.384 | 64.113 | 13.062 | 6.669 | 6.687 | 0.082 | 0.003 | 0.001 | 3.973 |
Insert response time histogram: each cell has the percentage of responses that take <= the time in the header and max is the max response time in seconds. For max values in the top 25% of the range have a red background and in the bottom 25% of the range have a green background. The red background is not used when the min value is within 80% of the max value.
| dbms | 256us | 1ms | 4ms | 16ms | 64ms | 256ms | 1s | 4s | 16s | gt | max |
|---|---|---|---|---|---|---|---|---|---|---|---|
| ma110401_rel.cz11b_bee | 0.022 | 80.022 | 19.656 | 0.300 | 0.651 | ||||||
| ma110401_rel.cz11bpur1_bee | 0.051 | 47.065 | 38.374 | 14.510 | 0.918 | ||||||
| ma110401_rel.cz11c_bee | 0.192 | 95.324 | 4.431 | 0.040 | 0.010 | 0.004 | 26.879 |
Delete response time histogram: each cell has the percentage of responses that take <= the time in the header and max is the max response time in seconds. For max values in the top 25% of the range have a red background and in the bottom 25% of the range have a green background. The red background is not used when the min value is within 80% of the max value.
| dbms | 256us | 1ms | 4ms | 16ms | 64ms | 256ms | 1s | 4s | 16s | gt | max |
|---|---|---|---|---|---|---|---|---|---|---|---|
| ma110401_rel.cz11b_bee | 1.256 | 88.981 | 9.536 | 0.228 | 0.531 | ||||||
| ma110401_rel.cz11bpur1_bee | 1.285 | 49.699 | 37.674 | 11.343 | 0.836 | ||||||
| ma110401_rel.cz11c_bee | 1.386 | 97.899 | 0.662 | 0.040 | 0.010 | 0.003 | 25.272 |
Performance metrics for the DBMS listed above. Some are normalized by throughput, others are not. Legend for results is here.
ips	qps	rps	rmbps	wps	wmbps	rpq	rkbpq	wpi	wkbpi	csps	cpups	cspq	cpupq	dbgb1	dbgb2	rss	maxop	p50	p99	tag
1994	7724	14589	226.8	9866.2	286.4	1.889	30.075	4.947	147.048	120812	42.5	15.642	440	144.5	160.3	10.1	0.567	1983	815	ma110401_rel.cz11b_bee
1737	1744	10446	162.3	8392.9	239.1	5.991	95.316	4.831	140.895	84435	21.6	48.425	991	164.3	180.8	10.2	0.565	432	128	ma110401_rel.cz11bpur1_bee
1042	1480	7542	122.9	4843.3	141.2	5.094	84.983	4.649	138.799	87179	27.1	58.885	1464	144.5	160.3	9.4	3.973	368	16	ma110401_rel.cz11c_bee
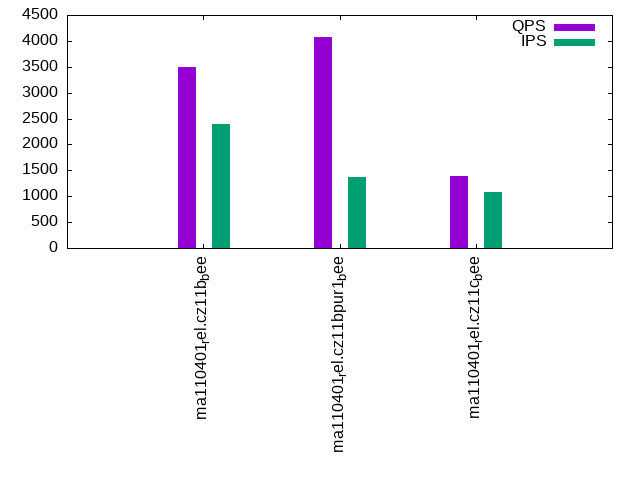
qp500.L4
qp500.L4: point queries with 500 insert/s per client. Graphs for performance per 1-second interval are here.
Average throughput:

Query response time histogram: each cell has the percentage of responses that take <= the time in the header and max is the max response time in seconds. For max values in the top 25% of the range have a red background and in the bottom 25% of the range have a green background. The red background is not used when the min value is within 80% of the max value.
| dbms | 256us | 1ms | 4ms | 16ms | 64ms | 256ms | 1s | 4s | 16s | gt | max |
|---|---|---|---|---|---|---|---|---|---|---|---|
| ma110401_rel.cz11b_bee | 0.006 | 79.246 | 19.897 | 0.843 | 0.007 | 0.002 | 0.526 | ||||
| ma110401_rel.cz11bpur1_bee | nonzero | 56.187 | 20.599 | 22.973 | 0.232 | 0.008 | 0.725 | ||||
| ma110401_rel.cz11c_bee | 17.465 | 46.631 | 35.232 | 0.632 | 0.038 | 0.001 | 2.874 |
Insert response time histogram: each cell has the percentage of responses that take <= the time in the header and max is the max response time in seconds. For max values in the top 25% of the range have a red background and in the bottom 25% of the range have a green background. The red background is not used when the min value is within 80% of the max value.
| dbms | 256us | 1ms | 4ms | 16ms | 64ms | 256ms | 1s | 4s | 16s | gt | max |
|---|---|---|---|---|---|---|---|---|---|---|---|
| ma110401_rel.cz11b_bee | 0.001 | 84.701 | 15.174 | 0.124 | 0.583 | ||||||
| ma110401_rel.cz11bpur1_bee | 0.142 | 37.697 | 54.189 | 7.972 | 0.955 | ||||||
| ma110401_rel.cz11c_bee | 1.078 | 95.369 | 3.338 | 0.175 | 0.040 | 12.540 |
Delete response time histogram: each cell has the percentage of responses that take <= the time in the header and max is the max response time in seconds. For max values in the top 25% of the range have a red background and in the bottom 25% of the range have a green background. The red background is not used when the min value is within 80% of the max value.
| dbms | 256us | 1ms | 4ms | 16ms | 64ms | 256ms | 1s | 4s | 16s | gt | max |
|---|---|---|---|---|---|---|---|---|---|---|---|
| ma110401_rel.cz11b_bee | 0.126 | 90.749 | 9.026 | 0.099 | 0.573 | ||||||
| ma110401_rel.cz11bpur1_bee | 1.006 | 38.597 | 55.300 | 5.097 | 0.834 | ||||||
| ma110401_rel.cz11c_bee | 3.156 | 95.746 | 0.886 | 0.193 | 0.019 | 11.345 |
Performance metrics for the DBMS listed above. Some are normalized by throughput, others are not. Legend for results is here.
ips	qps	rps	rmbps	wps	wmbps	rpq	rkbpq	wpi	wkbpi	csps	cpups	cspq	cpupq	dbgb1	dbgb2	rss	maxop	p50	p99	tag
1994	1202	22938	357.3	9718.9	282.0	19.075	304.301	4.873	144.783	118159	23.3	98.261	1550	144.5	160.3	10.1	0.526	304	208	ma110401_rel.cz11b_bee
1837	400	12202	189.8	8336.1	238.9	30.528	486.250	4.539	133.217	82195	15.6	205.643	3122	164.3	180.9	10.2	0.725	96	32	ma110401_rel.cz11bpur1_bee
1081	310	8989	141.0	4875.0	141.6	29.043	466.666	4.510	134.119	112143	26.6	362.337	6876	144.5	160.3	10.0	2.874	80	0	ma110401_rel.cz11c_bee
qr1000.L5
qr1000.L5: range queries with 1000 insert/s per client. Graphs for performance per 1-second interval are here.
Average throughput:
Query response time histogram: each cell has the percentage of responses that take <= the time in the header and max is the max response time in seconds. For max values in the top 25% of the range have a red background and in the bottom 25% of the range have a green background. The red background is not used when the min value is within 80% of the max value.
| dbms | 256us | 1ms | 4ms | 16ms | 64ms | 256ms | 1s | 4s | 16s | gt | max |
|---|---|---|---|---|---|---|---|---|---|---|---|
| ma110401_rel.cz11b_bee | 21.812 | 58.677 | 14.260 | 4.717 | 0.493 | 0.039 | 0.002 | nonzero | 2.120 | ||
| ma110401_rel.cz11bpur1_bee | 40.829 | 50.987 | 6.003 | 0.804 | 1.323 | 0.052 | 0.001 | 0.747 | |||
| ma110401_rel.cz11c_bee | 9.276 | 62.578 | 13.363 | 7.537 | 7.150 | 0.093 | 0.002 | 0.001 | nonzero | 6.160 |
Insert response time histogram: each cell has the percentage of responses that take <= the time in the header and max is the max response time in seconds. For max values in the top 25% of the range have a red background and in the bottom 25% of the range have a green background. The red background is not used when the min value is within 80% of the max value.
| dbms | 256us | 1ms | 4ms | 16ms | 64ms | 256ms | 1s | 4s | 16s | gt | max |
|---|---|---|---|---|---|---|---|---|---|---|---|
| ma110401_rel.cz11b_bee | 0.017 | 22.476 | 77.443 | 0.035 | 0.018 | 0.012 | 13.287 | ||||
| ma110401_rel.cz11bpur1_bee | 0.868 | 40.483 | 30.731 | 27.914 | 0.003 | 1.088 | |||||
| ma110401_rel.cz11c_bee | 0.136 | 96.483 | 3.315 | 0.049 | 0.013 | 0.003 | 22.622 |
Delete response time histogram: each cell has the percentage of responses that take <= the time in the header and max is the max response time in seconds. For max values in the top 25% of the range have a red background and in the bottom 25% of the range have a green background. The red background is not used when the min value is within 80% of the max value.
| dbms | 256us | 1ms | 4ms | 16ms | 64ms | 256ms | 1s | 4s | 16s | gt | max |
|---|---|---|---|---|---|---|---|---|---|---|---|
| ma110401_rel.cz11b_bee | 0.043 | 50.208 | 49.703 | 0.017 | 0.019 | 0.009 | 11.336 | ||||
| ma110401_rel.cz11bpur1_bee | 3.859 | 38.965 | 30.460 | 26.715 | 0.001 | 1.069 | |||||
| ma110401_rel.cz11c_bee | 0.786 | 98.400 | 0.751 | 0.052 | 0.008 | 0.003 | 22.347 |
Performance metrics for the DBMS listed above. Some are normalized by throughput, others are not. Legend for results is here.
ips	qps	rps	rmbps	wps	wmbps	rpq	rkbpq	wpi	wkbpi	csps	cpups	cspq	cpupq	dbgb1	dbgb2	rss	maxop	p50	p99	tag
2399	3504	15703	244.0	10831.1	314.9	4.482	71.321	4.514	134.399	121572	34.1	34.697	779	144.5	160.3	10.1	2.120	895	32	ma110401_rel.cz11b_bee
1372	4070	9606	149.6	6854.1	196.9	2.360	37.627	4.997	146.977	81788	29.3	20.095	576	165.0	182.1	10.2	0.747	464	96	ma110401_rel.cz11bpur1_bee
1072	1386	7594	122.0	4818.4	140.0	5.480	90.169	4.495	133.755	89502	27.1	64.590	1565	144.5	160.3	9.2	6.160	352	32	ma110401_rel.cz11c_bee
qp1000.L6
qp1000.L6: point queries with 1000 insert/s per client. Graphs for performance per 1-second interval are here.
Average throughput:
Query response time histogram: each cell has the percentage of responses that take <= the time in the header and max is the max response time in seconds. For max values in the top 25% of the range have a red background and in the bottom 25% of the range have a green background. The red background is not used when the min value is within 80% of the max value.
| dbms | 256us | 1ms | 4ms | 16ms | 64ms | 256ms | 1s | 4s | 16s | gt | max |
|---|---|---|---|---|---|---|---|---|---|---|---|
| ma110401_rel.cz11b_bee | nonzero | 42.829 | 53.425 | 3.469 | 0.265 | 0.012 | nonzero | 1.399 | |||
| ma110401_rel.cz11bpur1_bee | 0.120 | 91.328 | 5.841 | 2.701 | 0.009 | 0.001 | 0.691 | ||||
| ma110401_rel.cz11c_bee | 23.144 | 36.074 | 39.179 | 1.530 | 0.070 | 0.003 | 2.981 |
Insert response time histogram: each cell has the percentage of responses that take <= the time in the header and max is the max response time in seconds. For max values in the top 25% of the range have a red background and in the bottom 25% of the range have a green background. The red background is not used when the min value is within 80% of the max value.
| dbms | 256us | 1ms | 4ms | 16ms | 64ms | 256ms | 1s | 4s | 16s | gt | max |
|---|---|---|---|---|---|---|---|---|---|---|---|
| ma110401_rel.cz11b_bee | 0.005 | 25.107 | 74.799 | 0.042 | 0.037 | 0.010 | 5.971 | ||||
| ma110401_rel.cz11bpur1_bee | 0.106 | 17.749 | 23.712 | 58.433 | 0.995 | ||||||
| ma110401_rel.cz11c_bee | 6.906 | 81.192 | 11.610 | 0.251 | 0.042 | 10.758 |
Delete response time histogram: each cell has the percentage of responses that take <= the time in the header and max is the max response time in seconds. For max values in the top 25% of the range have a red background and in the bottom 25% of the range have a green background. The red background is not used when the min value is within 80% of the max value.
| dbms | 256us | 1ms | 4ms | 16ms | 64ms | 256ms | 1s | 4s | 16s | gt | max |
|---|---|---|---|---|---|---|---|---|---|---|---|
| ma110401_rel.cz11b_bee | 0.030 | 47.512 | 52.390 | 0.021 | 0.042 | 0.005 | 5.236 | ||||
| ma110401_rel.cz11bpur1_bee | 0.430 | 18.276 | 23.376 | 57.919 | 0.990 | ||||||
| ma110401_rel.cz11c_bee | 0.005 | 9.319 | 81.293 | 9.184 | 0.183 | 0.016 | 10.706 |
Performance metrics for the DBMS listed above. Some are normalized by throughput, others are not. Legend for results is here.
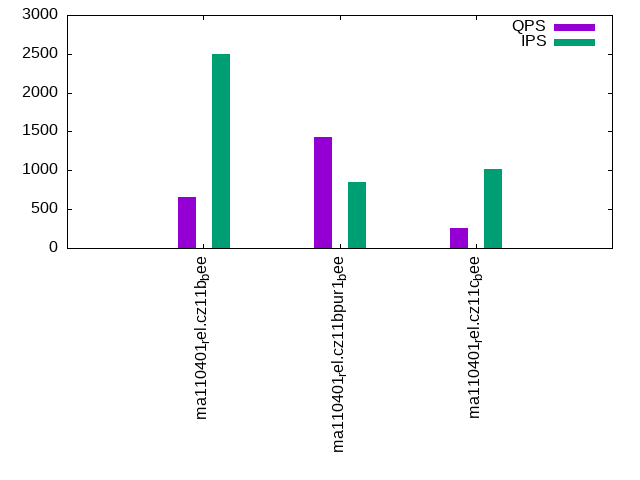
ips	qps	rps	rmbps	wps	wmbps	rpq	rkbpq	wpi	wkbpi	csps	cpups	cspq	cpupq	dbgb1	dbgb2	rss	maxop	p50	p99	tag
2503	653	20079	312.4	11034.5	320.8	30.743	489.772	4.409	131.283	128260	24.0	196.386	2940	144.5	160.3	10.1	1.399	160	0	ma110401_rel.cz11b_bee
851	1431	20633	322.0	5615.7	161.5	14.415	230.399	6.597	194.241	88951	18.2	62.147	1017	165.5	182.7	10.2	0.691	416	48	ma110401_rel.cz11bpur1_bee
1012	261	8039	126.0	4778.3	138.0	30.777	494.124	4.721	139.563	102064	24.2	390.751	7412	145.0	160.9	9.9	2.981	64	0	ma110401_rel.cz11c_bee
l.i0
l.i0: load without secondary indexes
Performance metrics for all DBMS, not just the ones listed above. Some are normalized by throughput, others are not. Legend for results is here.
ips	qps	rps	rmbps	wps	wmbps	rpq	rkbpq	wpi	wkbpi	csps	cpups	cspq	cpupq	dbgb1	dbgb2	rss	maxop	p50	p99	tag
247295	0	1680	6.6	1259.5	72.2	0.007	0.027	0.005	0.299	35910	76.5	0.145	25	52.6	68.5	10.3	16.336	63865	0	ma110401_rel.cz11b_bee
257566	0	1687	6.6	1316.2	75.1	0.007	0.026	0.005	0.298	35585	78.1	0.138	24	52.6	68.5	10.3	9.994	65750	42144	ma110401_rel.cz11bpur1_bee
235571	0	1614	6.3	252.7	68.7	0.007	0.027	0.001	0.299	34037	73.8	0.144	25	52.6	68.5	10.3	15.797	63265	42355	ma110401_rel.cz11c_bee
l.x
l.x: create secondary indexes
Performance metrics for all DBMS, not just the ones listed above. Some are normalized by throughput, others are not. Legend for results is here.
ips	qps	rps	rmbps	wps	wmbps	rpq	rkbpq	wpi	wkbpi	csps	cpups	cspq	cpupq	dbgb1	dbgb2	rss	maxop	p50	p99	tag
303145	0	2049	270.7	2045.4	300.4	0.007	0.914	0.007	1.015	12256	40.5	0.040	11	119.9	135.8	10.4	0.004	NA	NA	ma110401_rel.cz11b_bee
315582	0	2113	281.7	2173.3	313.5	0.007	0.914	0.007	1.017	11915	41.2	0.038	10	119.9	135.8	10.4	0.004	NA	NA	ma110401_rel.cz11bpur1_bee
323887	0	964	286.9	885.0	322.9	0.003	0.907	0.003	1.021	9235	42.4	0.029	10	119.9	135.8	10.4	0.004	NA	NA	ma110401_rel.cz11c_bee
l.i1
l.i1: continue load after secondary indexes created with 50 inserts per transaction
Performance metrics for all DBMS, not just the ones listed above. Some are normalized by throughput, others are not. Legend for results is here.
ips	qps	rps	rmbps	wps	wmbps	rpq	rkbpq	wpi	wkbpi	csps	cpups	cspq	cpupq	dbgb1	dbgb2	rss	maxop	p50	p99	tag
1425	0	8914	138.3	8103.4	232.3	6.256	99.386	5.688	166.962	83563	15.1	58.653	848	144.5	160.3	10.1	89.476	350	0	ma110401_rel.cz11b_bee
1541	0	7765	120.4	8212.8	231.1	5.040	80.055	5.331	153.639	84178	13.0	54.640	675	163.8	180.0	10.2	55.988	300	0	ma110401_rel.cz11bpur1_bee
652	0	3962	67.9	3344.8	105.4	6.077	106.647	5.129	165.474	58153	14.2	89.178	1742	144.5	160.3	10.1	59.685	150	0	ma110401_rel.cz11c_bee
l.i2
l.i2: continue load after secondary indexes created with 5 inserts per transaction
Performance metrics for all DBMS, not just the ones listed above. Some are normalized by throughput, others are not. Legend for results is here.
ips	qps	rps	rmbps	wps	wmbps	rpq	rkbpq	wpi	wkbpi	csps	cpups	cspq	cpupq	dbgb1	dbgb2	rss	maxop	p50	p99	tag
2162	0	12869	193.2	10338.0	301.0	5.952	91.480	4.781	142.565	110399	25.3	51.061	936	144.5	160.3	10.1	0.961	549	30	ma110401_rel.cz11b_bee
648	0	7241	111.7	5040.7	146.3	11.179	176.522	7.782	231.361	56629	11.1	87.431	1371	164.3	180.8	10.2	1.334	95	5	ma110401_rel.cz11bpur1_bee
1043	0	6040	92.8	4947.9	145.2	5.791	91.092	4.744	142.577	74414	20.7	71.346	1588	144.5	160.3	9.9	1.408	275	5	ma110401_rel.cz11c_bee
qr100.L1
qr100.L1: range queries with 100 insert/s per client
Performance metrics for all DBMS, not just the ones listed above. Some are normalized by throughput, others are not. Legend for results is here.
ips	qps	rps	rmbps	wps	wmbps	rpq	rkbpq	wpi	wkbpi	csps	cpups	cspq	cpupq	dbgb1	dbgb2	rss	maxop	p50	p99	tag
399	14996	2534	39.4	1989.8	57.6	0.169	2.689	4.992	147.863	72772	50.9	4.853	272	144.5	160.3	10.1	0.050	3788	2126	ma110401_rel.cz11b_bee
389	12371	7844	122.3	5075.3	147.8	0.634	10.126	13.044	388.880	95170	49.3	7.693	319	164.3	180.8	10.2	0.080	3133	1535	ma110401_rel.cz11bpur1_bee
398	15272	2461	40.3	1971.5	57.4	0.161	2.704	4.948	147.607	72734	51.9	4.763	272	144.5	160.3	9.9	0.110	3884	1870	ma110401_rel.cz11c_bee
qp100.L2
qp100.L2: point queries with 100 insert/s per client
Performance metrics for all DBMS, not just the ones listed above. Some are normalized by throughput, others are not. Legend for results is here.
ips	qps	rps	rmbps	wps	wmbps	rpq	rkbpq	wpi	wkbpi	csps	cpups	cspq	cpupq	dbgb1	dbgb2	rss	maxop	p50	p99	tag
399	2082	20345	317.7	2270.9	65.3	9.771	156.217	5.694	167.628	63395	17.2	30.445	661	144.5	160.3	10.1	0.054	527	463	ma110401_rel.cz11b_bee
399	1596	20302	316.9	4837.7	140.3	12.716	203.266	12.131	360.254	80116	18.3	50.182	917	164.3	180.8	10.2	0.323	400	288	ma110401_rel.cz11bpur1_bee
399	1318	13947	220.0	2234.1	64.4	10.578	170.828	5.602	165.247	58636	20.6	44.472	1250	144.5	160.3	9.4	0.796	336	208	ma110401_rel.cz11c_bee
qr500.L3
qr500.L3: range queries with 500 insert/s per client
Performance metrics for all DBMS, not just the ones listed above. Some are normalized by throughput, others are not. Legend for results is here.
ips	qps	rps	rmbps	wps	wmbps	rpq	rkbpq	wpi	wkbpi	csps	cpups	cspq	cpupq	dbgb1	dbgb2	rss	maxop	p50	p99	tag
1994	7724	14589	226.8	9866.2	286.4	1.889	30.075	4.947	147.048	120812	42.5	15.642	440	144.5	160.3	10.1	0.567	1983	815	ma110401_rel.cz11b_bee
1737	1744	10446	162.3	8392.9	239.1	5.991	95.316	4.831	140.895	84435	21.6	48.425	991	164.3	180.8	10.2	0.565	432	128	ma110401_rel.cz11bpur1_bee
1042	1480	7542	122.9	4843.3	141.2	5.094	84.983	4.649	138.799	87179	27.1	58.885	1464	144.5	160.3	9.4	3.973	368	16	ma110401_rel.cz11c_bee
qp500.L4
qp500.L4: point queries with 500 insert/s per client
Performance metrics for all DBMS, not just the ones listed above. Some are normalized by throughput, others are not. Legend for results is here.
ips	qps	rps	rmbps	wps	wmbps	rpq	rkbpq	wpi	wkbpi	csps	cpups	cspq	cpupq	dbgb1	dbgb2	rss	maxop	p50	p99	tag
1994	1202	22938	357.3	9718.9	282.0	19.075	304.301	4.873	144.783	118159	23.3	98.261	1550	144.5	160.3	10.1	0.526	304	208	ma110401_rel.cz11b_bee
1837	400	12202	189.8	8336.1	238.9	30.528	486.250	4.539	133.217	82195	15.6	205.643	3122	164.3	180.9	10.2	0.725	96	32	ma110401_rel.cz11bpur1_bee
1081	310	8989	141.0	4875.0	141.6	29.043	466.666	4.510	134.119	112143	26.6	362.337	6876	144.5	160.3	10.0	2.874	80	0	ma110401_rel.cz11c_bee
qr1000.L5
qr1000.L5: range queries with 1000 insert/s per client
Performance metrics for all DBMS, not just the ones listed above. Some are normalized by throughput, others are not. Legend for results is here.
ips	qps	rps	rmbps	wps	wmbps	rpq	rkbpq	wpi	wkbpi	csps	cpups	cspq	cpupq	dbgb1	dbgb2	rss	maxop	p50	p99	tag
2399	3504	15703	244.0	10831.1	314.9	4.482	71.321	4.514	134.399	121572	34.1	34.697	779	144.5	160.3	10.1	2.120	895	32	ma110401_rel.cz11b_bee
1372	4070	9606	149.6	6854.1	196.9	2.360	37.627	4.997	146.977	81788	29.3	20.095	576	165.0	182.1	10.2	0.747	464	96	ma110401_rel.cz11bpur1_bee
1072	1386	7594	122.0	4818.4	140.0	5.480	90.169	4.495	133.755	89502	27.1	64.590	1565	144.5	160.3	9.2	6.160	352	32	ma110401_rel.cz11c_bee
qp1000.L6
qp1000.L6: point queries with 1000 insert/s per client
Performance metrics for all DBMS, not just the ones listed above. Some are normalized by throughput, others are not. Legend for results is here.
ips	qps	rps	rmbps	wps	wmbps	rpq	rkbpq	wpi	wkbpi	csps	cpups	cspq	cpupq	dbgb1	dbgb2	rss	maxop	p50	p99	tag
2503	653	20079	312.4	11034.5	320.8	30.743	489.772	4.409	131.283	128260	24.0	196.386	2940	144.5	160.3	10.1	1.399	160	0	ma110401_rel.cz11b_bee
851	1431	20633	322.0	5615.7	161.5	14.415	230.399	6.597	194.241	88951	18.2	62.147	1017	165.5	182.7	10.2	0.691	416	48	ma110401_rel.cz11bpur1_bee
1012	261	8039	126.0	4778.3	138.0	30.777	494.124	4.721	139.563	102064	24.2	390.751	7412	145.0	160.9	9.9	2.981	64	0	ma110401_rel.cz11c_bee
l.i0
- l.i0: load without secondary indexes
- Legend for results is here.
- Each entry lists the percentage of responses that fit in that bucket (slower than max time for previous bucket, faster than min time for next bucket).
Insert response time histogram
256us	1ms	4ms	16ms	64ms	256ms	1s	4s	16s	gt	max	tag
0.000	0.051	97.411	2.445	0.070	0.023	0.000	0.000	nonzero	nonzero	16.336	ma110401_rel.cz11b_bee
0.000	0.075	98.944	0.915	0.045	0.021	nonzero	nonzero	nonzero	0.000	9.994	ma110401_rel.cz11bpur1_bee
0.000	0.015	97.559	2.317	0.071	0.037	0.001	0.000	nonzero	0.000	15.797	ma110401_rel.cz11c_bee
l.x
- l.x: create secondary indexes
- Legend for results is here.
- Each entry lists the percentage of responses that fit in that bucket (slower than max time for previous bucket, faster than min time for next bucket).
TODO - determine whether there is data for create index response time
l.i1
- l.i1: continue load after secondary indexes created with 50 inserts per transaction
- Legend for results is here.
- Each entry lists the percentage of responses that fit in that bucket (slower than max time for previous bucket, faster than min time for next bucket).
Insert response time histogram
256us	1ms	4ms	16ms	64ms	256ms	1s	4s	16s	gt	max	tag
0.000	0.000	0.000	0.001	12.065	85.398	1.952	0.449	0.127	0.009	89.476	ma110401_rel.cz11b_bee
0.000	0.000	0.000	0.195	57.791	36.084	2.536	3.354	0.013	0.026	55.988	ma110401_rel.cz11bpur1_bee
0.000	0.000	0.000	0.000	1.568	58.202	39.630	0.314	0.217	0.068	59.685	ma110401_rel.cz11c_bee
Delete response time histogram
256us	1ms	4ms	16ms	64ms	256ms	1s	4s	16s	gt	max	tag
0.000	0.000	0.000	0.179	30.652	67.982	0.843	0.262	0.076	0.006	69.143	ma110401_rel.cz11b_bee
0.000	0.000	0.000	1.982	66.823	26.947	1.472	2.745	0.014	0.017	36.846	ma110401_rel.cz11bpur1_bee
0.000	0.000	0.000	0.148	6.216	87.035	6.158	0.215	0.197	0.031	26.866	ma110401_rel.cz11c_bee
l.i2
- l.i2: continue load after secondary indexes created with 5 inserts per transaction
- Legend for results is here.
- Each entry lists the percentage of responses that fit in that bucket (slower than max time for previous bucket, faster than min time for next bucket).
Insert response time histogram
256us	1ms	4ms	16ms	64ms	256ms	1s	4s	16s	gt	max	tag
0.000	0.000	19.977	66.280	12.893	0.832	0.018	0.000	0.000	0.000	0.961	ma110401_rel.cz11b_bee
0.000	0.001	31.142	17.634	45.286	5.627	0.238	0.073	0.000	0.000	1.334	ma110401_rel.cz11bpur1_bee
0.000	0.000	13.906	32.441	52.543	0.823	0.279	0.009	0.000	0.000	1.408	ma110401_rel.cz11c_bee
Delete response time histogram
256us	1ms	4ms	16ms	64ms	256ms	1s	4s	16s	gt	max	tag
0.000	nonzero	32.169	57.108	9.961	0.755	0.007	0.000	0.000	0.000	0.788	ma110401_rel.cz11b_bee
0.000	0.001	32.748	16.122	45.273	5.551	0.237	0.069	0.000	0.000	1.313	ma110401_rel.cz11bpur1_bee
0.000	0.000	30.959	25.860	42.296	0.639	0.244	0.002	0.000	0.000	1.522	ma110401_rel.cz11c_bee
qr100.L1
- qr100.L1: range queries with 100 insert/s per client
- Legend for results is here.
- Each entry lists the percentage of responses that fit in that bucket (slower than max time for previous bucket, faster than min time for next bucket).
Query response time histogram
256us	1ms	4ms	16ms	64ms	256ms	1s	4s	16s	gt	max	tag
64.950	34.737	0.269	0.032	0.012	0.000	0.000	0.000	0.000	0.000	0.050	ma110401_rel.cz11b_bee
62.328	35.160	2.354	0.088	0.070	nonzero	0.000	0.000	0.000	0.000	0.080	ma110401_rel.cz11bpur1_bee
67.942	31.746	0.264	0.036	0.012	nonzero	0.000	0.000	0.000	0.000	0.110	ma110401_rel.cz11c_bee
Insert response time histogram
256us	1ms	4ms	16ms	64ms	256ms	1s	4s	16s	gt	max	tag
0.000	0.000	0.000	2.528	91.500	5.972	0.000	0.000	0.000	0.000	0.103	ma110401_rel.cz11b_bee
0.000	0.000	0.000	0.000	2.688	0.312	97.000	0.000	0.000	0.000	0.621	ma110401_rel.cz11bpur1_bee
0.000	0.000	0.000	0.021	83.882	16.097	0.000	0.000	0.000	0.000	0.163	ma110401_rel.cz11c_bee
Delete response time histogram
256us	1ms	4ms	16ms	64ms	256ms	1s	4s	16s	gt	max	tag
0.000	0.000	0.000	38.222	60.222	1.556	0.000	0.000	0.000	0.000	0.086	ma110401_rel.cz11b_bee
0.000	0.000	0.000	0.042	2.882	0.076	97.000	0.000	0.000	0.000	0.600	ma110401_rel.cz11bpur1_bee
0.000	0.000	0.000	17.799	78.410	3.792	0.000	0.000	0.000	0.000	0.140	ma110401_rel.cz11c_bee
qp100.L2
- qp100.L2: point queries with 100 insert/s per client
- Legend for results is here.
- Each entry lists the percentage of responses that fit in that bucket (slower than max time for previous bucket, faster than min time for next bucket).
Query response time histogram
256us	1ms	4ms	16ms	64ms	256ms	1s	4s	16s	gt	max	tag
0.000	0.437	96.316	2.919	0.328	0.000	0.000	0.000	0.000	0.000	0.054	ma110401_rel.cz11b_bee
0.000	0.134	92.146	6.143	1.574	0.002	0.001	0.000	0.000	0.000	0.323	ma110401_rel.cz11bpur1_bee
0.000	0.042	87.366	10.916	1.666	0.007	0.002	0.000	0.000	0.000	0.796	ma110401_rel.cz11c_bee
Insert response time histogram
256us	1ms	4ms	16ms	64ms	256ms	1s	4s	16s	gt	max	tag
0.000	0.000	0.000	0.111	99.819	0.069	0.000	0.000	0.000	0.000	0.102	ma110401_rel.cz11b_bee
0.000	0.000	0.000	0.000	64.438	33.701	1.861	0.000	0.000	0.000	0.525	ma110401_rel.cz11bpur1_bee
0.000	0.000	0.000	0.000	73.903	25.861	0.236	0.000	0.000	0.000	0.553	ma110401_rel.cz11c_bee
Delete response time histogram
256us	1ms	4ms	16ms	64ms	256ms	1s	4s	16s	gt	max	tag
0.000	0.000	0.000	17.799	82.188	0.014	0.000	0.000	0.000	0.000	0.091	ma110401_rel.cz11b_bee
0.000	0.000	0.000	0.007	93.049	5.111	1.833	0.000	0.000	0.000	0.503	ma110401_rel.cz11bpur1_bee
0.000	0.000	0.000	3.208	87.708	8.917	0.167	0.000	0.000	0.000	0.531	ma110401_rel.cz11c_bee
qr500.L3
- qr500.L3: range queries with 500 insert/s per client
- Legend for results is here.
- Each entry lists the percentage of responses that fit in that bucket (slower than max time for previous bucket, faster than min time for next bucket).
Query response time histogram
256us	1ms	4ms	16ms	64ms	256ms	1s	4s	16s	gt	max	tag
47.105	44.564	7.392	0.832	0.104	0.002	nonzero	0.000	0.000	0.000	0.567	ma110401_rel.cz11b_bee
15.173	62.193	14.377	4.204	3.914	0.134	0.005	0.000	0.000	0.000	0.565	ma110401_rel.cz11bpur1_bee
9.384	64.113	13.062	6.669	6.687	0.082	0.003	0.001	0.000	0.000	3.973	ma110401_rel.cz11c_bee
Insert response time histogram
256us	1ms	4ms	16ms	64ms	256ms	1s	4s	16s	gt	max	tag
0.000	0.000	0.000	0.022	80.022	19.656	0.300	0.000	0.000	0.000	0.651	ma110401_rel.cz11b_bee
0.000	0.000	0.000	0.051	47.065	38.374	14.510	0.000	0.000	0.000	0.918	ma110401_rel.cz11bpur1_bee
0.000	0.000	0.000	0.000	0.192	95.324	4.431	0.040	0.010	0.004	26.879	ma110401_rel.cz11c_bee
Delete response time histogram
256us	1ms	4ms	16ms	64ms	256ms	1s	4s	16s	gt	max	tag
0.000	0.000	0.000	1.256	88.981	9.536	0.228	0.000	0.000	0.000	0.531	ma110401_rel.cz11b_bee
0.000	0.000	0.000	1.285	49.699	37.674	11.343	0.000	0.000	0.000	0.836	ma110401_rel.cz11bpur1_bee
0.000	0.000	0.000	0.000	1.386	97.899	0.662	0.040	0.010	0.003	25.272	ma110401_rel.cz11c_bee
qp500.L4
- qp500.L4: point queries with 500 insert/s per client
- Legend for results is here.
- Each entry lists the percentage of responses that fit in that bucket (slower than max time for previous bucket, faster than min time for next bucket).
Query response time histogram
256us	1ms	4ms	16ms	64ms	256ms	1s	4s	16s	gt	max	tag
0.000	0.006	79.246	19.897	0.843	0.007	0.002	0.000	0.000	0.000	0.526	ma110401_rel.cz11b_bee
0.000	nonzero	56.187	20.599	22.973	0.232	0.008	0.000	0.000	0.000	0.725	ma110401_rel.cz11bpur1_bee
0.000	0.000	17.465	46.631	35.232	0.632	0.038	0.001	0.000	0.000	2.874	ma110401_rel.cz11c_bee
Insert response time histogram
256us	1ms	4ms	16ms	64ms	256ms	1s	4s	16s	gt	max	tag
0.000	0.000	0.000	0.001	84.701	15.174	0.124	0.000	0.000	0.000	0.583	ma110401_rel.cz11b_bee
0.000	0.000	0.000	0.142	37.697	54.189	7.972	0.000	0.000	0.000	0.955	ma110401_rel.cz11bpur1_bee
0.000	0.000	0.000	0.000	1.078	95.369	3.338	0.175	0.040	0.000	12.540	ma110401_rel.cz11c_bee
Delete response time histogram
256us	1ms	4ms	16ms	64ms	256ms	1s	4s	16s	gt	max	tag
0.000	0.000	0.000	0.126	90.749	9.026	0.099	0.000	0.000	0.000	0.573	ma110401_rel.cz11b_bee
0.000	0.000	0.000	1.006	38.597	55.300	5.097	0.000	0.000	0.000	0.834	ma110401_rel.cz11bpur1_bee
0.000	0.000	0.000	0.000	3.156	95.746	0.886	0.193	0.019	0.000	11.345	ma110401_rel.cz11c_bee
qr1000.L5
- qr1000.L5: range queries with 1000 insert/s per client
- Legend for results is here.
- Each entry lists the percentage of responses that fit in that bucket (slower than max time for previous bucket, faster than min time for next bucket).
Query response time histogram
256us	1ms	4ms	16ms	64ms	256ms	1s	4s	16s	gt	max	tag
21.812	58.677	14.260	4.717	0.493	0.039	0.002	nonzero	0.000	0.000	2.120	ma110401_rel.cz11b_bee
40.829	50.987	6.003	0.804	1.323	0.052	0.001	0.000	0.000	0.000	0.747	ma110401_rel.cz11bpur1_bee
9.276	62.578	13.363	7.537	7.150	0.093	0.002	0.001	nonzero	0.000	6.160	ma110401_rel.cz11c_bee
Insert response time histogram
256us	1ms	4ms	16ms	64ms	256ms	1s	4s	16s	gt	max	tag
0.000	0.000	0.000	0.017	22.476	77.443	0.035	0.018	0.012	0.000	13.287	ma110401_rel.cz11b_bee
0.000	0.000	0.000	0.868	40.483	30.731	27.914	0.003	0.000	0.000	1.088	ma110401_rel.cz11bpur1_bee
0.000	0.000	0.000	0.000	0.136	96.483	3.315	0.049	0.013	0.003	22.622	ma110401_rel.cz11c_bee
Delete response time histogram
256us	1ms	4ms	16ms	64ms	256ms	1s	4s	16s	gt	max	tag
0.000	0.000	0.000	0.043	50.208	49.703	0.017	0.019	0.009	0.000	11.336	ma110401_rel.cz11b_bee
0.000	0.000	0.000	3.859	38.965	30.460	26.715	0.001	0.000	0.000	1.069	ma110401_rel.cz11bpur1_bee
0.000	0.000	0.000	0.000	0.786	98.400	0.751	0.052	0.008	0.003	22.347	ma110401_rel.cz11c_bee
qp1000.L6
- qp1000.L6: point queries with 1000 insert/s per client
- Legend for results is here.
- Each entry lists the percentage of responses that fit in that bucket (slower than max time for previous bucket, faster than min time for next bucket).
Query response time histogram
256us	1ms	4ms	16ms	64ms	256ms	1s	4s	16s	gt	max	tag
0.000	nonzero	42.829	53.425	3.469	0.265	0.012	nonzero	0.000	0.000	1.399	ma110401_rel.cz11b_bee
0.000	0.120	91.328	5.841	2.701	0.009	0.001	0.000	0.000	0.000	0.691	ma110401_rel.cz11bpur1_bee
0.000	0.000	23.144	36.074	39.179	1.530	0.070	0.003	0.000	0.000	2.981	ma110401_rel.cz11c_bee
Insert response time histogram
256us	1ms	4ms	16ms	64ms	256ms	1s	4s	16s	gt	max	tag
0.000	0.000	0.000	0.005	25.107	74.799	0.042	0.037	0.010	0.000	5.971	ma110401_rel.cz11b_bee
0.000	0.000	0.000	0.106	17.749	23.712	58.433	0.000	0.000	0.000	0.995	ma110401_rel.cz11bpur1_bee
0.000	0.000	0.000	0.000	6.906	81.192	11.610	0.251	0.042	0.000	10.758	ma110401_rel.cz11c_bee
Delete response time histogram
256us	1ms	4ms	16ms	64ms	256ms	1s	4s	16s	gt	max	tag
0.000	0.000	0.000	0.030	47.512	52.390	0.021	0.042	0.005	0.000	5.236	ma110401_rel.cz11b_bee
0.000	0.000	0.000	0.430	18.276	23.376	57.919	0.000	0.000	0.000	0.990	ma110401_rel.cz11bpur1_bee
0.000	0.000	0.000	0.005	9.319	81.293	9.184	0.183	0.016	0.000	10.706	ma110401_rel.cz11c_bee