Introduction
This is a report for the insert benchmark with 800M docs and 4 client(s). It is generated by scripts (bash, awk, sed) and Tufte might not be impressed. An overview of the insert benchmark is here and a short update is here. Below, by DBMS, I mean DBMS+version.config. An example is my8020.c10b40 where my means MySQL, 8020 is version 8.0.20 and c10b40 is the name for the configuration file.
The test server has 8 AMD cores, 16G RAM and an NVMe SSD. It is described here as the Beelink. The benchmark was run with 4 clients and there were 1 or 3 connections per client (1 for queries or inserts without rate limits, 1+1 for rate limited inserts+deletes). It uses 4 tables with a table per client. It loads 800M rows per table without secondary indexes, creates 3 secondary indexes per table, then inserts 2m rows per table with a delete per insert to avoid growing the table. It then does 6 read+write tests for 1800s each that do queries as fast as possible with 100,100,500,500,1000,1000 inserts/s and the same for deletes/s per client concurrent with the queries. The database is larger than memory. Clients and the DBMS share one server. The per-database configs are in the per-database subdirectories here.
The tested DBMS are:
- ma101107_rel.cz11a_bee - MariaDB 10.11.7 with the cz11a_bee config
- ma101107_rel.cz11apur1_bee - MariaDB 10.11.7 with the cz11apur1_bee config
- ma101107_rel.cz11b_bee - MariaDB 10.11.7 with the cz11b_bee config that uses innodb_flush_method=O_DIRECT
- ma101107_rel.cz11c_bee - MariaDB 10.11.7 with the cz11c_bee config that uses innodb_flush_method=fsync
Contents
- Summary
- l.i0: load without secondary indexes
- l.x: create secondary indexes
- l.i1: continue load after secondary indexes created with 50 inserts per transaction
- l.i2: continue load after secondary indexes created with 5 inserts per transaction
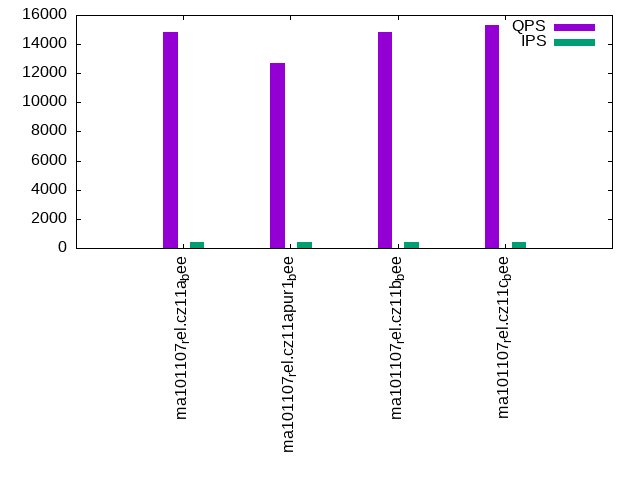
- qr100.L1: range queries with 100 insert/s per client
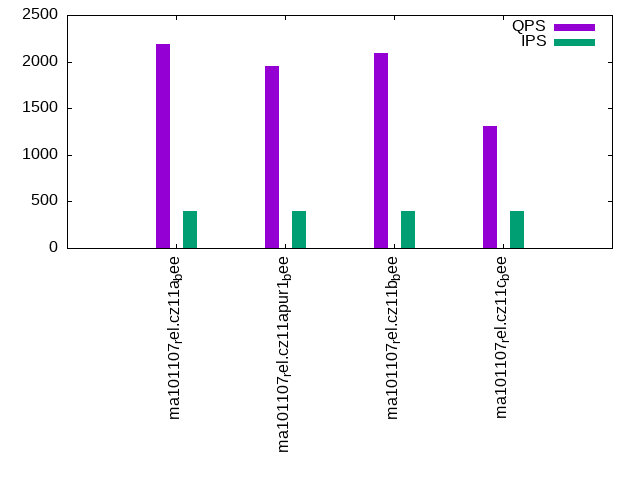
- qp100.L2: point queries with 100 insert/s per client
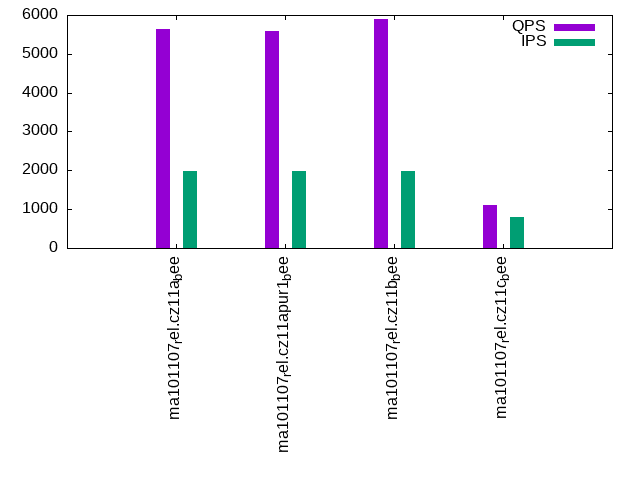
- qr500.L3: range queries with 500 insert/s per client
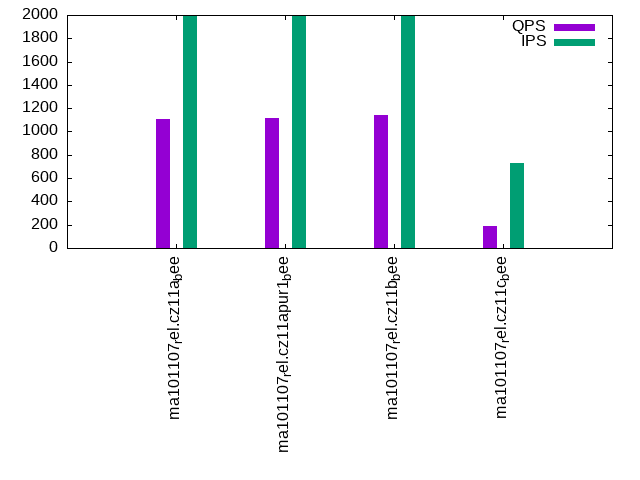
- qp500.L4: point queries with 500 insert/s per client
- qr1000.L5: range queries with 1000 insert/s per client
- qp1000.L6: point queries with 1000 insert/s per client
Summary
The numbers are inserts/s for l.i0, l.i1 and l.i2, indexed docs (or rows) /s for l.x and queries/s for qr100, qp100 thru qr1000, qp1000" The values are the average rate over the entire test for inserts (IPS) and queries (QPS). The range of values for IPS and QPS is split into 3 parts: bottom 25%, middle 50%, top 25%. Values in the bottom 25% have a red background, values in the top 25% have a green background and values in the middle have no color. A gray background is used for values that can be ignored because the DBMS did not sustain the target insert rate. Red backgrounds are not used when the minimum value is within 80% of the max value.
| dbms | l.i0 | l.x | l.i1 | l.i2 | qr100 | qp100 | qr500 | qp500 | qr1000 | qp1000 |
|---|---|---|---|---|---|---|---|---|---|---|
| ma101107_rel.cz11a_bee | 256410 | 316206 | 2502 | 2689 | 14863 | 2193 | 5644 | 1106 | 2660 | 733 |
| ma101107_rel.cz11apur1_bee | 265252 | 321027 | 2957 | 657 | 12737 | 1953 | 5596 | 1120 | 2371 | 1613 |
| ma101107_rel.cz11b_bee | 251177 | 303030 | 1490 | 2086 | 14856 | 2088 | 5908 | 1144 | 3099 | 661 |
| ma101107_rel.cz11c_bee | 237600 | 315333 | 622 | 1053 | 15327 | 1311 | 1106 | 188 | 807 | 187 |
This table has relative throughput, throughput for the DBMS relative to the DBMS in the first line, using the absolute throughput from the previous table. Values less than 0.95 have a yellow background. Values greater than 1.05 have a blue background.
| dbms | l.i0 | l.x | l.i1 | l.i2 | qr100 | qp100 | qr500 | qp500 | qr1000 | qp1000 |
|---|---|---|---|---|---|---|---|---|---|---|
| ma101107_rel.cz11a_bee | 1.00 | 1.00 | 1.00 | 1.00 | 1.00 | 1.00 | 1.00 | 1.00 | 1.00 | 1.00 |
| ma101107_rel.cz11apur1_bee | 1.03 | 1.02 | 1.18 | 0.24 | 0.86 | 0.89 | 0.99 | 1.01 | 0.89 | 2.20 |
| ma101107_rel.cz11b_bee | 0.98 | 0.96 | 0.60 | 0.78 | 1.00 | 0.95 | 1.05 | 1.03 | 1.17 | 0.90 |
| ma101107_rel.cz11c_bee | 0.93 | 1.00 | 0.25 | 0.39 | 1.03 | 0.60 | 0.20 | 0.17 | 0.30 | 0.26 |
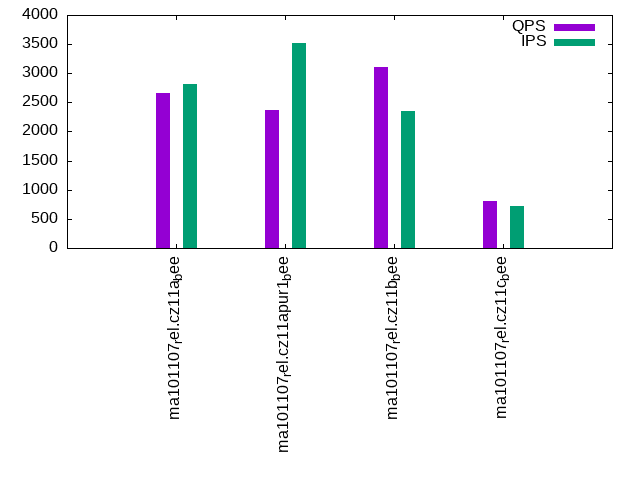
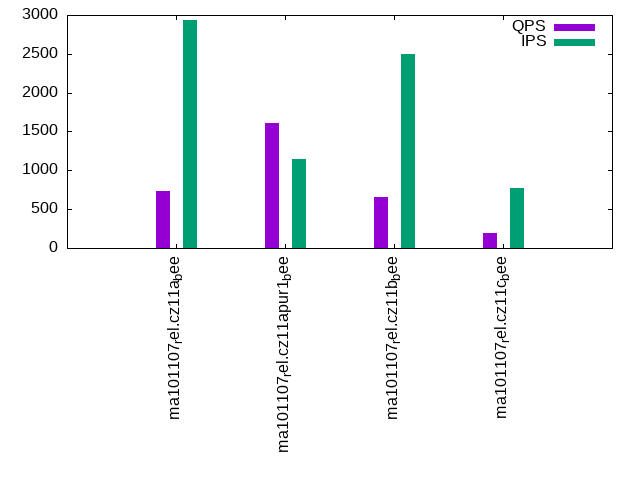
This lists the average rate of inserts/s for the tests that do inserts concurrent with queries. For such tests the query rate is listed in the table above. The read+write tests are setup so that the insert rate should match the target rate every second. Cells that are not at least 95% of the target have a red background to indicate a failure to satisfy the target.
| dbms | qr100.L1 | qp100.L2 | qr500.L3 | qp500.L4 | qr1000.L5 | qp1000.L6 |
|---|---|---|---|---|---|---|
| ma101107_rel.cz11a_bee | 399 | 399 | 1994 | 1994 | 2808 | 2940 |
| ma101107_rel.cz11apur1_bee | 396 | 399 | 1994 | 1994 | 3517 | 1141 |
| ma101107_rel.cz11b_bee | 399 | 399 | 1994 | 1994 | 2351 | 2494 |
| ma101107_rel.cz11c_bee | 399 | 399 | 800 | 731 | 722 | 767 |
| target | 400 | 400 | 2000 | 2000 | 4000 | 4000 |
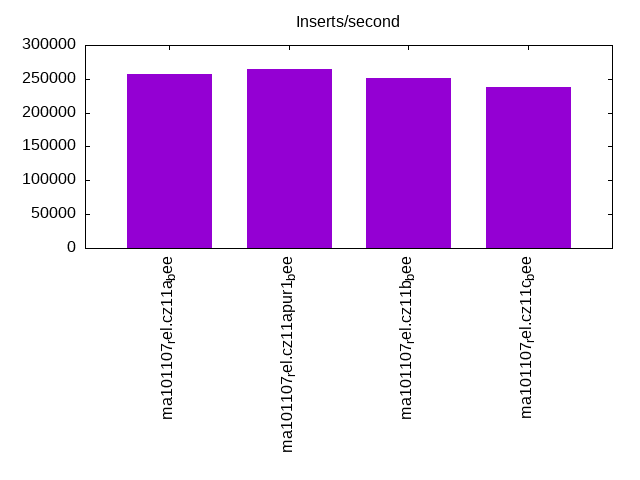
l.i0
l.i0: load without secondary indexes. Graphs for performance per 1-second interval are here.
Average throughput:
Insert response time histogram: each cell has the percentage of responses that take <= the time in the header and max is the max response time in seconds. For the max column values in the top 25% of the range have a red background and in the bottom 25% of the range have a green background. The red background is not used when the min value is within 80% of the max value.
| dbms | 256us | 1ms | 4ms | 16ms | 64ms | 256ms | 1s | 4s | 16s | gt | max |
|---|---|---|---|---|---|---|---|---|---|---|---|
| ma101107_rel.cz11a_bee | 0.106 | 97.277 | 2.565 | 0.032 | 0.020 | 0.179 | |||||
| ma101107_rel.cz11apur1_bee | 0.185 | 98.865 | 0.898 | 0.031 | 0.021 | 0.190 | |||||
| ma101107_rel.cz11b_bee | 0.161 | 97.208 | 2.555 | 0.056 | 0.020 | nonzero | 15.355 | ||||
| ma101107_rel.cz11c_bee | 0.129 | 97.357 | 2.404 | 0.073 | 0.037 | 0.001 | nonzero | nonzero | 31.783 |
Performance metrics for the DBMS listed above. Some are normalized by throughput, others are not. Legend for results is here.
ips	qps	rps	rmbps	wps	wmbps	rpq	rkbpq	wpi	wkbpi	csps	cpups	cspq	cpupq	dbgb1	dbgb2	rss	maxop	p50	p99	tag
256410	0	1757	6.9	1275.2	74.8	0.007	0.027	0.005	0.299	36433	78.8	0.142	25	52.6	68.5	10.3	0.179	64630	54241	ma101107_rel.cz11a_bee
265252	0	1756	6.9	1334.3	77.4	0.007	0.027	0.005	0.299	35639	79.7	0.134	24	52.6	68.5	10.3	0.190	66628	55540	ma101107_rel.cz11apur1_bee
251177	0	1719	6.7	1270.9	73.3	0.007	0.027	0.005	0.299	36015	77.2	0.143	25	52.6	68.5	10.3	15.355	64430	49946	ma101107_rel.cz11b_bee
237600	0	1623	6.3	256.3	69.3	0.007	0.027	0.001	0.299	33659	73.1	0.142	25	52.6	68.5	10.3	31.783	64429	0	ma101107_rel.cz11c_bee
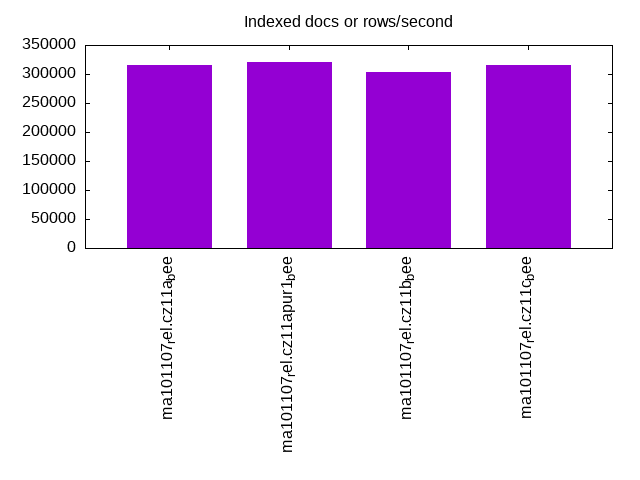
l.x
l.x: create secondary indexes.
Average throughput:
Performance metrics for the DBMS listed above. Some are normalized by throughput, others are not. Legend for results is here.
ips	qps	rps	rmbps	wps	wmbps	rpq	rkbpq	wpi	wkbpi	csps	cpups	cspq	cpupq	dbgb1	dbgb2	rss	maxop	p50	p99	tag
316206	0	2056	281.3	2193.8	314.4	0.007	0.911	0.007	1.018	12215	41.0	0.039	10	119.9	135.8	10.4	0.003	NA	NA	ma101107_rel.cz11a_bee
321027	0	2043	285.3	2200.7	319.1	0.006	0.910	0.007	1.018	11985	41.5	0.037	10	119.9	135.8	10.4	0.005	NA	NA	ma101107_rel.cz11apur1_bee
303030	0	2038	271.0	2128.4	302.0	0.007	0.916	0.007	1.021	12659	40.3	0.042	11	119.9	135.8	10.4	0.003	NA	NA	ma101107_rel.cz11b_bee
315333	0	956	279.7	872.1	313.6	0.003	0.908	0.003	1.018	10263	42.0	0.033	11	119.9	135.8	10.4	0.009	NA	NA	ma101107_rel.cz11c_bee
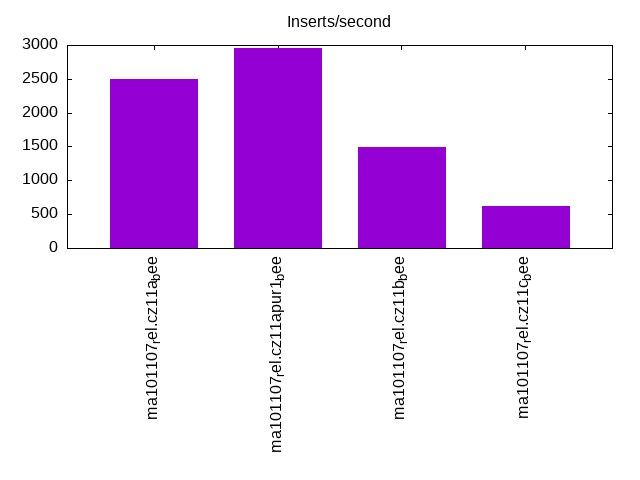
l.i1
l.i1: continue load after secondary indexes created with 50 inserts per transaction. Graphs for performance per 1-second interval are here.
Average throughput:
Insert response time histogram: each cell has the percentage of responses that take <= the time in the header and max is the max response time in seconds. For the max column values in the top 25% of the range have a red background and in the bottom 25% of the range have a green background. The red background is not used when the min value is within 80% of the max value.
| dbms | 256us | 1ms | 4ms | 16ms | 64ms | 256ms | 1s | 4s | 16s | gt | max |
|---|---|---|---|---|---|---|---|---|---|---|---|
| ma101107_rel.cz11a_bee | 44.888 | 55.041 | 0.070 | 0.002 | 1.386 | ||||||
| ma101107_rel.cz11apur1_bee | 1.041 | 49.951 | 48.987 | 0.019 | 0.002 | 1.416 | |||||
| ma101107_rel.cz11b_bee | 9.853 | 87.127 | 2.670 | 0.277 | 0.073 | 9.085 | |||||
| ma101107_rel.cz11c_bee | 2.515 | 47.437 | 48.904 | 1.025 | 0.080 | 0.040 | 47.518 |
Delete response time histogram: each cell has the percentage of responses that take <= the time in the header and max is the max response time in seconds. For the max column values in the top 25% of the range have a red background and in the bottom 25% of the range have a green background. The red background is not used when the min value is within 80% of the max value.
| dbms | 256us | 1ms | 4ms | 16ms | 64ms | 256ms | 1s | 4s | 16s | gt | max |
|---|---|---|---|---|---|---|---|---|---|---|---|
| ma101107_rel.cz11a_bee | 2.588 | 58.441 | 38.951 | 0.019 | 0.002 | 1.287 | |||||
| ma101107_rel.cz11apur1_bee | 15.955 | 49.457 | 34.583 | 0.003 | 0.002 | 1.267 | |||||
| ma101107_rel.cz11b_bee | 0.135 | 24.873 | 73.934 | 0.848 | 0.210 | 3.809 | |||||
| ma101107_rel.cz11c_bee | 0.253 | 6.862 | 86.063 | 6.408 | 0.347 | 0.064 | 0.003 | 17.534 |
Performance metrics for the DBMS listed above. Some are normalized by throughput, others are not. Legend for results is here.
ips	qps	rps	rmbps	wps	wmbps	rpq	rkbpq	wpi	wkbpi	csps	cpups	cspq	cpupq	dbgb1	dbgb2	rss	maxop	p50	p99	tag
2502	0	15562	241.3	14252.9	421.9	6.220	98.762	5.697	172.667	134681	24.7	53.832	790	144.5	160.3	10.1	1.386	649	400	ma101107_rel.cz11a_bee
2957	0	14941	231.7	15204.7	443.8	5.052	80.222	5.141	153.659	127338	21.4	43.057	579	163.7	180.0	10.2	1.416	750	447	ma101107_rel.cz11apur1_bee
1490	0	9220	143.0	8326.5	238.7	6.187	98.281	5.588	164.010	87527	15.8	58.739	848	144.5	160.3	10.1	9.085	350	0	ma101107_rel.cz11b_bee
622	0	3781	64.4	3239.5	99.8	6.076	105.938	5.206	164.231	68882	15.8	110.690	2031	144.5	160.3	10.1	47.518	150	0	ma101107_rel.cz11c_bee
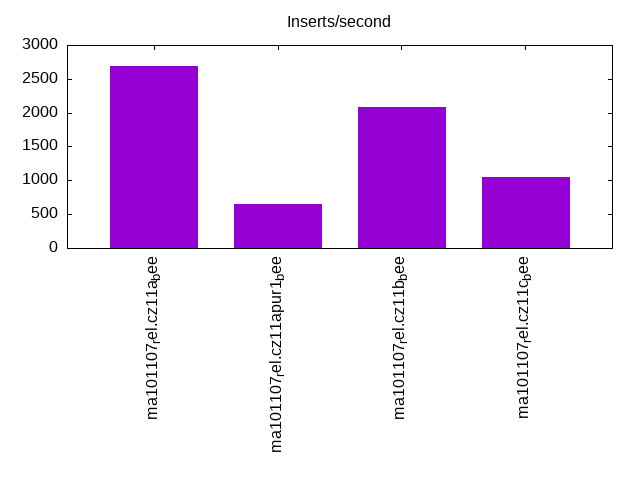
l.i2
l.i2: continue load after secondary indexes created with 5 inserts per transaction. Graphs for performance per 1-second interval are here.
Average throughput:
Insert response time histogram: each cell has the percentage of responses that take <= the time in the header and max is the max response time in seconds. For the max column values in the top 25% of the range have a red background and in the bottom 25% of the range have a green background. The red background is not used when the min value is within 80% of the max value.
| dbms | 256us | 1ms | 4ms | 16ms | 64ms | 256ms | 1s | 4s | 16s | gt | max |
|---|---|---|---|---|---|---|---|---|---|---|---|
| ma101107_rel.cz11a_bee | nonzero | 69.375 | 25.656 | 1.358 | 3.610 | 0.132 | |||||
| ma101107_rel.cz11apur1_bee | 0.001 | 37.368 | 12.769 | 40.996 | 8.866 | 0.171 | |||||
| ma101107_rel.cz11b_bee | 21.428 | 64.342 | 13.427 | 0.693 | 0.108 | 0.002 | 1.281 | ||||
| ma101107_rel.cz11c_bee | 10.473 | 34.902 | 53.682 | 0.767 | 0.143 | 0.033 | 3.401 |
Delete response time histogram: each cell has the percentage of responses that take <= the time in the header and max is the max response time in seconds. For the max column values in the top 25% of the range have a red background and in the bottom 25% of the range have a green background. The red background is not used when the min value is within 80% of the max value.
| dbms | 256us | 1ms | 4ms | 16ms | 64ms | 256ms | 1s | 4s | 16s | gt | max |
|---|---|---|---|---|---|---|---|---|---|---|---|
| ma101107_rel.cz11a_bee | 0.006 | 75.755 | 20.374 | 0.539 | 3.326 | 0.127 | |||||
| ma101107_rel.cz11apur1_bee | 0.002 | 37.787 | 12.389 | 41.062 | 8.759 | 0.166 | |||||
| ma101107_rel.cz11b_bee | 0.002 | 34.326 | 54.540 | 10.421 | 0.656 | 0.056 | 0.779 | ||||
| ma101107_rel.cz11c_bee | 28.248 | 31.184 | 39.884 | 0.574 | 0.106 | 0.004 | 3.384 |
Performance metrics for the DBMS listed above. Some are normalized by throughput, others are not. Legend for results is here.
ips	qps	rps	rmbps	wps	wmbps	rpq	rkbpq	wpi	wkbpi	csps	cpups	cspq	cpupq	dbgb1	dbgb2	rss	maxop	p50	p99	tag
2689	0	15918	238.9	13076.0	394.0	5.920	90.965	4.863	150.021	133310	31.1	49.576	925	144.5	160.3	10.1	0.132	679	594	ma101107_rel.cz11a_bee
657	0	7957	122.8	5233.8	158.7	12.115	191.455	7.969	247.399	57963	12.2	88.251	1486	164.3	180.8	10.2	0.171	90	65	ma101107_rel.cz11apur1_bee
2086	0	12258	183.9	9860.4	286.3	5.876	90.264	4.727	140.528	109286	25.0	52.390	959	144.5	160.3	10.1	1.281	544	10	ma101107_rel.cz11b_bee
1053	0	6044	92.5	4915.9	143.9	5.742	89.954	4.670	139.986	88801	23.3	84.363	1771	144.5	160.3	10.0	3.401	270	5	ma101107_rel.cz11c_bee
qr100.L1
qr100.L1: range queries with 100 insert/s per client. Graphs for performance per 1-second interval are here.
Average throughput:
Query response time histogram: each cell has the percentage of responses that take <= the time in the header and max is the max response time in seconds. For max values in the top 25% of the range have a red background and in the bottom 25% of the range have a green background. The red background is not used when the min value is within 80% of the max value.
| dbms | 256us | 1ms | 4ms | 16ms | 64ms | 256ms | 1s | 4s | 16s | gt | max |
|---|---|---|---|---|---|---|---|---|---|---|---|
| ma101107_rel.cz11a_bee | 62.685 | 36.995 | 0.285 | 0.028 | 0.007 | 0.047 | |||||
| ma101107_rel.cz11apur1_bee | 64.006 | 33.860 | 1.956 | 0.109 | 0.069 | nonzero | 0.068 | ||||
| ma101107_rel.cz11b_bee | 62.511 | 37.177 | 0.273 | 0.033 | 0.006 | 0.054 | |||||
| ma101107_rel.cz11c_bee | 67.452 | 32.246 | 0.262 | 0.031 | 0.008 | nonzero | 0.090 |
Insert response time histogram: each cell has the percentage of responses that take <= the time in the header and max is the max response time in seconds. For max values in the top 25% of the range have a red background and in the bottom 25% of the range have a green background. The red background is not used when the min value is within 80% of the max value.
| dbms | 256us | 1ms | 4ms | 16ms | 64ms | 256ms | 1s | 4s | 16s | gt | max |
|---|---|---|---|---|---|---|---|---|---|---|---|
| ma101107_rel.cz11a_bee | 1.882 | 92.069 | 6.049 | 0.100 | |||||||
| ma101107_rel.cz11apur1_bee | 25.000 | 6.583 | 68.417 | 0.581 | |||||||
| ma101107_rel.cz11b_bee | 1.750 | 90.250 | 8.000 | 0.095 | |||||||
| ma101107_rel.cz11c_bee | 0.056 | 85.528 | 14.417 | 0.168 |
Delete response time histogram: each cell has the percentage of responses that take <= the time in the header and max is the max response time in seconds. For max values in the top 25% of the range have a red background and in the bottom 25% of the range have a green background. The red background is not used when the min value is within 80% of the max value.
| dbms | 256us | 1ms | 4ms | 16ms | 64ms | 256ms | 1s | 4s | 16s | gt | max |
|---|---|---|---|---|---|---|---|---|---|---|---|
| ma101107_rel.cz11a_bee | 37.271 | 61.243 | 1.486 | 0.089 | |||||||
| ma101107_rel.cz11apur1_bee | 0.771 | 27.660 | 3.153 | 68.417 | 0.564 | ||||||
| ma101107_rel.cz11b_bee | 34.931 | 63.056 | 2.014 | 0.084 | |||||||
| ma101107_rel.cz11c_bee | 22.965 | 72.312 | 4.722 | 0.121 |
Performance metrics for the DBMS listed above. Some are normalized by throughput, others are not. Legend for results is here.
ips	qps	rps	rmbps	wps	wmbps	rpq	rkbpq	wpi	wkbpi	csps	cpups	cspq	cpupq	dbgb1	dbgb2	rss	maxop	p50	p99	tag
399	14863	2538	39.4	1920.9	57.9	0.171	2.717	4.817	148.600	71856	51.3	4.835	276	144.5	160.3	10.1	0.047	3756	2094	ma101107_rel.cz11a_bee
396	12737	8404	131.1	5302.9	160.8	0.660	10.537	13.391	415.738	99799	50.4	7.836	317	164.3	180.8	10.2	0.068	3260	1678	ma101107_rel.cz11apur1_bee
399	14856	2539	39.5	2007.2	57.9	0.171	2.720	5.033	148.594	72166	51.2	4.858	276	144.5	160.3	10.1	0.054	3740	2030	ma101107_rel.cz11b_bee
399	15327	2458	40.3	1982.0	57.8	0.160	2.690	4.970	148.356	72756	52.3	4.747	273	144.5	160.3	10.0	0.090	3900	1854	ma101107_rel.cz11c_bee
qp100.L2
qp100.L2: point queries with 100 insert/s per client. Graphs for performance per 1-second interval are here.
Average throughput:
Query response time histogram: each cell has the percentage of responses that take <= the time in the header and max is the max response time in seconds. For max values in the top 25% of the range have a red background and in the bottom 25% of the range have a green background. The red background is not used when the min value is within 80% of the max value.
| dbms | 256us | 1ms | 4ms | 16ms | 64ms | 256ms | 1s | 4s | 16s | gt | max |
|---|---|---|---|---|---|---|---|---|---|---|---|
| ma101107_rel.cz11a_bee | 0.519 | 96.872 | 2.328 | 0.280 | 0.050 | ||||||
| ma101107_rel.cz11apur1_bee | 0.351 | 95.361 | 3.035 | 1.253 | nonzero | 0.071 | |||||
| ma101107_rel.cz11b_bee | 0.488 | 96.300 | 2.661 | 0.550 | nonzero | 0.215 | |||||
| ma101107_rel.cz11c_bee | 0.041 | 87.484 | 10.818 | 1.647 | 0.009 | 0.002 | 0.672 |
Insert response time histogram: each cell has the percentage of responses that take <= the time in the header and max is the max response time in seconds. For max values in the top 25% of the range have a red background and in the bottom 25% of the range have a green background. The red background is not used when the min value is within 80% of the max value.
| dbms | 256us | 1ms | 4ms | 16ms | 64ms | 256ms | 1s | 4s | 16s | gt | max |
|---|---|---|---|---|---|---|---|---|---|---|---|
| ma101107_rel.cz11a_bee | 0.069 | 99.806 | 0.125 | 0.092 | |||||||
| ma101107_rel.cz11apur1_bee | 83.951 | 16.049 | 0.154 | ||||||||
| ma101107_rel.cz11b_bee | 0.118 | 99.771 | 0.111 | 0.096 | |||||||
| ma101107_rel.cz11c_bee | 68.431 | 31.424 | 0.146 | 0.700 |
Delete response time histogram: each cell has the percentage of responses that take <= the time in the header and max is the max response time in seconds. For max values in the top 25% of the range have a red background and in the bottom 25% of the range have a green background. The red background is not used when the min value is within 80% of the max value.
| dbms | 256us | 1ms | 4ms | 16ms | 64ms | 256ms | 1s | 4s | 16s | gt | max |
|---|---|---|---|---|---|---|---|---|---|---|---|
| ma101107_rel.cz11a_bee | 12.993 | 86.972 | 0.035 | 0.071 | |||||||
| ma101107_rel.cz11apur1_bee | 0.056 | 96.646 | 3.299 | 0.102 | |||||||
| ma101107_rel.cz11b_bee | 15.563 | 84.403 | 0.035 | 0.084 | |||||||
| ma101107_rel.cz11c_bee | 1.715 | 86.979 | 11.188 | 0.118 | 0.674 |
Performance metrics for the DBMS listed above. Some are normalized by throughput, others are not. Legend for results is here.
ips	qps	rps	rmbps	wps	wmbps	rpq	rkbpq	wpi	wkbpi	csps	cpups	cspq	cpupq	dbgb1	dbgb2	rss	maxop	p50	p99	tag
399	2193	21306	332.7	2221.8	66.6	9.715	155.342	5.571	170.971	65904	17.9	30.052	653	144.5	160.3	10.1	0.050	544	495	ma101107_rel.cz11a_bee
399	1953	21486	335.4	3644.3	109.3	11.002	175.876	9.138	280.716	76072	18.8	38.952	770	164.3	180.8	10.2	0.071	527	384	ma101107_rel.cz11apur1_bee
399	2088	20431	319.0	2329.7	66.8	9.788	156.491	5.842	171.625	63946	17.5	30.633	671	144.5	160.3	10.1	0.215	527	463	ma101107_rel.cz11b_bee
399	1311	13897	219.2	2252.8	64.9	10.602	171.226	5.649	166.629	58600	20.5	44.706	1251	144.5	160.3	9.4	0.672	336	224	ma101107_rel.cz11c_bee
qr500.L3
qr500.L3: range queries with 500 insert/s per client. Graphs for performance per 1-second interval are here.
Average throughput:
Query response time histogram: each cell has the percentage of responses that take <= the time in the header and max is the max response time in seconds. For max values in the top 25% of the range have a red background and in the bottom 25% of the range have a green background. The red background is not used when the min value is within 80% of the max value.
| dbms | 256us | 1ms | 4ms | 16ms | 64ms | 256ms | 1s | 4s | 16s | gt | max |
|---|---|---|---|---|---|---|---|---|---|---|---|
| ma101107_rel.cz11a_bee | 37.070 | 51.781 | 9.595 | 1.160 | 0.393 | 0.001 | 0.087 | ||||
| ma101107_rel.cz11apur1_bee | 35.172 | 54.230 | 8.944 | 1.269 | 0.381 | 0.004 | 0.092 | ||||
| ma101107_rel.cz11b_bee | 38.269 | 49.841 | 10.125 | 1.532 | 0.223 | 0.008 | 0.001 | 0.514 | |||
| ma101107_rel.cz11c_bee | 12.989 | 63.694 | 11.920 | 3.421 | 7.323 | 0.645 | 0.005 | 0.002 | 1.470 |
Insert response time histogram: each cell has the percentage of responses that take <= the time in the header and max is the max response time in seconds. For max values in the top 25% of the range have a red background and in the bottom 25% of the range have a green background. The red background is not used when the min value is within 80% of the max value.
| dbms | 256us | 1ms | 4ms | 16ms | 64ms | 256ms | 1s | 4s | 16s | gt | max |
|---|---|---|---|---|---|---|---|---|---|---|---|
| ma101107_rel.cz11a_bee | 0.015 | 55.196 | 44.788 | 0.001 | 0.257 | ||||||
| ma101107_rel.cz11apur1_bee | 0.021 | 52.854 | 47.119 | 0.006 | 0.281 | ||||||
| ma101107_rel.cz11b_bee | 0.011 | 69.158 | 29.847 | 0.983 | 0.611 | ||||||
| ma101107_rel.cz11c_bee | 21.185 | 51.332 | 26.479 | 1.004 | 1.591 |
Delete response time histogram: each cell has the percentage of responses that take <= the time in the header and max is the max response time in seconds. For max values in the top 25% of the range have a red background and in the bottom 25% of the range have a green background. The red background is not used when the min value is within 80% of the max value.
| dbms | 256us | 1ms | 4ms | 16ms | 64ms | 256ms | 1s | 4s | 16s | gt | max |
|---|---|---|---|---|---|---|---|---|---|---|---|
| ma101107_rel.cz11a_bee | 3.321 | 63.836 | 32.843 | 0.226 | |||||||
| ma101107_rel.cz11apur1_bee | 1.522 | 60.307 | 38.169 | 0.001 | 0.258 | ||||||
| ma101107_rel.cz11b_bee | 0.850 | 81.642 | 16.910 | 0.599 | 0.580 | ||||||
| ma101107_rel.cz11c_bee | 0.014 | 29.539 | 47.056 | 23.212 | 0.179 | 1.527 |
Performance metrics for the DBMS listed above. Some are normalized by throughput, others are not. Legend for results is here.
ips	qps	rps	rmbps	wps	wmbps	rpq	rkbpq	wpi	wkbpi	csps	cpups	cspq	cpupq	dbgb1	dbgb2	rss	maxop	p50	p99	tag
1994	5644	15767	245.2	9449.5	284.2	2.793	44.488	4.738	145.928	114781	38.5	20.335	546	144.5	160.3	10.1	0.087	1422	1039	ma101107_rel.cz11a_bee
1994	5596	15322	238.3	10653.4	318.1	2.738	43.602	5.342	163.310	114781	38.2	20.510	546	164.3	180.8	10.2	0.092	1422	991	ma101107_rel.cz11apur1_bee
1994	5908	15233	236.9	9831.4	284.5	2.578	41.059	4.930	146.056	118435	38.4	20.046	520	144.5	160.3	10.1	0.514	1598	576	ma101107_rel.cz11b_bee
800	1106	6145	99.9	4405.5	126.8	5.556	92.523	5.505	162.253	79061	22.8	71.483	1649	146.3	162.2	9.4	1.470	224	80	ma101107_rel.cz11c_bee
qp500.L4
qp500.L4: point queries with 500 insert/s per client. Graphs for performance per 1-second interval are here.
Average throughput:
Query response time histogram: each cell has the percentage of responses that take <= the time in the header and max is the max response time in seconds. For max values in the top 25% of the range have a red background and in the bottom 25% of the range have a green background. The red background is not used when the min value is within 80% of the max value.
| dbms | 256us | 1ms | 4ms | 16ms | 64ms | 256ms | 1s | 4s | 16s | gt | max |
|---|---|---|---|---|---|---|---|---|---|---|---|
| ma101107_rel.cz11a_bee | 0.010 | 86.282 | 10.918 | 2.788 | 0.002 | 0.090 | |||||
| ma101107_rel.cz11apur1_bee | 0.017 | 85.675 | 11.607 | 2.699 | 0.002 | 0.089 | |||||
| ma101107_rel.cz11b_bee | 0.004 | 78.869 | 20.047 | 1.060 | 0.016 | 0.004 | 0.507 | ||||
| ma101107_rel.cz11c_bee | 46.218 | 10.863 | 36.686 | 5.898 | 0.327 | 0.008 | 1.425 |
Insert response time histogram: each cell has the percentage of responses that take <= the time in the header and max is the max response time in seconds. For max values in the top 25% of the range have a red background and in the bottom 25% of the range have a green background. The red background is not used when the min value is within 80% of the max value.
| dbms | 256us | 1ms | 4ms | 16ms | 64ms | 256ms | 1s | 4s | 16s | gt | max |
|---|---|---|---|---|---|---|---|---|---|---|---|
| ma101107_rel.cz11a_bee | 0.004 | 49.246 | 50.750 | 0.223 | |||||||
| ma101107_rel.cz11apur1_bee | 0.112 | 53.447 | 46.440 | 0.223 | |||||||
| ma101107_rel.cz11b_bee | 76.075 | 23.721 | 0.204 | 0.601 | |||||||
| ma101107_rel.cz11c_bee | 21.868 | 36.425 | 39.358 | 2.349 | 2.165 |
Delete response time histogram: each cell has the percentage of responses that take <= the time in the header and max is the max response time in seconds. For max values in the top 25% of the range have a red background and in the bottom 25% of the range have a green background. The red background is not used when the min value is within 80% of the max value.
| dbms | 256us | 1ms | 4ms | 16ms | 64ms | 256ms | 1s | 4s | 16s | gt | max |
|---|---|---|---|---|---|---|---|---|---|---|---|
| ma101107_rel.cz11a_bee | 0.700 | 61.590 | 37.710 | 0.167 | |||||||
| ma101107_rel.cz11apur1_bee | 0.790 | 63.324 | 35.886 | 0.200 | |||||||
| ma101107_rel.cz11b_bee | 0.189 | 82.837 | 16.808 | 0.165 | 0.567 | ||||||
| ma101107_rel.cz11c_bee | 0.006 | 28.768 | 37.465 | 32.826 | 0.935 | 1.683 |
Performance metrics for the DBMS listed above. Some are normalized by throughput, others are not. Legend for results is here.
ips	qps	rps	rmbps	wps	wmbps	rpq	rkbpq	wpi	wkbpi	csps	cpups	cspq	cpupq	dbgb1	dbgb2	rss	maxop	p50	p99	tag
1994	1106	22059	343.6	9336.8	280.7	19.952	318.207	4.682	144.111	114273	25.5	103.359	1845	144.5	160.3	10.1	0.090	272	224	ma101107_rel.cz11a_bee
1994	1120	21727	338.5	10210.5	305.2	19.407	309.583	5.120	156.718	111089	23.3	99.231	1665	164.3	180.8	10.2	0.089	288	240	ma101107_rel.cz11apur1_bee
1994	1144	22383	348.7	9627.8	278.3	19.566	312.083	4.827	142.915	117493	23.5	102.704	1643	144.5	160.3	10.1	0.507	288	160	ma101107_rel.cz11b_bee
731	188	6048	95.3	4021.7	115.1	32.101	517.957	5.503	161.326	85624	20.5	454.482	8705	150.5	166.6	8.8	1.425	32	0	ma101107_rel.cz11c_bee
qr1000.L5
qr1000.L5: range queries with 1000 insert/s per client. Graphs for performance per 1-second interval are here.
Average throughput:
Query response time histogram: each cell has the percentage of responses that take <= the time in the header and max is the max response time in seconds. For max values in the top 25% of the range have a red background and in the bottom 25% of the range have a green background. The red background is not used when the min value is within 80% of the max value.
| dbms | 256us | 1ms | 4ms | 16ms | 64ms | 256ms | 1s | 4s | 16s | gt | max |
|---|---|---|---|---|---|---|---|---|---|---|---|
| ma101107_rel.cz11a_bee | 13.400 | 61.690 | 19.955 | 3.963 | 0.949 | 0.042 | 0.099 | ||||
| ma101107_rel.cz11apur1_bee | 13.104 | 62.121 | 18.521 | 5.138 | 0.809 | 0.307 | 0.139 | ||||
| ma101107_rel.cz11b_bee | 21.654 | 55.800 | 16.090 | 5.766 | 0.642 | 0.044 | 0.004 | nonzero | 2.747 | ||
| ma101107_rel.cz11c_bee | 8.166 | 66.409 | 13.634 | 1.835 | 8.565 | 1.384 | 0.004 | 0.004 | 1.548 |
Insert response time histogram: each cell has the percentage of responses that take <= the time in the header and max is the max response time in seconds. For max values in the top 25% of the range have a red background and in the bottom 25% of the range have a green background. The red background is not used when the min value is within 80% of the max value.
| dbms | 256us | 1ms | 4ms | 16ms | 64ms | 256ms | 1s | 4s | 16s | gt | max |
|---|---|---|---|---|---|---|---|---|---|---|---|
| ma101107_rel.cz11a_bee | 0.012 | 45.811 | 54.177 | 0.246 | |||||||
| ma101107_rel.cz11apur1_bee | 0.720 | 51.555 | 47.702 | 0.023 | 0.327 | ||||||
| ma101107_rel.cz11b_bee | 0.008 | 24.366 | 75.551 | 0.052 | 0.002 | 0.020 | 11.301 | ||||
| ma101107_rel.cz11c_bee | 29.706 | 34.601 | 32.726 | 2.967 | 2.568 |
Delete response time histogram: each cell has the percentage of responses that take <= the time in the header and max is the max response time in seconds. For max values in the top 25% of the range have a red background and in the bottom 25% of the range have a green background. The red background is not used when the min value is within 80% of the max value.
| dbms | 256us | 1ms | 4ms | 16ms | 64ms | 256ms | 1s | 4s | 16s | gt | max |
|---|---|---|---|---|---|---|---|---|---|---|---|
| ma101107_rel.cz11a_bee | 1.751 | 53.507 | 44.742 | 0.229 | |||||||
| ma101107_rel.cz11apur1_bee | 5.083 | 53.103 | 41.796 | 0.018 | 0.320 | ||||||
| ma101107_rel.cz11b_bee | 0.043 | 47.851 | 52.051 | 0.035 | 0.003 | 0.017 | 10.270 | ||||
| ma101107_rel.cz11c_bee | 0.012 | 37.727 | 29.457 | 32.245 | 0.559 | 1.952 |
Performance metrics for the DBMS listed above. Some are normalized by throughput, others are not. Legend for results is here.
ips	qps	rps	rmbps	wps	wmbps	rpq	rkbpq	wpi	wkbpi	csps	cpups	cspq	cpupq	dbgb1	dbgb2	rss	maxop	p50	p99	tag
2808	2660	19522	303.4	12444.7	374.3	7.340	116.813	4.432	136.503	134903	35.6	50.719	1071	144.5	160.3	10.1	0.099	671	575	ma101107_rel.cz11a_bee
3517	2371	19458	302.5	14927.1	445.8	8.207	130.674	4.244	129.777	132449	34.0	55.867	1147	164.3	181.3	10.2	0.139	592	448	ma101107_rel.cz11apur1_bee
2351	3099	16347	254.1	10534.5	305.1	5.274	83.966	4.482	132.912	122571	32.5	39.548	839	144.5	160.3	10.1	2.747	784	16	ma101107_rel.cz11b_bee
722	807	5275	84.8	3889.3	111.6	6.534	107.503	5.383	158.200	69111	19.7	85.597	1952	157.8	174.4	8.7	1.548	144	48	ma101107_rel.cz11c_bee
qp1000.L6
qp1000.L6: point queries with 1000 insert/s per client. Graphs for performance per 1-second interval are here.
Average throughput:
Query response time histogram: each cell has the percentage of responses that take <= the time in the header and max is the max response time in seconds. For max values in the top 25% of the range have a red background and in the bottom 25% of the range have a green background. The red background is not used when the min value is within 80% of the max value.
| dbms | 256us | 1ms | 4ms | 16ms | 64ms | 256ms | 1s | 4s | 16s | gt | max |
|---|---|---|---|---|---|---|---|---|---|---|---|
| ma101107_rel.cz11a_bee | 74.208 | 21.697 | 3.918 | 0.177 | 0.115 | ||||||
| ma101107_rel.cz11apur1_bee | 0.171 | 92.311 | 5.345 | 2.157 | 0.016 | 0.118 | |||||
| ma101107_rel.cz11b_bee | 46.964 | 49.054 | 3.623 | 0.332 | 0.026 | 0.001 | 1.404 | ||||
| ma101107_rel.cz11c_bee | 47.648 | 10.445 | 35.507 | 6.123 | 0.270 | 0.007 | 1.446 |
Insert response time histogram: each cell has the percentage of responses that take <= the time in the header and max is the max response time in seconds. For max values in the top 25% of the range have a red background and in the bottom 25% of the range have a green background. The red background is not used when the min value is within 80% of the max value.
| dbms | 256us | 1ms | 4ms | 16ms | 64ms | 256ms | 1s | 4s | 16s | gt | max |
|---|---|---|---|---|---|---|---|---|---|---|---|
| ma101107_rel.cz11a_bee | 0.007 | 44.455 | 55.538 | 0.202 | |||||||
| ma101107_rel.cz11apur1_bee | 0.402 | 30.708 | 28.765 | 40.125 | 0.552 | ||||||
| ma101107_rel.cz11b_bee | 0.001 | 27.780 | 72.122 | 0.062 | 0.008 | 0.027 | 8.673 | ||||
| ma101107_rel.cz11c_bee | 23.923 | 35.082 | 39.447 | 1.549 | 2.611 |
Delete response time histogram: each cell has the percentage of responses that take <= the time in the header and max is the max response time in seconds. For max values in the top 25% of the range have a red background and in the bottom 25% of the range have a green background. The red background is not used when the min value is within 80% of the max value.
| dbms | 256us | 1ms | 4ms | 16ms | 64ms | 256ms | 1s | 4s | 16s | gt | max |
|---|---|---|---|---|---|---|---|---|---|---|---|
| ma101107_rel.cz11a_bee | 0.808 | 50.262 | 48.931 | 0.201 | |||||||
| ma101107_rel.cz11apur1_bee | 1.145 | 32.069 | 26.684 | 40.102 | 0.540 | ||||||
| ma101107_rel.cz11b_bee | 0.021 | 50.680 | 49.229 | 0.035 | 0.019 | 0.017 | 7.066 | ||||
| ma101107_rel.cz11c_bee | 0.001 | 27.661 | 34.285 | 37.260 | 0.792 | 2.011 |
Performance metrics for the DBMS listed above. Some are normalized by throughput, others are not. Legend for results is here.
ips	qps	rps	rmbps	wps	wmbps	rpq	rkbpq	wpi	wkbpi	csps	cpups	cspq	cpupq	dbgb1	dbgb2	rss	maxop	p50	p99	tag
2940	733	23284	362.1	12753.1	383.5	31.752	505.702	4.338	133.591	141966	30.0	193.598	3273	144.5	160.3	10.1	0.115	176	160	ma101107_rel.cz11a_bee
1141	1613	24009	374.7	6814.1	204.3	14.881	237.802	5.970	183.307	103557	21.3	64.186	1056	165.1	182.3	10.3	0.118	463	160	ma101107_rel.cz11apur1_bee
2494	661	19911	309.8	10752.2	311.4	30.127	479.946	4.311	127.853	129287	24.5	195.622	2966	144.5	160.3	10.1	1.404	176	0	ma101107_rel.cz11b_bee
767	187	6174	98.7	3935.8	113.0	33.016	540.676	5.134	150.997	82713	19.8	442.315	8471	162.6	179.7	8.7	1.446	32	0	ma101107_rel.cz11c_bee
l.i0
l.i0: load without secondary indexes
Performance metrics for all DBMS, not just the ones listed above. Some are normalized by throughput, others are not. Legend for results is here.
ips	qps	rps	rmbps	wps	wmbps	rpq	rkbpq	wpi	wkbpi	csps	cpups	cspq	cpupq	dbgb1	dbgb2	rss	maxop	p50	p99	tag
256410	0	1757	6.9	1275.2	74.8	0.007	0.027	0.005	0.299	36433	78.8	0.142	25	52.6	68.5	10.3	0.179	64630	54241	ma101107_rel.cz11a_bee
265252	0	1756	6.9	1334.3	77.4	0.007	0.027	0.005	0.299	35639	79.7	0.134	24	52.6	68.5	10.3	0.190	66628	55540	ma101107_rel.cz11apur1_bee
251177	0	1719	6.7	1270.9	73.3	0.007	0.027	0.005	0.299	36015	77.2	0.143	25	52.6	68.5	10.3	15.355	64430	49946	ma101107_rel.cz11b_bee
237600	0	1623	6.3	256.3	69.3	0.007	0.027	0.001	0.299	33659	73.1	0.142	25	52.6	68.5	10.3	31.783	64429	0	ma101107_rel.cz11c_bee
l.x
l.x: create secondary indexes
Performance metrics for all DBMS, not just the ones listed above. Some are normalized by throughput, others are not. Legend for results is here.
ips	qps	rps	rmbps	wps	wmbps	rpq	rkbpq	wpi	wkbpi	csps	cpups	cspq	cpupq	dbgb1	dbgb2	rss	maxop	p50	p99	tag
316206	0	2056	281.3	2193.8	314.4	0.007	0.911	0.007	1.018	12215	41.0	0.039	10	119.9	135.8	10.4	0.003	NA	NA	ma101107_rel.cz11a_bee
321027	0	2043	285.3	2200.7	319.1	0.006	0.910	0.007	1.018	11985	41.5	0.037	10	119.9	135.8	10.4	0.005	NA	NA	ma101107_rel.cz11apur1_bee
303030	0	2038	271.0	2128.4	302.0	0.007	0.916	0.007	1.021	12659	40.3	0.042	11	119.9	135.8	10.4	0.003	NA	NA	ma101107_rel.cz11b_bee
315333	0	956	279.7	872.1	313.6	0.003	0.908	0.003	1.018	10263	42.0	0.033	11	119.9	135.8	10.4	0.009	NA	NA	ma101107_rel.cz11c_bee
l.i1
l.i1: continue load after secondary indexes created with 50 inserts per transaction
Performance metrics for all DBMS, not just the ones listed above. Some are normalized by throughput, others are not. Legend for results is here.
ips	qps	rps	rmbps	wps	wmbps	rpq	rkbpq	wpi	wkbpi	csps	cpups	cspq	cpupq	dbgb1	dbgb2	rss	maxop	p50	p99	tag
2502	0	15562	241.3	14252.9	421.9	6.220	98.762	5.697	172.667	134681	24.7	53.832	790	144.5	160.3	10.1	1.386	649	400	ma101107_rel.cz11a_bee
2957	0	14941	231.7	15204.7	443.8	5.052	80.222	5.141	153.659	127338	21.4	43.057	579	163.7	180.0	10.2	1.416	750	447	ma101107_rel.cz11apur1_bee
1490	0	9220	143.0	8326.5	238.7	6.187	98.281	5.588	164.010	87527	15.8	58.739	848	144.5	160.3	10.1	9.085	350	0	ma101107_rel.cz11b_bee
622	0	3781	64.4	3239.5	99.8	6.076	105.938	5.206	164.231	68882	15.8	110.690	2031	144.5	160.3	10.1	47.518	150	0	ma101107_rel.cz11c_bee
l.i2
l.i2: continue load after secondary indexes created with 5 inserts per transaction
Performance metrics for all DBMS, not just the ones listed above. Some are normalized by throughput, others are not. Legend for results is here.
ips	qps	rps	rmbps	wps	wmbps	rpq	rkbpq	wpi	wkbpi	csps	cpups	cspq	cpupq	dbgb1	dbgb2	rss	maxop	p50	p99	tag
2689	0	15918	238.9	13076.0	394.0	5.920	90.965	4.863	150.021	133310	31.1	49.576	925	144.5	160.3	10.1	0.132	679	594	ma101107_rel.cz11a_bee
657	0	7957	122.8	5233.8	158.7	12.115	191.455	7.969	247.399	57963	12.2	88.251	1486	164.3	180.8	10.2	0.171	90	65	ma101107_rel.cz11apur1_bee
2086	0	12258	183.9	9860.4	286.3	5.876	90.264	4.727	140.528	109286	25.0	52.390	959	144.5	160.3	10.1	1.281	544	10	ma101107_rel.cz11b_bee
1053	0	6044	92.5	4915.9	143.9	5.742	89.954	4.670	139.986	88801	23.3	84.363	1771	144.5	160.3	10.0	3.401	270	5	ma101107_rel.cz11c_bee
qr100.L1
qr100.L1: range queries with 100 insert/s per client
Performance metrics for all DBMS, not just the ones listed above. Some are normalized by throughput, others are not. Legend for results is here.
ips	qps	rps	rmbps	wps	wmbps	rpq	rkbpq	wpi	wkbpi	csps	cpups	cspq	cpupq	dbgb1	dbgb2	rss	maxop	p50	p99	tag
399	14863	2538	39.4	1920.9	57.9	0.171	2.717	4.817	148.600	71856	51.3	4.835	276	144.5	160.3	10.1	0.047	3756	2094	ma101107_rel.cz11a_bee
396	12737	8404	131.1	5302.9	160.8	0.660	10.537	13.391	415.738	99799	50.4	7.836	317	164.3	180.8	10.2	0.068	3260	1678	ma101107_rel.cz11apur1_bee
399	14856	2539	39.5	2007.2	57.9	0.171	2.720	5.033	148.594	72166	51.2	4.858	276	144.5	160.3	10.1	0.054	3740	2030	ma101107_rel.cz11b_bee
399	15327	2458	40.3	1982.0	57.8	0.160	2.690	4.970	148.356	72756	52.3	4.747	273	144.5	160.3	10.0	0.090	3900	1854	ma101107_rel.cz11c_bee
qp100.L2
qp100.L2: point queries with 100 insert/s per client
Performance metrics for all DBMS, not just the ones listed above. Some are normalized by throughput, others are not. Legend for results is here.
ips	qps	rps	rmbps	wps	wmbps	rpq	rkbpq	wpi	wkbpi	csps	cpups	cspq	cpupq	dbgb1	dbgb2	rss	maxop	p50	p99	tag
399	2193	21306	332.7	2221.8	66.6	9.715	155.342	5.571	170.971	65904	17.9	30.052	653	144.5	160.3	10.1	0.050	544	495	ma101107_rel.cz11a_bee
399	1953	21486	335.4	3644.3	109.3	11.002	175.876	9.138	280.716	76072	18.8	38.952	770	164.3	180.8	10.2	0.071	527	384	ma101107_rel.cz11apur1_bee
399	2088	20431	319.0	2329.7	66.8	9.788	156.491	5.842	171.625	63946	17.5	30.633	671	144.5	160.3	10.1	0.215	527	463	ma101107_rel.cz11b_bee
399	1311	13897	219.2	2252.8	64.9	10.602	171.226	5.649	166.629	58600	20.5	44.706	1251	144.5	160.3	9.4	0.672	336	224	ma101107_rel.cz11c_bee
qr500.L3
qr500.L3: range queries with 500 insert/s per client
Performance metrics for all DBMS, not just the ones listed above. Some are normalized by throughput, others are not. Legend for results is here.
ips	qps	rps	rmbps	wps	wmbps	rpq	rkbpq	wpi	wkbpi	csps	cpups	cspq	cpupq	dbgb1	dbgb2	rss	maxop	p50	p99	tag
1994	5644	15767	245.2	9449.5	284.2	2.793	44.488	4.738	145.928	114781	38.5	20.335	546	144.5	160.3	10.1	0.087	1422	1039	ma101107_rel.cz11a_bee
1994	5596	15322	238.3	10653.4	318.1	2.738	43.602	5.342	163.310	114781	38.2	20.510	546	164.3	180.8	10.2	0.092	1422	991	ma101107_rel.cz11apur1_bee
1994	5908	15233	236.9	9831.4	284.5	2.578	41.059	4.930	146.056	118435	38.4	20.046	520	144.5	160.3	10.1	0.514	1598	576	ma101107_rel.cz11b_bee
800	1106	6145	99.9	4405.5	126.8	5.556	92.523	5.505	162.253	79061	22.8	71.483	1649	146.3	162.2	9.4	1.470	224	80	ma101107_rel.cz11c_bee
qp500.L4
qp500.L4: point queries with 500 insert/s per client
Performance metrics for all DBMS, not just the ones listed above. Some are normalized by throughput, others are not. Legend for results is here.
ips	qps	rps	rmbps	wps	wmbps	rpq	rkbpq	wpi	wkbpi	csps	cpups	cspq	cpupq	dbgb1	dbgb2	rss	maxop	p50	p99	tag
1994	1106	22059	343.6	9336.8	280.7	19.952	318.207	4.682	144.111	114273	25.5	103.359	1845	144.5	160.3	10.1	0.090	272	224	ma101107_rel.cz11a_bee
1994	1120	21727	338.5	10210.5	305.2	19.407	309.583	5.120	156.718	111089	23.3	99.231	1665	164.3	180.8	10.2	0.089	288	240	ma101107_rel.cz11apur1_bee
1994	1144	22383	348.7	9627.8	278.3	19.566	312.083	4.827	142.915	117493	23.5	102.704	1643	144.5	160.3	10.1	0.507	288	160	ma101107_rel.cz11b_bee
731	188	6048	95.3	4021.7	115.1	32.101	517.957	5.503	161.326	85624	20.5	454.482	8705	150.5	166.6	8.8	1.425	32	0	ma101107_rel.cz11c_bee
qr1000.L5
qr1000.L5: range queries with 1000 insert/s per client
Performance metrics for all DBMS, not just the ones listed above. Some are normalized by throughput, others are not. Legend for results is here.
ips	qps	rps	rmbps	wps	wmbps	rpq	rkbpq	wpi	wkbpi	csps	cpups	cspq	cpupq	dbgb1	dbgb2	rss	maxop	p50	p99	tag
2808	2660	19522	303.4	12444.7	374.3	7.340	116.813	4.432	136.503	134903	35.6	50.719	1071	144.5	160.3	10.1	0.099	671	575	ma101107_rel.cz11a_bee
3517	2371	19458	302.5	14927.1	445.8	8.207	130.674	4.244	129.777	132449	34.0	55.867	1147	164.3	181.3	10.2	0.139	592	448	ma101107_rel.cz11apur1_bee
2351	3099	16347	254.1	10534.5	305.1	5.274	83.966	4.482	132.912	122571	32.5	39.548	839	144.5	160.3	10.1	2.747	784	16	ma101107_rel.cz11b_bee
722	807	5275	84.8	3889.3	111.6	6.534	107.503	5.383	158.200	69111	19.7	85.597	1952	157.8	174.4	8.7	1.548	144	48	ma101107_rel.cz11c_bee
qp1000.L6
qp1000.L6: point queries with 1000 insert/s per client
Performance metrics for all DBMS, not just the ones listed above. Some are normalized by throughput, others are not. Legend for results is here.
ips	qps	rps	rmbps	wps	wmbps	rpq	rkbpq	wpi	wkbpi	csps	cpups	cspq	cpupq	dbgb1	dbgb2	rss	maxop	p50	p99	tag
2940	733	23284	362.1	12753.1	383.5	31.752	505.702	4.338	133.591	141966	30.0	193.598	3273	144.5	160.3	10.1	0.115	176	160	ma101107_rel.cz11a_bee
1141	1613	24009	374.7	6814.1	204.3	14.881	237.802	5.970	183.307	103557	21.3	64.186	1056	165.1	182.3	10.3	0.118	463	160	ma101107_rel.cz11apur1_bee
2494	661	19911	309.8	10752.2	311.4	30.127	479.946	4.311	127.853	129287	24.5	195.622	2966	144.5	160.3	10.1	1.404	176	0	ma101107_rel.cz11b_bee
767	187	6174	98.7	3935.8	113.0	33.016	540.676	5.134	150.997	82713	19.8	442.315	8471	162.6	179.7	8.7	1.446	32	0	ma101107_rel.cz11c_bee
l.i0
- l.i0: load without secondary indexes
- Legend for results is here.
- Each entry lists the percentage of responses that fit in that bucket (slower than max time for previous bucket, faster than min time for next bucket).
Insert response time histogram
256us	1ms	4ms	16ms	64ms	256ms	1s	4s	16s	gt	max	tag
0.000	0.106	97.277	2.565	0.032	0.020	0.000	0.000	0.000	0.000	0.179	ma101107_rel.cz11a_bee
0.000	0.185	98.865	0.898	0.031	0.021	0.000	0.000	0.000	0.000	0.190	ma101107_rel.cz11apur1_bee
0.000	0.161	97.208	2.555	0.056	0.020	0.000	0.000	nonzero	0.000	15.355	ma101107_rel.cz11b_bee
0.000	0.129	97.357	2.404	0.073	0.037	0.001	0.000	nonzero	nonzero	31.783	ma101107_rel.cz11c_bee
l.x
- l.x: create secondary indexes
- Legend for results is here.
- Each entry lists the percentage of responses that fit in that bucket (slower than max time for previous bucket, faster than min time for next bucket).
TODO - determine whether there is data for create index response time
l.i1
- l.i1: continue load after secondary indexes created with 50 inserts per transaction
- Legend for results is here.
- Each entry lists the percentage of responses that fit in that bucket (slower than max time for previous bucket, faster than min time for next bucket).
Insert response time histogram
256us	1ms	4ms	16ms	64ms	256ms	1s	4s	16s	gt	max	tag
0.000	0.000	0.000	0.000	44.888	55.041	0.070	0.002	0.000	0.000	1.386	ma101107_rel.cz11a_bee
0.000	0.000	0.000	1.041	49.951	48.987	0.019	0.002	0.000	0.000	1.416	ma101107_rel.cz11apur1_bee
0.000	0.000	0.000	0.000	9.853	87.127	2.670	0.277	0.073	0.000	9.085	ma101107_rel.cz11b_bee
0.000	0.000	0.000	0.000	2.515	47.437	48.904	1.025	0.080	0.040	47.518	ma101107_rel.cz11c_bee
Delete response time histogram
256us	1ms	4ms	16ms	64ms	256ms	1s	4s	16s	gt	max	tag
0.000	0.000	0.000	2.588	58.441	38.951	0.019	0.002	0.000	0.000	1.287	ma101107_rel.cz11a_bee
0.000	0.000	0.000	15.955	49.457	34.583	0.003	0.002	0.000	0.000	1.267	ma101107_rel.cz11apur1_bee
0.000	0.000	0.000	0.135	24.873	73.934	0.848	0.210	0.000	0.000	3.809	ma101107_rel.cz11b_bee
0.000	0.000	0.000	0.253	6.862	86.063	6.408	0.347	0.064	0.003	17.534	ma101107_rel.cz11c_bee
l.i2
- l.i2: continue load after secondary indexes created with 5 inserts per transaction
- Legend for results is here.
- Each entry lists the percentage of responses that fit in that bucket (slower than max time for previous bucket, faster than min time for next bucket).
Insert response time histogram
256us	1ms	4ms	16ms	64ms	256ms	1s	4s	16s	gt	max	tag
0.000	nonzero	69.375	25.656	1.358	3.610	0.000	0.000	0.000	0.000	0.132	ma101107_rel.cz11a_bee
0.000	0.001	37.368	12.769	40.996	8.866	0.000	0.000	0.000	0.000	0.171	ma101107_rel.cz11apur1_bee
0.000	0.000	21.428	64.342	13.427	0.693	0.108	0.002	0.000	0.000	1.281	ma101107_rel.cz11b_bee
0.000	0.000	10.473	34.902	53.682	0.767	0.143	0.033	0.000	0.000	3.401	ma101107_rel.cz11c_bee
Delete response time histogram
256us	1ms	4ms	16ms	64ms	256ms	1s	4s	16s	gt	max	tag
0.000	0.006	75.755	20.374	0.539	3.326	0.000	0.000	0.000	0.000	0.127	ma101107_rel.cz11a_bee
0.000	0.002	37.787	12.389	41.062	8.759	0.000	0.000	0.000	0.000	0.166	ma101107_rel.cz11apur1_bee
0.000	0.002	34.326	54.540	10.421	0.656	0.056	0.000	0.000	0.000	0.779	ma101107_rel.cz11b_bee
0.000	0.000	28.248	31.184	39.884	0.574	0.106	0.004	0.000	0.000	3.384	ma101107_rel.cz11c_bee
qr100.L1
- qr100.L1: range queries with 100 insert/s per client
- Legend for results is here.
- Each entry lists the percentage of responses that fit in that bucket (slower than max time for previous bucket, faster than min time for next bucket).
Query response time histogram
256us	1ms	4ms	16ms	64ms	256ms	1s	4s	16s	gt	max	tag
62.685	36.995	0.285	0.028	0.007	0.000	0.000	0.000	0.000	0.000	0.047	ma101107_rel.cz11a_bee
64.006	33.860	1.956	0.109	0.069	nonzero	0.000	0.000	0.000	0.000	0.068	ma101107_rel.cz11apur1_bee
62.511	37.177	0.273	0.033	0.006	0.000	0.000	0.000	0.000	0.000	0.054	ma101107_rel.cz11b_bee
67.452	32.246	0.262	0.031	0.008	nonzero	0.000	0.000	0.000	0.000	0.090	ma101107_rel.cz11c_bee
Insert response time histogram
256us	1ms	4ms	16ms	64ms	256ms	1s	4s	16s	gt	max	tag
0.000	0.000	0.000	1.882	92.069	6.049	0.000	0.000	0.000	0.000	0.100	ma101107_rel.cz11a_bee
0.000	0.000	0.000	0.000	25.000	6.583	68.417	0.000	0.000	0.000	0.581	ma101107_rel.cz11apur1_bee
0.000	0.000	0.000	1.750	90.250	8.000	0.000	0.000	0.000	0.000	0.095	ma101107_rel.cz11b_bee
0.000	0.000	0.000	0.056	85.528	14.417	0.000	0.000	0.000	0.000	0.168	ma101107_rel.cz11c_bee
Delete response time histogram
256us	1ms	4ms	16ms	64ms	256ms	1s	4s	16s	gt	max	tag
0.000	0.000	0.000	37.271	61.243	1.486	0.000	0.000	0.000	0.000	0.089	ma101107_rel.cz11a_bee
0.000	0.000	0.000	0.771	27.660	3.153	68.417	0.000	0.000	0.000	0.564	ma101107_rel.cz11apur1_bee
0.000	0.000	0.000	34.931	63.056	2.014	0.000	0.000	0.000	0.000	0.084	ma101107_rel.cz11b_bee
0.000	0.000	0.000	22.965	72.312	4.722	0.000	0.000	0.000	0.000	0.121	ma101107_rel.cz11c_bee
qp100.L2
- qp100.L2: point queries with 100 insert/s per client
- Legend for results is here.
- Each entry lists the percentage of responses that fit in that bucket (slower than max time for previous bucket, faster than min time for next bucket).
Query response time histogram
256us	1ms	4ms	16ms	64ms	256ms	1s	4s	16s	gt	max	tag
0.000	0.519	96.872	2.328	0.280	0.000	0.000	0.000	0.000	0.000	0.050	ma101107_rel.cz11a_bee
0.000	0.351	95.361	3.035	1.253	nonzero	0.000	0.000	0.000	0.000	0.071	ma101107_rel.cz11apur1_bee
0.000	0.488	96.300	2.661	0.550	nonzero	0.000	0.000	0.000	0.000	0.215	ma101107_rel.cz11b_bee
0.000	0.041	87.484	10.818	1.647	0.009	0.002	0.000	0.000	0.000	0.672	ma101107_rel.cz11c_bee
Insert response time histogram
256us	1ms	4ms	16ms	64ms	256ms	1s	4s	16s	gt	max	tag
0.000	0.000	0.000	0.069	99.806	0.125	0.000	0.000	0.000	0.000	0.092	ma101107_rel.cz11a_bee
0.000	0.000	0.000	0.000	83.951	16.049	0.000	0.000	0.000	0.000	0.154	ma101107_rel.cz11apur1_bee
0.000	0.000	0.000	0.118	99.771	0.111	0.000	0.000	0.000	0.000	0.096	ma101107_rel.cz11b_bee
0.000	0.000	0.000	0.000	68.431	31.424	0.146	0.000	0.000	0.000	0.700	ma101107_rel.cz11c_bee
Delete response time histogram
256us	1ms	4ms	16ms	64ms	256ms	1s	4s	16s	gt	max	tag
0.000	0.000	0.000	12.993	86.972	0.035	0.000	0.000	0.000	0.000	0.071	ma101107_rel.cz11a_bee
0.000	0.000	0.000	0.056	96.646	3.299	0.000	0.000	0.000	0.000	0.102	ma101107_rel.cz11apur1_bee
0.000	0.000	0.000	15.563	84.403	0.035	0.000	0.000	0.000	0.000	0.084	ma101107_rel.cz11b_bee
0.000	0.000	0.000	1.715	86.979	11.188	0.118	0.000	0.000	0.000	0.674	ma101107_rel.cz11c_bee
qr500.L3
- qr500.L3: range queries with 500 insert/s per client
- Legend for results is here.
- Each entry lists the percentage of responses that fit in that bucket (slower than max time for previous bucket, faster than min time for next bucket).
Query response time histogram
256us	1ms	4ms	16ms	64ms	256ms	1s	4s	16s	gt	max	tag
37.070	51.781	9.595	1.160	0.393	0.001	0.000	0.000	0.000	0.000	0.087	ma101107_rel.cz11a_bee
35.172	54.230	8.944	1.269	0.381	0.004	0.000	0.000	0.000	0.000	0.092	ma101107_rel.cz11apur1_bee
38.269	49.841	10.125	1.532	0.223	0.008	0.001	0.000	0.000	0.000	0.514	ma101107_rel.cz11b_bee
12.989	63.694	11.920	3.421	7.323	0.645	0.005	0.002	0.000	0.000	1.470	ma101107_rel.cz11c_bee
Insert response time histogram
256us	1ms	4ms	16ms	64ms	256ms	1s	4s	16s	gt	max	tag
0.000	0.000	0.000	0.015	55.196	44.788	0.001	0.000	0.000	0.000	0.257	ma101107_rel.cz11a_bee
0.000	0.000	0.000	0.021	52.854	47.119	0.006	0.000	0.000	0.000	0.281	ma101107_rel.cz11apur1_bee
0.000	0.000	0.000	0.011	69.158	29.847	0.983	0.000	0.000	0.000	0.611	ma101107_rel.cz11b_bee
0.000	0.000	0.000	0.000	21.185	51.332	26.479	1.004	0.000	0.000	1.591	ma101107_rel.cz11c_bee
Delete response time histogram
256us	1ms	4ms	16ms	64ms	256ms	1s	4s	16s	gt	max	tag
0.000	0.000	0.000	3.321	63.836	32.843	0.000	0.000	0.000	0.000	0.226	ma101107_rel.cz11a_bee
0.000	0.000	0.000	1.522	60.307	38.169	0.001	0.000	0.000	0.000	0.258	ma101107_rel.cz11apur1_bee
0.000	0.000	0.000	0.850	81.642	16.910	0.599	0.000	0.000	0.000	0.580	ma101107_rel.cz11b_bee
0.000	0.000	0.000	0.014	29.539	47.056	23.212	0.179	0.000	0.000	1.527	ma101107_rel.cz11c_bee
qp500.L4
- qp500.L4: point queries with 500 insert/s per client
- Legend for results is here.
- Each entry lists the percentage of responses that fit in that bucket (slower than max time for previous bucket, faster than min time for next bucket).
Query response time histogram
256us	1ms	4ms	16ms	64ms	256ms	1s	4s	16s	gt	max	tag
0.000	0.010	86.282	10.918	2.788	0.002	0.000	0.000	0.000	0.000	0.090	ma101107_rel.cz11a_bee
0.000	0.017	85.675	11.607	2.699	0.002	0.000	0.000	0.000	0.000	0.089	ma101107_rel.cz11apur1_bee
0.000	0.004	78.869	20.047	1.060	0.016	0.004	0.000	0.000	0.000	0.507	ma101107_rel.cz11b_bee
0.000	0.000	46.218	10.863	36.686	5.898	0.327	0.008	0.000	0.000	1.425	ma101107_rel.cz11c_bee
Insert response time histogram
256us	1ms	4ms	16ms	64ms	256ms	1s	4s	16s	gt	max	tag
0.000	0.000	0.000	0.004	49.246	50.750	0.000	0.000	0.000	0.000	0.223	ma101107_rel.cz11a_bee
0.000	0.000	0.000	0.112	53.447	46.440	0.000	0.000	0.000	0.000	0.223	ma101107_rel.cz11apur1_bee
0.000	0.000	0.000	0.000	76.075	23.721	0.204	0.000	0.000	0.000	0.601	ma101107_rel.cz11b_bee
0.000	0.000	0.000	0.000	21.868	36.425	39.358	2.349	0.000	0.000	2.165	ma101107_rel.cz11c_bee
Delete response time histogram
256us	1ms	4ms	16ms	64ms	256ms	1s	4s	16s	gt	max	tag
0.000	0.000	0.000	0.700	61.590	37.710	0.000	0.000	0.000	0.000	0.167	ma101107_rel.cz11a_bee
0.000	0.000	0.000	0.790	63.324	35.886	0.000	0.000	0.000	0.000	0.200	ma101107_rel.cz11apur1_bee
0.000	0.000	0.000	0.189	82.837	16.808	0.165	0.000	0.000	0.000	0.567	ma101107_rel.cz11b_bee
0.000	0.000	0.000	0.006	28.768	37.465	32.826	0.935	0.000	0.000	1.683	ma101107_rel.cz11c_bee
qr1000.L5
- qr1000.L5: range queries with 1000 insert/s per client
- Legend for results is here.
- Each entry lists the percentage of responses that fit in that bucket (slower than max time for previous bucket, faster than min time for next bucket).
Query response time histogram
256us	1ms	4ms	16ms	64ms	256ms	1s	4s	16s	gt	max	tag
13.400	61.690	19.955	3.963	0.949	0.042	0.000	0.000	0.000	0.000	0.099	ma101107_rel.cz11a_bee
13.104	62.121	18.521	5.138	0.809	0.307	0.000	0.000	0.000	0.000	0.139	ma101107_rel.cz11apur1_bee
21.654	55.800	16.090	5.766	0.642	0.044	0.004	nonzero	0.000	0.000	2.747	ma101107_rel.cz11b_bee
8.166	66.409	13.634	1.835	8.565	1.384	0.004	0.004	0.000	0.000	1.548	ma101107_rel.cz11c_bee
Insert response time histogram
256us	1ms	4ms	16ms	64ms	256ms	1s	4s	16s	gt	max	tag
0.000	0.000	0.000	0.012	45.811	54.177	0.000	0.000	0.000	0.000	0.246	ma101107_rel.cz11a_bee
0.000	0.000	0.000	0.720	51.555	47.702	0.023	0.000	0.000	0.000	0.327	ma101107_rel.cz11apur1_bee
0.000	0.000	0.000	0.008	24.366	75.551	0.052	0.002	0.020	0.000	11.301	ma101107_rel.cz11b_bee
0.000	0.000	0.000	0.000	29.706	34.601	32.726	2.967	0.000	0.000	2.568	ma101107_rel.cz11c_bee
Delete response time histogram
256us	1ms	4ms	16ms	64ms	256ms	1s	4s	16s	gt	max	tag
0.000	0.000	0.000	1.751	53.507	44.742	0.000	0.000	0.000	0.000	0.229	ma101107_rel.cz11a_bee
0.000	0.000	0.000	5.083	53.103	41.796	0.018	0.000	0.000	0.000	0.320	ma101107_rel.cz11apur1_bee
0.000	0.000	0.000	0.043	47.851	52.051	0.035	0.003	0.017	0.000	10.270	ma101107_rel.cz11b_bee
0.000	0.000	0.000	0.012	37.727	29.457	32.245	0.559	0.000	0.000	1.952	ma101107_rel.cz11c_bee
qp1000.L6
- qp1000.L6: point queries with 1000 insert/s per client
- Legend for results is here.
- Each entry lists the percentage of responses that fit in that bucket (slower than max time for previous bucket, faster than min time for next bucket).
Query response time histogram
256us	1ms	4ms	16ms	64ms	256ms	1s	4s	16s	gt	max	tag
0.000	0.000	74.208	21.697	3.918	0.177	0.000	0.000	0.000	0.000	0.115	ma101107_rel.cz11a_bee
0.000	0.171	92.311	5.345	2.157	0.016	0.000	0.000	0.000	0.000	0.118	ma101107_rel.cz11apur1_bee
0.000	0.000	46.964	49.054	3.623	0.332	0.026	0.001	0.000	0.000	1.404	ma101107_rel.cz11b_bee
0.000	0.000	47.648	10.445	35.507	6.123	0.270	0.007	0.000	0.000	1.446	ma101107_rel.cz11c_bee
Insert response time histogram
256us	1ms	4ms	16ms	64ms	256ms	1s	4s	16s	gt	max	tag
0.000	0.000	0.000	0.007	44.455	55.538	0.000	0.000	0.000	0.000	0.202	ma101107_rel.cz11a_bee
0.000	0.000	0.000	0.402	30.708	28.765	40.125	0.000	0.000	0.000	0.552	ma101107_rel.cz11apur1_bee
0.000	0.000	0.000	0.001	27.780	72.122	0.062	0.008	0.027	0.000	8.673	ma101107_rel.cz11b_bee
0.000	0.000	0.000	0.000	23.923	35.082	39.447	1.549	0.000	0.000	2.611	ma101107_rel.cz11c_bee
Delete response time histogram
256us	1ms	4ms	16ms	64ms	256ms	1s	4s	16s	gt	max	tag
0.000	0.000	0.000	0.808	50.262	48.931	0.000	0.000	0.000	0.000	0.201	ma101107_rel.cz11a_bee
0.000	0.000	0.000	1.145	32.069	26.684	40.102	0.000	0.000	0.000	0.540	ma101107_rel.cz11apur1_bee
0.000	0.000	0.000	0.021	50.680	49.229	0.035	0.019	0.017	0.000	7.066	ma101107_rel.cz11b_bee
0.000	0.000	0.000	0.001	27.661	34.285	37.260	0.792	0.000	0.000	2.011	ma101107_rel.cz11c_bee