Introduction
This is a report for the insert benchmark with 800M docs and 1 client(s). It is generated by scripts (bash, awk, sed) and Tufte might not be impressed. An overview of the insert benchmark is here and a short update is here. Below, by DBMS, I mean DBMS+version.config. An example is my8020.c10b40 where my means MySQL, 8020 is version 8.0.20 and c10b40 is the name for the configuration file.
The test server has 8 AMD cores, 16G RAM and an NVMe SSD. It is described here as the Beelink. The benchmark was run with 1 client and there were 1 or 3 connections per client (1 for queries or inserts without rate limits, 1+1 for rate limited inserts+deletes). It uses 1 table. It loads 800M rows per table without secondary indexes, creates 3 secondary indexes per table, then inserts 4m+1m rows per table with a delete per insert to avoid growing the table. It then does 6 read+write tests for 1800s each that do queries as fast as possible with 100,100,500,500,1000,1000 inserts/s and the same for deletes/s per client concurrent with the queries. The database is larger than memory. Clients and the DBMS share one server. The per-database configs are in the per-database subdirectories here.
The tested DBMS are:
- my5651_rel.cz11a_bee - MySQL 5.6.51 with the cz11a_bee config
- my5744_rel.cz11a_bee - MySQL 5.7.44 with the cz11a_bee config
- my8036_rel.cz11a_bee - MySQL 8.0.36 with the cz11a_bee config
- my8036_rel.cz11b_bee - MySQL 8.0.36 with the cz11b_bee config that uses innodb_flush_method=O_DIRECT
- my8036_rel.cz11c_bee - MySQL 8.0.36 with the cz11c_bee config that uses innodb_flush_method=fsync
- my8036_rel.cz11d_bee - MySQL 8.0.36 with the cz11d_bee config that uses innodb_change_buffering=none
Contents
- Summary
- l.i0: load without secondary indexes
- l.x: create secondary indexes
- l.i1: continue load after secondary indexes created with 50 inserts per transaction
- l.i2: continue load after secondary indexes created with 5 inserts per transaction
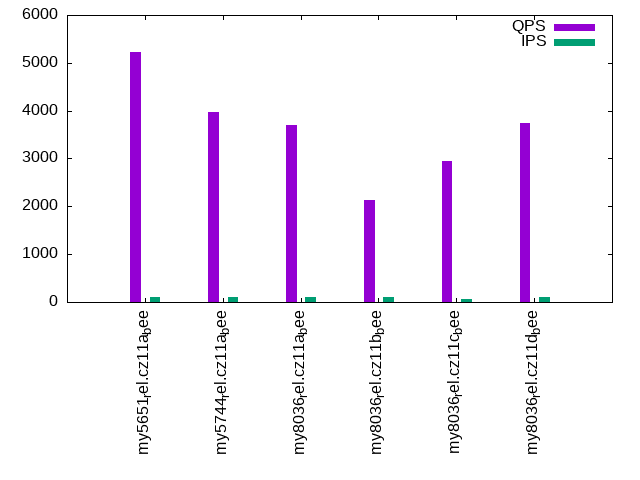
- qr100.L1: range queries with 100 insert/s per client
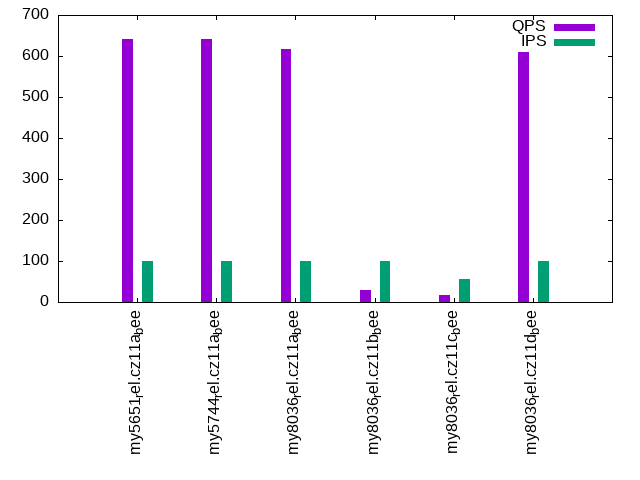
- qp100.L2: point queries with 100 insert/s per client
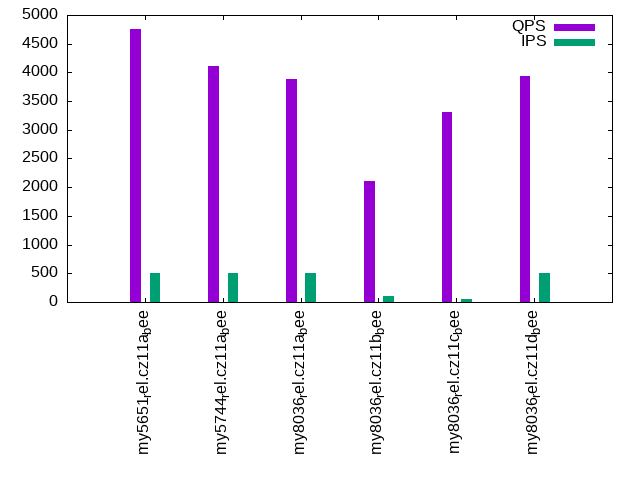
- qr500.L3: range queries with 500 insert/s per client
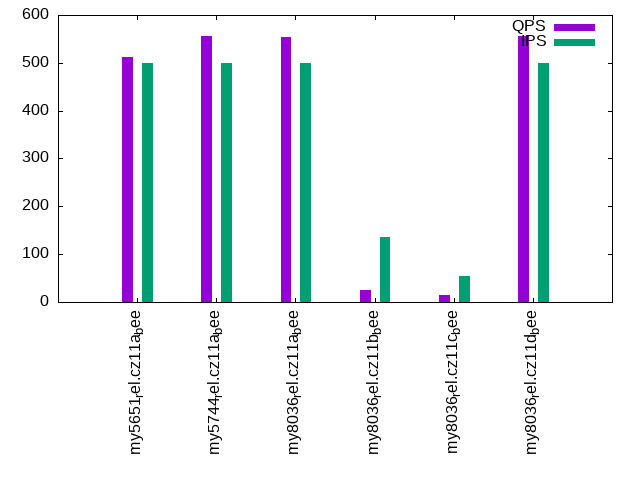
- qp500.L4: point queries with 500 insert/s per client
- qr1000.L5: range queries with 1000 insert/s per client
- qp1000.L6: point queries with 1000 insert/s per client
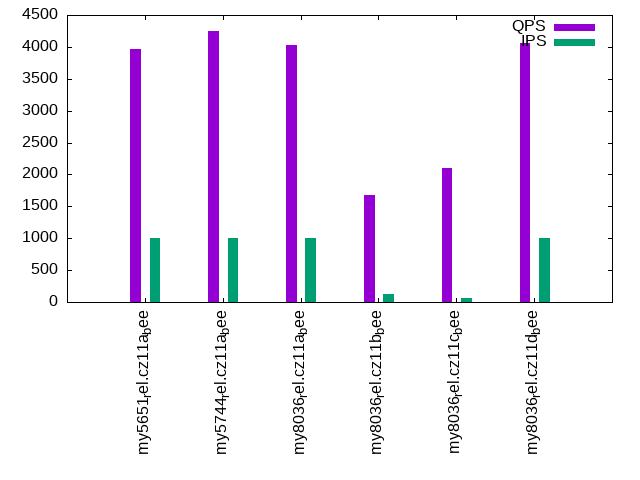
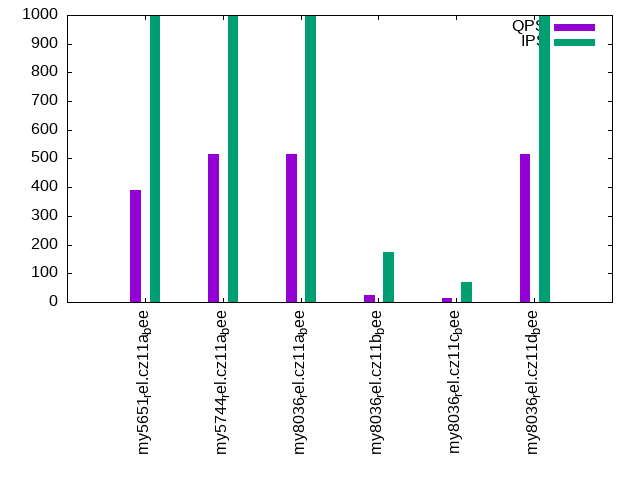
Summary
The numbers are inserts/s for l.i0, l.i1 and l.i2, indexed docs (or rows) /s for l.x and queries/s for qr100, qp100 thru qr1000, qp1000" The values are the average rate over the entire test for inserts (IPS) and queries (QPS). The range of values for IPS and QPS is split into 3 parts: bottom 25%, middle 50%, top 25%. Values in the bottom 25% have a red background, values in the top 25% have a green background and values in the middle have no color. A gray background is used for values that can be ignored because the DBMS did not sustain the target insert rate. Red backgrounds are not used when the minimum value is within 80% of the max value.
| dbms | l.i0 | l.x | l.i1 | l.i2 | qr100 | qp100 | qr500 | qp500 | qr1000 | qp1000 |
|---|---|---|---|---|---|---|---|---|---|---|
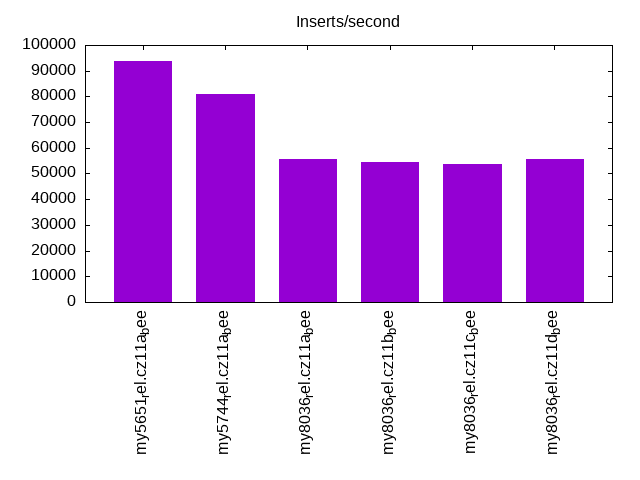
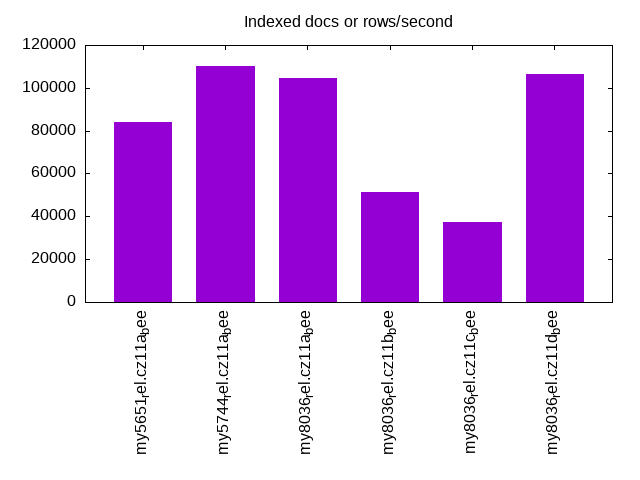
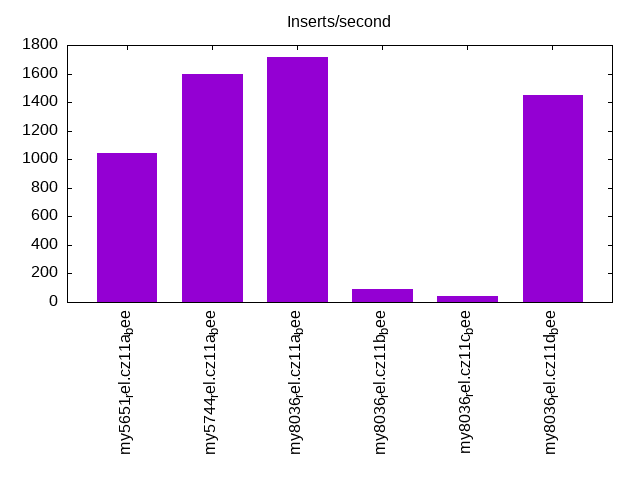
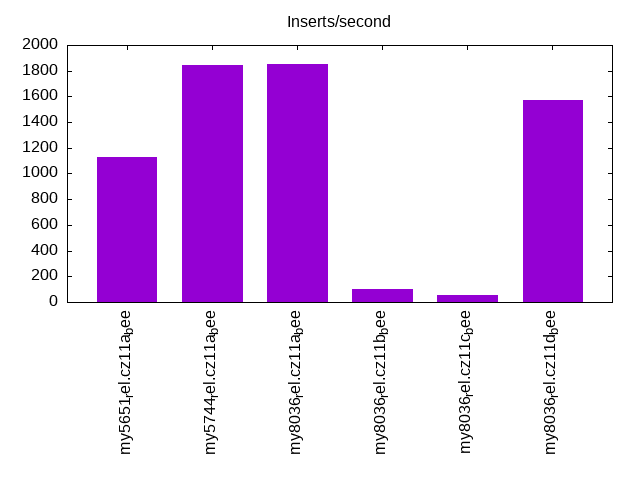
| my5651_rel.cz11a_bee | 93930 | 84034 | 1043 | 1132 | 5230 | 641 | 4758 | 512 | 3974 | 391 |
| my5744_rel.cz11a_bee | 81004 | 110026 | 1596 | 1842 | 3976 | 642 | 4118 | 556 | 4254 | 515 |
| my8036_rel.cz11a_bee | 55559 | 104657 | 1715 | 1855 | 3694 | 616 | 3891 | 554 | 4033 | 514 |
| my8036_rel.cz11b_bee | 54663 | 51533 | 94 | 102 | 2141 | 29 | 2103 | 26 | 1672 | 25 |
| my8036_rel.cz11c_bee | 53540 | 37568 | 45 | 56 | 2949 | 16 | 3312 | 15 | 2099 | 14 |
| my8036_rel.cz11d_bee | 55811 | 106256 | 1450 | 1575 | 3736 | 610 | 3929 | 557 | 4066 | 515 |
This table has relative throughput, throughput for the DBMS relative to the DBMS in the first line, using the absolute throughput from the previous table. Values less than 0.95 have a yellow background. Values greater than 1.05 have a blue background.
| dbms | l.i0 | l.x | l.i1 | l.i2 | qr100 | qp100 | qr500 | qp500 | qr1000 | qp1000 |
|---|---|---|---|---|---|---|---|---|---|---|
| my5651_rel.cz11a_bee | 1.00 | 1.00 | 1.00 | 1.00 | 1.00 | 1.00 | 1.00 | 1.00 | 1.00 | 1.00 |
| my5744_rel.cz11a_bee | 0.86 | 1.31 | 1.53 | 1.63 | 0.76 | 1.00 | 0.87 | 1.09 | 1.07 | 1.32 |
| my8036_rel.cz11a_bee | 0.59 | 1.25 | 1.64 | 1.64 | 0.71 | 0.96 | 0.82 | 1.08 | 1.01 | 1.31 |
| my8036_rel.cz11b_bee | 0.58 | 0.61 | 0.09 | 0.09 | 0.41 | 0.05 | 0.44 | 0.05 | 0.42 | 0.06 |
| my8036_rel.cz11c_bee | 0.57 | 0.45 | 0.04 | 0.05 | 0.56 | 0.02 | 0.70 | 0.03 | 0.53 | 0.04 |
| my8036_rel.cz11d_bee | 0.59 | 1.26 | 1.39 | 1.39 | 0.71 | 0.95 | 0.83 | 1.09 | 1.02 | 1.32 |
This lists the average rate of inserts/s for the tests that do inserts concurrent with queries. For such tests the query rate is listed in the table above. The read+write tests are setup so that the insert rate should match the target rate every second. Cells that are not at least 95% of the target have a red background to indicate a failure to satisfy the target.
| dbms | qr100.L1 | qp100.L2 | qr500.L3 | qp500.L4 | qr1000.L5 | qp1000.L6 |
|---|---|---|---|---|---|---|
| my5651_rel.cz11a_bee | 100 | 100 | 499 | 499 | 999 | 999 |
| my5744_rel.cz11a_bee | 100 | 100 | 499 | 499 | 998 | 999 |
| my8036_rel.cz11a_bee | 100 | 100 | 499 | 499 | 998 | 999 |
| my8036_rel.cz11b_bee | 99 | 99 | 104 | 136 | 132 | 173 |
| my8036_rel.cz11c_bee | 70 | 55 | 57 | 55 | 62 | 70 |
| my8036_rel.cz11d_bee | 100 | 100 | 499 | 499 | 998 | 998 |
| target | 100 | 100 | 500 | 500 | 1000 | 1000 |
l.i0
l.i0: load without secondary indexes. Graphs for performance per 1-second interval are here.
Average throughput:
Insert response time histogram: each cell has the percentage of responses that take <= the time in the header and max is the max response time in seconds. For the max column values in the top 25% of the range have a red background and in the bottom 25% of the range have a green background. The red background is not used when the min value is within 80% of the max value.
| dbms | 256us | 1ms | 4ms | 16ms | 64ms | 256ms | 1s | 4s | 16s | gt | max |
|---|---|---|---|---|---|---|---|---|---|---|---|
| my5651_rel.cz11a_bee | 74.997 | 24.857 | 0.087 | 0.057 | 0.002 | 0.186 | |||||
| my5744_rel.cz11a_bee | 0.274 | 99.376 | 0.207 | 0.141 | 0.002 | 0.109 | |||||
| my8036_rel.cz11a_bee | 99.423 | 0.431 | 0.145 | 0.001 | 0.105 | ||||||
| my8036_rel.cz11b_bee | 99.391 | 0.461 | 0.147 | 0.001 | 0.106 | ||||||
| my8036_rel.cz11c_bee | 99.316 | 0.517 | 0.156 | 0.011 | 0.143 | ||||||
| my8036_rel.cz11d_bee | 99.423 | 0.440 | 0.136 | 0.001 | 0.098 |
Performance metrics for the DBMS listed above. Some are normalized by throughput, others are not. Legend for results is here.
ips	qps	rps	rmbps	wps	wmbps	rpq	rkbpq	wpi	wkbpi	csps	cpups	cspq	cpupq	dbgb1	dbgb2	rss	maxop	p50	p99	tag
93930	0	822	3.2	467.1	33.9	0.009	0.035	0.005	0.369	11816	22.6	0.126	19	52.6	68.1	10.7	0.186	93891	80258	my5651_rel.cz11a_bee
81004	0	0	0.0	413.3	29.3	0.000	0.000	0.005	0.371	8816	21.6	0.109	21	52.6	68.1	10.9	0.109	81207	73915	my5744_rel.cz11a_bee
55559	0	0	0.0	338.7	21.0	0.000	0.000	0.006	0.388	6659	20.5	0.120	30	52.4	68.0	11.1	0.105	55637	51740	my8036_rel.cz11a_bee
54663	0	0	0.0	384.0	20.7	0.000	0.000	0.007	0.389	6999	21.9	0.128	32	52.4	68.0	11.1	0.106	54766	49831	my8036_rel.cz11b_bee
53540	0	0	0.0	294.4	20.4	0.000	0.000	0.005	0.390	7689	22.9	0.144	34	52.4	68.0	11.1	0.143	53865	46647	my8036_rel.cz11c_bee
55811	0	0	0.0	340.3	21.1	0.000	0.000	0.006	0.388	6691	20.8	0.120	30	52.4	68.0	11.1	0.098	55838	52444	my8036_rel.cz11d_bee
l.x
l.x: create secondary indexes.
Average throughput:
Performance metrics for the DBMS listed above. Some are normalized by throughput, others are not. Legend for results is here.
ips	qps	rps	rmbps	wps	wmbps	rpq	rkbpq	wpi	wkbpi	csps	cpups	cspq	cpupq	dbgb1	dbgb2	rss	maxop	p50	p99	tag
84034	0	561	84.9	712.8	107.6	0.007	1.035	0.008	1.312	1871	11.3	0.022	11	111.4	126.9	10.8	0.002	NA	NA	my5651_rel.cz11a_bee
110026	0	694	110.5	978.3	131.2	0.006	1.028	0.009	1.221	6285	12.0	0.057	9	121.1	136.7	11.0	0.002	NA	NA	my5744_rel.cz11a_bee
104657	0	1759	166.5	2132.7	149.7	0.017	1.629	0.020	1.465	8548	44.1	0.082	34	120.7	136.3	11.2	0.005	NA	NA	my8036_rel.cz11a_bee
51533	0	865	82.0	1142.0	73.8	0.017	1.629	0.022	1.467	4238	24.7	0.082	38	120.7	136.3	11.2	0.004	NA	NA	my8036_rel.cz11b_bee
37568	0	508	59.8	806.7	53.8	0.014	1.631	0.021	1.468	3774	18.8	0.100	40	120.7	136.3	10.5	0.004	NA	NA	my8036_rel.cz11c_bee
106256	0	1783	169.1	2168.6	152.1	0.017	1.629	0.020	1.465	8771	45.0	0.083	34	120.7	136.3	11.2	0.004	NA	NA	my8036_rel.cz11d_bee
l.i1
l.i1: continue load after secondary indexes created with 50 inserts per transaction. Graphs for performance per 1-second interval are here.
Average throughput:
Insert response time histogram: each cell has the percentage of responses that take <= the time in the header and max is the max response time in seconds. For the max column values in the top 25% of the range have a red background and in the bottom 25% of the range have a green background. The red background is not used when the min value is within 80% of the max value.
| dbms | 256us | 1ms | 4ms | 16ms | 64ms | 256ms | 1s | 4s | 16s | gt | max |
|---|---|---|---|---|---|---|---|---|---|---|---|
| my5651_rel.cz11a_bee | 0.020 | 83.817 | 16.156 | 0.006 | 0.856 | ||||||
| my5744_rel.cz11a_bee | 12.376 | 81.244 | 6.379 | 0.001 | 0.337 | ||||||
| my8036_rel.cz11a_bee | 17.226 | 77.665 | 5.109 | 0.221 | |||||||
| my8036_rel.cz11b_bee | 0.001 | 12.666 | 37.305 | 33.399 | 16.628 | 0.001 | 4.160 | ||||
| my8036_rel.cz11c_bee | 0.134 | 5.463 | 65.012 | 24.436 | 4.955 | 8.926 | |||||
| my8036_rel.cz11d_bee | 0.020 | 93.076 | 6.904 | 0.201 |
Delete response time histogram: each cell has the percentage of responses that take <= the time in the header and max is the max response time in seconds. For the max column values in the top 25% of the range have a red background and in the bottom 25% of the range have a green background. The red background is not used when the min value is within 80% of the max value.
| dbms | 256us | 1ms | 4ms | 16ms | 64ms | 256ms | 1s | 4s | 16s | gt | max |
|---|---|---|---|---|---|---|---|---|---|---|---|
| my5651_rel.cz11a_bee | 42.083 | 57.520 | 0.394 | 0.003 | 0.001 | 0.675 | |||||
| my5744_rel.cz11a_bee | 96.539 | 3.205 | 0.254 | 0.003 | 0.085 | ||||||
| my8036_rel.cz11a_bee | 51.446 | 48.204 | 0.347 | 0.003 | 0.096 | ||||||
| my8036_rel.cz11b_bee | 49.480 | 11.056 | 16.476 | 22.940 | 0.039 | 0.009 | 1.388 | ||||
| my8036_rel.cz11c_bee | 11.891 | 16.086 | 26.258 | 45.634 | 0.097 | 0.034 | 2.735 | ||||
| my8036_rel.cz11d_bee | 81.332 | 16.731 | 1.936 | 0.166 |
Performance metrics for the DBMS listed above. Some are normalized by throughput, others are not. Legend for results is here.
ips	qps	rps	rmbps	wps	wmbps	rpq	rkbpq	wpi	wkbpi	csps	cpups	cspq	cpupq	dbgb1	dbgb2	rss	maxop	p50	p99	tag
1043	0	6636	103.2	9477.9	256.1	6.362	101.336	9.085	251.392	42005	17.2	40.265	1319	143.9	159.4	10.4	0.856	1049	749	my5651_rel.cz11a_bee
1596	0	10052	157.1	12160.0	388.2	6.300	100.803	7.621	249.126	63416	24.3	39.747	1218	144.5	160.0	10.7	0.337	1599	899	my5744_rel.cz11a_bee
1715	0	8853	138.3	13267.1	368.2	5.162	82.587	7.735	219.837	74754	23.6	43.584	1101	149.5	165.3	10.8	0.221	1648	899	my8036_rel.cz11a_bee
94	0	594	9.3	1050.5	23.7	6.298	100.771	11.140	257.803	25297	6.0	268.256	5090	143.9	159.5	10.8	4.160	50	0	my8036_rel.cz11b_bee
45	0	277	4.9	597.8	11.3	6.215	112.397	13.403	260.002	24161	3.1	541.729	5561	143.9	159.5	10.5	8.926	50	0	my8036_rel.cz11c_bee
1450	0	9139	142.8	13289.5	363.1	6.304	100.858	9.166	256.468	70515	21.2	48.638	1170	143.9	159.5	10.7	0.201	1498	949	my8036_rel.cz11d_bee
l.i2
l.i2: continue load after secondary indexes created with 5 inserts per transaction. Graphs for performance per 1-second interval are here.
Average throughput:
Insert response time histogram: each cell has the percentage of responses that take <= the time in the header and max is the max response time in seconds. For the max column values in the top 25% of the range have a red background and in the bottom 25% of the range have a green background. The red background is not used when the min value is within 80% of the max value.
| dbms | 256us | 1ms | 4ms | 16ms | 64ms | 256ms | 1s | 4s | 16s | gt | max |
|---|---|---|---|---|---|---|---|---|---|---|---|
| my5651_rel.cz11a_bee | 2.140 | 54.455 | 42.459 | 0.945 | 0.001 | 0.077 | |||||
| my5744_rel.cz11a_bee | 4.120 | 82.502 | 12.923 | 0.454 | 0.063 | ||||||
| my8036_rel.cz11a_bee | 3.010 | 90.628 | 5.804 | 0.557 | 0.059 | ||||||
| my8036_rel.cz11b_bee | 0.402 | 23.755 | 13.065 | 33.832 | 27.488 | 1.459 | 0.813 | ||||
| my8036_rel.cz11c_bee | 0.170 | 3.970 | 6.892 | 41.760 | 41.867 | 5.197 | 0.144 | 1.729 | |||
| my8036_rel.cz11d_bee | 0.001 | 93.521 | 5.389 | 1.085 | 0.003 | 0.088 |
Delete response time histogram: each cell has the percentage of responses that take <= the time in the header and max is the max response time in seconds. For the max column values in the top 25% of the range have a red background and in the bottom 25% of the range have a green background. The red background is not used when the min value is within 80% of the max value.
| dbms | 256us | 1ms | 4ms | 16ms | 64ms | 256ms | 1s | 4s | 16s | gt | max |
|---|---|---|---|---|---|---|---|---|---|---|---|
| my5651_rel.cz11a_bee | 47.191 | 49.172 | 3.573 | 0.064 | 0.044 | ||||||
| my5744_rel.cz11a_bee | 97.271 | 2.335 | 0.383 | 0.011 | 0.043 | ||||||
| my8036_rel.cz11a_bee | 25.944 | 73.442 | 0.575 | 0.039 | 0.049 | ||||||
| my8036_rel.cz11b_bee | 38.341 | 26.948 | 20.459 | 14.006 | 0.239 | 0.005 | 0.001 | 1.020 | |||
| my8036_rel.cz11c_bee | 27.592 | 21.134 | 29.038 | 21.890 | 0.331 | 0.013 | 0.002 | 2.280 | |||
| my8036_rel.cz11d_bee | 0.005 | 94.781 | 4.729 | 0.483 | 0.001 | 0.069 |
Performance metrics for the DBMS listed above. Some are normalized by throughput, others are not. Legend for results is here.
ips	qps	rps	rmbps	wps	wmbps	rpq	rkbpq	wpi	wkbpi	csps	cpups	cspq	cpupq	dbgb1	dbgb2	rss	maxop	p50	p99	tag
1132	0	6938	104.1	9121.2	239.5	6.126	94.161	8.054	216.544	48629	25.8	42.940	1823	144.1	159.6	10.4	0.077	1139	969	my5651_rel.cz11a_bee
1842	0	10734	167.7	12640.5	392.4	5.829	93.261	6.864	218.165	73124	33.0	39.707	1434	144.5	160.0	10.7	0.063	1838	1458	my5744_rel.cz11a_bee
1855	0	8058	125.9	11848.7	316.6	4.343	69.495	6.387	174.754	78360	32.2	42.238	1389	149.5	165.4	10.8	0.059	1839	1478	my8036_rel.cz11a_bee
102	0	639	10.0	1094.1	24.0	6.261	100.182	10.726	241.267	30400	7.2	298.040	5647	145.3	161.0	10.8	0.813	75	15	my8036_rel.cz11b_bee
56	0	322	5.2	675.8	12.3	5.721	94.560	12.025	224.667	29817	4.5	530.553	6406	143.9	159.5	8.9	1.729	65	5	my8036_rel.cz11c_bee
1575	0	9183	143.5	12962.8	342.1	5.831	93.299	8.231	222.423	77005	25.4	48.898	1290	143.9	159.5	10.7	0.088	1580	1449	my8036_rel.cz11d_bee
qr100.L1
qr100.L1: range queries with 100 insert/s per client. Graphs for performance per 1-second interval are here.
Average throughput:
Query response time histogram: each cell has the percentage of responses that take <= the time in the header and max is the max response time in seconds. For max values in the top 25% of the range have a red background and in the bottom 25% of the range have a green background. The red background is not used when the min value is within 80% of the max value.
| dbms | 256us | 1ms | 4ms | 16ms | 64ms | 256ms | 1s | 4s | 16s | gt | max |
|---|---|---|---|---|---|---|---|---|---|---|---|
| my5651_rel.cz11a_bee | 95.434 | 4.256 | 0.287 | 0.023 | nonzero | 0.028 | |||||
| my5744_rel.cz11a_bee | 71.321 | 28.516 | 0.148 | 0.015 | nonzero | 0.018 | |||||
| my8036_rel.cz11a_bee | 59.837 | 40.159 | 0.003 | 0.001 | 0.010 | ||||||
| my8036_rel.cz11b_bee | 34.595 | 62.297 | 1.922 | 1.103 | 0.081 | 0.001 | nonzero | 0.683 | |||
| my8036_rel.cz11c_bee | 57.729 | 41.692 | 0.116 | 0.377 | 0.083 | 0.003 | 0.001 | nonzero | 1.379 | ||
| my8036_rel.cz11d_bee | 62.047 | 37.951 | 0.002 | 0.001 | 0.010 |
Insert response time histogram: each cell has the percentage of responses that take <= the time in the header and max is the max response time in seconds. For max values in the top 25% of the range have a red background and in the bottom 25% of the range have a green background. The red background is not used when the min value is within 80% of the max value.
| dbms | 256us | 1ms | 4ms | 16ms | 64ms | 256ms | 1s | 4s | 16s | gt | max |
|---|---|---|---|---|---|---|---|---|---|---|---|
| my5651_rel.cz11a_bee | 34.556 | 64.389 | 1.056 | 0.093 | |||||||
| my5744_rel.cz11a_bee | 58.528 | 41.472 | 0.035 | ||||||||
| my8036_rel.cz11a_bee | 9.333 | 90.667 | 0.038 | ||||||||
| my8036_rel.cz11b_bee | 0.722 | 5.778 | 24.861 | 66.944 | 1.694 | 3.518 | |||||
| my8036_rel.cz11c_bee | 2.389 | 17.028 | 71.861 | 6.694 | 2.028 | 7.060 | |||||
| my8036_rel.cz11d_bee | 100.000 | 0.044 |
Delete response time histogram: each cell has the percentage of responses that take <= the time in the header and max is the max response time in seconds. For max values in the top 25% of the range have a red background and in the bottom 25% of the range have a green background. The red background is not used when the min value is within 80% of the max value.
| dbms | 256us | 1ms | 4ms | 16ms | 64ms | 256ms | 1s | 4s | 16s | gt | max |
|---|---|---|---|---|---|---|---|---|---|---|---|
| my5651_rel.cz11a_bee | 15.083 | 41.389 | 43.500 | 0.028 | 0.064 | ||||||
| my5744_rel.cz11a_bee | 99.167 | 0.833 | 0.012 | ||||||||
| my8036_rel.cz11a_bee | 97.250 | 2.750 | 0.013 | ||||||||
| my8036_rel.cz11b_bee | 11.778 | 5.000 | 43.028 | 40.167 | 0.028 | 0.278 | |||||
| my8036_rel.cz11c_bee | 13.056 | 13.889 | 43.889 | 29.167 | 0.250 | ||||||
| my8036_rel.cz11d_bee | 58.111 | 41.889 | 0.038 |
Performance metrics for the DBMS listed above. Some are normalized by throughput, others are not. Legend for results is here.
ips	qps	rps	rmbps	wps	wmbps	rpq	rkbpq	wpi	wkbpi	csps	cpups	cspq	cpupq	dbgb1	dbgb2	rss	maxop	p50	p99	tag
100	5230	634	9.9	493.4	15.5	0.121	1.930	4.949	158.974	23261	13.7	4.447	210	144.1	159.6	10.4	0.028	5226	3740	my5651_rel.cz11a_bee
100	3976	630	9.8	454.7	14.1	0.158	2.533	4.557	144.996	17835	14.1	4.485	284	144.5	160.0	10.7	0.018	3931	2909	my5744_rel.cz11a_bee
100	3694	578	9.0	630.7	16.6	0.156	2.501	6.319	170.836	18460	14.2	4.997	308	149.5	165.4	10.8	0.010	3676	3374	my8036_rel.cz11a_bee
99	2141	687	10.7	956.2	21.3	0.321	5.135	9.668	220.796	37787	16.3	17.647	609	145.3	161.0	10.7	0.683	2126	463	my8036_rel.cz11b_bee
70	2949	405	6.5	669.4	12.4	0.137	2.253	9.522	180.563	40184	16.0	13.628	434	143.9	159.5	10.1	1.379	2989	384	my8036_rel.cz11c_bee
100	3736	578	9.0	612.4	16.2	0.155	2.474	6.137	166.733	18464	14.2	4.942	304	143.9	159.5	10.7	0.010	3708	3404	my8036_rel.cz11d_bee
qp100.L2
qp100.L2: point queries with 100 insert/s per client. Graphs for performance per 1-second interval are here.
Average throughput:
Query response time histogram: each cell has the percentage of responses that take <= the time in the header and max is the max response time in seconds. For max values in the top 25% of the range have a red background and in the bottom 25% of the range have a green background. The red background is not used when the min value is within 80% of the max value.
| dbms | 256us | 1ms | 4ms | 16ms | 64ms | 256ms | 1s | 4s | 16s | gt | max |
|---|---|---|---|---|---|---|---|---|---|---|---|
| my5651_rel.cz11a_bee | 0.498 | 99.041 | 0.459 | 0.001 | 0.039 | ||||||
| my5744_rel.cz11a_bee | 0.344 | 99.347 | 0.309 | 0.001 | 0.039 | ||||||
| my8036_rel.cz11a_bee | 0.116 | 99.635 | 0.247 | 0.001 | 0.046 | ||||||
| my8036_rel.cz11b_bee | 26.387 | 13.219 | 43.264 | 17.108 | 0.023 | 0.313 | |||||
| my8036_rel.cz11c_bee | 7.047 | 7.523 | 50.720 | 32.347 | 2.362 | 0.859 | |||||
| my8036_rel.cz11d_bee | 0.095 | 99.533 | 0.370 | 0.002 | 0.044 |
Insert response time histogram: each cell has the percentage of responses that take <= the time in the header and max is the max response time in seconds. For max values in the top 25% of the range have a red background and in the bottom 25% of the range have a green background. The red background is not used when the min value is within 80% of the max value.
| dbms | 256us | 1ms | 4ms | 16ms | 64ms | 256ms | 1s | 4s | 16s | gt | max |
|---|---|---|---|---|---|---|---|---|---|---|---|
| my5651_rel.cz11a_bee | 16.667 | 80.639 | 2.694 | 0.089 | |||||||
| my5744_rel.cz11a_bee | 79.833 | 20.167 | 0.029 | ||||||||
| my8036_rel.cz11a_bee | 7.417 | 92.583 | 0.047 | ||||||||
| my8036_rel.cz11b_bee | 0.028 | 10.944 | 23.139 | 63.194 | 2.694 | 1.557 | |||||
| my8036_rel.cz11c_bee | 0.056 | 3.750 | 73.556 | 22.167 | 0.472 | 6.033 | |||||
| my8036_rel.cz11d_bee | 99.917 | 0.083 | 0.068 |
Delete response time histogram: each cell has the percentage of responses that take <= the time in the header and max is the max response time in seconds. For max values in the top 25% of the range have a red background and in the bottom 25% of the range have a green background. The red background is not used when the min value is within 80% of the max value.
| dbms | 256us | 1ms | 4ms | 16ms | 64ms | 256ms | 1s | 4s | 16s | gt | max |
|---|---|---|---|---|---|---|---|---|---|---|---|
| my5651_rel.cz11a_bee | 44.000 | 45.250 | 10.722 | 0.028 | 0.076 | ||||||
| my5744_rel.cz11a_bee | 99.167 | 0.833 | 0.010 | ||||||||
| my8036_rel.cz11a_bee | 98.250 | 1.694 | 0.056 | 0.022 | |||||||
| my8036_rel.cz11b_bee | 20.639 | 6.583 | 16.861 | 55.806 | 0.111 | 0.561 | |||||
| my8036_rel.cz11c_bee | 6.944 | 12.750 | 44.750 | 35.417 | 0.111 | 0.028 | 2.209 | ||||
| my8036_rel.cz11d_bee | 63.222 | 36.778 | 0.060 |
Performance metrics for the DBMS listed above. Some are normalized by throughput, others are not. Legend for results is here.
ips	qps	rps	rmbps	wps	wmbps	rpq	rkbpq	wpi	wkbpi	csps	cpups	cspq	cpupq	dbgb1	dbgb2	rss	maxop	p50	p99	tag
100	641	6285	98.1	924.5	28.3	9.807	156.839	9.263	290.659	17692	5.3	27.610	662	144.1	159.6	10.4	0.039	655	543	my5651_rel.cz11a_bee
100	642	6304	98.5	953.3	29.0	9.827	157.239	9.552	297.333	17843	5.5	27.814	686	144.5	160.0	10.7	0.039	639	591	my5744_rel.cz11a_bee
100	616	6092	95.2	1127.7	29.1	9.894	158.298	11.300	298.148	18886	6.3	30.669	818	149.5	165.4	10.8	0.046	623	560	my8036_rel.cz11a_bee
99	29	942	14.7	1097.8	24.0	32.243	515.894	11.123	249.134	30764	7.2	1053.566	19727	145.3	161.0	10.8	0.313	16	0	my8036_rel.cz11b_bee
55	16	465	7.4	654.5	11.5	30.023	487.886	11.814	213.233	30265	4.0	1952.558	20646	143.9	159.5	9.2	0.859	16	0	my8036_rel.cz11c_bee
100	610	6046	94.5	1082.3	28.0	9.917	158.680	10.845	286.829	18265	5.6	29.962	735	143.9	159.5	10.7	0.044	608	559	my8036_rel.cz11d_bee
qr500.L3
qr500.L3: range queries with 500 insert/s per client. Graphs for performance per 1-second interval are here.
Average throughput:
Query response time histogram: each cell has the percentage of responses that take <= the time in the header and max is the max response time in seconds. For max values in the top 25% of the range have a red background and in the bottom 25% of the range have a green background. The red background is not used when the min value is within 80% of the max value.
| dbms | 256us | 1ms | 4ms | 16ms | 64ms | 256ms | 1s | 4s | 16s | gt | max |
|---|---|---|---|---|---|---|---|---|---|---|---|
| my5651_rel.cz11a_bee | 91.691 | 7.253 | 1.005 | 0.051 | nonzero | 0.032 | |||||
| my5744_rel.cz11a_bee | 75.176 | 24.635 | 0.164 | 0.025 | 0.013 | ||||||
| my8036_rel.cz11a_bee | 65.916 | 34.074 | 0.008 | 0.001 | 0.013 | ||||||
| my8036_rel.cz11b_bee | 31.769 | 64.360 | 2.982 | 0.817 | 0.071 | 0.002 | nonzero | 0.548 | |||
| my8036_rel.cz11c_bee | 61.759 | 37.970 | 0.056 | 0.166 | 0.045 | 0.003 | 0.001 | nonzero | 1.184 | ||
| my8036_rel.cz11d_bee | 67.386 | 32.609 | 0.005 | 0.001 | 0.010 |
Insert response time histogram: each cell has the percentage of responses that take <= the time in the header and max is the max response time in seconds. For max values in the top 25% of the range have a red background and in the bottom 25% of the range have a green background. The red background is not used when the min value is within 80% of the max value.
| dbms | 256us | 1ms | 4ms | 16ms | 64ms | 256ms | 1s | 4s | 16s | gt | max |
|---|---|---|---|---|---|---|---|---|---|---|---|
| my5651_rel.cz11a_bee | 47.511 | 51.767 | 0.722 | 0.136 | |||||||
| my5744_rel.cz11a_bee | 89.006 | 10.994 | 0.054 | ||||||||
| my8036_rel.cz11a_bee | 59.089 | 40.906 | 0.006 | 0.112 | |||||||
| my8036_rel.cz11b_bee | 0.089 | 8.283 | 27.939 | 57.817 | 5.872 | 3.488 | |||||
| my8036_rel.cz11c_bee | 1.050 | 21.756 | 59.650 | 14.150 | 3.394 | 7.383 | |||||
| my8036_rel.cz11d_bee | 0.044 | 99.956 | 0.048 |
Delete response time histogram: each cell has the percentage of responses that take <= the time in the header and max is the max response time in seconds. For max values in the top 25% of the range have a red background and in the bottom 25% of the range have a green background. The red background is not used when the min value is within 80% of the max value.
| dbms | 256us | 1ms | 4ms | 16ms | 64ms | 256ms | 1s | 4s | 16s | gt | max |
|---|---|---|---|---|---|---|---|---|---|---|---|
| my5651_rel.cz11a_bee | 12.361 | 30.328 | 57.300 | 0.011 | 0.070 | ||||||
| my5744_rel.cz11a_bee | 92.550 | 7.450 | 0.014 | ||||||||
| my8036_rel.cz11a_bee | 96.756 | 3.228 | 0.011 | 0.006 | 0.105 | ||||||
| my8036_rel.cz11b_bee | 23.817 | 12.561 | 21.683 | 41.789 | 0.150 | 0.368 | |||||
| my8036_rel.cz11c_bee | 18.022 | 22.972 | 32.678 | 26.222 | 0.106 | 0.424 | |||||
| my8036_rel.cz11d_bee | 86.494 | 13.506 | 0.036 |
Performance metrics for the DBMS listed above. Some are normalized by throughput, others are not. Legend for results is here.
ips	qps	rps	rmbps	wps	wmbps	rpq	rkbpq	wpi	wkbpi	csps	cpups	cspq	cpupq	dbgb1	dbgb2	rss	maxop	p50	p99	tag
499	4758	2947	45.8	3084.7	95.9	0.619	9.861	6.180	196.707	35662	19.0	7.495	319	144.1	159.6	10.4	0.032	4779	2557	my5651_rel.cz11a_bee
499	4118	2926	45.7	3120.7	96.7	0.710	11.367	6.253	198.336	31960	18.5	7.760	359	144.5	160.0	10.7	0.013	4122	2557	my5744_rel.cz11a_bee
499	3891	2932	45.8	3894.5	102.6	0.754	12.059	7.803	210.566	37504	19.1	9.639	393	149.5	165.4	10.7	0.013	3870	3436	my8036_rel.cz11a_bee
104	2103	583	9.1	979.9	21.5	0.277	4.434	9.413	211.663	37611	17.8	17.883	677	146.7	162.4	10.8	0.548	1968	1342	my8036_rel.cz11b_bee
57	3312	328	5.2	695.5	12.3	0.099	1.618	12.139	219.644	42262	17.9	12.759	432	143.9	159.5	9.0	1.184	3404	863	my8036_rel.cz11c_bee
499	3929	2872	44.9	3750.9	98.6	0.731	11.697	7.515	202.342	36106	18.3	9.190	373	143.9	159.5	10.8	0.010	3915	3452	my8036_rel.cz11d_bee
qp500.L4
qp500.L4: point queries with 500 insert/s per client. Graphs for performance per 1-second interval are here.
Average throughput:
Query response time histogram: each cell has the percentage of responses that take <= the time in the header and max is the max response time in seconds. For max values in the top 25% of the range have a red background and in the bottom 25% of the range have a green background. The red background is not used when the min value is within 80% of the max value.
| dbms | 256us | 1ms | 4ms | 16ms | 64ms | 256ms | 1s | 4s | 16s | gt | max |
|---|---|---|---|---|---|---|---|---|---|---|---|
| my5651_rel.cz11a_bee | 0.017 | 97.147 | 2.829 | 0.007 | 0.041 | ||||||
| my5744_rel.cz11a_bee | 0.021 | 97.583 | 2.389 | 0.006 | 0.044 | ||||||
| my8036_rel.cz11a_bee | 0.004 | 98.711 | 1.232 | 0.052 | 0.052 | ||||||
| my8036_rel.cz11b_bee | 23.112 | 11.516 | 45.009 | 20.315 | 0.048 | 0.486 | |||||
| my8036_rel.cz11c_bee | 4.357 | 6.255 | 50.034 | 37.089 | 2.265 | 0.826 | |||||
| my8036_rel.cz11d_bee | 0.004 | 98.441 | 1.542 | 0.014 | 0.051 |
Insert response time histogram: each cell has the percentage of responses that take <= the time in the header and max is the max response time in seconds. For max values in the top 25% of the range have a red background and in the bottom 25% of the range have a green background. The red background is not used when the min value is within 80% of the max value.
| dbms | 256us | 1ms | 4ms | 16ms | 64ms | 256ms | 1s | 4s | 16s | gt | max |
|---|---|---|---|---|---|---|---|---|---|---|---|
| my5651_rel.cz11a_bee | 49.911 | 40.933 | 9.156 | 0.172 | |||||||
| my5744_rel.cz11a_bee | 75.744 | 24.100 | 0.156 | 0.086 | |||||||
| my8036_rel.cz11a_bee | 63.372 | 36.500 | 0.128 | 0.086 | |||||||
| my8036_rel.cz11b_bee | 0.522 | 18.661 | 23.478 | 53.583 | 3.756 | 2.375 | |||||
| my8036_rel.cz11c_bee | 0.022 | 0.711 | 75.833 | 23.244 | 0.189 | 6.370 | |||||
| my8036_rel.cz11d_bee | 0.322 | 99.172 | 0.506 | 0.103 |
Delete response time histogram: each cell has the percentage of responses that take <= the time in the header and max is the max response time in seconds. For max values in the top 25% of the range have a red background and in the bottom 25% of the range have a green background. The red background is not used when the min value is within 80% of the max value.
| dbms | 256us | 1ms | 4ms | 16ms | 64ms | 256ms | 1s | 4s | 16s | gt | max |
|---|---|---|---|---|---|---|---|---|---|---|---|
| my5651_rel.cz11a_bee | 16.411 | 30.389 | 52.106 | 1.094 | 0.130 | ||||||
| my5744_rel.cz11a_bee | 92.211 | 7.750 | 0.039 | 0.042 | |||||||
| my8036_rel.cz11a_bee | 95.667 | 4.261 | 0.072 | 0.039 | |||||||
| my8036_rel.cz11b_bee | 19.628 | 19.339 | 18.461 | 42.433 | 0.139 | 0.915 | |||||
| my8036_rel.cz11c_bee | 4.172 | 12.650 | 40.244 | 42.733 | 0.189 | 0.011 | 1.857 | ||||
| my8036_rel.cz11d_bee | 85.533 | 14.389 | 0.078 | 0.096 |
Performance metrics for the DBMS listed above. Some are normalized by throughput, others are not. Legend for results is here.
ips	qps	rps	rmbps	wps	wmbps	rpq	rkbpq	wpi	wkbpi	csps	cpups	cspq	cpupq	dbgb1	dbgb2	rss	maxop	p50	p99	tag
499	512	7843	122.3	3465.1	105.9	15.307	244.478	6.938	217.137	29320	12.2	57.221	1905	144.1	159.6	10.4	0.041	511	463	my5651_rel.cz11a_bee
499	556	8227	128.6	3737.6	106.0	14.805	236.886	7.489	217.564	30793	9.8	55.414	1411	144.5	160.0	10.7	0.044	559	511	my5744_rel.cz11a_bee
499	554	8250	128.9	4280.3	111.9	14.883	238.133	8.576	229.684	36769	11.1	66.334	1602	149.5	165.4	10.7	0.052	559	527	my8036_rel.cz11a_bee
136	26	902	14.1	1091.6	23.9	34.972	559.549	8.020	179.828	30716	7.3	1190.545	22635	148.5	164.3	10.8	0.486	16	0	my8036_rel.cz11b_bee
55	15	455	7.2	663.3	11.6	31.164	504.693	12.105	215.872	30222	3.7	2069.995	20274	144.4	160.1	9.0	0.826	16	0	my8036_rel.cz11c_bee
499	557	8235	128.7	4201.2	109.4	14.796	236.733	8.418	224.490	34716	10.3	62.372	1480	143.9	159.5	10.8	0.051	559	527	my8036_rel.cz11d_bee
qr1000.L5
qr1000.L5: range queries with 1000 insert/s per client. Graphs for performance per 1-second interval are here.
Average throughput:
Query response time histogram: each cell has the percentage of responses that take <= the time in the header and max is the max response time in seconds. For max values in the top 25% of the range have a red background and in the bottom 25% of the range have a green background. The red background is not used when the min value is within 80% of the max value.
| dbms | 256us | 1ms | 4ms | 16ms | 64ms | 256ms | 1s | 4s | 16s | gt | max |
|---|---|---|---|---|---|---|---|---|---|---|---|
| my5651_rel.cz11a_bee | 84.423 | 13.196 | 2.254 | 0.126 | 0.001 | nonzero | 0.083 | ||||
| my5744_rel.cz11a_bee | 78.402 | 21.386 | 0.189 | 0.023 | nonzero | 0.034 | |||||
| my8036_rel.cz11a_bee | 69.532 | 30.449 | 0.018 | 0.001 | 0.012 | ||||||
| my8036_rel.cz11b_bee | 26.184 | 69.105 | 3.481 | 1.118 | 0.108 | 0.002 | 0.001 | 0.678 | |||
| my8036_rel.cz11c_bee | 31.774 | 64.711 | 2.883 | 0.505 | 0.124 | 0.003 | 0.001 | nonzero | 1.333 | ||
| my8036_rel.cz11d_bee | 71.211 | 28.767 | 0.020 | 0.001 | 0.011 |
Insert response time histogram: each cell has the percentage of responses that take <= the time in the header and max is the max response time in seconds. For max values in the top 25% of the range have a red background and in the bottom 25% of the range have a green background. The red background is not used when the min value is within 80% of the max value.
| dbms | 256us | 1ms | 4ms | 16ms | 64ms | 256ms | 1s | 4s | 16s | gt | max |
|---|---|---|---|---|---|---|---|---|---|---|---|
| my5651_rel.cz11a_bee | 20.769 | 77.033 | 2.197 | 0.182 | |||||||
| my5744_rel.cz11a_bee | 89.494 | 10.486 | 0.019 | 0.082 | |||||||
| my8036_rel.cz11a_bee | 81.617 | 18.353 | 0.031 | 0.112 | |||||||
| my8036_rel.cz11b_bee | 1.297 | 13.947 | 23.656 | 56.628 | 4.472 | 2.808 | |||||
| my8036_rel.cz11c_bee | 0.028 | 1.156 | 85.000 | 12.667 | 1.150 | 6.508 | |||||
| my8036_rel.cz11d_bee | 0.328 | 99.669 | 0.003 | 0.068 |
Delete response time histogram: each cell has the percentage of responses that take <= the time in the header and max is the max response time in seconds. For max values in the top 25% of the range have a red background and in the bottom 25% of the range have a green background. The red background is not used when the min value is within 80% of the max value.
| dbms | 256us | 1ms | 4ms | 16ms | 64ms | 256ms | 1s | 4s | 16s | gt | max |
|---|---|---|---|---|---|---|---|---|---|---|---|
| my5651_rel.cz11a_bee | 30.503 | 28.950 | 40.286 | 0.261 | 0.113 | ||||||
| my5744_rel.cz11a_bee | 98.083 | 1.894 | 0.022 | 0.026 | |||||||
| my8036_rel.cz11a_bee | 94.700 | 5.278 | 0.022 | 0.028 | |||||||
| my8036_rel.cz11b_bee | 16.081 | 17.953 | 25.950 | 39.956 | 0.061 | 0.434 | |||||
| my8036_rel.cz11c_bee | 0.597 | 6.708 | 28.325 | 62.828 | 1.542 | 0.817 | |||||
| my8036_rel.cz11d_bee | 74.931 | 25.069 | 0.059 |
Performance metrics for the DBMS listed above. Some are normalized by throughput, others are not. Legend for results is here.
ips	qps	rps	rmbps	wps	wmbps	rpq	rkbpq	wpi	wkbpi	csps	cpups	cspq	cpupq	dbgb1	dbgb2	rss	maxop	p50	p99	tag
999	3974	5628	87.5	7242.1	194.6	1.416	22.550	7.251	199.503	51221	24.7	12.889	497	144.1	159.6	10.4	0.083	4107	1726	my5651_rel.cz11a_bee
998	4254	5577	87.1	6336.5	194.7	1.311	20.978	6.347	199.743	48822	23.2	11.478	436	144.5	160.0	10.7	0.034	4267	2477	my5744_rel.cz11a_bee
998	4033	5537	86.5	7616.0	199.4	1.373	21.969	7.629	204.491	58966	24.6	14.622	488	149.5	165.4	10.8	0.012	4028	3548	my8036_rel.cz11a_bee
132	1672	571	8.9	970.4	21.2	0.342	5.465	7.329	163.648	35815	17.6	21.420	842	151.7	167.6	10.8	0.678	1566	991	my8036_rel.cz11b_bee
62	2099	331	5.3	689.5	12.3	0.158	2.585	11.193	205.192	37623	15.9	17.924	606	147.0	162.8	8.4	1.333	2000	1007	my8036_rel.cz11c_bee
998	4066	5514	86.2	7577.5	197.6	1.356	21.695	7.590	202.659	55396	23.7	13.623	466	143.9	159.5	10.8	0.011	4059	3564	my8036_rel.cz11d_bee
qp1000.L6
qp1000.L6: point queries with 1000 insert/s per client. Graphs for performance per 1-second interval are here.
Average throughput:
Query response time histogram: each cell has the percentage of responses that take <= the time in the header and max is the max response time in seconds. For max values in the top 25% of the range have a red background and in the bottom 25% of the range have a green background. The red background is not used when the min value is within 80% of the max value.
| dbms | 256us | 1ms | 4ms | 16ms | 64ms | 256ms | 1s | 4s | 16s | gt | max |
|---|---|---|---|---|---|---|---|---|---|---|---|
| my5651_rel.cz11a_bee | 0.002 | 92.092 | 7.886 | 0.020 | 0.058 | ||||||
| my5744_rel.cz11a_bee | 0.003 | 95.009 | 4.975 | 0.013 | 0.041 | ||||||
| my8036_rel.cz11a_bee | 0.001 | 97.492 | 2.400 | 0.108 | 0.064 | ||||||
| my8036_rel.cz11b_bee | 22.471 | 10.407 | 46.056 | 21.024 | 0.042 | 0.343 | |||||
| my8036_rel.cz11c_bee | 4.206 | 6.126 | 49.262 | 37.729 | 2.677 | 0.608 | |||||
| my8036_rel.cz11d_bee | 0.001 | 97.169 | 2.790 | 0.040 | 0.051 |
Insert response time histogram: each cell has the percentage of responses that take <= the time in the header and max is the max response time in seconds. For max values in the top 25% of the range have a red background and in the bottom 25% of the range have a green background. The red background is not used when the min value is within 80% of the max value.
| dbms | 256us | 1ms | 4ms | 16ms | 64ms | 256ms | 1s | 4s | 16s | gt | max |
|---|---|---|---|---|---|---|---|---|---|---|---|
| my5651_rel.cz11a_bee | 3.567 | 88.656 | 7.778 | 0.189 | |||||||
| my5744_rel.cz11a_bee | 78.417 | 21.469 | 0.114 | 0.086 | |||||||
| my8036_rel.cz11a_bee | 78.289 | 21.511 | 0.200 | 0.103 | |||||||
| my8036_rel.cz11b_bee | 3.572 | 20.069 | 21.694 | 53.831 | 0.833 | 1.625 | |||||
| my8036_rel.cz11c_bee | 0.014 | 1.783 | 83.297 | 14.906 | 3.375 | ||||||
| my8036_rel.cz11d_bee | 1.133 | 98.536 | 0.331 | 0.096 |
Delete response time histogram: each cell has the percentage of responses that take <= the time in the header and max is the max response time in seconds. For max values in the top 25% of the range have a red background and in the bottom 25% of the range have a green background. The red background is not used when the min value is within 80% of the max value.
| dbms | 256us | 1ms | 4ms | 16ms | 64ms | 256ms | 1s | 4s | 16s | gt | max |
|---|---|---|---|---|---|---|---|---|---|---|---|
| my5651_rel.cz11a_bee | 24.997 | 34.694 | 39.408 | 0.900 | 0.135 | ||||||
| my5744_rel.cz11a_bee | 96.864 | 3.117 | 0.019 | 0.045 | |||||||
| my8036_rel.cz11a_bee | 94.611 | 5.283 | 0.106 | 0.050 | |||||||
| my8036_rel.cz11b_bee | 9.558 | 24.539 | 21.083 | 44.669 | 0.147 | 0.003 | 1.002 | ||||
| my8036_rel.cz11c_bee | 0.150 | 7.753 | 25.861 | 64.528 | 1.683 | 0.025 | 2.131 | ||||
| my8036_rel.cz11d_bee | 82.181 | 17.667 | 0.153 | 0.089 |
Performance metrics for the DBMS listed above. Some are normalized by throughput, others are not. Legend for results is here.
ips	qps	rps	rmbps	wps	wmbps	rpq	rkbpq	wpi	wkbpi	csps	cpups	cspq	cpupq	dbgb1	dbgb2	rss	maxop	p50	p99	tag
999	391	9474	147.6	8844.2	194.8	24.207	386.186	8.855	199.716	45387	19.2	115.961	3924	144.1	159.6	10.5	0.058	384	352	my5651_rel.cz11a_bee
999	515	10650	166.4	6473.7	195.8	20.668	330.692	6.481	200.735	45407	15.1	88.118	2344	144.5	160.0	10.7	0.041	511	464	my5744_rel.cz11a_bee
999	514	10640	166.2	7788.9	202.7	20.721	331.528	7.798	207.766	57960	16.4	112.873	2555	149.5	165.4	10.8	0.064	511	479	my8036_rel.cz11a_bee
173	25	887	13.9	1075.3	23.5	35.062	560.987	6.205	138.565	30534	7.4	1206.875	23399	154.9	171.0	10.8	0.343	16	0	my8036_rel.cz11b_bee
70	14	461	7.6	673.4	11.9	32.719	555.356	9.661	174.859	30284	3.9	2147.771	22128	150.1	166.0	8.4	0.608	16	0	my8036_rel.cz11c_bee
998	515	10662	166.6	7741.8	200.8	20.694	331.104	7.755	205.990	53275	15.2	103.406	2360	143.9	159.5	10.8	0.051	512	495	my8036_rel.cz11d_bee
l.i0
l.i0: load without secondary indexes
Performance metrics for all DBMS, not just the ones listed above. Some are normalized by throughput, others are not. Legend for results is here.
ips	qps	rps	rmbps	wps	wmbps	rpq	rkbpq	wpi	wkbpi	csps	cpups	cspq	cpupq	dbgb1	dbgb2	rss	maxop	p50	p99	tag
93930	0	822	3.2	467.1	33.9	0.009	0.035	0.005	0.369	11816	22.6	0.126	19	52.6	68.1	10.7	0.186	93891	80258	my5651_rel.cz11a_bee
81004	0	0	0.0	413.3	29.3	0.000	0.000	0.005	0.371	8816	21.6	0.109	21	52.6	68.1	10.9	0.109	81207	73915	my5744_rel.cz11a_bee
55559	0	0	0.0	338.7	21.0	0.000	0.000	0.006	0.388	6659	20.5	0.120	30	52.4	68.0	11.1	0.105	55637	51740	my8036_rel.cz11a_bee
54663	0	0	0.0	384.0	20.7	0.000	0.000	0.007	0.389	6999	21.9	0.128	32	52.4	68.0	11.1	0.106	54766	49831	my8036_rel.cz11b_bee
53540	0	0	0.0	294.4	20.4	0.000	0.000	0.005	0.390	7689	22.9	0.144	34	52.4	68.0	11.1	0.143	53865	46647	my8036_rel.cz11c_bee
55811	0	0	0.0	340.3	21.1	0.000	0.000	0.006	0.388	6691	20.8	0.120	30	52.4	68.0	11.1	0.098	55838	52444	my8036_rel.cz11d_bee
l.x
l.x: create secondary indexes
Performance metrics for all DBMS, not just the ones listed above. Some are normalized by throughput, others are not. Legend for results is here.
ips	qps	rps	rmbps	wps	wmbps	rpq	rkbpq	wpi	wkbpi	csps	cpups	cspq	cpupq	dbgb1	dbgb2	rss	maxop	p50	p99	tag
84034	0	561	84.9	712.8	107.6	0.007	1.035	0.008	1.312	1871	11.3	0.022	11	111.4	126.9	10.8	0.002	NA	NA	my5651_rel.cz11a_bee
110026	0	694	110.5	978.3	131.2	0.006	1.028	0.009	1.221	6285	12.0	0.057	9	121.1	136.7	11.0	0.002	NA	NA	my5744_rel.cz11a_bee
104657	0	1759	166.5	2132.7	149.7	0.017	1.629	0.020	1.465	8548	44.1	0.082	34	120.7	136.3	11.2	0.005	NA	NA	my8036_rel.cz11a_bee
51533	0	865	82.0	1142.0	73.8	0.017	1.629	0.022	1.467	4238	24.7	0.082	38	120.7	136.3	11.2	0.004	NA	NA	my8036_rel.cz11b_bee
37568	0	508	59.8	806.7	53.8	0.014	1.631	0.021	1.468	3774	18.8	0.100	40	120.7	136.3	10.5	0.004	NA	NA	my8036_rel.cz11c_bee
106256	0	1783	169.1	2168.6	152.1	0.017	1.629	0.020	1.465	8771	45.0	0.083	34	120.7	136.3	11.2	0.004	NA	NA	my8036_rel.cz11d_bee
l.i1
l.i1: continue load after secondary indexes created with 50 inserts per transaction
Performance metrics for all DBMS, not just the ones listed above. Some are normalized by throughput, others are not. Legend for results is here.
ips	qps	rps	rmbps	wps	wmbps	rpq	rkbpq	wpi	wkbpi	csps	cpups	cspq	cpupq	dbgb1	dbgb2	rss	maxop	p50	p99	tag
1043	0	6636	103.2	9477.9	256.1	6.362	101.336	9.085	251.392	42005	17.2	40.265	1319	143.9	159.4	10.4	0.856	1049	749	my5651_rel.cz11a_bee
1596	0	10052	157.1	12160.0	388.2	6.300	100.803	7.621	249.126	63416	24.3	39.747	1218	144.5	160.0	10.7	0.337	1599	899	my5744_rel.cz11a_bee
1715	0	8853	138.3	13267.1	368.2	5.162	82.587	7.735	219.837	74754	23.6	43.584	1101	149.5	165.3	10.8	0.221	1648	899	my8036_rel.cz11a_bee
94	0	594	9.3	1050.5	23.7	6.298	100.771	11.140	257.803	25297	6.0	268.256	5090	143.9	159.5	10.8	4.160	50	0	my8036_rel.cz11b_bee
45	0	277	4.9	597.8	11.3	6.215	112.397	13.403	260.002	24161	3.1	541.729	5561	143.9	159.5	10.5	8.926	50	0	my8036_rel.cz11c_bee
1450	0	9139	142.8	13289.5	363.1	6.304	100.858	9.166	256.468	70515	21.2	48.638	1170	143.9	159.5	10.7	0.201	1498	949	my8036_rel.cz11d_bee
l.i2
l.i2: continue load after secondary indexes created with 5 inserts per transaction
Performance metrics for all DBMS, not just the ones listed above. Some are normalized by throughput, others are not. Legend for results is here.
ips	qps	rps	rmbps	wps	wmbps	rpq	rkbpq	wpi	wkbpi	csps	cpups	cspq	cpupq	dbgb1	dbgb2	rss	maxop	p50	p99	tag
1132	0	6938	104.1	9121.2	239.5	6.126	94.161	8.054	216.544	48629	25.8	42.940	1823	144.1	159.6	10.4	0.077	1139	969	my5651_rel.cz11a_bee
1842	0	10734	167.7	12640.5	392.4	5.829	93.261	6.864	218.165	73124	33.0	39.707	1434	144.5	160.0	10.7	0.063	1838	1458	my5744_rel.cz11a_bee
1855	0	8058	125.9	11848.7	316.6	4.343	69.495	6.387	174.754	78360	32.2	42.238	1389	149.5	165.4	10.8	0.059	1839	1478	my8036_rel.cz11a_bee
102	0	639	10.0	1094.1	24.0	6.261	100.182	10.726	241.267	30400	7.2	298.040	5647	145.3	161.0	10.8	0.813	75	15	my8036_rel.cz11b_bee
56	0	322	5.2	675.8	12.3	5.721	94.560	12.025	224.667	29817	4.5	530.553	6406	143.9	159.5	8.9	1.729	65	5	my8036_rel.cz11c_bee
1575	0	9183	143.5	12962.8	342.1	5.831	93.299	8.231	222.423	77005	25.4	48.898	1290	143.9	159.5	10.7	0.088	1580	1449	my8036_rel.cz11d_bee
qr100.L1
qr100.L1: range queries with 100 insert/s per client
Performance metrics for all DBMS, not just the ones listed above. Some are normalized by throughput, others are not. Legend for results is here.
ips	qps	rps	rmbps	wps	wmbps	rpq	rkbpq	wpi	wkbpi	csps	cpups	cspq	cpupq	dbgb1	dbgb2	rss	maxop	p50	p99	tag
100	5230	634	9.9	493.4	15.5	0.121	1.930	4.949	158.974	23261	13.7	4.447	210	144.1	159.6	10.4	0.028	5226	3740	my5651_rel.cz11a_bee
100	3976	630	9.8	454.7	14.1	0.158	2.533	4.557	144.996	17835	14.1	4.485	284	144.5	160.0	10.7	0.018	3931	2909	my5744_rel.cz11a_bee
100	3694	578	9.0	630.7	16.6	0.156	2.501	6.319	170.836	18460	14.2	4.997	308	149.5	165.4	10.8	0.010	3676	3374	my8036_rel.cz11a_bee
99	2141	687	10.7	956.2	21.3	0.321	5.135	9.668	220.796	37787	16.3	17.647	609	145.3	161.0	10.7	0.683	2126	463	my8036_rel.cz11b_bee
70	2949	405	6.5	669.4	12.4	0.137	2.253	9.522	180.563	40184	16.0	13.628	434	143.9	159.5	10.1	1.379	2989	384	my8036_rel.cz11c_bee
100	3736	578	9.0	612.4	16.2	0.155	2.474	6.137	166.733	18464	14.2	4.942	304	143.9	159.5	10.7	0.010	3708	3404	my8036_rel.cz11d_bee
qp100.L2
qp100.L2: point queries with 100 insert/s per client
Performance metrics for all DBMS, not just the ones listed above. Some are normalized by throughput, others are not. Legend for results is here.
ips	qps	rps	rmbps	wps	wmbps	rpq	rkbpq	wpi	wkbpi	csps	cpups	cspq	cpupq	dbgb1	dbgb2	rss	maxop	p50	p99	tag
100	641	6285	98.1	924.5	28.3	9.807	156.839	9.263	290.659	17692	5.3	27.610	662	144.1	159.6	10.4	0.039	655	543	my5651_rel.cz11a_bee
100	642	6304	98.5	953.3	29.0	9.827	157.239	9.552	297.333	17843	5.5	27.814	686	144.5	160.0	10.7	0.039	639	591	my5744_rel.cz11a_bee
100	616	6092	95.2	1127.7	29.1	9.894	158.298	11.300	298.148	18886	6.3	30.669	818	149.5	165.4	10.8	0.046	623	560	my8036_rel.cz11a_bee
99	29	942	14.7	1097.8	24.0	32.243	515.894	11.123	249.134	30764	7.2	1053.566	19727	145.3	161.0	10.8	0.313	16	0	my8036_rel.cz11b_bee
55	16	465	7.4	654.5	11.5	30.023	487.886	11.814	213.233	30265	4.0	1952.558	20646	143.9	159.5	9.2	0.859	16	0	my8036_rel.cz11c_bee
100	610	6046	94.5	1082.3	28.0	9.917	158.680	10.845	286.829	18265	5.6	29.962	735	143.9	159.5	10.7	0.044	608	559	my8036_rel.cz11d_bee
qr500.L3
qr500.L3: range queries with 500 insert/s per client
Performance metrics for all DBMS, not just the ones listed above. Some are normalized by throughput, others are not. Legend for results is here.
ips	qps	rps	rmbps	wps	wmbps	rpq	rkbpq	wpi	wkbpi	csps	cpups	cspq	cpupq	dbgb1	dbgb2	rss	maxop	p50	p99	tag
499	4758	2947	45.8	3084.7	95.9	0.619	9.861	6.180	196.707	35662	19.0	7.495	319	144.1	159.6	10.4	0.032	4779	2557	my5651_rel.cz11a_bee
499	4118	2926	45.7	3120.7	96.7	0.710	11.367	6.253	198.336	31960	18.5	7.760	359	144.5	160.0	10.7	0.013	4122	2557	my5744_rel.cz11a_bee
499	3891	2932	45.8	3894.5	102.6	0.754	12.059	7.803	210.566	37504	19.1	9.639	393	149.5	165.4	10.7	0.013	3870	3436	my8036_rel.cz11a_bee
104	2103	583	9.1	979.9	21.5	0.277	4.434	9.413	211.663	37611	17.8	17.883	677	146.7	162.4	10.8	0.548	1968	1342	my8036_rel.cz11b_bee
57	3312	328	5.2	695.5	12.3	0.099	1.618	12.139	219.644	42262	17.9	12.759	432	143.9	159.5	9.0	1.184	3404	863	my8036_rel.cz11c_bee
499	3929	2872	44.9	3750.9	98.6	0.731	11.697	7.515	202.342	36106	18.3	9.190	373	143.9	159.5	10.8	0.010	3915	3452	my8036_rel.cz11d_bee
qp500.L4
qp500.L4: point queries with 500 insert/s per client
Performance metrics for all DBMS, not just the ones listed above. Some are normalized by throughput, others are not. Legend for results is here.
ips	qps	rps	rmbps	wps	wmbps	rpq	rkbpq	wpi	wkbpi	csps	cpups	cspq	cpupq	dbgb1	dbgb2	rss	maxop	p50	p99	tag
499	512	7843	122.3	3465.1	105.9	15.307	244.478	6.938	217.137	29320	12.2	57.221	1905	144.1	159.6	10.4	0.041	511	463	my5651_rel.cz11a_bee
499	556	8227	128.6	3737.6	106.0	14.805	236.886	7.489	217.564	30793	9.8	55.414	1411	144.5	160.0	10.7	0.044	559	511	my5744_rel.cz11a_bee
499	554	8250	128.9	4280.3	111.9	14.883	238.133	8.576	229.684	36769	11.1	66.334	1602	149.5	165.4	10.7	0.052	559	527	my8036_rel.cz11a_bee
136	26	902	14.1	1091.6	23.9	34.972	559.549	8.020	179.828	30716	7.3	1190.545	22635	148.5	164.3	10.8	0.486	16	0	my8036_rel.cz11b_bee
55	15	455	7.2	663.3	11.6	31.164	504.693	12.105	215.872	30222	3.7	2069.995	20274	144.4	160.1	9.0	0.826	16	0	my8036_rel.cz11c_bee
499	557	8235	128.7	4201.2	109.4	14.796	236.733	8.418	224.490	34716	10.3	62.372	1480	143.9	159.5	10.8	0.051	559	527	my8036_rel.cz11d_bee
qr1000.L5
qr1000.L5: range queries with 1000 insert/s per client
Performance metrics for all DBMS, not just the ones listed above. Some are normalized by throughput, others are not. Legend for results is here.
ips	qps	rps	rmbps	wps	wmbps	rpq	rkbpq	wpi	wkbpi	csps	cpups	cspq	cpupq	dbgb1	dbgb2	rss	maxop	p50	p99	tag
999	3974	5628	87.5	7242.1	194.6	1.416	22.550	7.251	199.503	51221	24.7	12.889	497	144.1	159.6	10.4	0.083	4107	1726	my5651_rel.cz11a_bee
998	4254	5577	87.1	6336.5	194.7	1.311	20.978	6.347	199.743	48822	23.2	11.478	436	144.5	160.0	10.7	0.034	4267	2477	my5744_rel.cz11a_bee
998	4033	5537	86.5	7616.0	199.4	1.373	21.969	7.629	204.491	58966	24.6	14.622	488	149.5	165.4	10.8	0.012	4028	3548	my8036_rel.cz11a_bee
132	1672	571	8.9	970.4	21.2	0.342	5.465	7.329	163.648	35815	17.6	21.420	842	151.7	167.6	10.8	0.678	1566	991	my8036_rel.cz11b_bee
62	2099	331	5.3	689.5	12.3	0.158	2.585	11.193	205.192	37623	15.9	17.924	606	147.0	162.8	8.4	1.333	2000	1007	my8036_rel.cz11c_bee
998	4066	5514	86.2	7577.5	197.6	1.356	21.695	7.590	202.659	55396	23.7	13.623	466	143.9	159.5	10.8	0.011	4059	3564	my8036_rel.cz11d_bee
qp1000.L6
qp1000.L6: point queries with 1000 insert/s per client
Performance metrics for all DBMS, not just the ones listed above. Some are normalized by throughput, others are not. Legend for results is here.
ips	qps	rps	rmbps	wps	wmbps	rpq	rkbpq	wpi	wkbpi	csps	cpups	cspq	cpupq	dbgb1	dbgb2	rss	maxop	p50	p99	tag
999	391	9474	147.6	8844.2	194.8	24.207	386.186	8.855	199.716	45387	19.2	115.961	3924	144.1	159.6	10.5	0.058	384	352	my5651_rel.cz11a_bee
999	515	10650	166.4	6473.7	195.8	20.668	330.692	6.481	200.735	45407	15.1	88.118	2344	144.5	160.0	10.7	0.041	511	464	my5744_rel.cz11a_bee
999	514	10640	166.2	7788.9	202.7	20.721	331.528	7.798	207.766	57960	16.4	112.873	2555	149.5	165.4	10.8	0.064	511	479	my8036_rel.cz11a_bee
173	25	887	13.9	1075.3	23.5	35.062	560.987	6.205	138.565	30534	7.4	1206.875	23399	154.9	171.0	10.8	0.343	16	0	my8036_rel.cz11b_bee
70	14	461	7.6	673.4	11.9	32.719	555.356	9.661	174.859	30284	3.9	2147.771	22128	150.1	166.0	8.4	0.608	16	0	my8036_rel.cz11c_bee
998	515	10662	166.6	7741.8	200.8	20.694	331.104	7.755	205.990	53275	15.2	103.406	2360	143.9	159.5	10.8	0.051	512	495	my8036_rel.cz11d_bee
l.i0
- l.i0: load without secondary indexes
- Legend for results is here.
- Each entry lists the percentage of responses that fit in that bucket (slower than max time for previous bucket, faster than min time for next bucket).
Insert response time histogram
256us	1ms	4ms	16ms	64ms	256ms	1s	4s	16s	gt	max	tag
0.000	74.997	24.857	0.087	0.057	0.002	0.000	0.000	0.000	0.000	0.186	my5651_rel.cz11a_bee
0.000	0.274	99.376	0.207	0.141	0.002	0.000	0.000	0.000	0.000	0.109	my5744_rel.cz11a_bee
0.000	0.000	99.423	0.431	0.145	0.001	0.000	0.000	0.000	0.000	0.105	my8036_rel.cz11a_bee
0.000	0.000	99.391	0.461	0.147	0.001	0.000	0.000	0.000	0.000	0.106	my8036_rel.cz11b_bee
0.000	0.000	99.316	0.517	0.156	0.011	0.000	0.000	0.000	0.000	0.143	my8036_rel.cz11c_bee
0.000	0.000	99.423	0.440	0.136	0.001	0.000	0.000	0.000	0.000	0.098	my8036_rel.cz11d_bee
l.x
- l.x: create secondary indexes
- Legend for results is here.
- Each entry lists the percentage of responses that fit in that bucket (slower than max time for previous bucket, faster than min time for next bucket).
TODO - determine whether there is data for create index response time
l.i1
- l.i1: continue load after secondary indexes created with 50 inserts per transaction
- Legend for results is here.
- Each entry lists the percentage of responses that fit in that bucket (slower than max time for previous bucket, faster than min time for next bucket).
Insert response time histogram
256us	1ms	4ms	16ms	64ms	256ms	1s	4s	16s	gt	max	tag
0.000	0.000	0.000	0.020	83.817	16.156	0.006	0.000	0.000	0.000	0.856	my5651_rel.cz11a_bee
0.000	0.000	0.000	12.376	81.244	6.379	0.001	0.000	0.000	0.000	0.337	my5744_rel.cz11a_bee
0.000	0.000	0.000	17.226	77.665	5.109	0.000	0.000	0.000	0.000	0.221	my8036_rel.cz11a_bee
0.000	0.000	0.000	0.001	12.666	37.305	33.399	16.628	0.001	0.000	4.160	my8036_rel.cz11b_bee
0.000	0.000	0.000	0.000	0.134	5.463	65.012	24.436	4.955	0.000	8.926	my8036_rel.cz11c_bee
0.000	0.000	0.000	0.020	93.076	6.904	0.000	0.000	0.000	0.000	0.201	my8036_rel.cz11d_bee
Delete response time histogram
256us	1ms	4ms	16ms	64ms	256ms	1s	4s	16s	gt	max	tag
0.000	0.000	42.083	57.520	0.394	0.003	0.001	0.000	0.000	0.000	0.675	my5651_rel.cz11a_bee
0.000	0.000	96.539	3.205	0.254	0.003	0.000	0.000	0.000	0.000	0.085	my5744_rel.cz11a_bee
0.000	0.000	51.446	48.204	0.347	0.003	0.000	0.000	0.000	0.000	0.096	my8036_rel.cz11a_bee
0.000	0.000	49.480	11.056	16.476	22.940	0.039	0.009	0.000	0.000	1.388	my8036_rel.cz11b_bee
0.000	0.000	11.891	16.086	26.258	45.634	0.097	0.034	0.000	0.000	2.735	my8036_rel.cz11c_bee
0.000	0.000	0.000	81.332	16.731	1.936	0.000	0.000	0.000	0.000	0.166	my8036_rel.cz11d_bee
l.i2
- l.i2: continue load after secondary indexes created with 5 inserts per transaction
- Legend for results is here.
- Each entry lists the percentage of responses that fit in that bucket (slower than max time for previous bucket, faster than min time for next bucket).
Insert response time histogram
256us	1ms	4ms	16ms	64ms	256ms	1s	4s	16s	gt	max	tag
0.000	2.140	54.455	42.459	0.945	0.001	0.000	0.000	0.000	0.000	0.077	my5651_rel.cz11a_bee
0.000	4.120	82.502	12.923	0.454	0.000	0.000	0.000	0.000	0.000	0.063	my5744_rel.cz11a_bee
0.000	3.010	90.628	5.804	0.557	0.000	0.000	0.000	0.000	0.000	0.059	my8036_rel.cz11a_bee
0.000	0.402	23.755	13.065	33.832	27.488	1.459	0.000	0.000	0.000	0.813	my8036_rel.cz11b_bee
0.000	0.170	3.970	6.892	41.760	41.867	5.197	0.144	0.000	0.000	1.729	my8036_rel.cz11c_bee
0.000	0.001	93.521	5.389	1.085	0.003	0.000	0.000	0.000	0.000	0.088	my8036_rel.cz11d_bee
Delete response time histogram
256us	1ms	4ms	16ms	64ms	256ms	1s	4s	16s	gt	max	tag
0.000	47.191	49.172	3.573	0.064	0.000	0.000	0.000	0.000	0.000	0.044	my5651_rel.cz11a_bee
0.000	97.271	2.335	0.383	0.011	0.000	0.000	0.000	0.000	0.000	0.043	my5744_rel.cz11a_bee
0.000	25.944	73.442	0.575	0.039	0.000	0.000	0.000	0.000	0.000	0.049	my8036_rel.cz11a_bee
0.000	38.341	26.948	20.459	14.006	0.239	0.005	0.001	0.000	0.000	1.020	my8036_rel.cz11b_bee
0.000	27.592	21.134	29.038	21.890	0.331	0.013	0.002	0.000	0.000	2.280	my8036_rel.cz11c_bee
0.000	0.005	94.781	4.729	0.483	0.001	0.000	0.000	0.000	0.000	0.069	my8036_rel.cz11d_bee
qr100.L1
- qr100.L1: range queries with 100 insert/s per client
- Legend for results is here.
- Each entry lists the percentage of responses that fit in that bucket (slower than max time for previous bucket, faster than min time for next bucket).
Query response time histogram
256us	1ms	4ms	16ms	64ms	256ms	1s	4s	16s	gt	max	tag
95.434	4.256	0.287	0.023	nonzero	0.000	0.000	0.000	0.000	0.000	0.028	my5651_rel.cz11a_bee
71.321	28.516	0.148	0.015	nonzero	0.000	0.000	0.000	0.000	0.000	0.018	my5744_rel.cz11a_bee
59.837	40.159	0.003	0.001	0.000	0.000	0.000	0.000	0.000	0.000	0.010	my8036_rel.cz11a_bee
34.595	62.297	1.922	1.103	0.081	0.001	nonzero	0.000	0.000	0.000	0.683	my8036_rel.cz11b_bee
57.729	41.692	0.116	0.377	0.083	0.003	0.001	nonzero	0.000	0.000	1.379	my8036_rel.cz11c_bee
62.047	37.951	0.002	0.001	0.000	0.000	0.000	0.000	0.000	0.000	0.010	my8036_rel.cz11d_bee
Insert response time histogram
256us	1ms	4ms	16ms	64ms	256ms	1s	4s	16s	gt	max	tag
0.000	0.000	0.000	34.556	64.389	1.056	0.000	0.000	0.000	0.000	0.093	my5651_rel.cz11a_bee
0.000	0.000	0.000	58.528	41.472	0.000	0.000	0.000	0.000	0.000	0.035	my5744_rel.cz11a_bee
0.000	0.000	0.000	9.333	90.667	0.000	0.000	0.000	0.000	0.000	0.038	my8036_rel.cz11a_bee
0.000	0.000	0.000	0.722	5.778	24.861	66.944	1.694	0.000	0.000	3.518	my8036_rel.cz11b_bee
0.000	0.000	0.000	0.000	2.389	17.028	71.861	6.694	2.028	0.000	7.060	my8036_rel.cz11c_bee
0.000	0.000	0.000	0.000	100.000	0.000	0.000	0.000	0.000	0.000	0.044	my8036_rel.cz11d_bee
Delete response time histogram
256us	1ms	4ms	16ms	64ms	256ms	1s	4s	16s	gt	max	tag
0.000	0.000	15.083	41.389	43.500	0.028	0.000	0.000	0.000	0.000	0.064	my5651_rel.cz11a_bee
0.000	0.000	99.167	0.833	0.000	0.000	0.000	0.000	0.000	0.000	0.012	my5744_rel.cz11a_bee
0.000	0.000	97.250	2.750	0.000	0.000	0.000	0.000	0.000	0.000	0.013	my8036_rel.cz11a_bee
0.000	0.000	11.778	5.000	43.028	40.167	0.028	0.000	0.000	0.000	0.278	my8036_rel.cz11b_bee
0.000	0.000	13.056	13.889	43.889	29.167	0.000	0.000	0.000	0.000	0.250	my8036_rel.cz11c_bee
0.000	0.000	0.000	58.111	41.889	0.000	0.000	0.000	0.000	0.000	0.038	my8036_rel.cz11d_bee
qp100.L2
- qp100.L2: point queries with 100 insert/s per client
- Legend for results is here.
- Each entry lists the percentage of responses that fit in that bucket (slower than max time for previous bucket, faster than min time for next bucket).
Query response time histogram
256us	1ms	4ms	16ms	64ms	256ms	1s	4s	16s	gt	max	tag
0.000	0.498	99.041	0.459	0.001	0.000	0.000	0.000	0.000	0.000	0.039	my5651_rel.cz11a_bee
0.000	0.344	99.347	0.309	0.001	0.000	0.000	0.000	0.000	0.000	0.039	my5744_rel.cz11a_bee
0.000	0.116	99.635	0.247	0.001	0.000	0.000	0.000	0.000	0.000	0.046	my8036_rel.cz11a_bee
0.000	0.000	26.387	13.219	43.264	17.108	0.023	0.000	0.000	0.000	0.313	my8036_rel.cz11b_bee
0.000	0.000	7.047	7.523	50.720	32.347	2.362	0.000	0.000	0.000	0.859	my8036_rel.cz11c_bee
0.000	0.095	99.533	0.370	0.002	0.000	0.000	0.000	0.000	0.000	0.044	my8036_rel.cz11d_bee
Insert response time histogram
256us	1ms	4ms	16ms	64ms	256ms	1s	4s	16s	gt	max	tag
0.000	0.000	0.000	16.667	80.639	2.694	0.000	0.000	0.000	0.000	0.089	my5651_rel.cz11a_bee
0.000	0.000	0.000	79.833	20.167	0.000	0.000	0.000	0.000	0.000	0.029	my5744_rel.cz11a_bee
0.000	0.000	0.000	7.417	92.583	0.000	0.000	0.000	0.000	0.000	0.047	my8036_rel.cz11a_bee
0.000	0.000	0.000	0.028	10.944	23.139	63.194	2.694	0.000	0.000	1.557	my8036_rel.cz11b_bee
0.000	0.000	0.000	0.000	0.056	3.750	73.556	22.167	0.472	0.000	6.033	my8036_rel.cz11c_bee
0.000	0.000	0.000	0.000	99.917	0.083	0.000	0.000	0.000	0.000	0.068	my8036_rel.cz11d_bee
Delete response time histogram
256us	1ms	4ms	16ms	64ms	256ms	1s	4s	16s	gt	max	tag
0.000	0.000	44.000	45.250	10.722	0.028	0.000	0.000	0.000	0.000	0.076	my5651_rel.cz11a_bee
0.000	0.000	99.167	0.833	0.000	0.000	0.000	0.000	0.000	0.000	0.010	my5744_rel.cz11a_bee
0.000	0.000	98.250	1.694	0.056	0.000	0.000	0.000	0.000	0.000	0.022	my8036_rel.cz11a_bee
0.000	0.000	20.639	6.583	16.861	55.806	0.111	0.000	0.000	0.000	0.561	my8036_rel.cz11b_bee
0.000	0.000	6.944	12.750	44.750	35.417	0.111	0.028	0.000	0.000	2.209	my8036_rel.cz11c_bee
0.000	0.000	0.000	63.222	36.778	0.000	0.000	0.000	0.000	0.000	0.060	my8036_rel.cz11d_bee
qr500.L3
- qr500.L3: range queries with 500 insert/s per client
- Legend for results is here.
- Each entry lists the percentage of responses that fit in that bucket (slower than max time for previous bucket, faster than min time for next bucket).
Query response time histogram
256us	1ms	4ms	16ms	64ms	256ms	1s	4s	16s	gt	max	tag
91.691	7.253	1.005	0.051	nonzero	0.000	0.000	0.000	0.000	0.000	0.032	my5651_rel.cz11a_bee
75.176	24.635	0.164	0.025	0.000	0.000	0.000	0.000	0.000	0.000	0.013	my5744_rel.cz11a_bee
65.916	34.074	0.008	0.001	0.000	0.000	0.000	0.000	0.000	0.000	0.013	my8036_rel.cz11a_bee
31.769	64.360	2.982	0.817	0.071	0.002	nonzero	0.000	0.000	0.000	0.548	my8036_rel.cz11b_bee
61.759	37.970	0.056	0.166	0.045	0.003	0.001	nonzero	0.000	0.000	1.184	my8036_rel.cz11c_bee
67.386	32.609	0.005	0.001	0.000	0.000	0.000	0.000	0.000	0.000	0.010	my8036_rel.cz11d_bee
Insert response time histogram
256us	1ms	4ms	16ms	64ms	256ms	1s	4s	16s	gt	max	tag
0.000	0.000	0.000	47.511	51.767	0.722	0.000	0.000	0.000	0.000	0.136	my5651_rel.cz11a_bee
0.000	0.000	0.000	89.006	10.994	0.000	0.000	0.000	0.000	0.000	0.054	my5744_rel.cz11a_bee
0.000	0.000	0.000	59.089	40.906	0.006	0.000	0.000	0.000	0.000	0.112	my8036_rel.cz11a_bee
0.000	0.000	0.000	0.089	8.283	27.939	57.817	5.872	0.000	0.000	3.488	my8036_rel.cz11b_bee
0.000	0.000	0.000	0.000	1.050	21.756	59.650	14.150	3.394	0.000	7.383	my8036_rel.cz11c_bee
0.000	0.000	0.000	0.044	99.956	0.000	0.000	0.000	0.000	0.000	0.048	my8036_rel.cz11d_bee
Delete response time histogram
256us	1ms	4ms	16ms	64ms	256ms	1s	4s	16s	gt	max	tag
0.000	0.000	12.361	30.328	57.300	0.011	0.000	0.000	0.000	0.000	0.070	my5651_rel.cz11a_bee
0.000	0.000	92.550	7.450	0.000	0.000	0.000	0.000	0.000	0.000	0.014	my5744_rel.cz11a_bee
0.000	0.000	96.756	3.228	0.011	0.006	0.000	0.000	0.000	0.000	0.105	my8036_rel.cz11a_bee
0.000	0.000	23.817	12.561	21.683	41.789	0.150	0.000	0.000	0.000	0.368	my8036_rel.cz11b_bee
0.000	0.000	18.022	22.972	32.678	26.222	0.106	0.000	0.000	0.000	0.424	my8036_rel.cz11c_bee
0.000	0.000	0.000	86.494	13.506	0.000	0.000	0.000	0.000	0.000	0.036	my8036_rel.cz11d_bee
qp500.L4
- qp500.L4: point queries with 500 insert/s per client
- Legend for results is here.
- Each entry lists the percentage of responses that fit in that bucket (slower than max time for previous bucket, faster than min time for next bucket).
Query response time histogram
256us	1ms	4ms	16ms	64ms	256ms	1s	4s	16s	gt	max	tag
0.000	0.017	97.147	2.829	0.007	0.000	0.000	0.000	0.000	0.000	0.041	my5651_rel.cz11a_bee
0.000	0.021	97.583	2.389	0.006	0.000	0.000	0.000	0.000	0.000	0.044	my5744_rel.cz11a_bee
0.000	0.004	98.711	1.232	0.052	0.000	0.000	0.000	0.000	0.000	0.052	my8036_rel.cz11a_bee
0.000	0.000	23.112	11.516	45.009	20.315	0.048	0.000	0.000	0.000	0.486	my8036_rel.cz11b_bee
0.000	0.000	4.357	6.255	50.034	37.089	2.265	0.000	0.000	0.000	0.826	my8036_rel.cz11c_bee
0.000	0.004	98.441	1.542	0.014	0.000	0.000	0.000	0.000	0.000	0.051	my8036_rel.cz11d_bee
Insert response time histogram
256us	1ms	4ms	16ms	64ms	256ms	1s	4s	16s	gt	max	tag
0.000	0.000	0.000	49.911	40.933	9.156	0.000	0.000	0.000	0.000	0.172	my5651_rel.cz11a_bee
0.000	0.000	0.000	75.744	24.100	0.156	0.000	0.000	0.000	0.000	0.086	my5744_rel.cz11a_bee
0.000	0.000	0.000	63.372	36.500	0.128	0.000	0.000	0.000	0.000	0.086	my8036_rel.cz11a_bee
0.000	0.000	0.000	0.522	18.661	23.478	53.583	3.756	0.000	0.000	2.375	my8036_rel.cz11b_bee
0.000	0.000	0.000	0.000	0.022	0.711	75.833	23.244	0.189	0.000	6.370	my8036_rel.cz11c_bee
0.000	0.000	0.000	0.322	99.172	0.506	0.000	0.000	0.000	0.000	0.103	my8036_rel.cz11d_bee
Delete response time histogram
256us	1ms	4ms	16ms	64ms	256ms	1s	4s	16s	gt	max	tag
0.000	0.000	16.411	30.389	52.106	1.094	0.000	0.000	0.000	0.000	0.130	my5651_rel.cz11a_bee
0.000	0.000	92.211	7.750	0.039	0.000	0.000	0.000	0.000	0.000	0.042	my5744_rel.cz11a_bee
0.000	0.000	95.667	4.261	0.072	0.000	0.000	0.000	0.000	0.000	0.039	my8036_rel.cz11a_bee
0.000	0.000	19.628	19.339	18.461	42.433	0.139	0.000	0.000	0.000	0.915	my8036_rel.cz11b_bee
0.000	0.000	4.172	12.650	40.244	42.733	0.189	0.011	0.000	0.000	1.857	my8036_rel.cz11c_bee
0.000	0.000	0.000	85.533	14.389	0.078	0.000	0.000	0.000	0.000	0.096	my8036_rel.cz11d_bee
qr1000.L5
- qr1000.L5: range queries with 1000 insert/s per client
- Legend for results is here.
- Each entry lists the percentage of responses that fit in that bucket (slower than max time for previous bucket, faster than min time for next bucket).
Query response time histogram
256us	1ms	4ms	16ms	64ms	256ms	1s	4s	16s	gt	max	tag
84.423	13.196	2.254	0.126	0.001	nonzero	0.000	0.000	0.000	0.000	0.083	my5651_rel.cz11a_bee
78.402	21.386	0.189	0.023	nonzero	0.000	0.000	0.000	0.000	0.000	0.034	my5744_rel.cz11a_bee
69.532	30.449	0.018	0.001	0.000	0.000	0.000	0.000	0.000	0.000	0.012	my8036_rel.cz11a_bee
26.184	69.105	3.481	1.118	0.108	0.002	0.001	0.000	0.000	0.000	0.678	my8036_rel.cz11b_bee
31.774	64.711	2.883	0.505	0.124	0.003	0.001	nonzero	0.000	0.000	1.333	my8036_rel.cz11c_bee
71.211	28.767	0.020	0.001	0.000	0.000	0.000	0.000	0.000	0.000	0.011	my8036_rel.cz11d_bee
Insert response time histogram
256us	1ms	4ms	16ms	64ms	256ms	1s	4s	16s	gt	max	tag
0.000	0.000	0.000	20.769	77.033	2.197	0.000	0.000	0.000	0.000	0.182	my5651_rel.cz11a_bee
0.000	0.000	0.000	89.494	10.486	0.019	0.000	0.000	0.000	0.000	0.082	my5744_rel.cz11a_bee
0.000	0.000	0.000	81.617	18.353	0.031	0.000	0.000	0.000	0.000	0.112	my8036_rel.cz11a_bee
0.000	0.000	0.000	1.297	13.947	23.656	56.628	4.472	0.000	0.000	2.808	my8036_rel.cz11b_bee
0.000	0.000	0.000	0.000	0.028	1.156	85.000	12.667	1.150	0.000	6.508	my8036_rel.cz11c_bee
0.000	0.000	0.000	0.328	99.669	0.003	0.000	0.000	0.000	0.000	0.068	my8036_rel.cz11d_bee
Delete response time histogram
256us	1ms	4ms	16ms	64ms	256ms	1s	4s	16s	gt	max	tag
0.000	0.000	30.503	28.950	40.286	0.261	0.000	0.000	0.000	0.000	0.113	my5651_rel.cz11a_bee
0.000	0.000	98.083	1.894	0.022	0.000	0.000	0.000	0.000	0.000	0.026	my5744_rel.cz11a_bee
0.000	0.000	94.700	5.278	0.022	0.000	0.000	0.000	0.000	0.000	0.028	my8036_rel.cz11a_bee
0.000	0.000	16.081	17.953	25.950	39.956	0.061	0.000	0.000	0.000	0.434	my8036_rel.cz11b_bee
0.000	0.000	0.597	6.708	28.325	62.828	1.542	0.000	0.000	0.000	0.817	my8036_rel.cz11c_bee
0.000	0.000	0.000	74.931	25.069	0.000	0.000	0.000	0.000	0.000	0.059	my8036_rel.cz11d_bee
qp1000.L6
- qp1000.L6: point queries with 1000 insert/s per client
- Legend for results is here.
- Each entry lists the percentage of responses that fit in that bucket (slower than max time for previous bucket, faster than min time for next bucket).
Query response time histogram
256us	1ms	4ms	16ms	64ms	256ms	1s	4s	16s	gt	max	tag
0.000	0.002	92.092	7.886	0.020	0.000	0.000	0.000	0.000	0.000	0.058	my5651_rel.cz11a_bee
0.000	0.003	95.009	4.975	0.013	0.000	0.000	0.000	0.000	0.000	0.041	my5744_rel.cz11a_bee
0.000	0.001	97.492	2.400	0.108	0.000	0.000	0.000	0.000	0.000	0.064	my8036_rel.cz11a_bee
0.000	0.000	22.471	10.407	46.056	21.024	0.042	0.000	0.000	0.000	0.343	my8036_rel.cz11b_bee
0.000	0.000	4.206	6.126	49.262	37.729	2.677	0.000	0.000	0.000	0.608	my8036_rel.cz11c_bee
0.000	0.001	97.169	2.790	0.040	0.000	0.000	0.000	0.000	0.000	0.051	my8036_rel.cz11d_bee
Insert response time histogram
256us	1ms	4ms	16ms	64ms	256ms	1s	4s	16s	gt	max	tag
0.000	0.000	0.000	3.567	88.656	7.778	0.000	0.000	0.000	0.000	0.189	my5651_rel.cz11a_bee
0.000	0.000	0.000	78.417	21.469	0.114	0.000	0.000	0.000	0.000	0.086	my5744_rel.cz11a_bee
0.000	0.000	0.000	78.289	21.511	0.200	0.000	0.000	0.000	0.000	0.103	my8036_rel.cz11a_bee
0.000	0.000	0.000	3.572	20.069	21.694	53.831	0.833	0.000	0.000	1.625	my8036_rel.cz11b_bee
0.000	0.000	0.000	0.000	0.014	1.783	83.297	14.906	0.000	0.000	3.375	my8036_rel.cz11c_bee
0.000	0.000	0.000	1.133	98.536	0.331	0.000	0.000	0.000	0.000	0.096	my8036_rel.cz11d_bee
Delete response time histogram
256us	1ms	4ms	16ms	64ms	256ms	1s	4s	16s	gt	max	tag
0.000	0.000	24.997	34.694	39.408	0.900	0.000	0.000	0.000	0.000	0.135	my5651_rel.cz11a_bee
0.000	0.000	96.864	3.117	0.019	0.000	0.000	0.000	0.000	0.000	0.045	my5744_rel.cz11a_bee
0.000	0.000	94.611	5.283	0.106	0.000	0.000	0.000	0.000	0.000	0.050	my8036_rel.cz11a_bee
0.000	0.000	9.558	24.539	21.083	44.669	0.147	0.003	0.000	0.000	1.002	my8036_rel.cz11b_bee
0.000	0.000	0.150	7.753	25.861	64.528	1.683	0.025	0.000	0.000	2.131	my8036_rel.cz11c_bee
0.000	0.000	0.000	82.181	17.667	0.153	0.000	0.000	0.000	0.000	0.089	my8036_rel.cz11d_bee