Introduction
This is a report for the insert benchmark with 800M docs and 1 client(s). It is generated by scripts (bash, awk, sed) and Tufte might not be impressed. An overview of the insert benchmark is here and a short update is here. Below, by DBMS, I mean DBMS+version.config. An example is my8020.c10b40 where my means MySQL, 8020 is version 8.0.20 and c10b40 is the name for the configuration file.
The test server has 8 AMD cores, 16G RAM and an NVMe SSD. It is described here as the Beelink. The benchmark was run with 1 client and there were 1 or 3 connections per client (1 for queries or inserts without rate limits, 1+1 for rate limited inserts+deletes). It uses 1 table. It loads 800M rows per table without secondary indexes, creates 3 secondary indexes per table, then inserts 4m+1m rows per table with a delete per insert to avoid growing the table. It then does 6 read+write tests for 1800s each that do queries as fast as possible with 100,100,500,500,1000,1000 inserts/s and the same for deletes/s per client concurrent with the queries. The database is larger than memory. Clients and the DBMS share one server. The per-database configs are in the per-database subdirectories here.
The tested DBMS are:
- ma110401_rel.cz11b_bee - MariaDB 11.4.1 with the cz11b_bee config that uses innodb_flush_method=O_DIRECT
- ma110401_rel.cz11bpur1_bee - MariaDB 11.4.1 with the cz11b_bee config that uses innodb_flush_method=O_DIRECT and innodb_purge_threads=1
- ma110401_rel.cz11c_bee - MariaDB 11.4.1 with the cz11c_bee config that uses innodb_flush_method=fsync
Contents
- Summary
- l.i0: load without secondary indexes
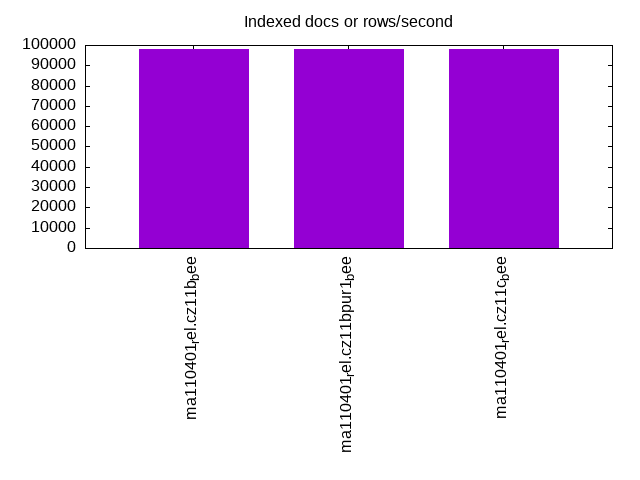
- l.x: create secondary indexes
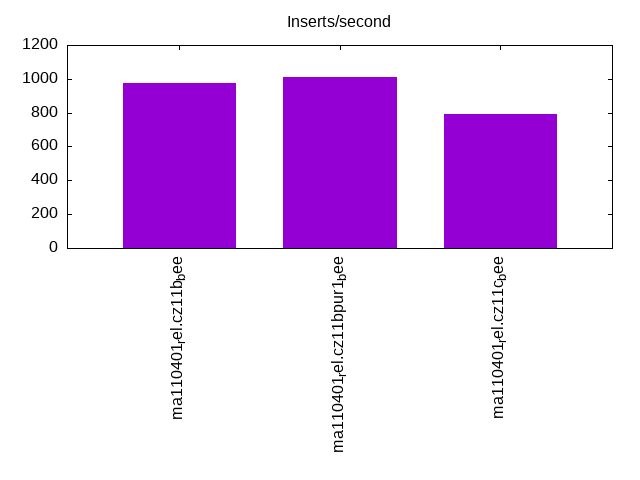
- l.i1: continue load after secondary indexes created with 50 inserts per transaction
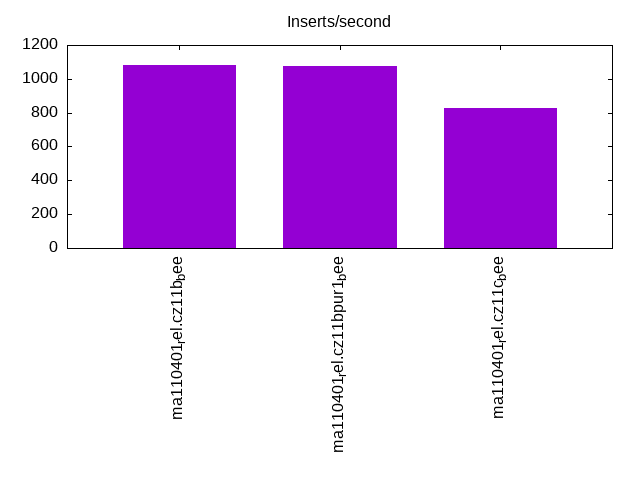
- l.i2: continue load after secondary indexes created with 5 inserts per transaction
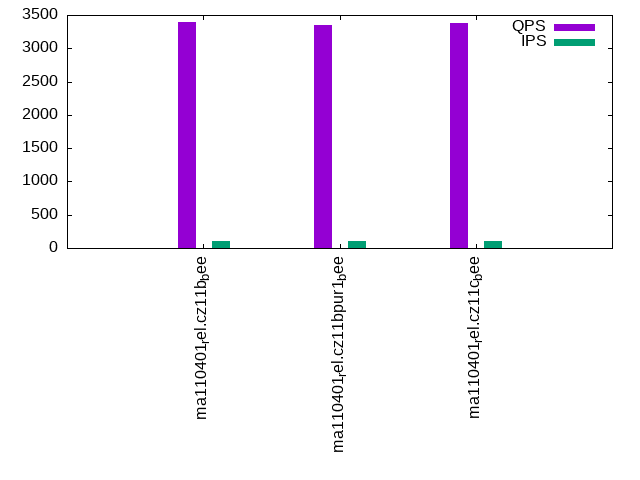
- qr100.L1: range queries with 100 insert/s per client
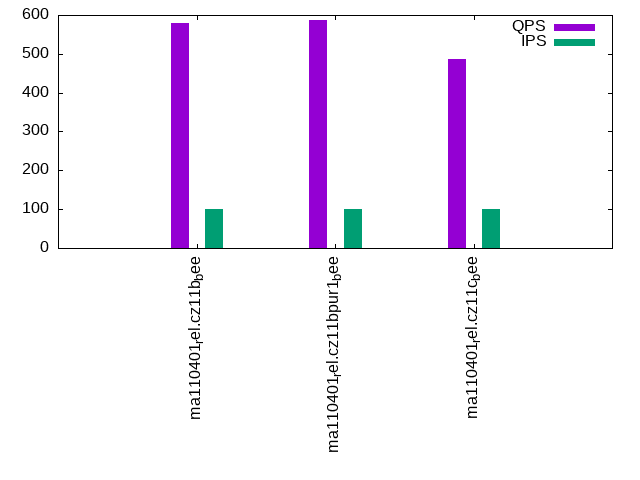
- qp100.L2: point queries with 100 insert/s per client
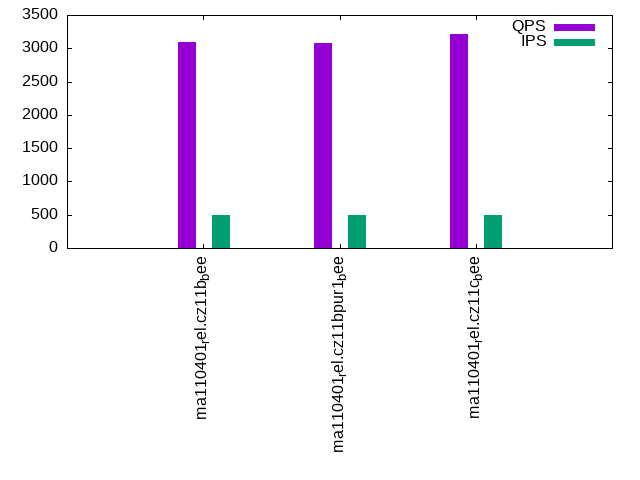
- qr500.L3: range queries with 500 insert/s per client
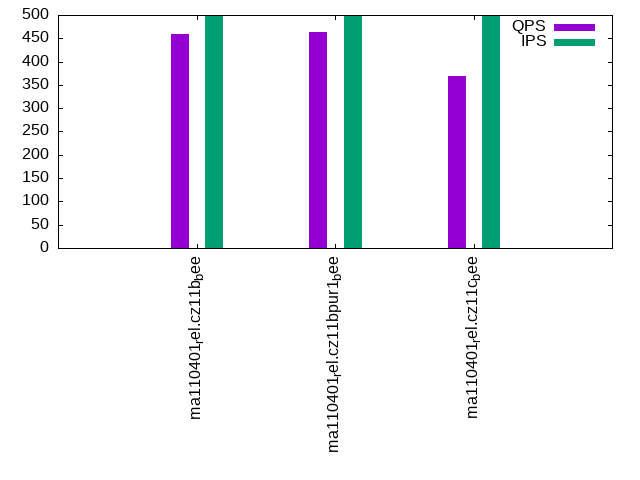
- qp500.L4: point queries with 500 insert/s per client
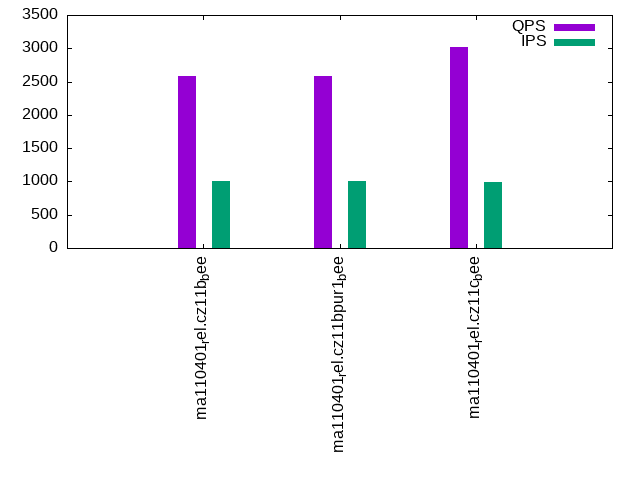
- qr1000.L5: range queries with 1000 insert/s per client
- qp1000.L6: point queries with 1000 insert/s per client
Summary
The numbers are inserts/s for l.i0, l.i1 and l.i2, indexed docs (or rows) /s for l.x and queries/s for qr100, qp100 thru qr1000, qp1000" The values are the average rate over the entire test for inserts (IPS) and queries (QPS). The range of values for IPS and QPS is split into 3 parts: bottom 25%, middle 50%, top 25%. Values in the bottom 25% have a red background, values in the top 25% have a green background and values in the middle have no color. A gray background is used for values that can be ignored because the DBMS did not sustain the target insert rate. Red backgrounds are not used when the minimum value is within 80% of the max value.
| dbms | l.i0 | l.x | l.i1 | l.i2 | qr100 | qp100 | qr500 | qp500 | qr1000 | qp1000 |
|---|---|---|---|---|---|---|---|---|---|---|
| ma110401_rel.cz11b_bee | 76431 | 97931 | 978 | 1081 | 3393 | 579 | 3098 | 460 | 2584 | 367 |
| ma110401_rel.cz11bpur1_bee | 77783 | 97811 | 1013 | 1075 | 3353 | 586 | 3085 | 464 | 2586 | 369 |
| ma110401_rel.cz11c_bee | 75636 | 97943 | 795 | 830 | 3375 | 487 | 3213 | 369 | 3022 | 281 |
This table has relative throughput, throughput for the DBMS relative to the DBMS in the first line, using the absolute throughput from the previous table. Values less than 0.95 have a yellow background. Values greater than 1.05 have a blue background.
| dbms | l.i0 | l.x | l.i1 | l.i2 | qr100 | qp100 | qr500 | qp500 | qr1000 | qp1000 |
|---|---|---|---|---|---|---|---|---|---|---|
| ma110401_rel.cz11b_bee | 1.00 | 1.00 | 1.00 | 1.00 | 1.00 | 1.00 | 1.00 | 1.00 | 1.00 | 1.00 |
| ma110401_rel.cz11bpur1_bee | 1.02 | 1.00 | 1.04 | 0.99 | 0.99 | 1.01 | 1.00 | 1.01 | 1.00 | 1.01 |
| ma110401_rel.cz11c_bee | 0.99 | 1.00 | 0.81 | 0.77 | 0.99 | 0.84 | 1.04 | 0.80 | 1.17 | 0.77 |
This lists the average rate of inserts/s for the tests that do inserts concurrent with queries. For such tests the query rate is listed in the table above. The read+write tests are setup so that the insert rate should match the target rate every second. Cells that are not at least 95% of the target have a red background to indicate a failure to satisfy the target.
| dbms | qr100.L1 | qp100.L2 | qr500.L3 | qp500.L4 | qr1000.L5 | qp1000.L6 |
|---|---|---|---|---|---|---|
| ma110401_rel.cz11b_bee | 100 | 100 | 499 | 499 | 999 | 999 |
| ma110401_rel.cz11bpur1_bee | 100 | 100 | 499 | 499 | 999 | 999 |
| ma110401_rel.cz11c_bee | 100 | 100 | 499 | 499 | 993 | 982 |
| target | 100 | 100 | 500 | 500 | 1000 | 1000 |
l.i0
l.i0: load without secondary indexes. Graphs for performance per 1-second interval are here.
Average throughput:

Insert response time histogram: each cell has the percentage of responses that take <= the time in the header and max is the max response time in seconds. For the max column values in the top 25% of the range have a red background and in the bottom 25% of the range have a green background. The red background is not used when the min value is within 80% of the max value.
| dbms | 256us | 1ms | 4ms | 16ms | 64ms | 256ms | 1s | 4s | 16s | gt | max |
|---|---|---|---|---|---|---|---|---|---|---|---|
| ma110401_rel.cz11b_bee | 0.195 | 99.544 | 0.216 | 0.040 | 0.005 | 0.198 | |||||
| ma110401_rel.cz11bpur1_bee | 0.445 | 99.296 | 0.213 | 0.042 | 0.005 | 0.253 | |||||
| ma110401_rel.cz11c_bee | 0.410 | 99.318 | 0.204 | 0.044 | 0.024 | nonzero | 0.340 |
Performance metrics for the DBMS listed above. Some are normalized by throughput, others are not. Legend for results is here.
ips	qps	rps	rmbps	wps	wmbps	rpq	rkbpq	wpi	wkbpi	csps	cpups	cspq	cpupq	dbgb1	dbgb2	rss	maxop	p50	p99	tag
76431	0	585	2.3	385.5	22.4	0.008	0.031	0.005	0.300	12003	25.5	0.157	27	52.6	68.4	10.3	0.198	76515	66726	ma110401_rel.cz11b_bee
77783	0	595	2.3	392.2	22.8	0.008	0.031	0.005	0.300	11531	25.4	0.148	26	52.6	68.4	10.3	0.253	77814	67523	ma110401_rel.cz11bpur1_bee
75636	0	579	2.3	79.4	22.1	0.008	0.031	0.001	0.300	11855	25.2	0.157	27	52.6	68.4	10.3	0.340	77114	58633	ma110401_rel.cz11c_bee
l.x
l.x: create secondary indexes.
Average throughput:
Performance metrics for the DBMS listed above. Some are normalized by throughput, others are not. Legend for results is here.
ips	qps	rps	rmbps	wps	wmbps	rpq	rkbpq	wpi	wkbpi	csps	cpups	cspq	cpupq	dbgb1	dbgb2	rss	maxop	p50	p99	tag
97931	0	630	98.9	718.3	110.0	0.006	1.035	0.007	1.150	3284	11.9	0.034	10	119.9	135.7	10.3	0.003	NA	NA	ma110401_rel.cz11b_bee
97811	0	638	98.8	731.1	110.0	0.007	1.035	0.007	1.151	3294	11.9	0.034	10	119.9	135.7	10.3	0.002	NA	NA	ma110401_rel.cz11bpur1_bee
97943	0	317	98.9	288.3	110.1	0.003	1.034	0.003	1.151	2547	12.0	0.026	10	119.9	135.7	10.3	0.002	NA	NA	ma110401_rel.cz11c_bee
l.i1
l.i1: continue load after secondary indexes created with 50 inserts per transaction. Graphs for performance per 1-second interval are here.
Average throughput:
Insert response time histogram: each cell has the percentage of responses that take <= the time in the header and max is the max response time in seconds. For the max column values in the top 25% of the range have a red background and in the bottom 25% of the range have a green background. The red background is not used when the min value is within 80% of the max value.
| dbms | 256us | 1ms | 4ms | 16ms | 64ms | 256ms | 1s | 4s | 16s | gt | max |
|---|---|---|---|---|---|---|---|---|---|---|---|
| ma110401_rel.cz11b_bee | 77.763 | 22.236 | 0.001 | 4.258 | |||||||
| ma110401_rel.cz11bpur1_bee | 80.478 | 19.516 | 0.005 | 0.001 | 3.651 | ||||||
| ma110401_rel.cz11c_bee | 70.329 | 28.871 | 0.799 | 0.001 | 6.793 |
Delete response time histogram: each cell has the percentage of responses that take <= the time in the header and max is the max response time in seconds. For the max column values in the top 25% of the range have a red background and in the bottom 25% of the range have a green background. The red background is not used when the min value is within 80% of the max value.
| dbms | 256us | 1ms | 4ms | 16ms | 64ms | 256ms | 1s | 4s | 16s | gt | max |
|---|---|---|---|---|---|---|---|---|---|---|---|
| ma110401_rel.cz11b_bee | 3.148 | 89.179 | 7.673 | 0.001 | 4.147 | ||||||
| ma110401_rel.cz11bpur1_bee | 5.929 | 86.510 | 7.559 | 0.001 | 0.001 | 3.593 | |||||
| ma110401_rel.cz11c_bee | 2.756 | 93.695 | 3.097 | 0.450 | 0.001 | 6.636 |
Performance metrics for the DBMS listed above. Some are normalized by throughput, others are not. Legend for results is here.
ips	qps	rps	rmbps	wps	wmbps	rpq	rkbpq	wpi	wkbpi	csps	cpups	cspq	cpupq	dbgb1	dbgb2	rss	maxop	p50	p99	tag
978	0	6296	97.8	5847.9	169.9	6.439	102.390	5.980	177.928	55315	10.6	56.565	867	144.4	160.2	10.1	4.258	949	599	ma110401_rel.cz11b_bee
1013	0	6518	101.2	6039.4	176.0	6.435	102.330	5.962	177.944	57233	10.8	56.504	853	144.4	160.2	10.1	3.651	999	599	ma110401_rel.cz11bpur1_bee
795	0	5033	88.3	4251.2	139.9	6.329	113.696	5.346	180.208	54230	12.6	68.197	1268	144.4	160.2	10.1	6.793	799	350	ma110401_rel.cz11c_bee
l.i2
l.i2: continue load after secondary indexes created with 5 inserts per transaction. Graphs for performance per 1-second interval are here.
Average throughput:
Insert response time histogram: each cell has the percentage of responses that take <= the time in the header and max is the max response time in seconds. For the max column values in the top 25% of the range have a red background and in the bottom 25% of the range have a green background. The red background is not used when the min value is within 80% of the max value.
| dbms | 256us | 1ms | 4ms | 16ms | 64ms | 256ms | 1s | 4s | 16s | gt | max |
|---|---|---|---|---|---|---|---|---|---|---|---|
| ma110401_rel.cz11b_bee | 0.003 | 68.868 | 29.822 | 0.546 | 0.762 | 0.155 | |||||
| ma110401_rel.cz11bpur1_bee | 0.003 | 68.743 | 29.927 | 0.566 | 0.762 | 0.135 | |||||
| ma110401_rel.cz11c_bee | 40.135 | 57.491 | 1.593 | 0.780 | 0.002 | 0.400 |
Delete response time histogram: each cell has the percentage of responses that take <= the time in the header and max is the max response time in seconds. For the max column values in the top 25% of the range have a red background and in the bottom 25% of the range have a green background. The red background is not used when the min value is within 80% of the max value.
| dbms | 256us | 1ms | 4ms | 16ms | 64ms | 256ms | 1s | 4s | 16s | gt | max |
|---|---|---|---|---|---|---|---|---|---|---|---|
| ma110401_rel.cz11b_bee | 0.009 | 77.700 | 21.218 | 0.376 | 0.697 | 0.155 | |||||
| ma110401_rel.cz11bpur1_bee | 0.007 | 77.549 | 21.341 | 0.403 | 0.700 | 0.132 | |||||
| ma110401_rel.cz11c_bee | 72.166 | 26.337 | 0.874 | 0.622 | 0.001 | 0.384 |
Performance metrics for the DBMS listed above. Some are normalized by throughput, others are not. Legend for results is here.
ips	qps	rps	rmbps	wps	wmbps	rpq	rkbpq	wpi	wkbpi	csps	cpups	cspq	cpupq	dbgb1	dbgb2	rss	maxop	p50	p99	tag
1081	0	6696	100.7	5725.4	168.1	6.194	95.414	5.296	159.190	59109	13.4	54.680	992	144.4	160.2	10.1	0.155	1094	799	ma110401_rel.cz11b_bee
1075	0	6665	100.3	5697.7	167.7	6.199	95.502	5.299	159.676	58578	13.4	54.481	997	144.4	160.2	10.1	0.135	1094	794	ma110401_rel.cz11bpur1_bee
830	0	5106	79.1	4308.0	128.7	6.153	97.571	5.192	158.849	52637	14.8	63.434	1427	144.4	160.2	8.8	0.400	869	369	ma110401_rel.cz11c_bee
qr100.L1
qr100.L1: range queries with 100 insert/s per client. Graphs for performance per 1-second interval are here.
Average throughput:
Query response time histogram: each cell has the percentage of responses that take <= the time in the header and max is the max response time in seconds. For max values in the top 25% of the range have a red background and in the bottom 25% of the range have a green background. The red background is not used when the min value is within 80% of the max value.
| dbms | 256us | 1ms | 4ms | 16ms | 64ms | 256ms | 1s | 4s | 16s | gt | max |
|---|---|---|---|---|---|---|---|---|---|---|---|
| ma110401_rel.cz11b_bee | 47.900 | 51.884 | 0.189 | 0.024 | 0.002 | 0.001 | 0.091 | ||||
| ma110401_rel.cz11bpur1_bee | 42.554 | 57.226 | 0.192 | 0.025 | 0.002 | 0.001 | 0.089 | ||||
| ma110401_rel.cz11c_bee | 45.429 | 54.332 | 0.199 | 0.036 | 0.003 | 0.001 | 0.137 |
Insert response time histogram: each cell has the percentage of responses that take <= the time in the header and max is the max response time in seconds. For max values in the top 25% of the range have a red background and in the bottom 25% of the range have a green background. The red background is not used when the min value is within 80% of the max value.
| dbms | 256us | 1ms | 4ms | 16ms | 64ms | 256ms | 1s | 4s | 16s | gt | max |
|---|---|---|---|---|---|---|---|---|---|---|---|
| ma110401_rel.cz11b_bee | 0.278 | 93.944 | 5.778 | 0.133 | |||||||
| ma110401_rel.cz11bpur1_bee | 0.167 | 94.111 | 5.722 | 0.126 | |||||||
| ma110401_rel.cz11c_bee | 93.417 | 6.583 | 0.185 |
Delete response time histogram: each cell has the percentage of responses that take <= the time in the header and max is the max response time in seconds. For max values in the top 25% of the range have a red background and in the bottom 25% of the range have a green background. The red background is not used when the min value is within 80% of the max value.
| dbms | 256us | 1ms | 4ms | 16ms | 64ms | 256ms | 1s | 4s | 16s | gt | max |
|---|---|---|---|---|---|---|---|---|---|---|---|
| ma110401_rel.cz11b_bee | 44.444 | 51.056 | 4.500 | 0.120 | |||||||
| ma110401_rel.cz11bpur1_bee | 45.306 | 50.222 | 4.472 | 0.122 | |||||||
| ma110401_rel.cz11c_bee | 27.833 | 67.250 | 4.917 | 0.160 |
Performance metrics for the DBMS listed above. Some are normalized by throughput, others are not. Legend for results is here.
ips	qps	rps	rmbps	wps	wmbps	rpq	rkbpq	wpi	wkbpi	csps	cpups	cspq	cpupq	dbgb1	dbgb2	rss	maxop	p50	p99	tag
100	3393	638	9.9	274.4	8.6	0.188	2.995	2.750	88.561	16777	13.1	4.944	309	144.4	160.2	10.1	0.091	3388	2637	ma110401_rel.cz11b_bee
100	3353	638	9.9	271.5	8.6	0.190	3.031	2.721	88.023	16610	13.0	4.954	310	144.4	160.2	10.1	0.089	3356	2557	ma110401_rel.cz11bpur1_bee
100	3375	628	10.4	271.0	8.6	0.186	3.154	2.719	88.391	17150	13.5	5.081	320	144.4	160.2	9.8	0.137	3372	2221	ma110401_rel.cz11c_bee
qp100.L2
qp100.L2: point queries with 100 insert/s per client. Graphs for performance per 1-second interval are here.
Average throughput:
Query response time histogram: each cell has the percentage of responses that take <= the time in the header and max is the max response time in seconds. For max values in the top 25% of the range have a red background and in the bottom 25% of the range have a green background. The red background is not used when the min value is within 80% of the max value.
| dbms | 256us | 1ms | 4ms | 16ms | 64ms | 256ms | 1s | 4s | 16s | gt | max |
|---|---|---|---|---|---|---|---|---|---|---|---|
| ma110401_rel.cz11b_bee | 0.247 | 98.701 | 0.656 | 0.391 | 0.005 | 0.085 | |||||
| ma110401_rel.cz11bpur1_bee | 0.232 | 99.015 | 0.360 | 0.388 | 0.005 | 0.084 | |||||
| ma110401_rel.cz11c_bee | 0.029 | 97.144 | 2.387 | 0.436 | 0.004 | 0.140 |
Insert response time histogram: each cell has the percentage of responses that take <= the time in the header and max is the max response time in seconds. For max values in the top 25% of the range have a red background and in the bottom 25% of the range have a green background. The red background is not used when the min value is within 80% of the max value.
| dbms | 256us | 1ms | 4ms | 16ms | 64ms | 256ms | 1s | 4s | 16s | gt | max |
|---|---|---|---|---|---|---|---|---|---|---|---|
| ma110401_rel.cz11b_bee | 93.611 | 6.389 | 0.103 | ||||||||
| ma110401_rel.cz11bpur1_bee | 97.278 | 2.722 | 0.102 | ||||||||
| ma110401_rel.cz11c_bee | 89.500 | 10.500 | 0.180 |
Delete response time histogram: each cell has the percentage of responses that take <= the time in the header and max is the max response time in seconds. For max values in the top 25% of the range have a red background and in the bottom 25% of the range have a green background. The red background is not used when the min value is within 80% of the max value.
| dbms | 256us | 1ms | 4ms | 16ms | 64ms | 256ms | 1s | 4s | 16s | gt | max |
|---|---|---|---|---|---|---|---|---|---|---|---|
| ma110401_rel.cz11b_bee | 13.333 | 83.611 | 3.056 | 0.099 | |||||||
| ma110401_rel.cz11bpur1_bee | 42.750 | 56.111 | 1.139 | 0.100 | |||||||
| ma110401_rel.cz11c_bee | 6.139 | 89.056 | 4.806 | 0.182 |
Performance metrics for the DBMS listed above. Some are normalized by throughput, others are not. Legend for results is here.
ips	qps	rps	rmbps	wps	wmbps	rpq	rkbpq	wpi	wkbpi	csps	cpups	cspq	cpupq	dbgb1	dbgb2	rss	maxop	p50	p99	tag
100	579	5774	90.2	755.4	21.8	9.969	159.400	7.569	223.314	18484	5.3	31.913	732	144.4	160.2	10.1	0.085	591	463	ma110401_rel.cz11b_bee
100	586	5826	91.0	758.2	21.9	9.951	159.113	7.598	224.778	18683	5.4	31.909	738	144.4	160.2	10.1	0.084	591	479	ma110401_rel.cz11bpur1_bee
100	487	4972	78.8	736.8	21.5	10.203	165.531	7.383	220.483	19667	6.2	40.358	1018	144.4	160.2	9.0	0.140	495	384	ma110401_rel.cz11c_bee
qr500.L3
qr500.L3: range queries with 500 insert/s per client. Graphs for performance per 1-second interval are here.
Average throughput:
Query response time histogram: each cell has the percentage of responses that take <= the time in the header and max is the max response time in seconds. For max values in the top 25% of the range have a red background and in the bottom 25% of the range have a green background. The red background is not used when the min value is within 80% of the max value.
| dbms | 256us | 1ms | 4ms | 16ms | 64ms | 256ms | 1s | 4s | 16s | gt | max |
|---|---|---|---|---|---|---|---|---|---|---|---|
| ma110401_rel.cz11b_bee | 42.379 | 57.147 | 0.397 | 0.057 | 0.010 | 0.010 | 0.086 | ||||
| ma110401_rel.cz11bpur1_bee | 39.149 | 60.386 | 0.385 | 0.060 | 0.010 | 0.010 | 0.088 | ||||
| ma110401_rel.cz11c_bee | 45.459 | 54.141 | 0.308 | 0.069 | 0.014 | 0.009 | 0.129 |
Insert response time histogram: each cell has the percentage of responses that take <= the time in the header and max is the max response time in seconds. For max values in the top 25% of the range have a red background and in the bottom 25% of the range have a green background. The red background is not used when the min value is within 80% of the max value.
| dbms | 256us | 1ms | 4ms | 16ms | 64ms | 256ms | 1s | 4s | 16s | gt | max |
|---|---|---|---|---|---|---|---|---|---|---|---|
| ma110401_rel.cz11b_bee | 0.222 | 91.161 | 8.617 | 0.129 | |||||||
| ma110401_rel.cz11bpur1_bee | 9.917 | 81.856 | 8.228 | 0.127 | |||||||
| ma110401_rel.cz11c_bee | 91.278 | 8.722 | 0.217 |
Delete response time histogram: each cell has the percentage of responses that take <= the time in the header and max is the max response time in seconds. For max values in the top 25% of the range have a red background and in the bottom 25% of the range have a green background. The red background is not used when the min value is within 80% of the max value.
| dbms | 256us | 1ms | 4ms | 16ms | 64ms | 256ms | 1s | 4s | 16s | gt | max |
|---|---|---|---|---|---|---|---|---|---|---|---|
| ma110401_rel.cz11b_bee | 51.222 | 41.372 | 7.406 | 0.117 | |||||||
| ma110401_rel.cz11bpur1_bee | 61.483 | 31.606 | 6.911 | 0.124 | |||||||
| ma110401_rel.cz11c_bee | 42.083 | 52.561 | 5.356 | 0.164 |
Performance metrics for the DBMS listed above. Some are normalized by throughput, others are not. Legend for results is here.
ips	qps	rps	rmbps	wps	wmbps	rpq	rkbpq	wpi	wkbpi	csps	cpups	cspq	cpupq	dbgb1	dbgb2	rss	maxop	p50	p99	tag
499	3098	2980	46.3	2369.3	70.3	0.962	15.309	4.747	144.284	35073	15.6	11.322	403	144.4	160.2	10.1	0.086	3116	1871	ma110401_rel.cz11b_bee
499	3085	2982	46.4	2365.8	70.4	0.967	15.386	4.740	144.502	35027	15.7	11.354	407	144.4	160.2	10.1	0.088	3100	1870	ma110401_rel.cz11bpur1_bee
499	3213	2927	47.2	2352.3	70.4	0.911	15.029	4.713	144.428	37530	18.1	11.682	451	144.4	160.2	8.8	0.129	3244	1534	ma110401_rel.cz11c_bee
qp500.L4
qp500.L4: point queries with 500 insert/s per client. Graphs for performance per 1-second interval are here.
Average throughput:
Query response time histogram: each cell has the percentage of responses that take <= the time in the header and max is the max response time in seconds. For max values in the top 25% of the range have a red background and in the bottom 25% of the range have a green background. The red background is not used when the min value is within 80% of the max value.
| dbms | 256us | 1ms | 4ms | 16ms | 64ms | 256ms | 1s | 4s | 16s | gt | max |
|---|---|---|---|---|---|---|---|---|---|---|---|
| ma110401_rel.cz11b_bee | 0.013 | 95.806 | 3.618 | 0.555 | 0.008 | 0.077 | |||||
| ma110401_rel.cz11bpur1_bee | 0.015 | 96.109 | 3.308 | 0.558 | 0.009 | 0.091 | |||||
| ma110401_rel.cz11c_bee | 0.001 | 90.771 | 8.706 | 0.509 | 0.013 | 0.196 |
Insert response time histogram: each cell has the percentage of responses that take <= the time in the header and max is the max response time in seconds. For max values in the top 25% of the range have a red background and in the bottom 25% of the range have a green background. The red background is not used when the min value is within 80% of the max value.
| dbms | 256us | 1ms | 4ms | 16ms | 64ms | 256ms | 1s | 4s | 16s | gt | max |
|---|---|---|---|---|---|---|---|---|---|---|---|
| ma110401_rel.cz11b_bee | 0.022 | 87.394 | 12.583 | 0.192 | |||||||
| ma110401_rel.cz11bpur1_bee | 6.339 | 85.183 | 8.478 | 0.151 | |||||||
| ma110401_rel.cz11c_bee | 85.406 | 14.583 | 0.011 | 0.437 |
Delete response time histogram: each cell has the percentage of responses that take <= the time in the header and max is the max response time in seconds. For max values in the top 25% of the range have a red background and in the bottom 25% of the range have a green background. The red background is not used when the min value is within 80% of the max value.
| dbms | 256us | 1ms | 4ms | 16ms | 64ms | 256ms | 1s | 4s | 16s | gt | max |
|---|---|---|---|---|---|---|---|---|---|---|---|
| ma110401_rel.cz11b_bee | 24.744 | 65.961 | 9.294 | 0.157 | |||||||
| ma110401_rel.cz11bpur1_bee | 52.456 | 40.817 | 6.728 | 0.131 | |||||||
| ma110401_rel.cz11c_bee | 13.017 | 79.867 | 7.106 | 0.011 | 0.447 |
Performance metrics for the DBMS listed above. Some are normalized by throughput, others are not. Legend for results is here.
ips	qps	rps	rmbps	wps	wmbps	rpq	rkbpq	wpi	wkbpi	csps	cpups	cspq	cpupq	dbgb1	dbgb2	rss	maxop	p50	p99	tag
499	460	7381	115.1	2626.0	77.4	16.028	255.890	5.261	158.806	35301	8.1	76.659	1407	144.4	160.2	10.1	0.077	463	400	ma110401_rel.cz11b_bee
499	464	7414	115.6	2640.3	78.1	15.964	254.892	5.290	160.195	34865	8.2	75.076	1413	144.4	160.2	10.1	0.091	463	416	ma110401_rel.cz11bpur1_bee
499	369	6485	102.5	2600.1	77.2	17.574	284.372	5.210	158.397	41573	11.4	112.664	2471	144.4	160.2	8.7	0.196	368	272	ma110401_rel.cz11c_bee
qr1000.L5
qr1000.L5: range queries with 1000 insert/s per client. Graphs for performance per 1-second interval are here.
Average throughput:
Query response time histogram: each cell has the percentage of responses that take <= the time in the header and max is the max response time in seconds. For max values in the top 25% of the range have a red background and in the bottom 25% of the range have a green background. The red background is not used when the min value is within 80% of the max value.
| dbms | 256us | 1ms | 4ms | 16ms | 64ms | 256ms | 1s | 4s | 16s | gt | max |
|---|---|---|---|---|---|---|---|---|---|---|---|
| ma110401_rel.cz11b_bee | 35.314 | 62.635 | 1.924 | 0.073 | 0.028 | 0.026 | 0.097 | ||||
| ma110401_rel.cz11bpur1_bee | 33.448 | 64.710 | 1.706 | 0.083 | 0.027 | 0.026 | 0.120 | ||||
| ma110401_rel.cz11c_bee | 47.002 | 52.009 | 0.844 | 0.115 | 0.023 | 0.008 | 0.133 |
Insert response time histogram: each cell has the percentage of responses that take <= the time in the header and max is the max response time in seconds. For max values in the top 25% of the range have a red background and in the bottom 25% of the range have a green background. The red background is not used when the min value is within 80% of the max value.
| dbms | 256us | 1ms | 4ms | 16ms | 64ms | 256ms | 1s | 4s | 16s | gt | max |
|---|---|---|---|---|---|---|---|---|---|---|---|
| ma110401_rel.cz11b_bee | 0.744 | 90.439 | 8.817 | 0.224 | |||||||
| ma110401_rel.cz11bpur1_bee | 4.478 | 86.889 | 8.633 | 0.156 | |||||||
| ma110401_rel.cz11c_bee | 93.992 | 5.994 | 0.014 | 0.305 |
Delete response time histogram: each cell has the percentage of responses that take <= the time in the header and max is the max response time in seconds. For max values in the top 25% of the range have a red background and in the bottom 25% of the range have a green background. The red background is not used when the min value is within 80% of the max value.
| dbms | 256us | 1ms | 4ms | 16ms | 64ms | 256ms | 1s | 4s | 16s | gt | max |
|---|---|---|---|---|---|---|---|---|---|---|---|
| ma110401_rel.cz11b_bee | 39.928 | 53.189 | 6.883 | 0.162 | |||||||
| ma110401_rel.cz11bpur1_bee | 45.603 | 47.653 | 6.744 | 0.143 | |||||||
| ma110401_rel.cz11c_bee | 6.225 | 90.942 | 2.831 | 0.003 | 0.283 |
Performance metrics for the DBMS listed above. Some are normalized by throughput, others are not. Legend for results is here.
ips	qps	rps	rmbps	wps	wmbps	rpq	rkbpq	wpi	wkbpi	csps	cpups	cspq	cpupq	dbgb1	dbgb2	rss	maxop	p50	p99	tag
999	2584	5691	88.4	4739.7	140.4	2.202	35.041	4.745	143.926	56117	18.1	21.717	560	144.4	160.2	10.1	0.097	2639	1247	ma110401_rel.cz11b_bee
999	2586	5698	88.5	4711.7	140.1	2.203	35.060	4.717	143.596	55812	18.2	21.583	563	144.4	160.2	10.1	0.120	2653	1183	ma110401_rel.cz11bpur1_bee
993	3022	5541	88.0	4703.9	140.2	1.834	29.828	4.738	144.628	66193	23.1	21.905	612	144.4	160.2	8.6	0.133	3100	1103	ma110401_rel.cz11c_bee
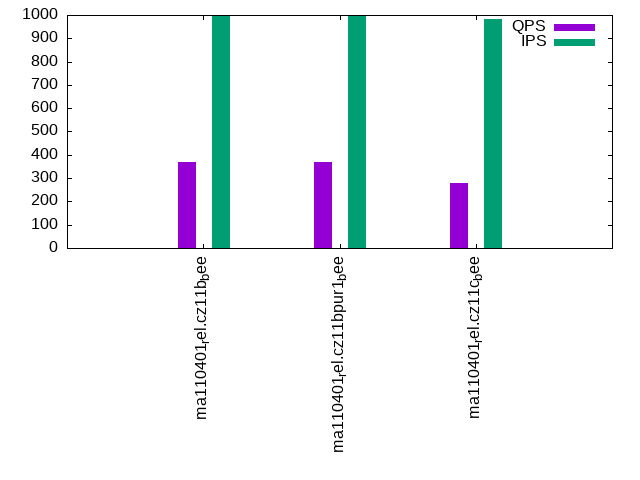
qp1000.L6
qp1000.L6: point queries with 1000 insert/s per client. Graphs for performance per 1-second interval are here.
Average throughput:
Query response time histogram: each cell has the percentage of responses that take <= the time in the header and max is the max response time in seconds. For max values in the top 25% of the range have a red background and in the bottom 25% of the range have a green background. The red background is not used when the min value is within 80% of the max value.
| dbms | 256us | 1ms | 4ms | 16ms | 64ms | 256ms | 1s | 4s | 16s | gt | max |
|---|---|---|---|---|---|---|---|---|---|---|---|
| ma110401_rel.cz11b_bee | 0.001 | 89.924 | 9.299 | 0.314 | 0.462 | 0.099 | |||||
| ma110401_rel.cz11bpur1_bee | 0.002 | 90.473 | 8.737 | 0.274 | 0.514 | 0.104 | |||||
| ma110401_rel.cz11c_bee | 78.942 | 20.381 | 0.606 | 0.070 | 0.161 |
Insert response time histogram: each cell has the percentage of responses that take <= the time in the header and max is the max response time in seconds. For max values in the top 25% of the range have a red background and in the bottom 25% of the range have a green background. The red background is not used when the min value is within 80% of the max value.
| dbms | 256us | 1ms | 4ms | 16ms | 64ms | 256ms | 1s | 4s | 16s | gt | max |
|---|---|---|---|---|---|---|---|---|---|---|---|
| ma110401_rel.cz11b_bee | 0.125 | 87.464 | 12.411 | 0.222 | |||||||
| ma110401_rel.cz11bpur1_bee | 1.067 | 86.483 | 12.450 | 0.155 | |||||||
| ma110401_rel.cz11c_bee | 90.386 | 9.606 | 0.008 | 0.301 |
Delete response time histogram: each cell has the percentage of responses that take <= the time in the header and max is the max response time in seconds. For max values in the top 25% of the range have a red background and in the bottom 25% of the range have a green background. The red background is not used when the min value is within 80% of the max value.
| dbms | 256us | 1ms | 4ms | 16ms | 64ms | 256ms | 1s | 4s | 16s | gt | max |
|---|---|---|---|---|---|---|---|---|---|---|---|
| ma110401_rel.cz11b_bee | 25.364 | 64.586 | 10.050 | 0.149 | |||||||
| ma110401_rel.cz11bpur1_bee | 31.078 | 58.731 | 10.192 | 0.168 | |||||||
| ma110401_rel.cz11c_bee | 0.033 | 97.958 | 2.008 | 0.245 |
Performance metrics for the DBMS listed above. Some are normalized by throughput, others are not. Legend for results is here.
ips	qps	rps	rmbps	wps	wmbps	rpq	rkbpq	wpi	wkbpi	csps	cpups	cspq	cpupq	dbgb1	dbgb2	rss	maxop	p50	p99	tag
999	367	9359	145.7	4834.8	142.9	25.488	406.418	4.841	146.487	55746	11.4	151.813	2484	144.4	160.2	10.1	0.099	368	288	ma110401_rel.cz11b_bee
999	369	9381	146.1	4824.3	143.0	25.410	405.183	4.830	146.609	55751	11.5	151.004	2492	144.4	160.2	10.1	0.104	368	304	ma110401_rel.cz11bpur1_bee
982	281	8258	130.0	4542.5	135.7	29.366	473.516	4.623	141.472	69443	15.8	246.954	4495	144.4	160.2	8.2	0.161	288	208	ma110401_rel.cz11c_bee
l.i0
l.i0: load without secondary indexes
Performance metrics for all DBMS, not just the ones listed above. Some are normalized by throughput, others are not. Legend for results is here.
ips	qps	rps	rmbps	wps	wmbps	rpq	rkbpq	wpi	wkbpi	csps	cpups	cspq	cpupq	dbgb1	dbgb2	rss	maxop	p50	p99	tag
76431	0	585	2.3	385.5	22.4	0.008	0.031	0.005	0.300	12003	25.5	0.157	27	52.6	68.4	10.3	0.198	76515	66726	ma110401_rel.cz11b_bee
77783	0	595	2.3	392.2	22.8	0.008	0.031	0.005	0.300	11531	25.4	0.148	26	52.6	68.4	10.3	0.253	77814	67523	ma110401_rel.cz11bpur1_bee
75636	0	579	2.3	79.4	22.1	0.008	0.031	0.001	0.300	11855	25.2	0.157	27	52.6	68.4	10.3	0.340	77114	58633	ma110401_rel.cz11c_bee
l.x
l.x: create secondary indexes
Performance metrics for all DBMS, not just the ones listed above. Some are normalized by throughput, others are not. Legend for results is here.
ips	qps	rps	rmbps	wps	wmbps	rpq	rkbpq	wpi	wkbpi	csps	cpups	cspq	cpupq	dbgb1	dbgb2	rss	maxop	p50	p99	tag
97931	0	630	98.9	718.3	110.0	0.006	1.035	0.007	1.150	3284	11.9	0.034	10	119.9	135.7	10.3	0.003	NA	NA	ma110401_rel.cz11b_bee
97811	0	638	98.8	731.1	110.0	0.007	1.035	0.007	1.151	3294	11.9	0.034	10	119.9	135.7	10.3	0.002	NA	NA	ma110401_rel.cz11bpur1_bee
97943	0	317	98.9	288.3	110.1	0.003	1.034	0.003	1.151	2547	12.0	0.026	10	119.9	135.7	10.3	0.002	NA	NA	ma110401_rel.cz11c_bee
l.i1
l.i1: continue load after secondary indexes created with 50 inserts per transaction
Performance metrics for all DBMS, not just the ones listed above. Some are normalized by throughput, others are not. Legend for results is here.
ips	qps	rps	rmbps	wps	wmbps	rpq	rkbpq	wpi	wkbpi	csps	cpups	cspq	cpupq	dbgb1	dbgb2	rss	maxop	p50	p99	tag
978	0	6296	97.8	5847.9	169.9	6.439	102.390	5.980	177.928	55315	10.6	56.565	867	144.4	160.2	10.1	4.258	949	599	ma110401_rel.cz11b_bee
1013	0	6518	101.2	6039.4	176.0	6.435	102.330	5.962	177.944	57233	10.8	56.504	853	144.4	160.2	10.1	3.651	999	599	ma110401_rel.cz11bpur1_bee
795	0	5033	88.3	4251.2	139.9	6.329	113.696	5.346	180.208	54230	12.6	68.197	1268	144.4	160.2	10.1	6.793	799	350	ma110401_rel.cz11c_bee
l.i2
l.i2: continue load after secondary indexes created with 5 inserts per transaction
Performance metrics for all DBMS, not just the ones listed above. Some are normalized by throughput, others are not. Legend for results is here.
ips	qps	rps	rmbps	wps	wmbps	rpq	rkbpq	wpi	wkbpi	csps	cpups	cspq	cpupq	dbgb1	dbgb2	rss	maxop	p50	p99	tag
1081	0	6696	100.7	5725.4	168.1	6.194	95.414	5.296	159.190	59109	13.4	54.680	992	144.4	160.2	10.1	0.155	1094	799	ma110401_rel.cz11b_bee
1075	0	6665	100.3	5697.7	167.7	6.199	95.502	5.299	159.676	58578	13.4	54.481	997	144.4	160.2	10.1	0.135	1094	794	ma110401_rel.cz11bpur1_bee
830	0	5106	79.1	4308.0	128.7	6.153	97.571	5.192	158.849	52637	14.8	63.434	1427	144.4	160.2	8.8	0.400	869	369	ma110401_rel.cz11c_bee
qr100.L1
qr100.L1: range queries with 100 insert/s per client
Performance metrics for all DBMS, not just the ones listed above. Some are normalized by throughput, others are not. Legend for results is here.
ips	qps	rps	rmbps	wps	wmbps	rpq	rkbpq	wpi	wkbpi	csps	cpups	cspq	cpupq	dbgb1	dbgb2	rss	maxop	p50	p99	tag
100	3393	638	9.9	274.4	8.6	0.188	2.995	2.750	88.561	16777	13.1	4.944	309	144.4	160.2	10.1	0.091	3388	2637	ma110401_rel.cz11b_bee
100	3353	638	9.9	271.5	8.6	0.190	3.031	2.721	88.023	16610	13.0	4.954	310	144.4	160.2	10.1	0.089	3356	2557	ma110401_rel.cz11bpur1_bee
100	3375	628	10.4	271.0	8.6	0.186	3.154	2.719	88.391	17150	13.5	5.081	320	144.4	160.2	9.8	0.137	3372	2221	ma110401_rel.cz11c_bee
qp100.L2
qp100.L2: point queries with 100 insert/s per client
Performance metrics for all DBMS, not just the ones listed above. Some are normalized by throughput, others are not. Legend for results is here.
ips	qps	rps	rmbps	wps	wmbps	rpq	rkbpq	wpi	wkbpi	csps	cpups	cspq	cpupq	dbgb1	dbgb2	rss	maxop	p50	p99	tag
100	579	5774	90.2	755.4	21.8	9.969	159.400	7.569	223.314	18484	5.3	31.913	732	144.4	160.2	10.1	0.085	591	463	ma110401_rel.cz11b_bee
100	586	5826	91.0	758.2	21.9	9.951	159.113	7.598	224.778	18683	5.4	31.909	738	144.4	160.2	10.1	0.084	591	479	ma110401_rel.cz11bpur1_bee
100	487	4972	78.8	736.8	21.5	10.203	165.531	7.383	220.483	19667	6.2	40.358	1018	144.4	160.2	9.0	0.140	495	384	ma110401_rel.cz11c_bee
qr500.L3
qr500.L3: range queries with 500 insert/s per client
Performance metrics for all DBMS, not just the ones listed above. Some are normalized by throughput, others are not. Legend for results is here.
ips	qps	rps	rmbps	wps	wmbps	rpq	rkbpq	wpi	wkbpi	csps	cpups	cspq	cpupq	dbgb1	dbgb2	rss	maxop	p50	p99	tag
499	3098	2980	46.3	2369.3	70.3	0.962	15.309	4.747	144.284	35073	15.6	11.322	403	144.4	160.2	10.1	0.086	3116	1871	ma110401_rel.cz11b_bee
499	3085	2982	46.4	2365.8	70.4	0.967	15.386	4.740	144.502	35027	15.7	11.354	407	144.4	160.2	10.1	0.088	3100	1870	ma110401_rel.cz11bpur1_bee
499	3213	2927	47.2	2352.3	70.4	0.911	15.029	4.713	144.428	37530	18.1	11.682	451	144.4	160.2	8.8	0.129	3244	1534	ma110401_rel.cz11c_bee
qp500.L4
qp500.L4: point queries with 500 insert/s per client
Performance metrics for all DBMS, not just the ones listed above. Some are normalized by throughput, others are not. Legend for results is here.
ips	qps	rps	rmbps	wps	wmbps	rpq	rkbpq	wpi	wkbpi	csps	cpups	cspq	cpupq	dbgb1	dbgb2	rss	maxop	p50	p99	tag
499	460	7381	115.1	2626.0	77.4	16.028	255.890	5.261	158.806	35301	8.1	76.659	1407	144.4	160.2	10.1	0.077	463	400	ma110401_rel.cz11b_bee
499	464	7414	115.6	2640.3	78.1	15.964	254.892	5.290	160.195	34865	8.2	75.076	1413	144.4	160.2	10.1	0.091	463	416	ma110401_rel.cz11bpur1_bee
499	369	6485	102.5	2600.1	77.2	17.574	284.372	5.210	158.397	41573	11.4	112.664	2471	144.4	160.2	8.7	0.196	368	272	ma110401_rel.cz11c_bee
qr1000.L5
qr1000.L5: range queries with 1000 insert/s per client
Performance metrics for all DBMS, not just the ones listed above. Some are normalized by throughput, others are not. Legend for results is here.
ips	qps	rps	rmbps	wps	wmbps	rpq	rkbpq	wpi	wkbpi	csps	cpups	cspq	cpupq	dbgb1	dbgb2	rss	maxop	p50	p99	tag
999	2584	5691	88.4	4739.7	140.4	2.202	35.041	4.745	143.926	56117	18.1	21.717	560	144.4	160.2	10.1	0.097	2639	1247	ma110401_rel.cz11b_bee
999	2586	5698	88.5	4711.7	140.1	2.203	35.060	4.717	143.596	55812	18.2	21.583	563	144.4	160.2	10.1	0.120	2653	1183	ma110401_rel.cz11bpur1_bee
993	3022	5541	88.0	4703.9	140.2	1.834	29.828	4.738	144.628	66193	23.1	21.905	612	144.4	160.2	8.6	0.133	3100	1103	ma110401_rel.cz11c_bee
qp1000.L6
qp1000.L6: point queries with 1000 insert/s per client
Performance metrics for all DBMS, not just the ones listed above. Some are normalized by throughput, others are not. Legend for results is here.
ips	qps	rps	rmbps	wps	wmbps	rpq	rkbpq	wpi	wkbpi	csps	cpups	cspq	cpupq	dbgb1	dbgb2	rss	maxop	p50	p99	tag
999	367	9359	145.7	4834.8	142.9	25.488	406.418	4.841	146.487	55746	11.4	151.813	2484	144.4	160.2	10.1	0.099	368	288	ma110401_rel.cz11b_bee
999	369	9381	146.1	4824.3	143.0	25.410	405.183	4.830	146.609	55751	11.5	151.004	2492	144.4	160.2	10.1	0.104	368	304	ma110401_rel.cz11bpur1_bee
982	281	8258	130.0	4542.5	135.7	29.366	473.516	4.623	141.472	69443	15.8	246.954	4495	144.4	160.2	8.2	0.161	288	208	ma110401_rel.cz11c_bee
l.i0
- l.i0: load without secondary indexes
- Legend for results is here.
- Each entry lists the percentage of responses that fit in that bucket (slower than max time for previous bucket, faster than min time for next bucket).
Insert response time histogram
256us	1ms	4ms	16ms	64ms	256ms	1s	4s	16s	gt	max	tag
0.000	0.195	99.544	0.216	0.040	0.005	0.000	0.000	0.000	0.000	0.198	ma110401_rel.cz11b_bee
0.000	0.445	99.296	0.213	0.042	0.005	0.000	0.000	0.000	0.000	0.253	ma110401_rel.cz11bpur1_bee
0.000	0.410	99.318	0.204	0.044	0.024	nonzero	0.000	0.000	0.000	0.340	ma110401_rel.cz11c_bee
l.x
- l.x: create secondary indexes
- Legend for results is here.
- Each entry lists the percentage of responses that fit in that bucket (slower than max time for previous bucket, faster than min time for next bucket).
TODO - determine whether there is data for create index response time
l.i1
- l.i1: continue load after secondary indexes created with 50 inserts per transaction
- Legend for results is here.
- Each entry lists the percentage of responses that fit in that bucket (slower than max time for previous bucket, faster than min time for next bucket).
Insert response time histogram
256us	1ms	4ms	16ms	64ms	256ms	1s	4s	16s	gt	max	tag
0.000	0.000	0.000	0.000	77.763	22.236	0.000	0.000	0.001	0.000	4.258	ma110401_rel.cz11b_bee
0.000	0.000	0.000	0.000	80.478	19.516	0.005	0.001	0.000	0.000	3.651	ma110401_rel.cz11bpur1_bee
0.000	0.000	0.000	0.000	70.329	28.871	0.799	0.000	0.001	0.000	6.793	ma110401_rel.cz11c_bee
Delete response time histogram
256us	1ms	4ms	16ms	64ms	256ms	1s	4s	16s	gt	max	tag
0.000	0.000	0.000	3.148	89.179	7.673	0.000	0.000	0.001	0.000	4.147	ma110401_rel.cz11b_bee
0.000	0.000	0.000	5.929	86.510	7.559	0.001	0.001	0.000	0.000	3.593	ma110401_rel.cz11bpur1_bee
0.000	0.000	0.000	2.756	93.695	3.097	0.450	0.000	0.001	0.000	6.636	ma110401_rel.cz11c_bee
l.i2
- l.i2: continue load after secondary indexes created with 5 inserts per transaction
- Legend for results is here.
- Each entry lists the percentage of responses that fit in that bucket (slower than max time for previous bucket, faster than min time for next bucket).
Insert response time histogram
256us	1ms	4ms	16ms	64ms	256ms	1s	4s	16s	gt	max	tag
0.000	0.003	68.868	29.822	0.546	0.762	0.000	0.000	0.000	0.000	0.155	ma110401_rel.cz11b_bee
0.000	0.003	68.743	29.927	0.566	0.762	0.000	0.000	0.000	0.000	0.135	ma110401_rel.cz11bpur1_bee
0.000	0.000	40.135	57.491	1.593	0.780	0.002	0.000	0.000	0.000	0.400	ma110401_rel.cz11c_bee
Delete response time histogram
256us	1ms	4ms	16ms	64ms	256ms	1s	4s	16s	gt	max	tag
0.000	0.009	77.700	21.218	0.376	0.697	0.000	0.000	0.000	0.000	0.155	ma110401_rel.cz11b_bee
0.000	0.007	77.549	21.341	0.403	0.700	0.000	0.000	0.000	0.000	0.132	ma110401_rel.cz11bpur1_bee
0.000	0.000	72.166	26.337	0.874	0.622	0.001	0.000	0.000	0.000	0.384	ma110401_rel.cz11c_bee
qr100.L1
- qr100.L1: range queries with 100 insert/s per client
- Legend for results is here.
- Each entry lists the percentage of responses that fit in that bucket (slower than max time for previous bucket, faster than min time for next bucket).
Query response time histogram
256us	1ms	4ms	16ms	64ms	256ms	1s	4s	16s	gt	max	tag
47.900	51.884	0.189	0.024	0.002	0.001	0.000	0.000	0.000	0.000	0.091	ma110401_rel.cz11b_bee
42.554	57.226	0.192	0.025	0.002	0.001	0.000	0.000	0.000	0.000	0.089	ma110401_rel.cz11bpur1_bee
45.429	54.332	0.199	0.036	0.003	0.001	0.000	0.000	0.000	0.000	0.137	ma110401_rel.cz11c_bee
Insert response time histogram
256us	1ms	4ms	16ms	64ms	256ms	1s	4s	16s	gt	max	tag
0.000	0.000	0.000	0.278	93.944	5.778	0.000	0.000	0.000	0.000	0.133	ma110401_rel.cz11b_bee
0.000	0.000	0.000	0.167	94.111	5.722	0.000	0.000	0.000	0.000	0.126	ma110401_rel.cz11bpur1_bee
0.000	0.000	0.000	0.000	93.417	6.583	0.000	0.000	0.000	0.000	0.185	ma110401_rel.cz11c_bee
Delete response time histogram
256us	1ms	4ms	16ms	64ms	256ms	1s	4s	16s	gt	max	tag
0.000	0.000	0.000	44.444	51.056	4.500	0.000	0.000	0.000	0.000	0.120	ma110401_rel.cz11b_bee
0.000	0.000	0.000	45.306	50.222	4.472	0.000	0.000	0.000	0.000	0.122	ma110401_rel.cz11bpur1_bee
0.000	0.000	0.000	27.833	67.250	4.917	0.000	0.000	0.000	0.000	0.160	ma110401_rel.cz11c_bee
qp100.L2
- qp100.L2: point queries with 100 insert/s per client
- Legend for results is here.
- Each entry lists the percentage of responses that fit in that bucket (slower than max time for previous bucket, faster than min time for next bucket).
Query response time histogram
256us	1ms	4ms	16ms	64ms	256ms	1s	4s	16s	gt	max	tag
0.000	0.247	98.701	0.656	0.391	0.005	0.000	0.000	0.000	0.000	0.085	ma110401_rel.cz11b_bee
0.000	0.232	99.015	0.360	0.388	0.005	0.000	0.000	0.000	0.000	0.084	ma110401_rel.cz11bpur1_bee
0.000	0.029	97.144	2.387	0.436	0.004	0.000	0.000	0.000	0.000	0.140	ma110401_rel.cz11c_bee
Insert response time histogram
256us	1ms	4ms	16ms	64ms	256ms	1s	4s	16s	gt	max	tag
0.000	0.000	0.000	0.000	93.611	6.389	0.000	0.000	0.000	0.000	0.103	ma110401_rel.cz11b_bee
0.000	0.000	0.000	0.000	97.278	2.722	0.000	0.000	0.000	0.000	0.102	ma110401_rel.cz11bpur1_bee
0.000	0.000	0.000	0.000	89.500	10.500	0.000	0.000	0.000	0.000	0.180	ma110401_rel.cz11c_bee
Delete response time histogram
256us	1ms	4ms	16ms	64ms	256ms	1s	4s	16s	gt	max	tag
0.000	0.000	0.000	13.333	83.611	3.056	0.000	0.000	0.000	0.000	0.099	ma110401_rel.cz11b_bee
0.000	0.000	0.000	42.750	56.111	1.139	0.000	0.000	0.000	0.000	0.100	ma110401_rel.cz11bpur1_bee
0.000	0.000	0.000	6.139	89.056	4.806	0.000	0.000	0.000	0.000	0.182	ma110401_rel.cz11c_bee
qr500.L3
- qr500.L3: range queries with 500 insert/s per client
- Legend for results is here.
- Each entry lists the percentage of responses that fit in that bucket (slower than max time for previous bucket, faster than min time for next bucket).
Query response time histogram
256us	1ms	4ms	16ms	64ms	256ms	1s	4s	16s	gt	max	tag
42.379	57.147	0.397	0.057	0.010	0.010	0.000	0.000	0.000	0.000	0.086	ma110401_rel.cz11b_bee
39.149	60.386	0.385	0.060	0.010	0.010	0.000	0.000	0.000	0.000	0.088	ma110401_rel.cz11bpur1_bee
45.459	54.141	0.308	0.069	0.014	0.009	0.000	0.000	0.000	0.000	0.129	ma110401_rel.cz11c_bee
Insert response time histogram
256us	1ms	4ms	16ms	64ms	256ms	1s	4s	16s	gt	max	tag
0.000	0.000	0.000	0.222	91.161	8.617	0.000	0.000	0.000	0.000	0.129	ma110401_rel.cz11b_bee
0.000	0.000	0.000	9.917	81.856	8.228	0.000	0.000	0.000	0.000	0.127	ma110401_rel.cz11bpur1_bee
0.000	0.000	0.000	0.000	91.278	8.722	0.000	0.000	0.000	0.000	0.217	ma110401_rel.cz11c_bee
Delete response time histogram
256us	1ms	4ms	16ms	64ms	256ms	1s	4s	16s	gt	max	tag
0.000	0.000	0.000	51.222	41.372	7.406	0.000	0.000	0.000	0.000	0.117	ma110401_rel.cz11b_bee
0.000	0.000	0.000	61.483	31.606	6.911	0.000	0.000	0.000	0.000	0.124	ma110401_rel.cz11bpur1_bee
0.000	0.000	0.000	42.083	52.561	5.356	0.000	0.000	0.000	0.000	0.164	ma110401_rel.cz11c_bee
qp500.L4
- qp500.L4: point queries with 500 insert/s per client
- Legend for results is here.
- Each entry lists the percentage of responses that fit in that bucket (slower than max time for previous bucket, faster than min time for next bucket).
Query response time histogram
256us	1ms	4ms	16ms	64ms	256ms	1s	4s	16s	gt	max	tag
0.000	0.013	95.806	3.618	0.555	0.008	0.000	0.000	0.000	0.000	0.077	ma110401_rel.cz11b_bee
0.000	0.015	96.109	3.308	0.558	0.009	0.000	0.000	0.000	0.000	0.091	ma110401_rel.cz11bpur1_bee
0.000	0.001	90.771	8.706	0.509	0.013	0.000	0.000	0.000	0.000	0.196	ma110401_rel.cz11c_bee
Insert response time histogram
256us	1ms	4ms	16ms	64ms	256ms	1s	4s	16s	gt	max	tag
0.000	0.000	0.000	0.022	87.394	12.583	0.000	0.000	0.000	0.000	0.192	ma110401_rel.cz11b_bee
0.000	0.000	0.000	6.339	85.183	8.478	0.000	0.000	0.000	0.000	0.151	ma110401_rel.cz11bpur1_bee
0.000	0.000	0.000	0.000	85.406	14.583	0.011	0.000	0.000	0.000	0.437	ma110401_rel.cz11c_bee
Delete response time histogram
256us	1ms	4ms	16ms	64ms	256ms	1s	4s	16s	gt	max	tag
0.000	0.000	0.000	24.744	65.961	9.294	0.000	0.000	0.000	0.000	0.157	ma110401_rel.cz11b_bee
0.000	0.000	0.000	52.456	40.817	6.728	0.000	0.000	0.000	0.000	0.131	ma110401_rel.cz11bpur1_bee
0.000	0.000	0.000	13.017	79.867	7.106	0.011	0.000	0.000	0.000	0.447	ma110401_rel.cz11c_bee
qr1000.L5
- qr1000.L5: range queries with 1000 insert/s per client
- Legend for results is here.
- Each entry lists the percentage of responses that fit in that bucket (slower than max time for previous bucket, faster than min time for next bucket).
Query response time histogram
256us	1ms	4ms	16ms	64ms	256ms	1s	4s	16s	gt	max	tag
35.314	62.635	1.924	0.073	0.028	0.026	0.000	0.000	0.000	0.000	0.097	ma110401_rel.cz11b_bee
33.448	64.710	1.706	0.083	0.027	0.026	0.000	0.000	0.000	0.000	0.120	ma110401_rel.cz11bpur1_bee
47.002	52.009	0.844	0.115	0.023	0.008	0.000	0.000	0.000	0.000	0.133	ma110401_rel.cz11c_bee
Insert response time histogram
256us	1ms	4ms	16ms	64ms	256ms	1s	4s	16s	gt	max	tag
0.000	0.000	0.000	0.744	90.439	8.817	0.000	0.000	0.000	0.000	0.224	ma110401_rel.cz11b_bee
0.000	0.000	0.000	4.478	86.889	8.633	0.000	0.000	0.000	0.000	0.156	ma110401_rel.cz11bpur1_bee
0.000	0.000	0.000	0.000	93.992	5.994	0.014	0.000	0.000	0.000	0.305	ma110401_rel.cz11c_bee
Delete response time histogram
256us	1ms	4ms	16ms	64ms	256ms	1s	4s	16s	gt	max	tag
0.000	0.000	0.000	39.928	53.189	6.883	0.000	0.000	0.000	0.000	0.162	ma110401_rel.cz11b_bee
0.000	0.000	0.000	45.603	47.653	6.744	0.000	0.000	0.000	0.000	0.143	ma110401_rel.cz11bpur1_bee
0.000	0.000	0.000	6.225	90.942	2.831	0.003	0.000	0.000	0.000	0.283	ma110401_rel.cz11c_bee
qp1000.L6
- qp1000.L6: point queries with 1000 insert/s per client
- Legend for results is here.
- Each entry lists the percentage of responses that fit in that bucket (slower than max time for previous bucket, faster than min time for next bucket).
Query response time histogram
256us	1ms	4ms	16ms	64ms	256ms	1s	4s	16s	gt	max	tag
0.000	0.001	89.924	9.299	0.314	0.462	0.000	0.000	0.000	0.000	0.099	ma110401_rel.cz11b_bee
0.000	0.002	90.473	8.737	0.274	0.514	0.000	0.000	0.000	0.000	0.104	ma110401_rel.cz11bpur1_bee
0.000	0.000	78.942	20.381	0.606	0.070	0.000	0.000	0.000	0.000	0.161	ma110401_rel.cz11c_bee
Insert response time histogram
256us	1ms	4ms	16ms	64ms	256ms	1s	4s	16s	gt	max	tag
0.000	0.000	0.000	0.125	87.464	12.411	0.000	0.000	0.000	0.000	0.222	ma110401_rel.cz11b_bee
0.000	0.000	0.000	1.067	86.483	12.450	0.000	0.000	0.000	0.000	0.155	ma110401_rel.cz11bpur1_bee
0.000	0.000	0.000	0.000	90.386	9.606	0.008	0.000	0.000	0.000	0.301	ma110401_rel.cz11c_bee
Delete response time histogram
256us	1ms	4ms	16ms	64ms	256ms	1s	4s	16s	gt	max	tag
0.000	0.000	0.000	25.364	64.586	10.050	0.000	0.000	0.000	0.000	0.149	ma110401_rel.cz11b_bee
0.000	0.000	0.000	31.078	58.731	10.192	0.000	0.000	0.000	0.000	0.168	ma110401_rel.cz11bpur1_bee
0.000	0.000	0.000	0.033	97.958	2.008	0.000	0.000	0.000	0.000	0.245	ma110401_rel.cz11c_bee