Introduction
This is a report for the insert benchmark with 800M docs and 1 client(s). It is generated by scripts (bash, awk, sed) and Tufte might not be impressed. An overview of the insert benchmark is here and a short update is here. Below, by DBMS, I mean DBMS+version.config. An example is my8020.c10b40 where my means MySQL, 8020 is version 8.0.20 and c10b40 is the name for the configuration file.
The test server has 8 AMD cores, 16G RAM and an NVMe SSD. It is described here as the Beelink. The benchmark was run with 1 client and there were 1 or 3 connections per client (1 for queries or inserts without rate limits, 1+1 for rate limited inserts+deletes). It uses 1 table. It loads 800M rows per table without secondary indexes, creates 3 secondary indexes per table, then inserts 4m+1m rows per table with a delete per insert to avoid growing the table. It then does 6 read+write tests for 1800s each that do queries as fast as possible with 100,100,500,500,1000,1000 inserts/s and the same for deletes/s per client concurrent with the queries. The database is larger than memory. Clients and the DBMS share one server. The per-database configs are in the per-database subdirectories here.
The tested DBMS are:
- ma101107_rel.cz11a_bee - MariaDB 10.11.7 with the cz11a_bee config
- ma101107_rel.cz11apur1_bee - MariaDB 10.11.7 with the cz11apur1_bee config that uses innodb_purge_threads=1
- ma101107_rel.cz11b_bee - MariaDB 10.11.7 with the cz11b_bee config that uses innodb_flush_method=O_DIRECT
- ma101107_rel.cz11c_bee - MariaDB 10.11.7 with the cz11c_bee config that uses innodb_flush_method=fsync
- ma101107_rel.cz11d_bee - MariaDB 10.11.7 with the cz11d_bee config that uses innodb_change_buffering=all
Contents
- Summary
- l.i0: load without secondary indexes
- l.x: create secondary indexes
- l.i1: continue load after secondary indexes created with 50 inserts per transaction
- l.i2: continue load after secondary indexes created with 5 inserts per transaction
- qr100.L1: range queries with 100 insert/s per client
- qp100.L2: point queries with 100 insert/s per client
- qr500.L3: range queries with 500 insert/s per client
- qp500.L4: point queries with 500 insert/s per client
- qr1000.L5: range queries with 1000 insert/s per client
- qp1000.L6: point queries with 1000 insert/s per client
Summary
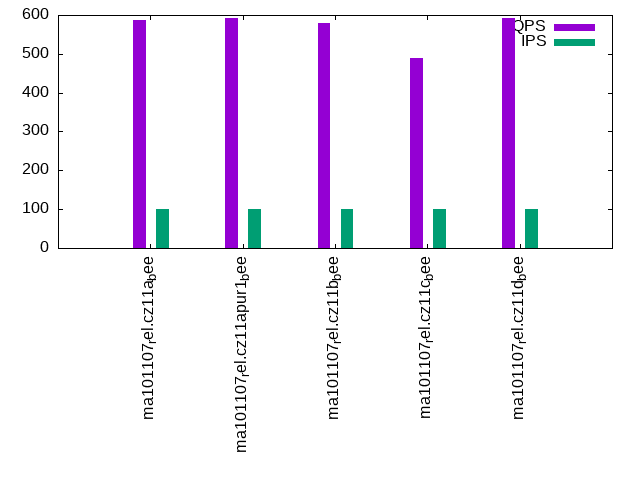
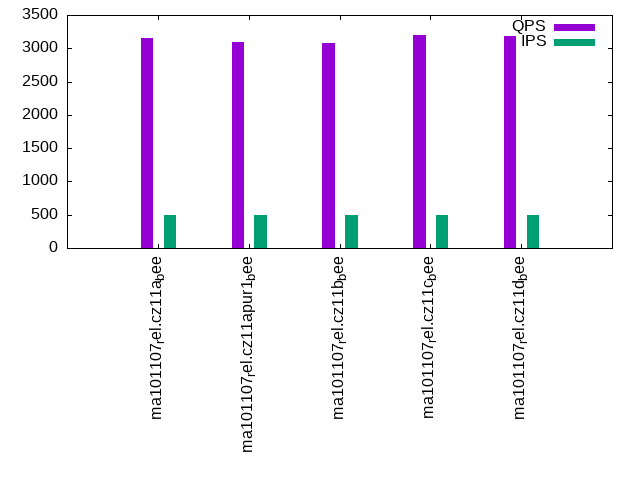
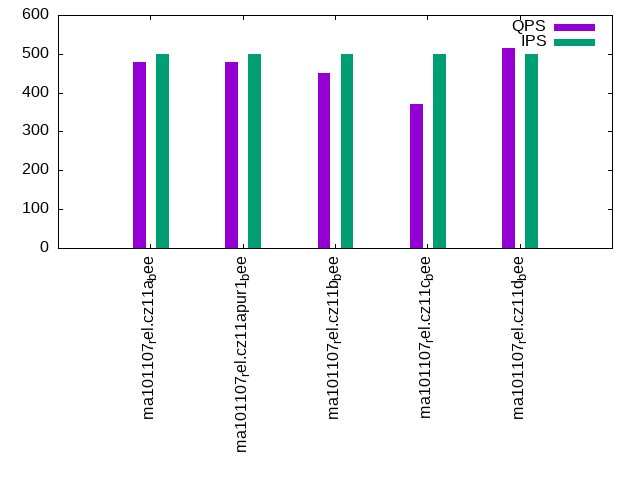
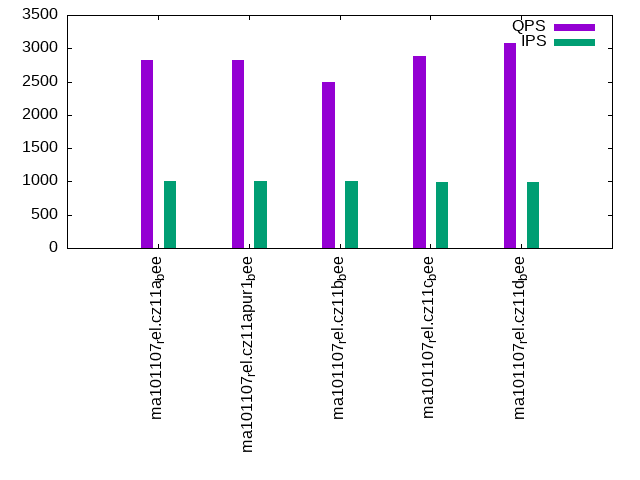
The numbers are inserts/s for l.i0, l.i1 and l.i2, indexed docs (or rows) /s for l.x and queries/s for qr100, qp100 thru qr1000, qp1000" The values are the average rate over the entire test for inserts (IPS) and queries (QPS). The range of values for IPS and QPS is split into 3 parts: bottom 25%, middle 50%, top 25%. Values in the bottom 25% have a red background, values in the top 25% have a green background and values in the middle have no color. A gray background is used for values that can be ignored because the DBMS did not sustain the target insert rate. Red backgrounds are not used when the minimum value is within 80% of the max value.
| dbms | l.i0 | l.x | l.i1 | l.i2 | qr100 | qp100 | qr500 | qp500 | qr1000 | qp1000 |
|---|---|---|---|---|---|---|---|---|---|---|
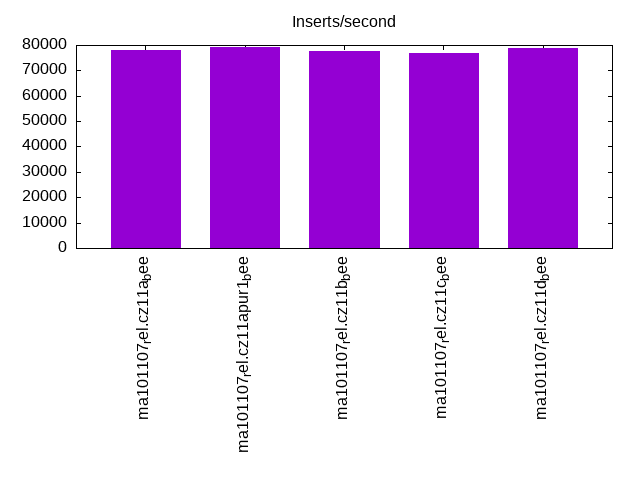
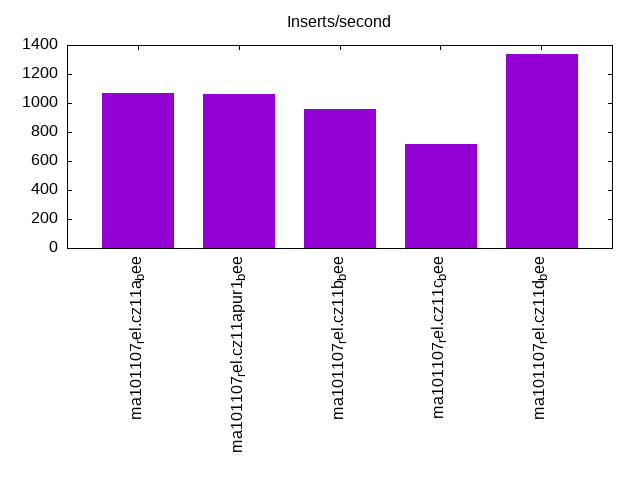
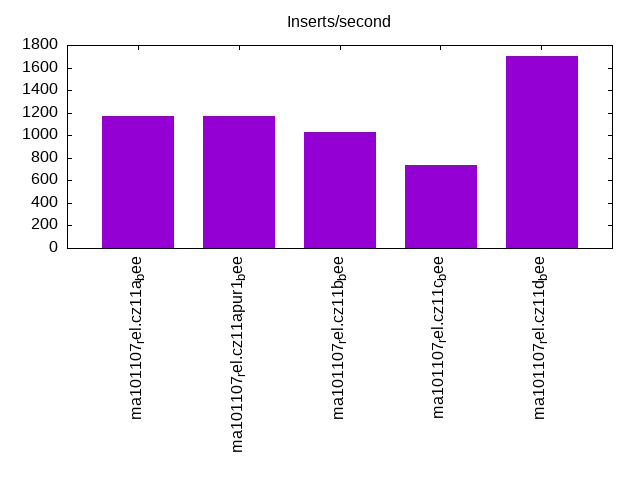
| ma101107_rel.cz11a_bee | 78194 | 98888 | 1070 | 1167 | 3355 | 588 | 3148 | 478 | 2822 | 391 |
| ma101107_rel.cz11apur1_bee | 79404 | 98826 | 1064 | 1170 | 3328 | 591 | 3088 | 479 | 2831 | 394 |
| ma101107_rel.cz11b_bee | 77768 | 98765 | 961 | 1027 | 3326 | 579 | 3074 | 450 | 2500 | 354 |
| ma101107_rel.cz11c_bee | 76805 | 98998 | 719 | 735 | 3380 | 490 | 3197 | 370 | 2879 | 286 |
| ma101107_rel.cz11d_bee | 78647 | 98985 | 1340 | 1701 | 3321 | 592 | 3189 | 514 | 3086 | 463 |
This table has relative throughput, throughput for the DBMS relative to the DBMS in the first line, using the absolute throughput from the previous table. Values less than 0.95 have a yellow background. Values greater than 1.05 have a blue background.
| dbms | l.i0 | l.x | l.i1 | l.i2 | qr100 | qp100 | qr500 | qp500 | qr1000 | qp1000 |
|---|---|---|---|---|---|---|---|---|---|---|
| ma101107_rel.cz11a_bee | 1.00 | 1.00 | 1.00 | 1.00 | 1.00 | 1.00 | 1.00 | 1.00 | 1.00 | 1.00 |
| ma101107_rel.cz11apur1_bee | 1.02 | 1.00 | 0.99 | 1.00 | 0.99 | 1.01 | 0.98 | 1.00 | 1.00 | 1.01 |
| ma101107_rel.cz11b_bee | 0.99 | 1.00 | 0.90 | 0.88 | 0.99 | 0.98 | 0.98 | 0.94 | 0.89 | 0.91 |
| ma101107_rel.cz11c_bee | 0.98 | 1.00 | 0.67 | 0.63 | 1.01 | 0.83 | 1.02 | 0.77 | 1.02 | 0.73 |
| ma101107_rel.cz11d_bee | 1.01 | 1.00 | 1.25 | 1.46 | 0.99 | 1.01 | 1.01 | 1.08 | 1.09 | 1.18 |
This lists the average rate of inserts/s for the tests that do inserts concurrent with queries. For such tests the query rate is listed in the table above. The read+write tests are setup so that the insert rate should match the target rate every second. Cells that are not at least 95% of the target have a red background to indicate a failure to satisfy the target.
| dbms | qr100.L1 | qp100.L2 | qr500.L3 | qp500.L4 | qr1000.L5 | qp1000.L6 |
|---|---|---|---|---|---|---|
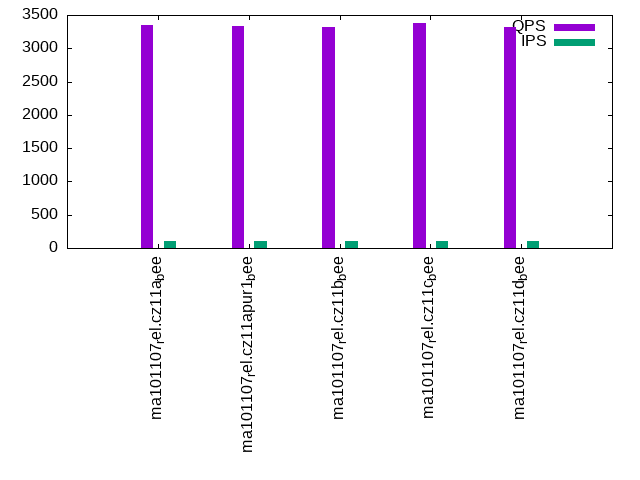
| ma101107_rel.cz11a_bee | 100 | 100 | 499 | 499 | 999 | 998 |
| ma101107_rel.cz11apur1_bee | 100 | 100 | 499 | 499 | 999 | 998 |
| ma101107_rel.cz11b_bee | 100 | 100 | 499 | 499 | 999 | 999 |
| ma101107_rel.cz11c_bee | 100 | 100 | 499 | 499 | 984 | 948 |
| ma101107_rel.cz11d_bee | 100 | 100 | 499 | 499 | 998 | 999 |
| target | 100 | 100 | 500 | 500 | 1000 | 1000 |
l.i0
l.i0: load without secondary indexes. Graphs for performance per 1-second interval are here.
Average throughput:
Insert response time histogram: each cell has the percentage of responses that take <= the time in the header and max is the max response time in seconds. For the max column values in the top 25% of the range have a red background and in the bottom 25% of the range have a green background. The red background is not used when the min value is within 80% of the max value.
| dbms | 256us | 1ms | 4ms | 16ms | 64ms | 256ms | 1s | 4s | 16s | gt | max |
|---|---|---|---|---|---|---|---|---|---|---|---|
| ma101107_rel.cz11a_bee | 0.743 | 99.006 | 0.201 | 0.046 | 0.004 | 0.210 | |||||
| ma101107_rel.cz11apur1_bee | 1.015 | 98.736 | 0.212 | 0.033 | 0.004 | 0.188 | |||||
| ma101107_rel.cz11b_bee | 0.612 | 99.129 | 0.214 | 0.040 | 0.005 | 0.236 | |||||
| ma101107_rel.cz11c_bee | 0.561 | 99.169 | 0.206 | 0.044 | 0.019 | nonzero | 0.288 | ||||
| ma101107_rel.cz11d_bee | 0.715 | 99.037 | 0.210 | 0.034 | 0.004 | 0.198 |
Performance metrics for the DBMS listed above. Some are normalized by throughput, others are not. Legend for results is here.
ips	qps	rps	rmbps	wps	wmbps	rpq	rkbpq	wpi	wkbpi	csps	cpups	cspq	cpupq	dbgb1	dbgb2	rss	maxop	p50	p99	tag
78194	0	600	2.3	388.5	22.9	0.008	0.031	0.005	0.300	11954	25.6	0.153	26	52.6	68.4	10.3	0.210	78313	68622	ma101107_rel.cz11a_bee
79404	0	608	2.4	394.8	23.2	0.008	0.031	0.005	0.300	11483	25.4	0.145	26	52.6	68.4	10.3	0.188	79612	69423	ma101107_rel.cz11apur1_bee
77768	0	597	2.3	392.1	22.7	0.008	0.031	0.005	0.300	11935	25.6	0.153	26	52.6	68.4	10.3	0.236	77954	67823	ma101107_rel.cz11b_bee
76805	0	589	2.3	80.1	22.5	0.008	0.031	0.001	0.300	11748	25.3	0.153	26	52.6	68.4	10.3	0.288	78114	60032	ma101107_rel.cz11c_bee
78647	0	602	2.4	390.9	23.0	0.008	0.031	0.005	0.300	12034	25.7	0.153	26	52.6	68.4	10.3	0.198	78910	68957	ma101107_rel.cz11d_bee
l.x
l.x: create secondary indexes.
Average throughput:

Performance metrics for the DBMS listed above. Some are normalized by throughput, others are not. Legend for results is here.
ips	qps	rps	rmbps	wps	wmbps	rpq	rkbpq	wpi	wkbpi	csps	cpups	cspq	cpupq	dbgb1	dbgb2	rss	maxop	p50	p99	tag
98888	0	632	99.9	730.6	111.1	0.006	1.034	0.007	1.151	3320	11.9	0.034	10	119.9	135.7	10.3	0.002	NA	NA	ma101107_rel.cz11a_bee
98826	0	640	99.8	734.9	111.1	0.006	1.034	0.007	1.151	3347	11.8	0.034	10	119.9	135.7	10.3	0.002	NA	NA	ma101107_rel.cz11apur1_bee
98765	0	634	99.8	727.6	111.0	0.006	1.035	0.007	1.151	3343	11.9	0.034	10	119.9	135.7	10.3	0.002	NA	NA	ma101107_rel.cz11b_bee
98998	0	319	100.0	290.0	111.1	0.003	1.034	0.003	1.149	2527	12.0	0.026	10	119.9	135.7	10.3	0.002	NA	NA	ma101107_rel.cz11c_bee
98985	0	644	100.0	736.9	111.2	0.007	1.034	0.007	1.151	3341	11.9	0.034	10	119.9	135.7	10.3	0.002	NA	NA	ma101107_rel.cz11d_bee
l.i1
l.i1: continue load after secondary indexes created with 50 inserts per transaction. Graphs for performance per 1-second interval are here.
Average throughput:
Insert response time histogram: each cell has the percentage of responses that take <= the time in the header and max is the max response time in seconds. For the max column values in the top 25% of the range have a red background and in the bottom 25% of the range have a green background. The red background is not used when the min value is within 80% of the max value.
| dbms | 256us | 1ms | 4ms | 16ms | 64ms | 256ms | 1s | 4s | 16s | gt | max |
|---|---|---|---|---|---|---|---|---|---|---|---|
| ma101107_rel.cz11a_bee | 84.365 | 15.629 | 0.005 | 0.001 | 3.772 | ||||||
| ma101107_rel.cz11apur1_bee | 84.388 | 15.609 | 0.003 | 0.001 | 3.995 | ||||||
| ma101107_rel.cz11b_bee | 77.414 | 22.541 | 0.044 | 0.001 | 4.085 | ||||||
| ma101107_rel.cz11c_bee | 65.310 | 32.653 | 2.024 | 0.013 | 0.001 | 6.514 | |||||
| ma101107_rel.cz11d_bee | 9.420 | 79.530 | 11.048 | 0.001 | 0.001 | 4.074 |
Delete response time histogram: each cell has the percentage of responses that take <= the time in the header and max is the max response time in seconds. For the max column values in the top 25% of the range have a red background and in the bottom 25% of the range have a green background. The red background is not used when the min value is within 80% of the max value.
| dbms | 256us | 1ms | 4ms | 16ms | 64ms | 256ms | 1s | 4s | 16s | gt | max |
|---|---|---|---|---|---|---|---|---|---|---|---|
| ma101107_rel.cz11a_bee | 4.051 | 85.021 | 10.926 | 0.001 | 3.712 | ||||||
| ma101107_rel.cz11apur1_bee | 4.011 | 85.191 | 10.796 | 0.001 | 3.951 | ||||||
| ma101107_rel.cz11b_bee | 3.084 | 88.833 | 8.066 | 0.016 | 0.001 | 4.021 | |||||
| ma101107_rel.cz11c_bee | 3.739 | 91.502 | 3.609 | 1.148 | 0.001 | 0.001 | 6.349 | ||||
| ma101107_rel.cz11d_bee | 0.579 | 93.454 | 2.904 | 3.062 | 0.001 | 3.989 |
Performance metrics for the DBMS listed above. Some are normalized by throughput, others are not. Legend for results is here.
ips	qps	rps	rmbps	wps	wmbps	rpq	rkbpq	wpi	wkbpi	csps	cpups	cspq	cpupq	dbgb1	dbgb2	rss	maxop	p50	p99	tag
1070	0	6860	106.5	6305.4	186.7	6.412	101.951	5.894	178.714	60663	11.8	56.705	882	144.4	160.2	10.1	3.772	1099	749	ma101107_rel.cz11a_bee
1064	0	6822	105.9	6294.9	185.8	6.413	101.958	5.917	178.805	60310	11.8	56.693	887	144.4	160.2	10.1	3.995	1099	749	ma101107_rel.cz11apur1_bee
961	0	6153	95.6	5812.3	169.3	6.404	101.838	6.049	180.481	54631	10.4	56.860	866	144.4	160.2	10.1	4.085	949	550	ma101107_rel.cz11b_bee
719	0	4542	79.7	3943.6	128.4	6.318	113.466	5.486	182.863	49011	12.1	68.176	1347	144.4	160.2	10.1	6.514	700	250	ma101107_rel.cz11c_bee
1340	0	5936	91.9	6595.4	192.7	4.432	70.292	4.924	147.290	59527	13.4	44.439	800	148.8	165.0	10.8	4.074	1249	749	ma101107_rel.cz11d_bee
l.i2
l.i2: continue load after secondary indexes created with 5 inserts per transaction. Graphs for performance per 1-second interval are here.
Average throughput:
Insert response time histogram: each cell has the percentage of responses that take <= the time in the header and max is the max response time in seconds. For the max column values in the top 25% of the range have a red background and in the bottom 25% of the range have a green background. The red background is not used when the min value is within 80% of the max value.
| dbms | 256us | 1ms | 4ms | 16ms | 64ms | 256ms | 1s | 4s | 16s | gt | max |
|---|---|---|---|---|---|---|---|---|---|---|---|
| ma101107_rel.cz11a_bee | 0.001 | 89.945 | 8.538 | 0.428 | 1.088 | 0.141 | |||||
| ma101107_rel.cz11apur1_bee | 0.004 | 90.087 | 8.430 | 0.402 | 1.077 | 0.140 | |||||
| ma101107_rel.cz11b_bee | 0.001 | 70.451 | 27.595 | 1.073 | 0.881 | 0.142 | |||||
| ma101107_rel.cz11c_bee | 0.001 | 48.906 | 47.631 | 1.871 | 1.580 | 0.011 | 0.380 | ||||
| ma101107_rel.cz11d_bee | 4.078 | 89.970 | 5.248 | 0.154 | 0.549 | 0.173 |
Delete response time histogram: each cell has the percentage of responses that take <= the time in the header and max is the max response time in seconds. For the max column values in the top 25% of the range have a red background and in the bottom 25% of the range have a green background. The red background is not used when the min value is within 80% of the max value.
| dbms | 256us | 1ms | 4ms | 16ms | 64ms | 256ms | 1s | 4s | 16s | gt | max |
|---|---|---|---|---|---|---|---|---|---|---|---|
| ma101107_rel.cz11a_bee | 0.014 | 93.919 | 4.939 | 0.129 | 1.000 | 0.140 | |||||
| ma101107_rel.cz11apur1_bee | 0.015 | 94.005 | 4.864 | 0.133 | 0.985 | 0.134 | |||||
| ma101107_rel.cz11b_bee | 0.011 | 79.046 | 19.293 | 0.889 | 0.761 | 0.139 | |||||
| ma101107_rel.cz11c_bee | 0.002 | 76.409 | 21.084 | 1.336 | 1.169 | 0.001 | 0.377 | ||||
| ma101107_rel.cz11d_bee | 6.868 | 91.195 | 1.412 | 0.081 | 0.443 | 0.168 |
Performance metrics for the DBMS listed above. Some are normalized by throughput, others are not. Legend for results is here.
ips	qps	rps	rmbps	wps	wmbps	rpq	rkbpq	wpi	wkbpi	csps	cpups	cspq	cpupq	dbgb1	dbgb2	rss	maxop	p50	p99	tag
1167	0	7189	108.2	6038.7	182.6	6.161	94.946	5.175	160.232	63665	14.8	54.564	1015	144.4	160.2	10.1	0.141	1174	989	ma101107_rel.cz11a_bee
1170	0	7198	108.3	6097.3	183.7	6.155	94.842	5.214	160.844	63752	14.8	54.512	1012	144.4	160.2	10.1	0.140	1174	994	ma101107_rel.cz11apur1_bee
1027	0	6327	95.2	5388.9	159.2	6.163	94.924	5.249	158.748	55896	13.0	54.448	1013	144.4	160.2	10.1	0.142	1069	459	ma101107_rel.cz11b_bee
735	0	4473	69.2	3799.0	113.6	6.084	96.436	5.167	158.273	46341	13.9	63.032	1512	144.4	160.2	8.9	0.380	839	45	ma101107_rel.cz11c_bee
1701	0	5877	85.5	6142.1	184.9	3.456	51.486	3.612	111.360	62721	20.0	36.882	941	148.8	165.4	11.0	0.173	1703	1458	ma101107_rel.cz11d_bee
qr100.L1
qr100.L1: range queries with 100 insert/s per client. Graphs for performance per 1-second interval are here.
Average throughput:
Query response time histogram: each cell has the percentage of responses that take <= the time in the header and max is the max response time in seconds. For max values in the top 25% of the range have a red background and in the bottom 25% of the range have a green background. The red background is not used when the min value is within 80% of the max value.
| dbms | 256us | 1ms | 4ms | 16ms | 64ms | 256ms | 1s | 4s | 16s | gt | max |
|---|---|---|---|---|---|---|---|---|---|---|---|
| ma101107_rel.cz11a_bee | 44.006 | 55.780 | 0.188 | 0.023 | 0.001 | 0.001 | 0.090 | ||||
| ma101107_rel.cz11apur1_bee | 41.075 | 58.713 | 0.186 | 0.024 | 0.002 | 0.001 | 0.090 | ||||
| ma101107_rel.cz11b_bee | 40.395 | 59.379 | 0.199 | 0.025 | 0.001 | 0.001 | 0.091 | ||||
| ma101107_rel.cz11c_bee | 45.784 | 53.980 | 0.198 | 0.035 | 0.003 | 0.001 | 0.103 | ||||
| ma101107_rel.cz11d_bee | 38.541 | 61.239 | 0.191 | 0.028 | 0.001 | 0.001 | 0.088 |
Insert response time histogram: each cell has the percentage of responses that take <= the time in the header and max is the max response time in seconds. For max values in the top 25% of the range have a red background and in the bottom 25% of the range have a green background. The red background is not used when the min value is within 80% of the max value.
| dbms | 256us | 1ms | 4ms | 16ms | 64ms | 256ms | 1s | 4s | 16s | gt | max |
|---|---|---|---|---|---|---|---|---|---|---|---|
| ma101107_rel.cz11a_bee | 0.222 | 93.917 | 5.861 | 0.123 | |||||||
| ma101107_rel.cz11apur1_bee | 0.083 | 94.278 | 5.639 | 0.126 | |||||||
| ma101107_rel.cz11b_bee | 0.167 | 94.000 | 5.833 | 0.135 | |||||||
| ma101107_rel.cz11c_bee | 92.889 | 7.111 | 0.181 | ||||||||
| ma101107_rel.cz11d_bee | 51.861 | 45.889 | 2.250 | 0.121 |
Delete response time histogram: each cell has the percentage of responses that take <= the time in the header and max is the max response time in seconds. For max values in the top 25% of the range have a red background and in the bottom 25% of the range have a green background. The red background is not used when the min value is within 80% of the max value.
| dbms | 256us | 1ms | 4ms | 16ms | 64ms | 256ms | 1s | 4s | 16s | gt | max |
|---|---|---|---|---|---|---|---|---|---|---|---|
| ma101107_rel.cz11a_bee | 44.806 | 50.972 | 4.222 | 0.115 | |||||||
| ma101107_rel.cz11apur1_bee | 44.306 | 51.694 | 4.000 | 0.115 | |||||||
| ma101107_rel.cz11b_bee | 44.694 | 50.778 | 4.528 | 0.126 | |||||||
| ma101107_rel.cz11c_bee | 29.111 | 65.500 | 5.389 | 0.150 | |||||||
| ma101107_rel.cz11d_bee | 5.778 | 93.194 | 0.722 | 0.306 | 0.101 |
Performance metrics for the DBMS listed above. Some are normalized by throughput, others are not. Legend for results is here.
ips	qps	rps	rmbps	wps	wmbps	rpq	rkbpq	wpi	wkbpi	csps	cpups	cspq	cpupq	dbgb1	dbgb2	rss	maxop	p50	p99	tag
100	3355	637	9.9	258.5	8.3	0.190	3.022	2.593	84.817	16598	13.1	4.947	312	144.4	160.2	10.1	0.090	3356	2573	ma101107_rel.cz11a_bee
100	3328	637	9.9	261.3	8.3	0.191	3.044	2.618	85.292	16485	13.1	4.953	315	144.4	160.2	10.1	0.090	3324	2543	ma101107_rel.cz11apur1_bee
100	3326	636	9.9	263.4	8.3	0.191	3.046	2.640	84.677	16483	13.1	4.955	315	144.4	160.2	10.1	0.091	3324	2461	ma101107_rel.cz11b_bee
100	3380	627	10.4	261.7	8.2	0.185	3.140	2.622	84.579	17147	13.6	5.073	322	144.4	160.2	9.9	0.103	3372	2125	ma101107_rel.cz11c_bee
100	3321	373	5.8	151.3	5.0	0.112	1.782	1.516	51.743	15057	13.0	4.534	313	148.8	165.4	10.1	0.088	3324	2317	ma101107_rel.cz11d_bee
qp100.L2
qp100.L2: point queries with 100 insert/s per client. Graphs for performance per 1-second interval are here.
Average throughput:
Query response time histogram: each cell has the percentage of responses that take <= the time in the header and max is the max response time in seconds. For max values in the top 25% of the range have a red background and in the bottom 25% of the range have a green background. The red background is not used when the min value is within 80% of the max value.
| dbms | 256us | 1ms | 4ms | 16ms | 64ms | 256ms | 1s | 4s | 16s | gt | max |
|---|---|---|---|---|---|---|---|---|---|---|---|
| ma101107_rel.cz11a_bee | 0.213 | 99.139 | 0.251 | 0.392 | 0.006 | 0.086 | |||||
| ma101107_rel.cz11apur1_bee | 0.237 | 99.115 | 0.251 | 0.391 | 0.006 | 0.086 | |||||
| ma101107_rel.cz11b_bee | 0.196 | 99.039 | 0.368 | 0.391 | 0.006 | 0.083 | |||||
| ma101107_rel.cz11c_bee | 0.023 | 97.695 | 1.838 | 0.438 | 0.006 | 0.187 | |||||
| ma101107_rel.cz11d_bee | 0.223 | 99.263 | 0.136 | 0.372 | 0.007 | 0.086 |
Insert response time histogram: each cell has the percentage of responses that take <= the time in the header and max is the max response time in seconds. For max values in the top 25% of the range have a red background and in the bottom 25% of the range have a green background. The red background is not used when the min value is within 80% of the max value.
| dbms | 256us | 1ms | 4ms | 16ms | 64ms | 256ms | 1s | 4s | 16s | gt | max |
|---|---|---|---|---|---|---|---|---|---|---|---|
| ma101107_rel.cz11a_bee | 98.194 | 1.806 | 0.100 | ||||||||
| ma101107_rel.cz11apur1_bee | 98.000 | 2.000 | 0.107 | ||||||||
| ma101107_rel.cz11b_bee | 96.917 | 3.083 | 0.105 | ||||||||
| ma101107_rel.cz11c_bee | 88.333 | 11.639 | 0.028 | 0.369 | |||||||
| ma101107_rel.cz11d_bee | 68.639 | 30.472 | 0.889 | 0.099 |
Delete response time histogram: each cell has the percentage of responses that take <= the time in the header and max is the max response time in seconds. For max values in the top 25% of the range have a red background and in the bottom 25% of the range have a green background. The red background is not used when the min value is within 80% of the max value.
| dbms | 256us | 1ms | 4ms | 16ms | 64ms | 256ms | 1s | 4s | 16s | gt | max |
|---|---|---|---|---|---|---|---|---|---|---|---|
| ma101107_rel.cz11a_bee | 42.000 | 57.139 | 0.861 | 0.092 | |||||||
| ma101107_rel.cz11apur1_bee | 38.556 | 60.361 | 1.083 | 0.096 | |||||||
| ma101107_rel.cz11b_bee | 38.056 | 60.417 | 1.528 | 0.099 | |||||||
| ma101107_rel.cz11c_bee | 28.917 | 64.889 | 6.167 | 0.028 | 0.365 | ||||||
| ma101107_rel.cz11d_bee | 6.528 | 88.667 | 4.722 | 0.083 | 0.085 |
Performance metrics for the DBMS listed above. Some are normalized by throughput, others are not. Legend for results is here.
ips	qps	rps	rmbps	wps	wmbps	rpq	rkbpq	wpi	wkbpi	csps	cpups	cspq	cpupq	dbgb1	dbgb2	rss	maxop	p50	p99	tag
100	588	5876	91.8	735.1	21.8	9.985	159.655	7.366	223.556	18767	5.4	31.890	734	144.4	160.2	10.1	0.086	591	495	ma101107_rel.cz11a_bee
100	591	5898	92.1	743.0	22.0	9.981	159.596	7.445	225.337	18838	5.3	31.880	718	144.4	160.2	10.1	0.086	592	495	ma101107_rel.cz11apur1_bee
100	579	5799	90.5	755.7	21.9	10.015	160.138	7.572	224.746	18619	5.4	32.156	746	144.4	160.2	10.1	0.083	591	479	ma101107_rel.cz11b_bee
100	490	5017	79.5	734.8	21.5	10.230	165.961	7.362	220.231	19644	6.4	40.057	1044	144.4	160.2	9.1	0.187	495	416	ma101107_rel.cz11c_bee
100	592	5629	87.9	592.9	17.2	9.501	151.921	5.941	176.913	17172	5.1	28.983	689	148.8	165.4	10.1	0.086	607	495	ma101107_rel.cz11d_bee
qr500.L3
qr500.L3: range queries with 500 insert/s per client. Graphs for performance per 1-second interval are here.
Average throughput:
Query response time histogram: each cell has the percentage of responses that take <= the time in the header and max is the max response time in seconds. For max values in the top 25% of the range have a red background and in the bottom 25% of the range have a green background. The red background is not used when the min value is within 80% of the max value.
| dbms | 256us | 1ms | 4ms | 16ms | 64ms | 256ms | 1s | 4s | 16s | gt | max |
|---|---|---|---|---|---|---|---|---|---|---|---|
| ma101107_rel.cz11a_bee | 43.290 | 56.358 | 0.279 | 0.053 | 0.008 | 0.011 | 0.092 | ||||
| ma101107_rel.cz11apur1_bee | 39.009 | 60.627 | 0.289 | 0.054 | 0.008 | 0.013 | 0.092 | ||||
| ma101107_rel.cz11b_bee | 39.444 | 60.080 | 0.387 | 0.070 | 0.008 | 0.010 | 0.094 | ||||
| ma101107_rel.cz11c_bee | 44.480 | 55.132 | 0.286 | 0.081 | 0.013 | 0.009 | 0.189 | ||||
| ma101107_rel.cz11d_bee | 38.757 | 60.948 | 0.232 | 0.050 | 0.005 | 0.008 | 0.096 |
Insert response time histogram: each cell has the percentage of responses that take <= the time in the header and max is the max response time in seconds. For max values in the top 25% of the range have a red background and in the bottom 25% of the range have a green background. The red background is not used when the min value is within 80% of the max value.
| dbms | 256us | 1ms | 4ms | 16ms | 64ms | 256ms | 1s | 4s | 16s | gt | max |
|---|---|---|---|---|---|---|---|---|---|---|---|
| ma101107_rel.cz11a_bee | 10.700 | 80.672 | 8.628 | 0.143 | |||||||
| ma101107_rel.cz11apur1_bee | 9.467 | 81.817 | 8.717 | 0.125 | |||||||
| ma101107_rel.cz11b_bee | 7.750 | 83.594 | 8.656 | 0.144 | |||||||
| ma101107_rel.cz11c_bee | 0.128 | 91.144 | 8.722 | 0.006 | 0.330 | ||||||
| ma101107_rel.cz11d_bee | 85.667 | 11.428 | 2.906 | 0.123 |
Delete response time histogram: each cell has the percentage of responses that take <= the time in the header and max is the max response time in seconds. For max values in the top 25% of the range have a red background and in the bottom 25% of the range have a green background. The red background is not used when the min value is within 80% of the max value.
| dbms | 256us | 1ms | 4ms | 16ms | 64ms | 256ms | 1s | 4s | 16s | gt | max |
|---|---|---|---|---|---|---|---|---|---|---|---|
| ma101107_rel.cz11a_bee | 68.717 | 23.778 | 7.506 | 0.119 | |||||||
| ma101107_rel.cz11apur1_bee | 68.483 | 23.883 | 7.633 | 0.118 | |||||||
| ma101107_rel.cz11b_bee | 61.761 | 31.111 | 7.128 | 0.124 | |||||||
| ma101107_rel.cz11c_bee | 58.922 | 35.628 | 5.439 | 0.011 | 0.322 | ||||||
| ma101107_rel.cz11d_bee | 16.217 | 82.450 | 0.344 | 0.989 | 0.106 |
Performance metrics for the DBMS listed above. Some are normalized by throughput, others are not. Legend for results is here.
ips	qps	rps	rmbps	wps	wmbps	rpq	rkbpq	wpi	wkbpi	csps	cpups	cspq	cpupq	dbgb1	dbgb2	rss	maxop	p50	p99	tag
499	3148	2960	46.0	2284.1	69.4	0.940	14.960	4.576	142.347	34921	15.6	11.091	396	144.4	160.2	10.1	0.092	3164	1950	ma101107_rel.cz11a_bee
499	3088	2958	46.0	2284.1	69.2	0.958	15.247	4.577	141.881	34634	15.6	11.217	404	144.4	160.2	10.1	0.092	3116	1966	ma101107_rel.cz11apur1_bee
499	3074	2958	46.0	2346.8	69.8	0.962	15.311	4.702	143.226	34884	15.7	11.347	409	144.4	160.2	10.1	0.094	3100	1903	ma101107_rel.cz11b_bee
499	3197	2905	46.8	2347.3	70.1	0.909	14.989	4.703	143.784	37031	18.1	11.584	453	144.4	160.2	9.0	0.189	3244	1327	ma101107_rel.cz11c_bee
499	3189	1616	25.0	1645.5	49.8	0.507	8.032	3.297	102.213	26992	15.2	8.464	381	148.8	165.6	10.1	0.096	3213	2285	ma101107_rel.cz11d_bee
qp500.L4
qp500.L4: point queries with 500 insert/s per client. Graphs for performance per 1-second interval are here.
Average throughput:
Query response time histogram: each cell has the percentage of responses that take <= the time in the header and max is the max response time in seconds. For max values in the top 25% of the range have a red background and in the bottom 25% of the range have a green background. The red background is not used when the min value is within 80% of the max value.
| dbms | 256us | 1ms | 4ms | 16ms | 64ms | 256ms | 1s | 4s | 16s | gt | max |
|---|---|---|---|---|---|---|---|---|---|---|---|
| ma101107_rel.cz11a_bee | 0.011 | 97.738 | 1.621 | 0.613 | 0.016 | 0.082 | |||||
| ma101107_rel.cz11apur1_bee | 0.013 | 97.763 | 1.596 | 0.614 | 0.014 | 0.084 | |||||
| ma101107_rel.cz11b_bee | 0.011 | 95.929 | 3.448 | 0.599 | 0.014 | 0.101 | |||||
| ma101107_rel.cz11c_bee | nonzero | 91.460 | 7.959 | 0.410 | 0.171 | 0.215 | |||||
| ma101107_rel.cz11d_bee | 0.031 | 98.492 | 0.987 | 0.483 | 0.009 | 0.086 |
Insert response time histogram: each cell has the percentage of responses that take <= the time in the header and max is the max response time in seconds. For max values in the top 25% of the range have a red background and in the bottom 25% of the range have a green background. The red background is not used when the min value is within 80% of the max value.
| dbms | 256us | 1ms | 4ms | 16ms | 64ms | 256ms | 1s | 4s | 16s | gt | max |
|---|---|---|---|---|---|---|---|---|---|---|---|
| ma101107_rel.cz11a_bee | 7.961 | 76.528 | 15.511 | 0.144 | |||||||
| ma101107_rel.cz11apur1_bee | 6.717 | 77.400 | 15.883 | 0.147 | |||||||
| ma101107_rel.cz11b_bee | 5.956 | 80.778 | 13.267 | 0.177 | |||||||
| ma101107_rel.cz11c_bee | 0.028 | 85.283 | 14.656 | 0.033 | 0.330 | ||||||
| ma101107_rel.cz11d_bee | 92.939 | 2.311 | 4.750 | 0.110 |
Delete response time histogram: each cell has the percentage of responses that take <= the time in the header and max is the max response time in seconds. For max values in the top 25% of the range have a red background and in the bottom 25% of the range have a green background. The red background is not used when the min value is within 80% of the max value.
| dbms | 256us | 1ms | 4ms | 16ms | 64ms | 256ms | 1s | 4s | 16s | gt | max |
|---|---|---|---|---|---|---|---|---|---|---|---|
| ma101107_rel.cz11a_bee | 81.800 | 6.667 | 11.533 | 0.144 | |||||||
| ma101107_rel.cz11apur1_bee | 80.411 | 6.750 | 12.839 | 0.144 | |||||||
| ma101107_rel.cz11b_bee | 61.133 | 28.428 | 10.439 | 0.150 | |||||||
| ma101107_rel.cz11c_bee | 31.550 | 60.711 | 7.717 | 0.022 | 0.296 | ||||||
| ma101107_rel.cz11d_bee | 25.156 | 71.933 | 1.756 | 1.156 | 0.096 |
Performance metrics for the DBMS listed above. Some are normalized by throughput, others are not. Legend for results is here.
ips	qps	rps	rmbps	wps	wmbps	rpq	rkbpq	wpi	wkbpi	csps	cpups	cspq	cpupq	dbgb1	dbgb2	rss	maxop	p50	p99	tag
499	478	7543	117.6	2566.1	77.4	15.770	251.809	5.141	158.708	35072	8.4	73.326	1405	144.4	160.2	10.1	0.082	479	447	ma101107_rel.cz11a_bee
499	479	7555	117.8	2577.9	77.5	15.760	251.651	5.165	158.935	35103	8.3	73.223	1385	144.4	160.2	10.1	0.084	479	447	ma101107_rel.cz11apur1_bee
499	450	7281	113.5	2607.8	77.1	16.199	258.617	5.225	158.242	34790	8.3	77.398	1477	144.4	160.2	10.1	0.101	448	400	ma101107_rel.cz11b_bee
499	370	6485	102.5	2582.3	76.6	17.522	283.531	5.174	157.128	41215	11.6	111.362	2507	144.4	160.2	8.9	0.215	368	272	ma101107_rel.cz11c_bee
499	514	6390	99.6	1739.0	52.1	12.436	198.502	3.484	106.984	26337	7.7	51.259	1199	148.8	165.9	10.2	0.086	511	479	ma101107_rel.cz11d_bee
qr1000.L5
qr1000.L5: range queries with 1000 insert/s per client. Graphs for performance per 1-second interval are here.
Average throughput:
Query response time histogram: each cell has the percentage of responses that take <= the time in the header and max is the max response time in seconds. For max values in the top 25% of the range have a red background and in the bottom 25% of the range have a green background. The red background is not used when the min value is within 80% of the max value.
| dbms | 256us | 1ms | 4ms | 16ms | 64ms | 256ms | 1s | 4s | 16s | gt | max |
|---|---|---|---|---|---|---|---|---|---|---|---|
| ma101107_rel.cz11a_bee | 39.160 | 60.185 | 0.551 | 0.054 | 0.020 | 0.030 | 0.092 | ||||
| ma101107_rel.cz11apur1_bee | 38.805 | 60.534 | 0.557 | 0.055 | 0.019 | 0.030 | 0.091 | ||||
| ma101107_rel.cz11b_bee | 33.053 | 64.680 | 2.096 | 0.110 | 0.033 | 0.028 | 0.111 | ||||
| ma101107_rel.cz11c_bee | 44.824 | 54.094 | 0.865 | 0.164 | 0.041 | 0.013 | 0.127 | ||||
| ma101107_rel.cz11d_bee | 38.187 | 61.460 | 0.290 | 0.041 | 0.005 | 0.016 | 0.096 |
Insert response time histogram: each cell has the percentage of responses that take <= the time in the header and max is the max response time in seconds. For max values in the top 25% of the range have a red background and in the bottom 25% of the range have a green background. The red background is not used when the min value is within 80% of the max value.
| dbms | 256us | 1ms | 4ms | 16ms | 64ms | 256ms | 1s | 4s | 16s | gt | max |
|---|---|---|---|---|---|---|---|---|---|---|---|
| ma101107_rel.cz11a_bee | 24.103 | 66.731 | 9.167 | 0.235 | |||||||
| ma101107_rel.cz11apur1_bee | 22.194 | 68.600 | 9.206 | 0.192 | |||||||
| ma101107_rel.cz11b_bee | 1.247 | 88.600 | 10.153 | 0.165 | |||||||
| ma101107_rel.cz11c_bee | 90.506 | 9.400 | 0.094 | 0.349 | |||||||
| ma101107_rel.cz11d_bee | 93.597 | 4.247 | 2.156 | 0.166 |
Delete response time histogram: each cell has the percentage of responses that take <= the time in the header and max is the max response time in seconds. For max values in the top 25% of the range have a red background and in the bottom 25% of the range have a green background. The red background is not used when the min value is within 80% of the max value.
| dbms | 256us | 1ms | 4ms | 16ms | 64ms | 256ms | 1s | 4s | 16s | gt | max |
|---|---|---|---|---|---|---|---|---|---|---|---|
| ma101107_rel.cz11a_bee | 66.717 | 25.486 | 7.797 | 0.183 | |||||||
| ma101107_rel.cz11apur1_bee | 65.267 | 26.872 | 7.861 | 0.190 | |||||||
| ma101107_rel.cz11b_bee | 39.008 | 53.631 | 7.361 | 0.150 | |||||||
| ma101107_rel.cz11c_bee | 9.481 | 85.464 | 5.050 | 0.006 | 0.318 | ||||||
| ma101107_rel.cz11d_bee | 23.642 | 75.481 | 0.147 | 0.731 | 0.104 |
Performance metrics for the DBMS listed above. Some are normalized by throughput, others are not. Legend for results is here.
ips	qps	rps	rmbps	wps	wmbps	rpq	rkbpq	wpi	wkbpi	csps	cpups	cspq	cpupq	dbgb1	dbgb2	rss	maxop	p50	p99	tag
999	2822	5659	87.9	4580.9	138.7	2.005	31.902	4.586	142.228	56049	18.6	19.859	527	144.4	160.2	10.1	0.092	2861	1326	ma101107_rel.cz11a_bee
999	2831	5659	87.9	4597.8	138.7	1.999	31.810	4.603	142.243	56184	18.7	19.847	528	144.4	160.2	10.1	0.091	2861	1375	ma101107_rel.cz11apur1_bee
999	2500	5662	88.0	4698.9	139.6	2.265	36.034	4.705	143.108	55599	18.2	22.243	582	144.4	160.2	10.1	0.111	2589	1183	ma101107_rel.cz11b_bee
984	2879	5452	86.5	4623.1	137.4	1.894	30.783	4.700	143.066	64865	23.1	22.530	642	144.4	160.2	8.8	0.127	2957	991	ma101107_rel.cz11c_bee
998	3086	2656	41.0	3086.1	93.3	0.861	13.616	3.091	95.721	37720	17.8	12.225	462	148.8	166.6	10.1	0.096	3101	1774	ma101107_rel.cz11d_bee
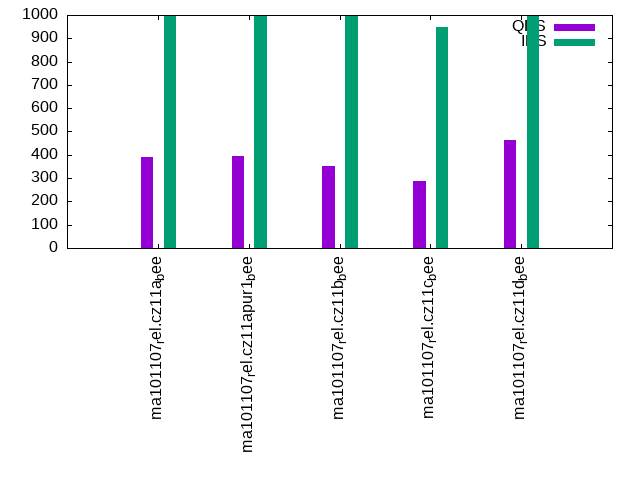
qp1000.L6
qp1000.L6: point queries with 1000 insert/s per client. Graphs for performance per 1-second interval are here.
Average throughput:
Query response time histogram: each cell has the percentage of responses that take <= the time in the header and max is the max response time in seconds. For max values in the top 25% of the range have a red background and in the bottom 25% of the range have a green background. The red background is not used when the min value is within 80% of the max value.
| dbms | 256us | 1ms | 4ms | 16ms | 64ms | 256ms | 1s | 4s | 16s | gt | max |
|---|---|---|---|---|---|---|---|---|---|---|---|
| ma101107_rel.cz11a_bee | 0.001 | 95.332 | 3.700 | 0.232 | 0.733 | 0.100 | |||||
| ma101107_rel.cz11apur1_bee | 0.002 | 95.450 | 3.585 | 0.235 | 0.728 | 0.091 | |||||
| ma101107_rel.cz11b_bee | nonzero | 89.599 | 9.539 | 0.293 | 0.569 | 0.103 | |||||
| ma101107_rel.cz11c_bee | 80.800 | 18.366 | 0.703 | 0.131 | 0.001 | 0.279 | |||||
| ma101107_rel.cz11d_bee | 0.006 | 97.507 | 1.893 | 0.114 | 0.480 | 0.089 |
Insert response time histogram: each cell has the percentage of responses that take <= the time in the header and max is the max response time in seconds. For max values in the top 25% of the range have a red background and in the bottom 25% of the range have a green background. The red background is not used when the min value is within 80% of the max value.
| dbms | 256us | 1ms | 4ms | 16ms | 64ms | 256ms | 1s | 4s | 16s | gt | max |
|---|---|---|---|---|---|---|---|---|---|---|---|
| ma101107_rel.cz11a_bee | 9.456 | 75.803 | 14.742 | 0.178 | |||||||
| ma101107_rel.cz11apur1_bee | 10.592 | 74.628 | 14.781 | 0.177 | |||||||
| ma101107_rel.cz11b_bee | 0.103 | 84.844 | 15.053 | 0.176 | |||||||
| ma101107_rel.cz11c_bee | 85.133 | 14.606 | 0.261 | 0.684 | |||||||
| ma101107_rel.cz11d_bee | 91.400 | 3.503 | 5.097 | 0.165 |
Delete response time histogram: each cell has the percentage of responses that take <= the time in the header and max is the max response time in seconds. For max values in the top 25% of the range have a red background and in the bottom 25% of the range have a green background. The red background is not used when the min value is within 80% of the max value.
| dbms | 256us | 1ms | 4ms | 16ms | 64ms | 256ms | 1s | 4s | 16s | gt | max |
|---|---|---|---|---|---|---|---|---|---|---|---|
| ma101107_rel.cz11a_bee | 49.792 | 37.894 | 12.314 | 0.165 | |||||||
| ma101107_rel.cz11apur1_bee | 50.903 | 36.928 | 12.169 | 0.163 | |||||||
| ma101107_rel.cz11b_bee | 24.086 | 65.206 | 10.708 | 0.159 | |||||||
| ma101107_rel.cz11c_bee | 0.228 | 94.517 | 5.092 | 0.164 | 0.674 | ||||||
| ma101107_rel.cz11d_bee | 21.172 | 76.083 | 0.839 | 1.906 | 0.129 |
Performance metrics for the DBMS listed above. Some are normalized by throughput, others are not. Legend for results is here.
ips	qps	rps	rmbps	wps	wmbps	rpq	rkbpq	wpi	wkbpi	csps	cpups	cspq	cpupq	dbgb1	dbgb2	rss	maxop	p50	p99	tag
998	391	9569	149.0	4706.0	142.2	24.472	390.238	4.714	145.835	56258	12.2	143.883	2496	144.4	160.2	10.1	0.100	384	336	ma101107_rel.cz11a_bee
998	394	9597	149.5	4721.2	142.2	24.376	388.715	4.729	145.827	56257	12.2	142.894	2479	144.4	160.2	10.1	0.091	399	336	ma101107_rel.cz11apur1_bee
999	354	9197	143.2	4772.7	141.5	25.994	414.450	4.778	145.097	55279	11.7	156.245	2646	144.4	160.2	10.1	0.103	352	288	ma101107_rel.cz11b_bee
948	286	8080	127.1	4416.6	131.2	28.271	455.219	4.660	141.713	68080	16.2	238.208	4535	144.4	160.2	8.6	0.279	288	176	ma101107_rel.cz11c_bee
999	463	7054	109.8	2911.7	87.8	15.249	242.944	2.915	90.018	35754	10.5	77.289	1816	148.8	167.3	10.1	0.089	463	416	ma101107_rel.cz11d_bee
l.i0
l.i0: load without secondary indexes
Performance metrics for all DBMS, not just the ones listed above. Some are normalized by throughput, others are not. Legend for results is here.
ips	qps	rps	rmbps	wps	wmbps	rpq	rkbpq	wpi	wkbpi	csps	cpups	cspq	cpupq	dbgb1	dbgb2	rss	maxop	p50	p99	tag
78194	0	600	2.3	388.5	22.9	0.008	0.031	0.005	0.300	11954	25.6	0.153	26	52.6	68.4	10.3	0.210	78313	68622	ma101107_rel.cz11a_bee
79404	0	608	2.4	394.8	23.2	0.008	0.031	0.005	0.300	11483	25.4	0.145	26	52.6	68.4	10.3	0.188	79612	69423	ma101107_rel.cz11apur1_bee
77768	0	597	2.3	392.1	22.7	0.008	0.031	0.005	0.300	11935	25.6	0.153	26	52.6	68.4	10.3	0.236	77954	67823	ma101107_rel.cz11b_bee
76805	0	589	2.3	80.1	22.5	0.008	0.031	0.001	0.300	11748	25.3	0.153	26	52.6	68.4	10.3	0.288	78114	60032	ma101107_rel.cz11c_bee
78647	0	602	2.4	390.9	23.0	0.008	0.031	0.005	0.300	12034	25.7	0.153	26	52.6	68.4	10.3	0.198	78910	68957	ma101107_rel.cz11d_bee
l.x
l.x: create secondary indexes
Performance metrics for all DBMS, not just the ones listed above. Some are normalized by throughput, others are not. Legend for results is here.
ips	qps	rps	rmbps	wps	wmbps	rpq	rkbpq	wpi	wkbpi	csps	cpups	cspq	cpupq	dbgb1	dbgb2	rss	maxop	p50	p99	tag
98888	0	632	99.9	730.6	111.1	0.006	1.034	0.007	1.151	3320	11.9	0.034	10	119.9	135.7	10.3	0.002	NA	NA	ma101107_rel.cz11a_bee
98826	0	640	99.8	734.9	111.1	0.006	1.034	0.007	1.151	3347	11.8	0.034	10	119.9	135.7	10.3	0.002	NA	NA	ma101107_rel.cz11apur1_bee
98765	0	634	99.8	727.6	111.0	0.006	1.035	0.007	1.151	3343	11.9	0.034	10	119.9	135.7	10.3	0.002	NA	NA	ma101107_rel.cz11b_bee
98998	0	319	100.0	290.0	111.1	0.003	1.034	0.003	1.149	2527	12.0	0.026	10	119.9	135.7	10.3	0.002	NA	NA	ma101107_rel.cz11c_bee
98985	0	644	100.0	736.9	111.2	0.007	1.034	0.007	1.151	3341	11.9	0.034	10	119.9	135.7	10.3	0.002	NA	NA	ma101107_rel.cz11d_bee
l.i1
l.i1: continue load after secondary indexes created with 50 inserts per transaction
Performance metrics for all DBMS, not just the ones listed above. Some are normalized by throughput, others are not. Legend for results is here.
ips	qps	rps	rmbps	wps	wmbps	rpq	rkbpq	wpi	wkbpi	csps	cpups	cspq	cpupq	dbgb1	dbgb2	rss	maxop	p50	p99	tag
1070	0	6860	106.5	6305.4	186.7	6.412	101.951	5.894	178.714	60663	11.8	56.705	882	144.4	160.2	10.1	3.772	1099	749	ma101107_rel.cz11a_bee
1064	0	6822	105.9	6294.9	185.8	6.413	101.958	5.917	178.805	60310	11.8	56.693	887	144.4	160.2	10.1	3.995	1099	749	ma101107_rel.cz11apur1_bee
961	0	6153	95.6	5812.3	169.3	6.404	101.838	6.049	180.481	54631	10.4	56.860	866	144.4	160.2	10.1	4.085	949	550	ma101107_rel.cz11b_bee
719	0	4542	79.7	3943.6	128.4	6.318	113.466	5.486	182.863	49011	12.1	68.176	1347	144.4	160.2	10.1	6.514	700	250	ma101107_rel.cz11c_bee
1340	0	5936	91.9	6595.4	192.7	4.432	70.292	4.924	147.290	59527	13.4	44.439	800	148.8	165.0	10.8	4.074	1249	749	ma101107_rel.cz11d_bee
l.i2
l.i2: continue load after secondary indexes created with 5 inserts per transaction
Performance metrics for all DBMS, not just the ones listed above. Some are normalized by throughput, others are not. Legend for results is here.
ips	qps	rps	rmbps	wps	wmbps	rpq	rkbpq	wpi	wkbpi	csps	cpups	cspq	cpupq	dbgb1	dbgb2	rss	maxop	p50	p99	tag
1167	0	7189	108.2	6038.7	182.6	6.161	94.946	5.175	160.232	63665	14.8	54.564	1015	144.4	160.2	10.1	0.141	1174	989	ma101107_rel.cz11a_bee
1170	0	7198	108.3	6097.3	183.7	6.155	94.842	5.214	160.844	63752	14.8	54.512	1012	144.4	160.2	10.1	0.140	1174	994	ma101107_rel.cz11apur1_bee
1027	0	6327	95.2	5388.9	159.2	6.163	94.924	5.249	158.748	55896	13.0	54.448	1013	144.4	160.2	10.1	0.142	1069	459	ma101107_rel.cz11b_bee
735	0	4473	69.2	3799.0	113.6	6.084	96.436	5.167	158.273	46341	13.9	63.032	1512	144.4	160.2	8.9	0.380	839	45	ma101107_rel.cz11c_bee
1701	0	5877	85.5	6142.1	184.9	3.456	51.486	3.612	111.360	62721	20.0	36.882	941	148.8	165.4	11.0	0.173	1703	1458	ma101107_rel.cz11d_bee
qr100.L1
qr100.L1: range queries with 100 insert/s per client
Performance metrics for all DBMS, not just the ones listed above. Some are normalized by throughput, others are not. Legend for results is here.
ips	qps	rps	rmbps	wps	wmbps	rpq	rkbpq	wpi	wkbpi	csps	cpups	cspq	cpupq	dbgb1	dbgb2	rss	maxop	p50	p99	tag
100	3355	637	9.9	258.5	8.3	0.190	3.022	2.593	84.817	16598	13.1	4.947	312	144.4	160.2	10.1	0.090	3356	2573	ma101107_rel.cz11a_bee
100	3328	637	9.9	261.3	8.3	0.191	3.044	2.618	85.292	16485	13.1	4.953	315	144.4	160.2	10.1	0.090	3324	2543	ma101107_rel.cz11apur1_bee
100	3326	636	9.9	263.4	8.3	0.191	3.046	2.640	84.677	16483	13.1	4.955	315	144.4	160.2	10.1	0.091	3324	2461	ma101107_rel.cz11b_bee
100	3380	627	10.4	261.7	8.2	0.185	3.140	2.622	84.579	17147	13.6	5.073	322	144.4	160.2	9.9	0.103	3372	2125	ma101107_rel.cz11c_bee
100	3321	373	5.8	151.3	5.0	0.112	1.782	1.516	51.743	15057	13.0	4.534	313	148.8	165.4	10.1	0.088	3324	2317	ma101107_rel.cz11d_bee
qp100.L2
qp100.L2: point queries with 100 insert/s per client
Performance metrics for all DBMS, not just the ones listed above. Some are normalized by throughput, others are not. Legend for results is here.
ips	qps	rps	rmbps	wps	wmbps	rpq	rkbpq	wpi	wkbpi	csps	cpups	cspq	cpupq	dbgb1	dbgb2	rss	maxop	p50	p99	tag
100	588	5876	91.8	735.1	21.8	9.985	159.655	7.366	223.556	18767	5.4	31.890	734	144.4	160.2	10.1	0.086	591	495	ma101107_rel.cz11a_bee
100	591	5898	92.1	743.0	22.0	9.981	159.596	7.445	225.337	18838	5.3	31.880	718	144.4	160.2	10.1	0.086	592	495	ma101107_rel.cz11apur1_bee
100	579	5799	90.5	755.7	21.9	10.015	160.138	7.572	224.746	18619	5.4	32.156	746	144.4	160.2	10.1	0.083	591	479	ma101107_rel.cz11b_bee
100	490	5017	79.5	734.8	21.5	10.230	165.961	7.362	220.231	19644	6.4	40.057	1044	144.4	160.2	9.1	0.187	495	416	ma101107_rel.cz11c_bee
100	592	5629	87.9	592.9	17.2	9.501	151.921	5.941	176.913	17172	5.1	28.983	689	148.8	165.4	10.1	0.086	607	495	ma101107_rel.cz11d_bee
qr500.L3
qr500.L3: range queries with 500 insert/s per client
Performance metrics for all DBMS, not just the ones listed above. Some are normalized by throughput, others are not. Legend for results is here.
ips	qps	rps	rmbps	wps	wmbps	rpq	rkbpq	wpi	wkbpi	csps	cpups	cspq	cpupq	dbgb1	dbgb2	rss	maxop	p50	p99	tag
499	3148	2960	46.0	2284.1	69.4	0.940	14.960	4.576	142.347	34921	15.6	11.091	396	144.4	160.2	10.1	0.092	3164	1950	ma101107_rel.cz11a_bee
499	3088	2958	46.0	2284.1	69.2	0.958	15.247	4.577	141.881	34634	15.6	11.217	404	144.4	160.2	10.1	0.092	3116	1966	ma101107_rel.cz11apur1_bee
499	3074	2958	46.0	2346.8	69.8	0.962	15.311	4.702	143.226	34884	15.7	11.347	409	144.4	160.2	10.1	0.094	3100	1903	ma101107_rel.cz11b_bee
499	3197	2905	46.8	2347.3	70.1	0.909	14.989	4.703	143.784	37031	18.1	11.584	453	144.4	160.2	9.0	0.189	3244	1327	ma101107_rel.cz11c_bee
499	3189	1616	25.0	1645.5	49.8	0.507	8.032	3.297	102.213	26992	15.2	8.464	381	148.8	165.6	10.1	0.096	3213	2285	ma101107_rel.cz11d_bee
qp500.L4
qp500.L4: point queries with 500 insert/s per client
Performance metrics for all DBMS, not just the ones listed above. Some are normalized by throughput, others are not. Legend for results is here.
ips	qps	rps	rmbps	wps	wmbps	rpq	rkbpq	wpi	wkbpi	csps	cpups	cspq	cpupq	dbgb1	dbgb2	rss	maxop	p50	p99	tag
499	478	7543	117.6	2566.1	77.4	15.770	251.809	5.141	158.708	35072	8.4	73.326	1405	144.4	160.2	10.1	0.082	479	447	ma101107_rel.cz11a_bee
499	479	7555	117.8	2577.9	77.5	15.760	251.651	5.165	158.935	35103	8.3	73.223	1385	144.4	160.2	10.1	0.084	479	447	ma101107_rel.cz11apur1_bee
499	450	7281	113.5	2607.8	77.1	16.199	258.617	5.225	158.242	34790	8.3	77.398	1477	144.4	160.2	10.1	0.101	448	400	ma101107_rel.cz11b_bee
499	370	6485	102.5	2582.3	76.6	17.522	283.531	5.174	157.128	41215	11.6	111.362	2507	144.4	160.2	8.9	0.215	368	272	ma101107_rel.cz11c_bee
499	514	6390	99.6	1739.0	52.1	12.436	198.502	3.484	106.984	26337	7.7	51.259	1199	148.8	165.9	10.2	0.086	511	479	ma101107_rel.cz11d_bee
qr1000.L5
qr1000.L5: range queries with 1000 insert/s per client
Performance metrics for all DBMS, not just the ones listed above. Some are normalized by throughput, others are not. Legend for results is here.
ips	qps	rps	rmbps	wps	wmbps	rpq	rkbpq	wpi	wkbpi	csps	cpups	cspq	cpupq	dbgb1	dbgb2	rss	maxop	p50	p99	tag
999	2822	5659	87.9	4580.9	138.7	2.005	31.902	4.586	142.228	56049	18.6	19.859	527	144.4	160.2	10.1	0.092	2861	1326	ma101107_rel.cz11a_bee
999	2831	5659	87.9	4597.8	138.7	1.999	31.810	4.603	142.243	56184	18.7	19.847	528	144.4	160.2	10.1	0.091	2861	1375	ma101107_rel.cz11apur1_bee
999	2500	5662	88.0	4698.9	139.6	2.265	36.034	4.705	143.108	55599	18.2	22.243	582	144.4	160.2	10.1	0.111	2589	1183	ma101107_rel.cz11b_bee
984	2879	5452	86.5	4623.1	137.4	1.894	30.783	4.700	143.066	64865	23.1	22.530	642	144.4	160.2	8.8	0.127	2957	991	ma101107_rel.cz11c_bee
998	3086	2656	41.0	3086.1	93.3	0.861	13.616	3.091	95.721	37720	17.8	12.225	462	148.8	166.6	10.1	0.096	3101	1774	ma101107_rel.cz11d_bee
qp1000.L6
qp1000.L6: point queries with 1000 insert/s per client
Performance metrics for all DBMS, not just the ones listed above. Some are normalized by throughput, others are not. Legend for results is here.
ips	qps	rps	rmbps	wps	wmbps	rpq	rkbpq	wpi	wkbpi	csps	cpups	cspq	cpupq	dbgb1	dbgb2	rss	maxop	p50	p99	tag
998	391	9569	149.0	4706.0	142.2	24.472	390.238	4.714	145.835	56258	12.2	143.883	2496	144.4	160.2	10.1	0.100	384	336	ma101107_rel.cz11a_bee
998	394	9597	149.5	4721.2	142.2	24.376	388.715	4.729	145.827	56257	12.2	142.894	2479	144.4	160.2	10.1	0.091	399	336	ma101107_rel.cz11apur1_bee
999	354	9197	143.2	4772.7	141.5	25.994	414.450	4.778	145.097	55279	11.7	156.245	2646	144.4	160.2	10.1	0.103	352	288	ma101107_rel.cz11b_bee
948	286	8080	127.1	4416.6	131.2	28.271	455.219	4.660	141.713	68080	16.2	238.208	4535	144.4	160.2	8.6	0.279	288	176	ma101107_rel.cz11c_bee
999	463	7054	109.8	2911.7	87.8	15.249	242.944	2.915	90.018	35754	10.5	77.289	1816	148.8	167.3	10.1	0.089	463	416	ma101107_rel.cz11d_bee
l.i0
- l.i0: load without secondary indexes
- Legend for results is here.
- Each entry lists the percentage of responses that fit in that bucket (slower than max time for previous bucket, faster than min time for next bucket).
Insert response time histogram
256us	1ms	4ms	16ms	64ms	256ms	1s	4s	16s	gt	max	tag
0.000	0.743	99.006	0.201	0.046	0.004	0.000	0.000	0.000	0.000	0.210	ma101107_rel.cz11a_bee
0.000	1.015	98.736	0.212	0.033	0.004	0.000	0.000	0.000	0.000	0.188	ma101107_rel.cz11apur1_bee
0.000	0.612	99.129	0.214	0.040	0.005	0.000	0.000	0.000	0.000	0.236	ma101107_rel.cz11b_bee
0.000	0.561	99.169	0.206	0.044	0.019	nonzero	0.000	0.000	0.000	0.288	ma101107_rel.cz11c_bee
0.000	0.715	99.037	0.210	0.034	0.004	0.000	0.000	0.000	0.000	0.198	ma101107_rel.cz11d_bee
l.x
- l.x: create secondary indexes
- Legend for results is here.
- Each entry lists the percentage of responses that fit in that bucket (slower than max time for previous bucket, faster than min time for next bucket).
TODO - determine whether there is data for create index response time
l.i1
- l.i1: continue load after secondary indexes created with 50 inserts per transaction
- Legend for results is here.
- Each entry lists the percentage of responses that fit in that bucket (slower than max time for previous bucket, faster than min time for next bucket).
Insert response time histogram
256us	1ms	4ms	16ms	64ms	256ms	1s	4s	16s	gt	max	tag
0.000	0.000	0.000	0.000	84.365	15.629	0.005	0.001	0.000	0.000	3.772	ma101107_rel.cz11a_bee
0.000	0.000	0.000	0.000	84.388	15.609	0.003	0.001	0.000	0.000	3.995	ma101107_rel.cz11apur1_bee
0.000	0.000	0.000	0.000	77.414	22.541	0.044	0.000	0.001	0.000	4.085	ma101107_rel.cz11b_bee
0.000	0.000	0.000	0.000	65.310	32.653	2.024	0.013	0.001	0.000	6.514	ma101107_rel.cz11c_bee
0.000	0.000	0.000	9.420	79.530	11.048	0.001	0.000	0.001	0.000	4.074	ma101107_rel.cz11d_bee
Delete response time histogram
256us	1ms	4ms	16ms	64ms	256ms	1s	4s	16s	gt	max	tag
0.000	0.000	0.000	4.051	85.021	10.926	0.000	0.001	0.000	0.000	3.712	ma101107_rel.cz11a_bee
0.000	0.000	0.000	4.011	85.191	10.796	0.000	0.001	0.000	0.000	3.951	ma101107_rel.cz11apur1_bee
0.000	0.000	0.000	3.084	88.833	8.066	0.016	0.000	0.001	0.000	4.021	ma101107_rel.cz11b_bee
0.000	0.000	0.000	3.739	91.502	3.609	1.148	0.001	0.001	0.000	6.349	ma101107_rel.cz11c_bee
0.000	0.000	0.579	93.454	2.904	3.062	0.000	0.001	0.000	0.000	3.989	ma101107_rel.cz11d_bee
l.i2
- l.i2: continue load after secondary indexes created with 5 inserts per transaction
- Legend for results is here.
- Each entry lists the percentage of responses that fit in that bucket (slower than max time for previous bucket, faster than min time for next bucket).
Insert response time histogram
256us	1ms	4ms	16ms	64ms	256ms	1s	4s	16s	gt	max	tag
0.000	0.001	89.945	8.538	0.428	1.088	0.000	0.000	0.000	0.000	0.141	ma101107_rel.cz11a_bee
0.000	0.004	90.087	8.430	0.402	1.077	0.000	0.000	0.000	0.000	0.140	ma101107_rel.cz11apur1_bee
0.000	0.001	70.451	27.595	1.073	0.881	0.000	0.000	0.000	0.000	0.142	ma101107_rel.cz11b_bee
0.000	0.001	48.906	47.631	1.871	1.580	0.011	0.000	0.000	0.000	0.380	ma101107_rel.cz11c_bee
0.000	4.078	89.970	5.248	0.154	0.549	0.000	0.000	0.000	0.000	0.173	ma101107_rel.cz11d_bee
Delete response time histogram
256us	1ms	4ms	16ms	64ms	256ms	1s	4s	16s	gt	max	tag
0.000	0.014	93.919	4.939	0.129	1.000	0.000	0.000	0.000	0.000	0.140	ma101107_rel.cz11a_bee
0.000	0.015	94.005	4.864	0.133	0.985	0.000	0.000	0.000	0.000	0.134	ma101107_rel.cz11apur1_bee
0.000	0.011	79.046	19.293	0.889	0.761	0.000	0.000	0.000	0.000	0.139	ma101107_rel.cz11b_bee
0.000	0.002	76.409	21.084	1.336	1.169	0.001	0.000	0.000	0.000	0.377	ma101107_rel.cz11c_bee
0.000	6.868	91.195	1.412	0.081	0.443	0.000	0.000	0.000	0.000	0.168	ma101107_rel.cz11d_bee
qr100.L1
- qr100.L1: range queries with 100 insert/s per client
- Legend for results is here.
- Each entry lists the percentage of responses that fit in that bucket (slower than max time for previous bucket, faster than min time for next bucket).
Query response time histogram
256us	1ms	4ms	16ms	64ms	256ms	1s	4s	16s	gt	max	tag
44.006	55.780	0.188	0.023	0.001	0.001	0.000	0.000	0.000	0.000	0.090	ma101107_rel.cz11a_bee
41.075	58.713	0.186	0.024	0.002	0.001	0.000	0.000	0.000	0.000	0.090	ma101107_rel.cz11apur1_bee
40.395	59.379	0.199	0.025	0.001	0.001	0.000	0.000	0.000	0.000	0.091	ma101107_rel.cz11b_bee
45.784	53.980	0.198	0.035	0.003	0.001	0.000	0.000	0.000	0.000	0.103	ma101107_rel.cz11c_bee
38.541	61.239	0.191	0.028	0.001	0.001	0.000	0.000	0.000	0.000	0.088	ma101107_rel.cz11d_bee
Insert response time histogram
256us	1ms	4ms	16ms	64ms	256ms	1s	4s	16s	gt	max	tag
0.000	0.000	0.000	0.222	93.917	5.861	0.000	0.000	0.000	0.000	0.123	ma101107_rel.cz11a_bee
0.000	0.000	0.000	0.083	94.278	5.639	0.000	0.000	0.000	0.000	0.126	ma101107_rel.cz11apur1_bee
0.000	0.000	0.000	0.167	94.000	5.833	0.000	0.000	0.000	0.000	0.135	ma101107_rel.cz11b_bee
0.000	0.000	0.000	0.000	92.889	7.111	0.000	0.000	0.000	0.000	0.181	ma101107_rel.cz11c_bee
0.000	0.000	0.000	51.861	45.889	2.250	0.000	0.000	0.000	0.000	0.121	ma101107_rel.cz11d_bee
Delete response time histogram
256us	1ms	4ms	16ms	64ms	256ms	1s	4s	16s	gt	max	tag
0.000	0.000	0.000	44.806	50.972	4.222	0.000	0.000	0.000	0.000	0.115	ma101107_rel.cz11a_bee
0.000	0.000	0.000	44.306	51.694	4.000	0.000	0.000	0.000	0.000	0.115	ma101107_rel.cz11apur1_bee
0.000	0.000	0.000	44.694	50.778	4.528	0.000	0.000	0.000	0.000	0.126	ma101107_rel.cz11b_bee
0.000	0.000	0.000	29.111	65.500	5.389	0.000	0.000	0.000	0.000	0.150	ma101107_rel.cz11c_bee
0.000	0.000	5.778	93.194	0.722	0.306	0.000	0.000	0.000	0.000	0.101	ma101107_rel.cz11d_bee
qp100.L2
- qp100.L2: point queries with 100 insert/s per client
- Legend for results is here.
- Each entry lists the percentage of responses that fit in that bucket (slower than max time for previous bucket, faster than min time for next bucket).
Query response time histogram
256us	1ms	4ms	16ms	64ms	256ms	1s	4s	16s	gt	max	tag
0.000	0.213	99.139	0.251	0.392	0.006	0.000	0.000	0.000	0.000	0.086	ma101107_rel.cz11a_bee
0.000	0.237	99.115	0.251	0.391	0.006	0.000	0.000	0.000	0.000	0.086	ma101107_rel.cz11apur1_bee
0.000	0.196	99.039	0.368	0.391	0.006	0.000	0.000	0.000	0.000	0.083	ma101107_rel.cz11b_bee
0.000	0.023	97.695	1.838	0.438	0.006	0.000	0.000	0.000	0.000	0.187	ma101107_rel.cz11c_bee
0.000	0.223	99.263	0.136	0.372	0.007	0.000	0.000	0.000	0.000	0.086	ma101107_rel.cz11d_bee
Insert response time histogram
256us	1ms	4ms	16ms	64ms	256ms	1s	4s	16s	gt	max	tag
0.000	0.000	0.000	0.000	98.194	1.806	0.000	0.000	0.000	0.000	0.100	ma101107_rel.cz11a_bee
0.000	0.000	0.000	0.000	98.000	2.000	0.000	0.000	0.000	0.000	0.107	ma101107_rel.cz11apur1_bee
0.000	0.000	0.000	0.000	96.917	3.083	0.000	0.000	0.000	0.000	0.105	ma101107_rel.cz11b_bee
0.000	0.000	0.000	0.000	88.333	11.639	0.028	0.000	0.000	0.000	0.369	ma101107_rel.cz11c_bee
0.000	0.000	0.000	68.639	30.472	0.889	0.000	0.000	0.000	0.000	0.099	ma101107_rel.cz11d_bee
Delete response time histogram
256us	1ms	4ms	16ms	64ms	256ms	1s	4s	16s	gt	max	tag
0.000	0.000	0.000	42.000	57.139	0.861	0.000	0.000	0.000	0.000	0.092	ma101107_rel.cz11a_bee
0.000	0.000	0.000	38.556	60.361	1.083	0.000	0.000	0.000	0.000	0.096	ma101107_rel.cz11apur1_bee
0.000	0.000	0.000	38.056	60.417	1.528	0.000	0.000	0.000	0.000	0.099	ma101107_rel.cz11b_bee
0.000	0.000	0.000	28.917	64.889	6.167	0.028	0.000	0.000	0.000	0.365	ma101107_rel.cz11c_bee
0.000	0.000	6.528	88.667	4.722	0.083	0.000	0.000	0.000	0.000	0.085	ma101107_rel.cz11d_bee
qr500.L3
- qr500.L3: range queries with 500 insert/s per client
- Legend for results is here.
- Each entry lists the percentage of responses that fit in that bucket (slower than max time for previous bucket, faster than min time for next bucket).
Query response time histogram
256us	1ms	4ms	16ms	64ms	256ms	1s	4s	16s	gt	max	tag
43.290	56.358	0.279	0.053	0.008	0.011	0.000	0.000	0.000	0.000	0.092	ma101107_rel.cz11a_bee
39.009	60.627	0.289	0.054	0.008	0.013	0.000	0.000	0.000	0.000	0.092	ma101107_rel.cz11apur1_bee
39.444	60.080	0.387	0.070	0.008	0.010	0.000	0.000	0.000	0.000	0.094	ma101107_rel.cz11b_bee
44.480	55.132	0.286	0.081	0.013	0.009	0.000	0.000	0.000	0.000	0.189	ma101107_rel.cz11c_bee
38.757	60.948	0.232	0.050	0.005	0.008	0.000	0.000	0.000	0.000	0.096	ma101107_rel.cz11d_bee
Insert response time histogram
256us	1ms	4ms	16ms	64ms	256ms	1s	4s	16s	gt	max	tag
0.000	0.000	0.000	10.700	80.672	8.628	0.000	0.000	0.000	0.000	0.143	ma101107_rel.cz11a_bee
0.000	0.000	0.000	9.467	81.817	8.717	0.000	0.000	0.000	0.000	0.125	ma101107_rel.cz11apur1_bee
0.000	0.000	0.000	7.750	83.594	8.656	0.000	0.000	0.000	0.000	0.144	ma101107_rel.cz11b_bee
0.000	0.000	0.000	0.128	91.144	8.722	0.006	0.000	0.000	0.000	0.330	ma101107_rel.cz11c_bee
0.000	0.000	0.000	85.667	11.428	2.906	0.000	0.000	0.000	0.000	0.123	ma101107_rel.cz11d_bee
Delete response time histogram
256us	1ms	4ms	16ms	64ms	256ms	1s	4s	16s	gt	max	tag
0.000	0.000	0.000	68.717	23.778	7.506	0.000	0.000	0.000	0.000	0.119	ma101107_rel.cz11a_bee
0.000	0.000	0.000	68.483	23.883	7.633	0.000	0.000	0.000	0.000	0.118	ma101107_rel.cz11apur1_bee
0.000	0.000	0.000	61.761	31.111	7.128	0.000	0.000	0.000	0.000	0.124	ma101107_rel.cz11b_bee
0.000	0.000	0.000	58.922	35.628	5.439	0.011	0.000	0.000	0.000	0.322	ma101107_rel.cz11c_bee
0.000	0.000	16.217	82.450	0.344	0.989	0.000	0.000	0.000	0.000	0.106	ma101107_rel.cz11d_bee
qp500.L4
- qp500.L4: point queries with 500 insert/s per client
- Legend for results is here.
- Each entry lists the percentage of responses that fit in that bucket (slower than max time for previous bucket, faster than min time for next bucket).
Query response time histogram
256us	1ms	4ms	16ms	64ms	256ms	1s	4s	16s	gt	max	tag
0.000	0.011	97.738	1.621	0.613	0.016	0.000	0.000	0.000	0.000	0.082	ma101107_rel.cz11a_bee
0.000	0.013	97.763	1.596	0.614	0.014	0.000	0.000	0.000	0.000	0.084	ma101107_rel.cz11apur1_bee
0.000	0.011	95.929	3.448	0.599	0.014	0.000	0.000	0.000	0.000	0.101	ma101107_rel.cz11b_bee
0.000	nonzero	91.460	7.959	0.410	0.171	0.000	0.000	0.000	0.000	0.215	ma101107_rel.cz11c_bee
0.000	0.031	98.492	0.987	0.483	0.009	0.000	0.000	0.000	0.000	0.086	ma101107_rel.cz11d_bee
Insert response time histogram
256us	1ms	4ms	16ms	64ms	256ms	1s	4s	16s	gt	max	tag
0.000	0.000	0.000	7.961	76.528	15.511	0.000	0.000	0.000	0.000	0.144	ma101107_rel.cz11a_bee
0.000	0.000	0.000	6.717	77.400	15.883	0.000	0.000	0.000	0.000	0.147	ma101107_rel.cz11apur1_bee
0.000	0.000	0.000	5.956	80.778	13.267	0.000	0.000	0.000	0.000	0.177	ma101107_rel.cz11b_bee
0.000	0.000	0.000	0.028	85.283	14.656	0.033	0.000	0.000	0.000	0.330	ma101107_rel.cz11c_bee
0.000	0.000	0.000	92.939	2.311	4.750	0.000	0.000	0.000	0.000	0.110	ma101107_rel.cz11d_bee
Delete response time histogram
256us	1ms	4ms	16ms	64ms	256ms	1s	4s	16s	gt	max	tag
0.000	0.000	0.000	81.800	6.667	11.533	0.000	0.000	0.000	0.000	0.144	ma101107_rel.cz11a_bee
0.000	0.000	0.000	80.411	6.750	12.839	0.000	0.000	0.000	0.000	0.144	ma101107_rel.cz11apur1_bee
0.000	0.000	0.000	61.133	28.428	10.439	0.000	0.000	0.000	0.000	0.150	ma101107_rel.cz11b_bee
0.000	0.000	0.000	31.550	60.711	7.717	0.022	0.000	0.000	0.000	0.296	ma101107_rel.cz11c_bee
0.000	0.000	25.156	71.933	1.756	1.156	0.000	0.000	0.000	0.000	0.096	ma101107_rel.cz11d_bee
qr1000.L5
- qr1000.L5: range queries with 1000 insert/s per client
- Legend for results is here.
- Each entry lists the percentage of responses that fit in that bucket (slower than max time for previous bucket, faster than min time for next bucket).
Query response time histogram
256us	1ms	4ms	16ms	64ms	256ms	1s	4s	16s	gt	max	tag
39.160	60.185	0.551	0.054	0.020	0.030	0.000	0.000	0.000	0.000	0.092	ma101107_rel.cz11a_bee
38.805	60.534	0.557	0.055	0.019	0.030	0.000	0.000	0.000	0.000	0.091	ma101107_rel.cz11apur1_bee
33.053	64.680	2.096	0.110	0.033	0.028	0.000	0.000	0.000	0.000	0.111	ma101107_rel.cz11b_bee
44.824	54.094	0.865	0.164	0.041	0.013	0.000	0.000	0.000	0.000	0.127	ma101107_rel.cz11c_bee
38.187	61.460	0.290	0.041	0.005	0.016	0.000	0.000	0.000	0.000	0.096	ma101107_rel.cz11d_bee
Insert response time histogram
256us	1ms	4ms	16ms	64ms	256ms	1s	4s	16s	gt	max	tag
0.000	0.000	0.000	24.103	66.731	9.167	0.000	0.000	0.000	0.000	0.235	ma101107_rel.cz11a_bee
0.000	0.000	0.000	22.194	68.600	9.206	0.000	0.000	0.000	0.000	0.192	ma101107_rel.cz11apur1_bee
0.000	0.000	0.000	1.247	88.600	10.153	0.000	0.000	0.000	0.000	0.165	ma101107_rel.cz11b_bee
0.000	0.000	0.000	0.000	90.506	9.400	0.094	0.000	0.000	0.000	0.349	ma101107_rel.cz11c_bee
0.000	0.000	0.000	93.597	4.247	2.156	0.000	0.000	0.000	0.000	0.166	ma101107_rel.cz11d_bee
Delete response time histogram
256us	1ms	4ms	16ms	64ms	256ms	1s	4s	16s	gt	max	tag
0.000	0.000	0.000	66.717	25.486	7.797	0.000	0.000	0.000	0.000	0.183	ma101107_rel.cz11a_bee
0.000	0.000	0.000	65.267	26.872	7.861	0.000	0.000	0.000	0.000	0.190	ma101107_rel.cz11apur1_bee
0.000	0.000	0.000	39.008	53.631	7.361	0.000	0.000	0.000	0.000	0.150	ma101107_rel.cz11b_bee
0.000	0.000	0.000	9.481	85.464	5.050	0.006	0.000	0.000	0.000	0.318	ma101107_rel.cz11c_bee
0.000	0.000	23.642	75.481	0.147	0.731	0.000	0.000	0.000	0.000	0.104	ma101107_rel.cz11d_bee
qp1000.L6
- qp1000.L6: point queries with 1000 insert/s per client
- Legend for results is here.
- Each entry lists the percentage of responses that fit in that bucket (slower than max time for previous bucket, faster than min time for next bucket).
Query response time histogram
256us	1ms	4ms	16ms	64ms	256ms	1s	4s	16s	gt	max	tag
0.000	0.001	95.332	3.700	0.232	0.733	0.000	0.000	0.000	0.000	0.100	ma101107_rel.cz11a_bee
0.000	0.002	95.450	3.585	0.235	0.728	0.000	0.000	0.000	0.000	0.091	ma101107_rel.cz11apur1_bee
0.000	nonzero	89.599	9.539	0.293	0.569	0.000	0.000	0.000	0.000	0.103	ma101107_rel.cz11b_bee
0.000	0.000	80.800	18.366	0.703	0.131	0.001	0.000	0.000	0.000	0.279	ma101107_rel.cz11c_bee
0.000	0.006	97.507	1.893	0.114	0.480	0.000	0.000	0.000	0.000	0.089	ma101107_rel.cz11d_bee
Insert response time histogram
256us	1ms	4ms	16ms	64ms	256ms	1s	4s	16s	gt	max	tag
0.000	0.000	0.000	9.456	75.803	14.742	0.000	0.000	0.000	0.000	0.178	ma101107_rel.cz11a_bee
0.000	0.000	0.000	10.592	74.628	14.781	0.000	0.000	0.000	0.000	0.177	ma101107_rel.cz11apur1_bee
0.000	0.000	0.000	0.103	84.844	15.053	0.000	0.000	0.000	0.000	0.176	ma101107_rel.cz11b_bee
0.000	0.000	0.000	0.000	85.133	14.606	0.261	0.000	0.000	0.000	0.684	ma101107_rel.cz11c_bee
0.000	0.000	0.000	91.400	3.503	5.097	0.000	0.000	0.000	0.000	0.165	ma101107_rel.cz11d_bee
Delete response time histogram
256us	1ms	4ms	16ms	64ms	256ms	1s	4s	16s	gt	max	tag
0.000	0.000	0.000	49.792	37.894	12.314	0.000	0.000	0.000	0.000	0.165	ma101107_rel.cz11a_bee
0.000	0.000	0.000	50.903	36.928	12.169	0.000	0.000	0.000	0.000	0.163	ma101107_rel.cz11apur1_bee
0.000	0.000	0.000	24.086	65.206	10.708	0.000	0.000	0.000	0.000	0.159	ma101107_rel.cz11b_bee
0.000	0.000	0.000	0.228	94.517	5.092	0.164	0.000	0.000	0.000	0.674	ma101107_rel.cz11c_bee
0.000	0.000	21.172	76.083	0.839	1.906	0.000	0.000	0.000	0.000	0.129	ma101107_rel.cz11d_bee