Introduction
This is a report for the insert benchmark with 48M docs and 4 client(s). It is generated by scripts (bash, awk, sed) and Tufte might not be impressed. An overview of the insert benchmark is here and a short update is here. Below, by DBMS, I mean DBMS+version.config. An example is my8020.c10b40 where my means MySQL, 8020 is version 8.0.20 and c10b40 is the name for the configuration file.
The test server has 8 AMD cores, 32G RAM and an NVMe SSD. It is described here as the ASUS PN53. The benchmark was run with 4 clients and there were 1 or 3 connections per client (1 for queries or inserts without rate limits, 1+1 for rate limited inserts+deletes). It uses 4 tables with a table per client. It loads 12M rows per table without secondary indexes, creates 3 secondary indexes per table, then inserts 40 rows per table with a delete per insert to avoid growing the table. It then does 6 read+write tests for 1800s each that do queries as fast as possible with 100,100,500,500,1000,1000 inserts/s and the same for deletes/s per client concurrent with the queries. The database is cached in memory. Clients and the DBMS share one server. The per-database configs are in the per-database subdirectories here.
The tested DBMS are:
- my5651_rel.cz11a_c8r32 - MySQL 5.6.51 with the cz11a_c8r32 config
- my5744_rel.cz11a_c8r32 - MySQL 5.7.44 with the cz11a_c8r32 config that uses innodb_purge_threads=4
- my5744_rel.cz11apur1_c8r32 - MySQL 5.7.44 with the cz11apur1_c8r32 config that uses innodb_purge_threads=1
- my8036_rel.cz11a_c8r32 - MySQL 8.0.36 with the cz11a_c8r32 config that uses innodb_purge_threads=4
- my8036_rel.cz11apur1_c8r32 - MySQL 8.0.36 with the cz11apur1_c8r32 config that uses innodb_purge_threads=1
Contents
- Summary
- l.i0: load without secondary indexes
- l.x: create secondary indexes
- l.i1: continue load after secondary indexes created with 50 inserts per transaction
- l.i2: continue load after secondary indexes created with 5 inserts per transaction
- qr100.L1: range queries with 100 insert/s per client
- qp100.L2: point queries with 100 insert/s per client
- qr500.L3: range queries with 500 insert/s per client
- qp500.L4: point queries with 500 insert/s per client
- qr1000.L5: range queries with 1000 insert/s per client
- qp1000.L6: point queries with 1000 insert/s per client
Summary
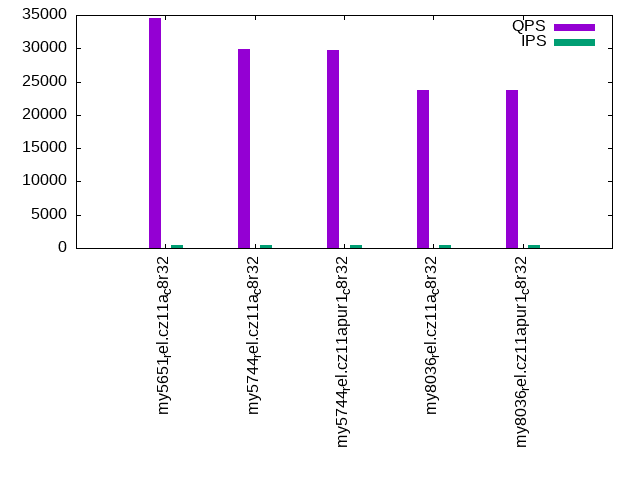
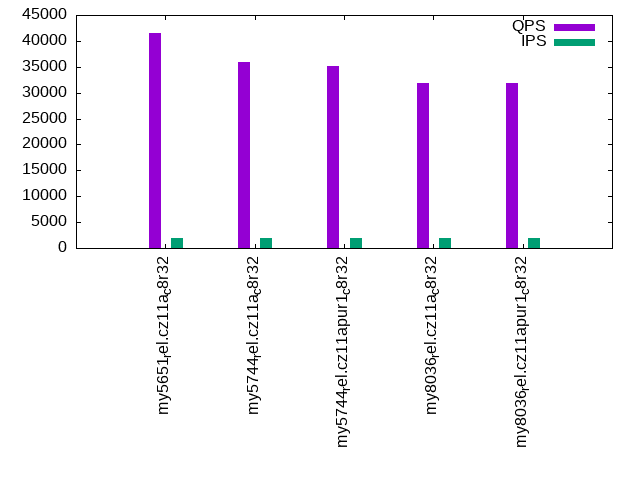
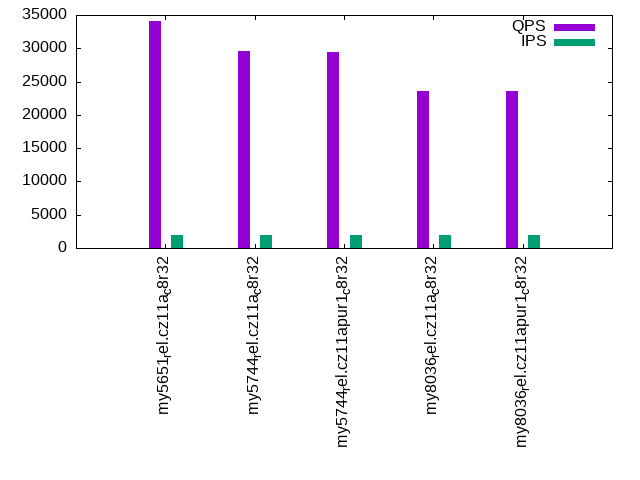
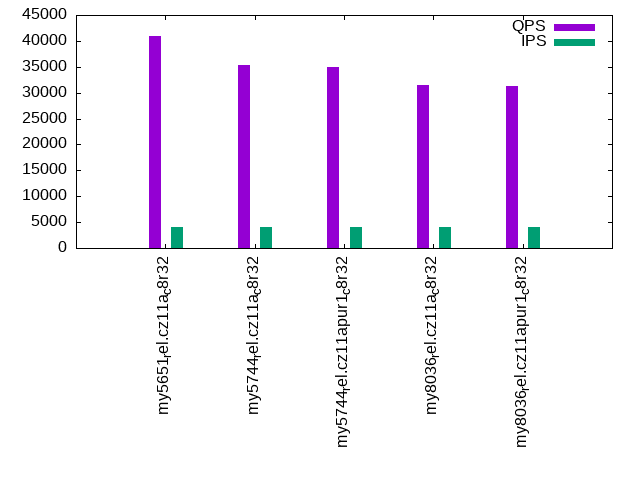
The numbers are inserts/s for l.i0, l.i1 and l.i2, indexed docs (or rows) /s for l.x and queries/s for qr100, qp100 thru qr1000, qp1000" The values are the average rate over the entire test for inserts (IPS) and queries (QPS). The range of values for IPS and QPS is split into 3 parts: bottom 25%, middle 50%, top 25%. Values in the bottom 25% have a red background, values in the top 25% have a green background and values in the middle have no color. A gray background is used for values that can be ignored because the DBMS did not sustain the target insert rate. Red backgrounds are not used when the minimum value is within 80% of the max value.
| dbms | l.i0 | l.x | l.i1 | l.i2 | qr100 | qp100 | qr500 | qp500 | qr1000 | qp1000 |
|---|---|---|---|---|---|---|---|---|---|---|
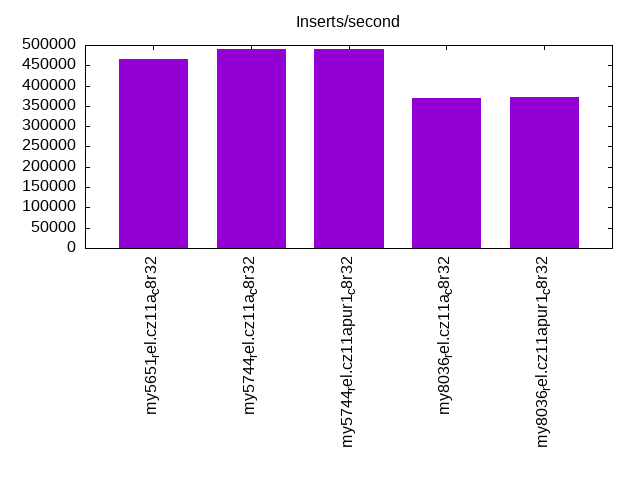
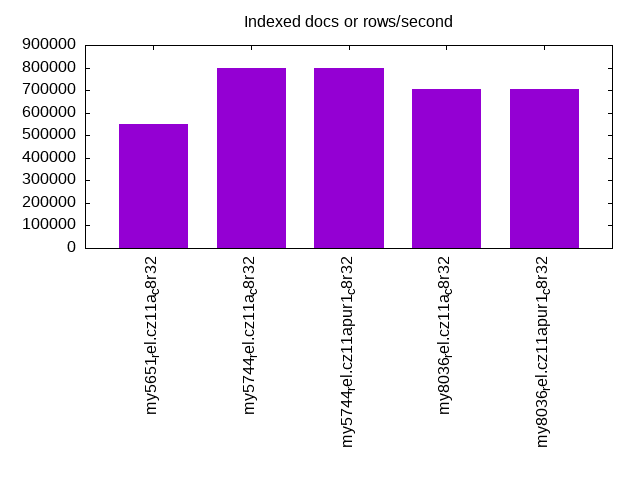
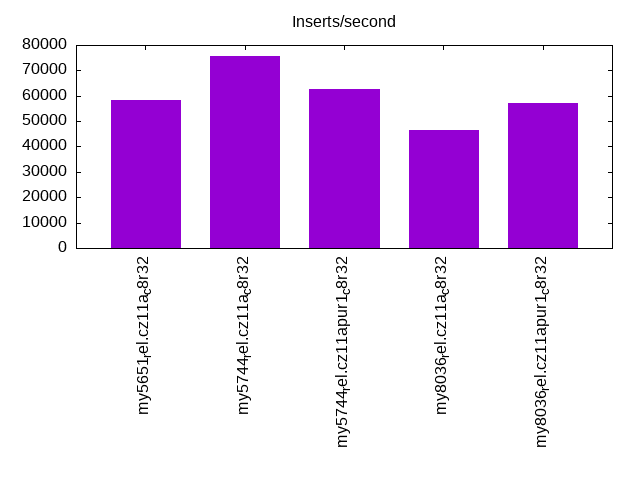
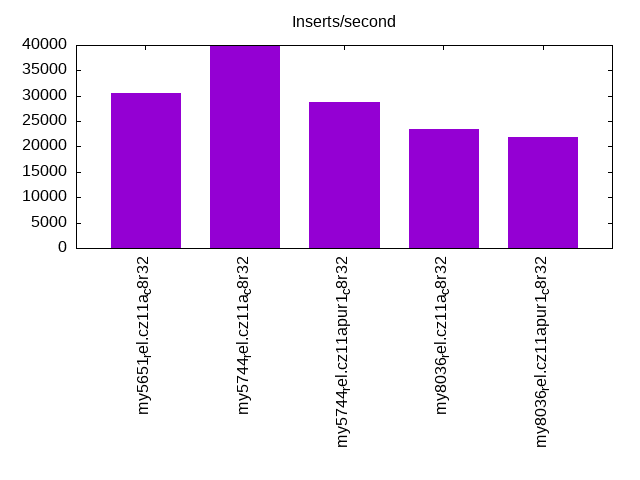
| my5651_rel.cz11a_c8r32 | 466019 | 551725 | 58129 | 30476 | 42430 | 34548 | 41547 | 34026 | 40904 | 33386 |
| my5744_rel.cz11a_c8r32 | 489796 | 800002 | 75740 | 39950 | 36122 | 29933 | 35848 | 29545 | 35272 | 29187 |
| my5744_rel.cz11apur1_c8r32 | 489796 | 800002 | 62807 | 28725 | 35454 | 29786 | 35200 | 29479 | 34911 | 29085 |
| my8036_rel.cz11a_c8r32 | 369231 | 705884 | 46394 | 23375 | 32064 | 23808 | 31779 | 23541 | 31420 | 23295 |
| my8036_rel.cz11apur1_c8r32 | 372093 | 705884 | 57296 | 21813 | 31955 | 23736 | 31840 | 23571 | 31321 | 23278 |
This table has relative throughput, throughput for the DBMS relative to the DBMS in the first line, using the absolute throughput from the previous table. Values less than 0.95 have a yellow background. Values greater than 1.05 have a blue background.
| dbms | l.i0 | l.x | l.i1 | l.i2 | qr100 | qp100 | qr500 | qp500 | qr1000 | qp1000 |
|---|---|---|---|---|---|---|---|---|---|---|
| my5651_rel.cz11a_c8r32 | 1.00 | 1.00 | 1.00 | 1.00 | 1.00 | 1.00 | 1.00 | 1.00 | 1.00 | 1.00 |
| my5744_rel.cz11a_c8r32 | 1.05 | 1.45 | 1.30 | 1.31 | 0.85 | 0.87 | 0.86 | 0.87 | 0.86 | 0.87 |
| my5744_rel.cz11apur1_c8r32 | 1.05 | 1.45 | 1.08 | 0.94 | 0.84 | 0.86 | 0.85 | 0.87 | 0.85 | 0.87 |
| my8036_rel.cz11a_c8r32 | 0.79 | 1.28 | 0.80 | 0.77 | 0.76 | 0.69 | 0.76 | 0.69 | 0.77 | 0.70 |
| my8036_rel.cz11apur1_c8r32 | 0.80 | 1.28 | 0.99 | 0.72 | 0.75 | 0.69 | 0.77 | 0.69 | 0.77 | 0.70 |
This lists the average rate of inserts/s for the tests that do inserts concurrent with queries. For such tests the query rate is listed in the table above. The read+write tests are setup so that the insert rate should match the target rate every second. Cells that are not at least 95% of the target have a red background to indicate a failure to satisfy the target.
| dbms | qr100.L1 | qp100.L2 | qr500.L3 | qp500.L4 | qr1000.L5 | qp1000.L6 |
|---|---|---|---|---|---|---|
| my5651_rel.cz11a_c8r32 | 399 | 399 | 1994 | 1994 | 3989 | 3989 |
| my5744_rel.cz11a_c8r32 | 399 | 399 | 1994 | 1994 | 3989 | 3989 |
| my5744_rel.cz11apur1_c8r32 | 399 | 399 | 1994 | 1994 | 3987 | 3989 |
| my8036_rel.cz11a_c8r32 | 399 | 399 | 1994 | 1994 | 3989 | 3989 |
| my8036_rel.cz11apur1_c8r32 | 399 | 399 | 1993 | 1994 | 3989 | 3989 |
| target | 400 | 400 | 2000 | 2000 | 4000 | 4000 |
l.i0
l.i0: load without secondary indexes. Graphs for performance per 1-second interval are here.
Average throughput:
Insert response time histogram: each cell has the percentage of responses that take <= the time in the header and max is the max response time in seconds. For the max column values in the top 25% of the range have a red background and in the bottom 25% of the range have a green background. The red background is not used when the min value is within 80% of the max value.
| dbms | 256us | 1ms | 4ms | 16ms | 64ms | 256ms | 1s | 4s | 16s | gt | max |
|---|---|---|---|---|---|---|---|---|---|---|---|
| my5651_rel.cz11a_c8r32 | 96.565 | 3.342 | 0.021 | 0.066 | 0.006 | 0.162 | |||||
| my5744_rel.cz11a_c8r32 | 97.747 | 1.918 | 0.279 | 0.050 | 0.006 | 0.159 | |||||
| my5744_rel.cz11apur1_c8r32 | 97.703 | 1.965 | 0.273 | 0.053 | 0.006 | 0.167 | |||||
| my8036_rel.cz11a_c8r32 | 97.057 | 2.472 | 0.372 | 0.091 | 0.007 | 0.146 | |||||
| my8036_rel.cz11apur1_c8r32 | 97.095 | 2.449 | 0.361 | 0.086 | 0.010 | 0.144 |
Performance metrics for the DBMS listed above. Some are normalized by throughput, others are not. Legend for results is here.
ips	qps	rps	rmbps	wps	wmbps	rpq	rkbpq	wpi	wkbpi	csps	cpups	cspq	cpupq	dbgb1	dbgb2	rss	maxop	p50	p99	tag
466019	0	3805	14.9	1425.2	121.6	0.008	0.033	0.003	0.267	55973	67.7	0.120	12	3.2	33.7	4.3	0.162	130361	109682	my5651_rel.cz11a_c8r32
489796	0	0	0.0	1537.7	128.7	0.000	0.000	0.003	0.269	46624	71.0	0.095	12	3.2	33.7	4.9	0.159	141284	116876	my5744_rel.cz11a_c8r32
489796	0	0	0.0	1531.9	128.3	0.000	0.000	0.003	0.268	46410	70.8	0.095	12	3.2	33.7	4.8	0.167	140458	118371	my5744_rel.cz11apur1_c8r32
369231	0	0	0.0	1497.7	109.3	0.000	0.000	0.004	0.303	39456	64.2	0.107	14	3.2	33.8	5.1	0.146	102691	87330	my8036_rel.cz11a_c8r32
372093	0	0	0.0	1495.7	109.1	0.000	0.000	0.004	0.300	39412	64.1	0.106	14	3.2	33.8	5.1	0.144	103990	75168	my8036_rel.cz11apur1_c8r32
l.x
l.x: create secondary indexes.
Average throughput:
Performance metrics for the DBMS listed above. Some are normalized by throughput, others are not. Legend for results is here.
ips	qps	rps	rmbps	wps	wmbps	rpq	rkbpq	wpi	wkbpi	csps	cpups	cspq	cpupq	dbgb1	dbgb2	rss	maxop	p50	p99	tag
551725	0	55	0.2	8061.6	548.5	0.000	0.000	0.015	1.018	13919	40.5	0.025	6	6.7	37.2	6.8	0.001	NA	NA	my5651_rel.cz11a_c8r32
800002	0	0	0.0	14094.1	731.7	0.000	0.000	0.018	0.937	51669	44.0	0.065	4	7.3	37.8	8.8	0.002	NA	NA	my5744_rel.cz11a_c8r32
800002	0	0	0.0	14165.1	733.1	0.000	0.000	0.018	0.938	51596	43.3	0.064	4	7.3	37.8	8.8	0.002	NA	NA	my5744_rel.cz11apur1_c8r32
705884	0	3782	236.6	11907.1	730.1	0.005	0.343	0.017	1.059	34102	89.8	0.048	10	7.3	37.9	7.6	0.004	NA	NA	my8036_rel.cz11a_c8r32
705884	0	3774	236.1	12784.3	744.9	0.005	0.342	0.018	1.081	35942	89.6	0.051	10	7.3	37.9	7.7	0.004	NA	NA	my8036_rel.cz11apur1_c8r32
l.i1
l.i1: continue load after secondary indexes created with 50 inserts per transaction. Graphs for performance per 1-second interval are here.
Average throughput:
Insert response time histogram: each cell has the percentage of responses that take <= the time in the header and max is the max response time in seconds. For the max column values in the top 25% of the range have a red background and in the bottom 25% of the range have a green background. The red background is not used when the min value is within 80% of the max value.
| dbms | 256us | 1ms | 4ms | 16ms | 64ms | 256ms | 1s | 4s | 16s | gt | max |
|---|---|---|---|---|---|---|---|---|---|---|---|
| my5651_rel.cz11a_c8r32 | 0.029 | 81.084 | 18.177 | 0.699 | 0.010 | 0.099 | |||||
| my5744_rel.cz11a_c8r32 | 0.002 | 87.751 | 12.122 | 0.120 | 0.006 | 0.169 | |||||
| my5744_rel.cz11apur1_c8r32 | 0.009 | 96.160 | 3.287 | 0.048 | 0.139 | 0.358 | 0.276 | ||||
| my8036_rel.cz11a_c8r32 | 90.062 | 7.846 | 0.200 | 1.891 | 0.217 | ||||||
| my8036_rel.cz11apur1_c8r32 | 95.412 | 2.933 | 0.134 | 1.520 | 0.141 |
Delete response time histogram: each cell has the percentage of responses that take <= the time in the header and max is the max response time in seconds. For the max column values in the top 25% of the range have a red background and in the bottom 25% of the range have a green background. The red background is not used when the min value is within 80% of the max value.
| dbms | 256us | 1ms | 4ms | 16ms | 64ms | 256ms | 1s | 4s | 16s | gt | max |
|---|---|---|---|---|---|---|---|---|---|---|---|
| my5651_rel.cz11a_c8r32 | 2.143 | 84.284 | 13.006 | 0.559 | 0.008 | 0.103 | |||||
| my5744_rel.cz11a_c8r32 | 3.227 | 84.999 | 11.676 | 0.092 | 0.005 | 0.168 | |||||
| my5744_rel.cz11apur1_c8r32 | 4.975 | 91.111 | 3.376 | 0.041 | 0.233 | 0.264 | 0.275 | ||||
| my8036_rel.cz11a_c8r32 | 8.039 | 82.425 | 7.593 | 0.149 | 1.794 | 0.217 | |||||
| my8036_rel.cz11apur1_c8r32 | 14.134 | 81.348 | 2.928 | 0.108 | 1.483 | 0.140 |
Performance metrics for the DBMS listed above. Some are normalized by throughput, others are not. Legend for results is here.
ips	qps	rps	rmbps	wps	wmbps	rpq	rkbpq	wpi	wkbpi	csps	cpups	cspq	cpupq	dbgb1	dbgb2	rss	maxop	p50	p99	tag
58129	0	1645	6.4	4451.0	182.4	0.028	0.113	0.077	3.214	51487	70.6	0.886	97	10.7	41.2	12.3	0.099	14884	9440	my5651_rel.cz11a_c8r32
75740	0	0	0.0	5643.9	231.9	0.000	0.000	0.075	3.135	35992	84.7	0.475	89	10.9	41.4	13.0	0.169	19229	14141	my5744_rel.cz11a_c8r32
62807	0	0	0.0	4239.4	154.2	0.000	0.000	0.067	2.515	29704	57.5	0.473	73	14.4	46.4	17.7	0.276	22575	150	my5744_rel.cz11apur1_c8r32
46394	0	84	1.3	5139.4	193.7	0.002	0.029	0.111	4.276	30534	50.3	0.658	87	9.8	40.4	12.0	0.217	11537	6443	my8036_rel.cz11a_c8r32
57296	0	104	1.6	4548.7	154.1	0.002	0.029	0.079	2.754	29265	52.8	0.511	74	13.0	44.9	15.9	0.141	14284	7492	my8036_rel.cz11apur1_c8r32
l.i2
l.i2: continue load after secondary indexes created with 5 inserts per transaction. Graphs for performance per 1-second interval are here.
Average throughput:
Insert response time histogram: each cell has the percentage of responses that take <= the time in the header and max is the max response time in seconds. For the max column values in the top 25% of the range have a red background and in the bottom 25% of the range have a green background. The red background is not used when the min value is within 80% of the max value.
| dbms | 256us | 1ms | 4ms | 16ms | 64ms | 256ms | 1s | 4s | 16s | gt | max |
|---|---|---|---|---|---|---|---|---|---|---|---|
| my5651_rel.cz11a_c8r32 | 8.936 | 79.310 | 11.044 | 0.662 | 0.046 | 0.001 | 0.095 | ||||
| my5744_rel.cz11a_c8r32 | 20.541 | 75.139 | 3.514 | 0.804 | 0.003 | nonzero | 0.068 | ||||
| my5744_rel.cz11apur1_c8r32 | 20.334 | 77.406 | 0.748 | 0.683 | 0.828 | 0.001 | 0.163 | ||||
| my8036_rel.cz11a_c8r32 | 0.611 | 96.080 | 2.476 | 0.487 | 0.003 | 0.344 | 0.127 | ||||
| my8036_rel.cz11apur1_c8r32 | 0.692 | 93.547 | 3.684 | 1.784 | 0.007 | 0.286 | 0.130 |
Delete response time histogram: each cell has the percentage of responses that take <= the time in the header and max is the max response time in seconds. For the max column values in the top 25% of the range have a red background and in the bottom 25% of the range have a green background. The red background is not used when the min value is within 80% of the max value.
| dbms | 256us | 1ms | 4ms | 16ms | 64ms | 256ms | 1s | 4s | 16s | gt | max |
|---|---|---|---|---|---|---|---|---|---|---|---|
| my5651_rel.cz11a_c8r32 | 11.800 | 75.971 | 11.524 | 0.658 | 0.045 | 0.001 | 0.094 | ||||
| my5744_rel.cz11a_c8r32 | 21.990 | 73.798 | 3.407 | 0.803 | 0.002 | nonzero | 0.068 | ||||
| my5744_rel.cz11apur1_c8r32 | 21.445 | 76.315 | 0.731 | 0.681 | 0.828 | 0.001 | 0.163 | ||||
| my8036_rel.cz11a_c8r32 | 3.392 | 93.422 | 2.354 | 0.488 | 0.003 | 0.341 | 0.127 | ||||
| my8036_rel.cz11apur1_c8r32 | 1.876 | 92.393 | 3.657 | 1.781 | 0.007 | 0.285 | 0.130 |
Performance metrics for the DBMS listed above. Some are normalized by throughput, others are not. Legend for results is here.
ips	qps	rps	rmbps	wps	wmbps	rpq	rkbpq	wpi	wkbpi	csps	cpups	cspq	cpupq	dbgb1	dbgb2	rss	maxop	p50	p99	tag
30476	0	4984	19.5	2705.1	104.3	0.164	0.654	0.089	3.505	116735	80.0	3.830	210	10.7	41.2	12.3	0.095	7559	6853	my5651_rel.cz11a_c8r32
39950	0	0	0.0	3408.6	134.2	0.000	0.000	0.085	3.441	122348	82.8	3.063	166	10.9	41.4	13.0	0.068	10052	9440	my5744_rel.cz11a_c8r32
28725	0	0	0.0	3475.8	126.3	0.000	0.000	0.121	4.504	87943	61.6	3.062	172	14.4	46.4	17.9	0.163	10149	185	my5744_rel.cz11apur1_c8r32
23375	0	0	0.0	2846.3	101.4	0.000	0.000	0.122	4.443	79709	50.9	3.410	174	9.8	40.4	12.0	0.127	5806	3536	my8036_rel.cz11a_c8r32
21813	0	0	0.0	3167.2	108.3	0.000	0.000	0.145	5.086	76001	50.6	3.484	186	13.0	44.9	16.1	0.130	5932	909	my8036_rel.cz11apur1_c8r32
qr100.L1
qr100.L1: range queries with 100 insert/s per client. Graphs for performance per 1-second interval are here.
Average throughput:

Query response time histogram: each cell has the percentage of responses that take <= the time in the header and max is the max response time in seconds. For max values in the top 25% of the range have a red background and in the bottom 25% of the range have a green background. The red background is not used when the min value is within 80% of the max value.
| dbms | 256us | 1ms | 4ms | 16ms | 64ms | 256ms | 1s | 4s | 16s | gt | max |
|---|---|---|---|---|---|---|---|---|---|---|---|
| my5651_rel.cz11a_c8r32 | 99.964 | 0.025 | 0.004 | 0.008 | nonzero | 0.019 | |||||
| my5744_rel.cz11a_c8r32 | 99.996 | 0.004 | nonzero | nonzero | 0.010 | ||||||
| my5744_rel.cz11apur1_c8r32 | 99.997 | 0.003 | nonzero | nonzero | 0.010 | ||||||
| my8036_rel.cz11a_c8r32 | 99.973 | 0.027 | nonzero | 0.004 | |||||||
| my8036_rel.cz11apur1_c8r32 | 99.970 | 0.030 | nonzero | 0.002 |
Insert response time histogram: each cell has the percentage of responses that take <= the time in the header and max is the max response time in seconds. For max values in the top 25% of the range have a red background and in the bottom 25% of the range have a green background. The red background is not used when the min value is within 80% of the max value.
| dbms | 256us | 1ms | 4ms | 16ms | 64ms | 256ms | 1s | 4s | 16s | gt | max |
|---|---|---|---|---|---|---|---|---|---|---|---|
| my5651_rel.cz11a_c8r32 | 0.069 | 66.750 | 32.743 | 0.438 | 0.028 | ||||||
| my5744_rel.cz11a_c8r32 | 0.125 | 98.104 | 1.757 | 0.014 | 0.019 | ||||||
| my5744_rel.cz11apur1_c8r32 | 0.160 | 99.500 | 0.340 | 0.011 | |||||||
| my8036_rel.cz11a_c8r32 | 99.514 | 0.479 | 0.007 | 0.023 | |||||||
| my8036_rel.cz11apur1_c8r32 | 99.542 | 0.451 | 0.007 | 0.102 |
Delete response time histogram: each cell has the percentage of responses that take <= the time in the header and max is the max response time in seconds. For max values in the top 25% of the range have a red background and in the bottom 25% of the range have a green background. The red background is not used when the min value is within 80% of the max value.
| dbms | 256us | 1ms | 4ms | 16ms | 64ms | 256ms | 1s | 4s | 16s | gt | max |
|---|---|---|---|---|---|---|---|---|---|---|---|
| my5651_rel.cz11a_c8r32 | 15.604 | 54.104 | 30.056 | 0.236 | 0.023 | ||||||
| my5744_rel.cz11a_c8r32 | 67.812 | 30.764 | 1.389 | 0.035 | 0.021 | ||||||
| my5744_rel.cz11apur1_c8r32 | 66.132 | 33.576 | 0.292 | 0.011 | |||||||
| my8036_rel.cz11a_c8r32 | 41.924 | 57.667 | 0.403 | 0.007 | 0.022 | ||||||
| my8036_rel.cz11apur1_c8r32 | 48.785 | 50.847 | 0.354 | 0.007 | 0.007 | 0.101 |
Performance metrics for the DBMS listed above. Some are normalized by throughput, others are not. Legend for results is here.
ips	qps	rps	rmbps	wps	wmbps	rpq	rkbpq	wpi	wkbpi	csps	cpups	cspq	cpupq	dbgb1	dbgb2	rss	maxop	p50	p99	tag
399	42430	13	0.1	547.8	15.5	0.000	0.001	1.374	39.716	163303	51.3	3.849	97	10.7	41.2	12.3	0.019	10600	10069	my5651_rel.cz11a_c8r32
399	36122	0	0.0	567.2	16.0	0.000	0.000	1.422	40.958	139349	52.3	3.858	116	10.9	41.4	13.0	0.010	9030	8918	my5744_rel.cz11a_c8r32
399	35454	0	0.0	516.6	14.7	0.000	0.000	1.295	37.678	136750	52.2	3.857	118	14.4	46.4	17.9	0.010	8838	8711	my5744_rel.cz11apur1_c8r32
399	32064	0	0.0	532.2	13.7	0.000	0.000	1.335	35.064	123880	52.0	3.863	130	9.8	40.4	12.0	0.004	8007	7911	my8036_rel.cz11a_c8r32
399	31955	0	0.0	593.3	15.2	0.000	0.000	1.488	39.012	123691	51.9	3.871	130	13.0	44.9	16.2	0.002	7991	7902	my8036_rel.cz11apur1_c8r32
qp100.L2
qp100.L2: point queries with 100 insert/s per client. Graphs for performance per 1-second interval are here.
Average throughput:
Query response time histogram: each cell has the percentage of responses that take <= the time in the header and max is the max response time in seconds. For max values in the top 25% of the range have a red background and in the bottom 25% of the range have a green background. The red background is not used when the min value is within 80% of the max value.
| dbms | 256us | 1ms | 4ms | 16ms | 64ms | 256ms | 1s | 4s | 16s | gt | max |
|---|---|---|---|---|---|---|---|---|---|---|---|
| my5651_rel.cz11a_c8r32 | 99.917 | 0.060 | 0.010 | 0.012 | 0.012 | ||||||
| my5744_rel.cz11a_c8r32 | 99.939 | 0.059 | 0.002 | 0.004 | |||||||
| my5744_rel.cz11apur1_c8r32 | 99.964 | 0.035 | 0.001 | 0.004 | |||||||
| my8036_rel.cz11a_c8r32 | 99.674 | 0.326 | nonzero | 0.003 | |||||||
| my8036_rel.cz11apur1_c8r32 | 99.606 | 0.394 | nonzero | 0.002 |
Insert response time histogram: each cell has the percentage of responses that take <= the time in the header and max is the max response time in seconds. For max values in the top 25% of the range have a red background and in the bottom 25% of the range have a green background. The red background is not used when the min value is within 80% of the max value.
| dbms | 256us | 1ms | 4ms | 16ms | 64ms | 256ms | 1s | 4s | 16s | gt | max |
|---|---|---|---|---|---|---|---|---|---|---|---|
| my5651_rel.cz11a_c8r32 | 52.764 | 47.021 | 0.215 | 0.021 | |||||||
| my5744_rel.cz11a_c8r32 | 99.764 | 0.236 | 0.010 | ||||||||
| my5744_rel.cz11apur1_c8r32 | 0.049 | 99.590 | 0.361 | 0.012 | |||||||
| my8036_rel.cz11a_c8r32 | 99.833 | 0.139 | 0.028 | 0.102 | |||||||
| my8036_rel.cz11apur1_c8r32 | 99.882 | 0.097 | 0.021 | 0.023 |
Delete response time histogram: each cell has the percentage of responses that take <= the time in the header and max is the max response time in seconds. For max values in the top 25% of the range have a red background and in the bottom 25% of the range have a green background. The red background is not used when the min value is within 80% of the max value.
| dbms | 256us | 1ms | 4ms | 16ms | 64ms | 256ms | 1s | 4s | 16s | gt | max |
|---|---|---|---|---|---|---|---|---|---|---|---|
| my5651_rel.cz11a_c8r32 | 3.472 | 49.604 | 46.771 | 0.153 | 0.020 | ||||||
| my5744_rel.cz11a_c8r32 | 47.944 | 51.840 | 0.215 | 0.010 | |||||||
| my5744_rel.cz11apur1_c8r32 | 58.062 | 41.632 | 0.306 | 0.012 | |||||||
| my8036_rel.cz11a_c8r32 | 29.174 | 70.694 | 0.118 | 0.014 | 0.100 | ||||||
| my8036_rel.cz11apur1_c8r32 | 36.618 | 63.264 | 0.097 | 0.021 | 0.023 |
Performance metrics for the DBMS listed above. Some are normalized by throughput, others are not. Legend for results is here.
ips	qps	rps	rmbps	wps	wmbps	rpq	rkbpq	wpi	wkbpi	csps	cpups	cspq	cpupq	dbgb1	dbgb2	rss	maxop	p50	p99	tag
399	34548	13	0.1	5.1	0.4	0.000	0.002	0.013	1.127	137610	50.5	3.983	117	10.7	41.2	12.4	0.012	8649	8551	my5651_rel.cz11a_c8r32
399	29933	0	0.0	78.0	2.4	0.000	0.000	0.196	6.092	119292	51.8	3.985	138	10.9	41.4	13.1	0.004	7496	7432	my5744_rel.cz11a_c8r32
399	29786	0	0.0	56.8	1.8	0.000	0.000	0.142	4.592	118727	51.7	3.986	139	14.4	46.4	17.9	0.004	7466	7400	my5744_rel.cz11apur1_c8r32
399	23808	0	0.0	72.0	2.2	0.000	0.000	0.181	5.654	95195	51.3	3.999	172	9.8	40.5	12.0	0.003	5962	5898	my8036_rel.cz11a_c8r32
399	23736	0	0.0	66.6	2.1	0.000	0.000	0.167	5.295	94969	51.2	4.001	173	13.0	44.9	16.2	0.002	5930	5866	my8036_rel.cz11apur1_c8r32
qr500.L3
qr500.L3: range queries with 500 insert/s per client. Graphs for performance per 1-second interval are here.
Average throughput:
Query response time histogram: each cell has the percentage of responses that take <= the time in the header and max is the max response time in seconds. For max values in the top 25% of the range have a red background and in the bottom 25% of the range have a green background. The red background is not used when the min value is within 80% of the max value.
| dbms | 256us | 1ms | 4ms | 16ms | 64ms | 256ms | 1s | 4s | 16s | gt | max |
|---|---|---|---|---|---|---|---|---|---|---|---|
| my5651_rel.cz11a_c8r32 | 99.874 | 0.090 | 0.026 | 0.010 | nonzero | 0.029 | |||||
| my5744_rel.cz11a_c8r32 | 99.991 | 0.007 | 0.002 | nonzero | nonzero | 0.018 | |||||
| my5744_rel.cz11apur1_c8r32 | 99.992 | 0.006 | 0.002 | nonzero | 0.014 | ||||||
| my8036_rel.cz11a_c8r32 | 99.973 | 0.022 | 0.004 | 0.001 | 0.016 | ||||||
| my8036_rel.cz11apur1_c8r32 | 99.976 | 0.022 | 0.002 | nonzero | 0.010 |
Insert response time histogram: each cell has the percentage of responses that take <= the time in the header and max is the max response time in seconds. For max values in the top 25% of the range have a red background and in the bottom 25% of the range have a green background. The red background is not used when the min value is within 80% of the max value.
| dbms | 256us | 1ms | 4ms | 16ms | 64ms | 256ms | 1s | 4s | 16s | gt | max |
|---|---|---|---|---|---|---|---|---|---|---|---|
| my5651_rel.cz11a_c8r32 | 0.235 | 68.112 | 31.454 | 0.199 | 0.044 | ||||||
| my5744_rel.cz11a_c8r32 | 4.428 | 93.781 | 1.774 | 0.018 | 0.038 | ||||||
| my5744_rel.cz11apur1_c8r32 | 1.339 | 97.365 | 1.283 | 0.013 | 0.046 | ||||||
| my8036_rel.cz11a_c8r32 | 95.112 | 4.444 | 0.089 | 0.354 | 0.117 | ||||||
| my8036_rel.cz11apur1_c8r32 | 97.496 | 2.297 | 0.043 | 0.164 | 0.107 |
Delete response time histogram: each cell has the percentage of responses that take <= the time in the header and max is the max response time in seconds. For max values in the top 25% of the range have a red background and in the bottom 25% of the range have a green background. The red background is not used when the min value is within 80% of the max value.
| dbms | 256us | 1ms | 4ms | 16ms | 64ms | 256ms | 1s | 4s | 16s | gt | max |
|---|---|---|---|---|---|---|---|---|---|---|---|
| my5651_rel.cz11a_c8r32 | 5.588 | 69.435 | 24.864 | 0.114 | 0.042 | ||||||
| my5744_rel.cz11a_c8r32 | 77.579 | 20.879 | 1.536 | 0.006 | 0.038 | ||||||
| my5744_rel.cz11apur1_c8r32 | 71.565 | 27.158 | 1.274 | 0.003 | 0.022 | ||||||
| my8036_rel.cz11a_c8r32 | 53.146 | 43.228 | 3.263 | 0.058 | 0.306 | 0.110 | |||||
| my8036_rel.cz11apur1_c8r32 | 53.478 | 44.490 | 1.864 | 0.024 | 0.144 | 0.107 |
Performance metrics for the DBMS listed above. Some are normalized by throughput, others are not. Legend for results is here.
ips	qps	rps	rmbps	wps	wmbps	rpq	rkbpq	wpi	wkbpi	csps	cpups	cspq	cpupq	dbgb1	dbgb2	rss	maxop	p50	p99	tag
1994	41547	59	0.2	578.6	17.7	0.001	0.006	0.290	9.074	159683	52.5	3.843	101	10.7	41.2	12.4	0.029	10360	9861	my5651_rel.cz11a_c8r32
1994	35848	0	0.0	231.0	8.0	0.000	0.000	0.116	4.103	136333	53.6	3.803	120	10.9	41.4	13.1	0.018	9062	8998	my5744_rel.cz11a_c8r32
1994	35200	0	0.0	241.5	8.3	0.000	0.000	0.121	4.249	134251	53.3	3.814	121	14.4	46.4	17.9	0.014	8775	8695	my5744_rel.cz11apur1_c8r32
1994	31779	0	0.0	341.2	10.7	0.000	0.000	0.171	5.471	121670	53.3	3.829	134	9.8	40.5	12.0	0.016	7960	7896	my8036_rel.cz11a_c8r32
1993	31840	0	0.0	363.8	11.2	0.000	0.000	0.183	5.768	121963	53.1	3.831	133	13.0	44.9	16.2	0.010	7928	7866	my8036_rel.cz11apur1_c8r32
qp500.L4
qp500.L4: point queries with 500 insert/s per client. Graphs for performance per 1-second interval are here.
Average throughput:
Query response time histogram: each cell has the percentage of responses that take <= the time in the header and max is the max response time in seconds. For max values in the top 25% of the range have a red background and in the bottom 25% of the range have a green background. The red background is not used when the min value is within 80% of the max value.
| dbms | 256us | 1ms | 4ms | 16ms | 64ms | 256ms | 1s | 4s | 16s | gt | max |
|---|---|---|---|---|---|---|---|---|---|---|---|
| my5651_rel.cz11a_c8r32 | 99.756 | 0.185 | 0.050 | 0.009 | 0.012 | ||||||
| my5744_rel.cz11a_c8r32 | 99.842 | 0.145 | 0.011 | 0.001 | 0.014 | ||||||
| my5744_rel.cz11apur1_c8r32 | 99.878 | 0.107 | 0.013 | 0.001 | nonzero | 0.018 | |||||
| my8036_rel.cz11a_c8r32 | 99.570 | 0.424 | 0.005 | 0.001 | nonzero | 0.017 | |||||
| my8036_rel.cz11apur1_c8r32 | 99.604 | 0.391 | 0.005 | 0.001 | 0.013 |
Insert response time histogram: each cell has the percentage of responses that take <= the time in the header and max is the max response time in seconds. For max values in the top 25% of the range have a red background and in the bottom 25% of the range have a green background. The red background is not used when the min value is within 80% of the max value.
| dbms | 256us | 1ms | 4ms | 16ms | 64ms | 256ms | 1s | 4s | 16s | gt | max |
|---|---|---|---|---|---|---|---|---|---|---|---|
| my5651_rel.cz11a_c8r32 | 0.417 | 72.204 | 27.203 | 0.176 | 0.044 | ||||||
| my5744_rel.cz11a_c8r32 | 2.585 | 96.040 | 1.365 | 0.010 | 0.048 | ||||||
| my5744_rel.cz11apur1_c8r32 | 1.439 | 97.279 | 1.279 | 0.003 | 0.039 | ||||||
| my8036_rel.cz11a_c8r32 | 96.668 | 3.011 | 0.054 | 0.267 | 0.109 | ||||||
| my8036_rel.cz11apur1_c8r32 | 96.722 | 2.944 | 0.033 | 0.300 | 0.108 |
Delete response time histogram: each cell has the percentage of responses that take <= the time in the header and max is the max response time in seconds. For max values in the top 25% of the range have a red background and in the bottom 25% of the range have a green background. The red background is not used when the min value is within 80% of the max value.
| dbms | 256us | 1ms | 4ms | 16ms | 64ms | 256ms | 1s | 4s | 16s | gt | max |
|---|---|---|---|---|---|---|---|---|---|---|---|
| my5651_rel.cz11a_c8r32 | 6.592 | 71.846 | 21.456 | 0.107 | 0.043 | ||||||
| my5744_rel.cz11a_c8r32 | 72.343 | 26.610 | 1.040 | 0.007 | 0.021 | ||||||
| my5744_rel.cz11apur1_c8r32 | 65.576 | 33.346 | 1.071 | 0.007 | 0.039 | ||||||
| my8036_rel.cz11a_c8r32 | 52.786 | 44.825 | 2.138 | 0.019 | 0.232 | 0.112 | |||||
| my8036_rel.cz11apur1_c8r32 | 39.639 | 57.832 | 2.246 | 0.024 | 0.260 | 0.110 |
Performance metrics for the DBMS listed above. Some are normalized by throughput, others are not. Legend for results is here.
ips	qps	rps	rmbps	wps	wmbps	rpq	rkbpq	wpi	wkbpi	csps	cpups	cspq	cpupq	dbgb1	dbgb2	rss	maxop	p50	p99	tag
1994	34026	55	0.2	463.7	14.5	0.002	0.006	0.232	7.438	136775	52.0	4.020	122	10.7	41.2	12.3	0.012	8569	8282	my5651_rel.cz11a_c8r32
1994	29545	0	0.0	223.5	7.8	0.000	0.000	0.112	3.999	117746	53.2	3.985	144	10.9	41.4	13.1	0.014	7416	7290	my5744_rel.cz11a_c8r32
1994	29479	0	0.0	236.9	8.1	0.000	0.000	0.119	4.177	117703	52.8	3.993	143	14.4	46.4	17.9	0.018	7386	7304	my5744_rel.cz11apur1_c8r32
1994	23541	0	0.0	315.6	10.1	0.000	0.000	0.158	5.166	94463	52.6	4.013	179	9.8	40.6	12.0	0.017	5883	5818	my8036_rel.cz11a_c8r32
1994	23571	0	0.0	351.4	11.0	0.000	0.000	0.176	5.630	94416	52.5	4.006	178	13.0	45.0	16.2	0.013	5914	5834	my8036_rel.cz11apur1_c8r32
qr1000.L5
qr1000.L5: range queries with 1000 insert/s per client. Graphs for performance per 1-second interval are here.
Average throughput:
Query response time histogram: each cell has the percentage of responses that take <= the time in the header and max is the max response time in seconds. For max values in the top 25% of the range have a red background and in the bottom 25% of the range have a green background. The red background is not used when the min value is within 80% of the max value.
| dbms | 256us | 1ms | 4ms | 16ms | 64ms | 256ms | 1s | 4s | 16s | gt | max |
|---|---|---|---|---|---|---|---|---|---|---|---|
| my5651_rel.cz11a_c8r32 | 99.770 | 0.191 | 0.034 | 0.005 | nonzero | 0.026 | |||||
| my5744_rel.cz11a_c8r32 | 99.975 | 0.017 | 0.006 | 0.001 | nonzero | 0.023 | |||||
| my5744_rel.cz11apur1_c8r32 | 99.975 | 0.015 | 0.009 | 0.001 | nonzero | 0.023 | |||||
| my8036_rel.cz11a_c8r32 | 99.933 | 0.052 | 0.012 | 0.003 | nonzero | 0.026 | |||||
| my8036_rel.cz11apur1_c8r32 | 99.940 | 0.050 | 0.009 | 0.001 | nonzero | 0.024 |
Insert response time histogram: each cell has the percentage of responses that take <= the time in the header and max is the max response time in seconds. For max values in the top 25% of the range have a red background and in the bottom 25% of the range have a green background. The red background is not used when the min value is within 80% of the max value.
| dbms | 256us | 1ms | 4ms | 16ms | 64ms | 256ms | 1s | 4s | 16s | gt | max |
|---|---|---|---|---|---|---|---|---|---|---|---|
| my5651_rel.cz11a_c8r32 | 6.053 | 81.241 | 12.579 | 0.127 | 0.043 | ||||||
| my5744_rel.cz11a_c8r32 | 3.653 | 93.866 | 2.380 | 0.101 | 0.049 | ||||||
| my5744_rel.cz11apur1_c8r32 | 0.960 | 95.072 | 3.799 | 0.168 | 0.047 | ||||||
| my8036_rel.cz11a_c8r32 | 92.894 | 6.156 | 0.497 | 0.452 | 0.122 | ||||||
| my8036_rel.cz11apur1_c8r32 | 94.743 | 4.708 | 0.223 | 0.326 | 0.115 |
Delete response time histogram: each cell has the percentage of responses that take <= the time in the header and max is the max response time in seconds. For max values in the top 25% of the range have a red background and in the bottom 25% of the range have a green background. The red background is not used when the min value is within 80% of the max value.
| dbms | 256us | 1ms | 4ms | 16ms | 64ms | 256ms | 1s | 4s | 16s | gt | max |
|---|---|---|---|---|---|---|---|---|---|---|---|
| my5651_rel.cz11a_c8r32 | 22.594 | 67.772 | 9.536 | 0.098 | 0.039 | ||||||
| my5744_rel.cz11a_c8r32 | 78.911 | 19.024 | 1.977 | 0.088 | 0.049 | ||||||
| my5744_rel.cz11apur1_c8r32 | 62.174 | 34.350 | 3.325 | 0.151 | 0.047 | ||||||
| my8036_rel.cz11a_c8r32 | 49.599 | 44.983 | 4.618 | 0.398 | 0.403 | 0.122 | |||||
| my8036_rel.cz11apur1_c8r32 | 43.574 | 52.253 | 3.698 | 0.192 | 0.283 | 0.113 |
Performance metrics for the DBMS listed above. Some are normalized by throughput, others are not. Legend for results is here.
ips	qps	rps	rmbps	wps	wmbps	rpq	rkbpq	wpi	wkbpi	csps	cpups	cspq	cpupq	dbgb1	dbgb2	rss	maxop	p50	p99	tag
3989	40904	110	0.4	728.3	23.5	0.003	0.011	0.183	6.025	157249	54.4	3.844	106	10.7	41.2	12.4	0.026	10181	9574	my5651_rel.cz11a_c8r32
3989	35272	0	0.0	499.1	17.1	0.000	0.000	0.125	4.401	133846	55.4	3.795	126	10.9	41.4	13.1	0.023	8902	8759	my5744_rel.cz11a_c8r32
3987	34911	0	0.0	530.5	18.0	0.000	0.000	0.133	4.621	133043	55.0	3.811	126	14.4	46.4	17.9	0.023	8711	8567	my5744_rel.cz11apur1_c8r32
3989	31420	0	0.0	689.2	21.6	0.000	0.000	0.173	5.538	120566	55.1	3.837	140	9.8	40.6	12.0	0.026	7896	7738	my8036_rel.cz11a_c8r32
3989	31321	0	0.0	753.6	23.2	0.000	0.000	0.189	5.966	119836	55.0	3.826	140	13.0	45.0	16.2	0.024	7832	7736	my8036_rel.cz11apur1_c8r32
qp1000.L6
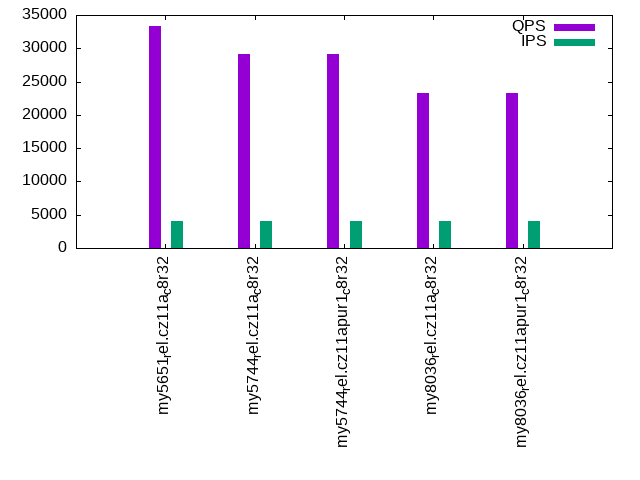
qp1000.L6: point queries with 1000 insert/s per client. Graphs for performance per 1-second interval are here.
Average throughput:
Query response time histogram: each cell has the percentage of responses that take <= the time in the header and max is the max response time in seconds. For max values in the top 25% of the range have a red background and in the bottom 25% of the range have a green background. The red background is not used when the min value is within 80% of the max value.
| dbms | 256us | 1ms | 4ms | 16ms | 64ms | 256ms | 1s | 4s | 16s | gt | max |
|---|---|---|---|---|---|---|---|---|---|---|---|
| my5651_rel.cz11a_c8r32 | 99.601 | 0.329 | 0.064 | 0.007 | nonzero | 0.022 | |||||
| my5744_rel.cz11a_c8r32 | 99.653 | 0.308 | 0.035 | 0.003 | nonzero | 0.022 | |||||
| my5744_rel.cz11apur1_c8r32 | 99.733 | 0.225 | 0.037 | 0.004 | nonzero | 0.021 | |||||
| my8036_rel.cz11a_c8r32 | 99.466 | 0.503 | 0.025 | 0.005 | nonzero | 0.029 | |||||
| my8036_rel.cz11apur1_c8r32 | 99.499 | 0.478 | 0.021 | 0.002 | nonzero | 0.023 |
Insert response time histogram: each cell has the percentage of responses that take <= the time in the header and max is the max response time in seconds. For max values in the top 25% of the range have a red background and in the bottom 25% of the range have a green background. The red background is not used when the min value is within 80% of the max value.
| dbms | 256us | 1ms | 4ms | 16ms | 64ms | 256ms | 1s | 4s | 16s | gt | max |
|---|---|---|---|---|---|---|---|---|---|---|---|
| my5651_rel.cz11a_c8r32 | 5.337 | 74.606 | 19.783 | 0.274 | 0.043 | ||||||
| my5744_rel.cz11a_c8r32 | 2.140 | 95.331 | 2.476 | 0.053 | 0.050 | ||||||
| my5744_rel.cz11apur1_c8r32 | 0.511 | 96.442 | 2.984 | 0.063 | 0.049 | ||||||
| my8036_rel.cz11a_c8r32 | 90.559 | 8.308 | 0.613 | 0.520 | 0.130 | ||||||
| my8036_rel.cz11apur1_c8r32 | 93.152 | 6.215 | 0.201 | 0.432 | 0.115 |
Delete response time histogram: each cell has the percentage of responses that take <= the time in the header and max is the max response time in seconds. For max values in the top 25% of the range have a red background and in the bottom 25% of the range have a green background. The red background is not used when the min value is within 80% of the max value.
| dbms | 256us | 1ms | 4ms | 16ms | 64ms | 256ms | 1s | 4s | 16s | gt | max |
|---|---|---|---|---|---|---|---|---|---|---|---|
| my5651_rel.cz11a_c8r32 | 13.966 | 70.122 | 15.722 | 0.191 | 0.042 | ||||||
| my5744_rel.cz11a_c8r32 | 66.362 | 31.615 | 1.992 | 0.032 | 0.050 | ||||||
| my5744_rel.cz11apur1_c8r32 | 48.847 | 48.506 | 2.577 | 0.070 | 0.048 | ||||||
| my8036_rel.cz11a_c8r32 | 32.828 | 59.790 | 6.435 | 0.483 | 0.465 | 0.124 | |||||
| my8036_rel.cz11apur1_c8r32 | 28.958 | 65.598 | 4.889 | 0.158 | 0.397 | 0.114 |
Performance metrics for the DBMS listed above. Some are normalized by throughput, others are not. Legend for results is here.
ips	qps	rps	rmbps	wps	wmbps	rpq	rkbpq	wpi	wkbpi	csps	cpups	cspq	cpupq	dbgb1	dbgb2	rss	maxop	p50	p99	tag
3989	33386	120	0.5	757.8	24.3	0.004	0.014	0.190	6.229	134785	54.0	4.037	129	10.7	41.2	12.4	0.022	8359	8006	my5651_rel.cz11a_c8r32
3989	29187	0	0.0	458.2	16.0	0.000	0.000	0.115	4.108	116278	54.7	3.984	150	10.9	41.4	13.1	0.022	7304	7098	my5744_rel.cz11a_c8r32
3989	29085	0	0.0	499.9	17.2	0.000	0.000	0.125	4.409	116373	54.3	4.001	149	14.4	46.4	17.9	0.021	7290	7160	my5744_rel.cz11apur1_c8r32
3989	23295	0	0.0	671.3	21.1	0.000	0.000	0.168	5.423	93949	54.4	4.033	187	9.8	40.7	12.0	0.029	5834	5722	my8036_rel.cz11a_c8r32
3989	23278	0	0.0	747.0	23.1	0.000	0.000	0.187	5.933	93567	54.4	4.020	187	13.0	45.1	16.2	0.023	5834	5706	my8036_rel.cz11apur1_c8r32
l.i0
l.i0: load without secondary indexes
Performance metrics for all DBMS, not just the ones listed above. Some are normalized by throughput, others are not. Legend for results is here.
ips	qps	rps	rmbps	wps	wmbps	rpq	rkbpq	wpi	wkbpi	csps	cpups	cspq	cpupq	dbgb1	dbgb2	rss	maxop	p50	p99	tag
466019	0	3805	14.9	1425.2	121.6	0.008	0.033	0.003	0.267	55973	67.7	0.120	12	3.2	33.7	4.3	0.162	130361	109682	my5651_rel.cz11a_c8r32
489796	0	0	0.0	1537.7	128.7	0.000	0.000	0.003	0.269	46624	71.0	0.095	12	3.2	33.7	4.9	0.159	141284	116876	my5744_rel.cz11a_c8r32
489796	0	0	0.0	1531.9	128.3	0.000	0.000	0.003	0.268	46410	70.8	0.095	12	3.2	33.7	4.8	0.167	140458	118371	my5744_rel.cz11apur1_c8r32
369231	0	0	0.0	1497.7	109.3	0.000	0.000	0.004	0.303	39456	64.2	0.107	14	3.2	33.8	5.1	0.146	102691	87330	my8036_rel.cz11a_c8r32
372093	0	0	0.0	1495.7	109.1	0.000	0.000	0.004	0.300	39412	64.1	0.106	14	3.2	33.8	5.1	0.144	103990	75168	my8036_rel.cz11apur1_c8r32
l.x
l.x: create secondary indexes
Performance metrics for all DBMS, not just the ones listed above. Some are normalized by throughput, others are not. Legend for results is here.
ips	qps	rps	rmbps	wps	wmbps	rpq	rkbpq	wpi	wkbpi	csps	cpups	cspq	cpupq	dbgb1	dbgb2	rss	maxop	p50	p99	tag
551725	0	55	0.2	8061.6	548.5	0.000	0.000	0.015	1.018	13919	40.5	0.025	6	6.7	37.2	6.8	0.001	NA	NA	my5651_rel.cz11a_c8r32
800002	0	0	0.0	14094.1	731.7	0.000	0.000	0.018	0.937	51669	44.0	0.065	4	7.3	37.8	8.8	0.002	NA	NA	my5744_rel.cz11a_c8r32
800002	0	0	0.0	14165.1	733.1	0.000	0.000	0.018	0.938	51596	43.3	0.064	4	7.3	37.8	8.8	0.002	NA	NA	my5744_rel.cz11apur1_c8r32
705884	0	3782	236.6	11907.1	730.1	0.005	0.343	0.017	1.059	34102	89.8	0.048	10	7.3	37.9	7.6	0.004	NA	NA	my8036_rel.cz11a_c8r32
705884	0	3774	236.1	12784.3	744.9	0.005	0.342	0.018	1.081	35942	89.6	0.051	10	7.3	37.9	7.7	0.004	NA	NA	my8036_rel.cz11apur1_c8r32
l.i1
l.i1: continue load after secondary indexes created with 50 inserts per transaction
Performance metrics for all DBMS, not just the ones listed above. Some are normalized by throughput, others are not. Legend for results is here.
ips	qps	rps	rmbps	wps	wmbps	rpq	rkbpq	wpi	wkbpi	csps	cpups	cspq	cpupq	dbgb1	dbgb2	rss	maxop	p50	p99	tag
58129	0	1645	6.4	4451.0	182.4	0.028	0.113	0.077	3.214	51487	70.6	0.886	97	10.7	41.2	12.3	0.099	14884	9440	my5651_rel.cz11a_c8r32
75740	0	0	0.0	5643.9	231.9	0.000	0.000	0.075	3.135	35992	84.7	0.475	89	10.9	41.4	13.0	0.169	19229	14141	my5744_rel.cz11a_c8r32
62807	0	0	0.0	4239.4	154.2	0.000	0.000	0.067	2.515	29704	57.5	0.473	73	14.4	46.4	17.7	0.276	22575	150	my5744_rel.cz11apur1_c8r32
46394	0	84	1.3	5139.4	193.7	0.002	0.029	0.111	4.276	30534	50.3	0.658	87	9.8	40.4	12.0	0.217	11537	6443	my8036_rel.cz11a_c8r32
57296	0	104	1.6	4548.7	154.1	0.002	0.029	0.079	2.754	29265	52.8	0.511	74	13.0	44.9	15.9	0.141	14284	7492	my8036_rel.cz11apur1_c8r32
l.i2
l.i2: continue load after secondary indexes created with 5 inserts per transaction
Performance metrics for all DBMS, not just the ones listed above. Some are normalized by throughput, others are not. Legend for results is here.
ips	qps	rps	rmbps	wps	wmbps	rpq	rkbpq	wpi	wkbpi	csps	cpups	cspq	cpupq	dbgb1	dbgb2	rss	maxop	p50	p99	tag
30476	0	4984	19.5	2705.1	104.3	0.164	0.654	0.089	3.505	116735	80.0	3.830	210	10.7	41.2	12.3	0.095	7559	6853	my5651_rel.cz11a_c8r32
39950	0	0	0.0	3408.6	134.2	0.000	0.000	0.085	3.441	122348	82.8	3.063	166	10.9	41.4	13.0	0.068	10052	9440	my5744_rel.cz11a_c8r32
28725	0	0	0.0	3475.8	126.3	0.000	0.000	0.121	4.504	87943	61.6	3.062	172	14.4	46.4	17.9	0.163	10149	185	my5744_rel.cz11apur1_c8r32
23375	0	0	0.0	2846.3	101.4	0.000	0.000	0.122	4.443	79709	50.9	3.410	174	9.8	40.4	12.0	0.127	5806	3536	my8036_rel.cz11a_c8r32
21813	0	0	0.0	3167.2	108.3	0.000	0.000	0.145	5.086	76001	50.6	3.484	186	13.0	44.9	16.1	0.130	5932	909	my8036_rel.cz11apur1_c8r32
qr100.L1
qr100.L1: range queries with 100 insert/s per client
Performance metrics for all DBMS, not just the ones listed above. Some are normalized by throughput, others are not. Legend for results is here.
ips	qps	rps	rmbps	wps	wmbps	rpq	rkbpq	wpi	wkbpi	csps	cpups	cspq	cpupq	dbgb1	dbgb2	rss	maxop	p50	p99	tag
399	42430	13	0.1	547.8	15.5	0.000	0.001	1.374	39.716	163303	51.3	3.849	97	10.7	41.2	12.3	0.019	10600	10069	my5651_rel.cz11a_c8r32
399	36122	0	0.0	567.2	16.0	0.000	0.000	1.422	40.958	139349	52.3	3.858	116	10.9	41.4	13.0	0.010	9030	8918	my5744_rel.cz11a_c8r32
399	35454	0	0.0	516.6	14.7	0.000	0.000	1.295	37.678	136750	52.2	3.857	118	14.4	46.4	17.9	0.010	8838	8711	my5744_rel.cz11apur1_c8r32
399	32064	0	0.0	532.2	13.7	0.000	0.000	1.335	35.064	123880	52.0	3.863	130	9.8	40.4	12.0	0.004	8007	7911	my8036_rel.cz11a_c8r32
399	31955	0	0.0	593.3	15.2	0.000	0.000	1.488	39.012	123691	51.9	3.871	130	13.0	44.9	16.2	0.002	7991	7902	my8036_rel.cz11apur1_c8r32
qp100.L2
qp100.L2: point queries with 100 insert/s per client
Performance metrics for all DBMS, not just the ones listed above. Some are normalized by throughput, others are not. Legend for results is here.
ips	qps	rps	rmbps	wps	wmbps	rpq	rkbpq	wpi	wkbpi	csps	cpups	cspq	cpupq	dbgb1	dbgb2	rss	maxop	p50	p99	tag
399	34548	13	0.1	5.1	0.4	0.000	0.002	0.013	1.127	137610	50.5	3.983	117	10.7	41.2	12.4	0.012	8649	8551	my5651_rel.cz11a_c8r32
399	29933	0	0.0	78.0	2.4	0.000	0.000	0.196	6.092	119292	51.8	3.985	138	10.9	41.4	13.1	0.004	7496	7432	my5744_rel.cz11a_c8r32
399	29786	0	0.0	56.8	1.8	0.000	0.000	0.142	4.592	118727	51.7	3.986	139	14.4	46.4	17.9	0.004	7466	7400	my5744_rel.cz11apur1_c8r32
399	23808	0	0.0	72.0	2.2	0.000	0.000	0.181	5.654	95195	51.3	3.999	172	9.8	40.5	12.0	0.003	5962	5898	my8036_rel.cz11a_c8r32
399	23736	0	0.0	66.6	2.1	0.000	0.000	0.167	5.295	94969	51.2	4.001	173	13.0	44.9	16.2	0.002	5930	5866	my8036_rel.cz11apur1_c8r32
qr500.L3
qr500.L3: range queries with 500 insert/s per client
Performance metrics for all DBMS, not just the ones listed above. Some are normalized by throughput, others are not. Legend for results is here.
ips	qps	rps	rmbps	wps	wmbps	rpq	rkbpq	wpi	wkbpi	csps	cpups	cspq	cpupq	dbgb1	dbgb2	rss	maxop	p50	p99	tag
1994	41547	59	0.2	578.6	17.7	0.001	0.006	0.290	9.074	159683	52.5	3.843	101	10.7	41.2	12.4	0.029	10360	9861	my5651_rel.cz11a_c8r32
1994	35848	0	0.0	231.0	8.0	0.000	0.000	0.116	4.103	136333	53.6	3.803	120	10.9	41.4	13.1	0.018	9062	8998	my5744_rel.cz11a_c8r32
1994	35200	0	0.0	241.5	8.3	0.000	0.000	0.121	4.249	134251	53.3	3.814	121	14.4	46.4	17.9	0.014	8775	8695	my5744_rel.cz11apur1_c8r32
1994	31779	0	0.0	341.2	10.7	0.000	0.000	0.171	5.471	121670	53.3	3.829	134	9.8	40.5	12.0	0.016	7960	7896	my8036_rel.cz11a_c8r32
1993	31840	0	0.0	363.8	11.2	0.000	0.000	0.183	5.768	121963	53.1	3.831	133	13.0	44.9	16.2	0.010	7928	7866	my8036_rel.cz11apur1_c8r32
qp500.L4
qp500.L4: point queries with 500 insert/s per client
Performance metrics for all DBMS, not just the ones listed above. Some are normalized by throughput, others are not. Legend for results is here.
ips	qps	rps	rmbps	wps	wmbps	rpq	rkbpq	wpi	wkbpi	csps	cpups	cspq	cpupq	dbgb1	dbgb2	rss	maxop	p50	p99	tag
1994	34026	55	0.2	463.7	14.5	0.002	0.006	0.232	7.438	136775	52.0	4.020	122	10.7	41.2	12.3	0.012	8569	8282	my5651_rel.cz11a_c8r32
1994	29545	0	0.0	223.5	7.8	0.000	0.000	0.112	3.999	117746	53.2	3.985	144	10.9	41.4	13.1	0.014	7416	7290	my5744_rel.cz11a_c8r32
1994	29479	0	0.0	236.9	8.1	0.000	0.000	0.119	4.177	117703	52.8	3.993	143	14.4	46.4	17.9	0.018	7386	7304	my5744_rel.cz11apur1_c8r32
1994	23541	0	0.0	315.6	10.1	0.000	0.000	0.158	5.166	94463	52.6	4.013	179	9.8	40.6	12.0	0.017	5883	5818	my8036_rel.cz11a_c8r32
1994	23571	0	0.0	351.4	11.0	0.000	0.000	0.176	5.630	94416	52.5	4.006	178	13.0	45.0	16.2	0.013	5914	5834	my8036_rel.cz11apur1_c8r32
qr1000.L5
qr1000.L5: range queries with 1000 insert/s per client
Performance metrics for all DBMS, not just the ones listed above. Some are normalized by throughput, others are not. Legend for results is here.
ips	qps	rps	rmbps	wps	wmbps	rpq	rkbpq	wpi	wkbpi	csps	cpups	cspq	cpupq	dbgb1	dbgb2	rss	maxop	p50	p99	tag
3989	40904	110	0.4	728.3	23.5	0.003	0.011	0.183	6.025	157249	54.4	3.844	106	10.7	41.2	12.4	0.026	10181	9574	my5651_rel.cz11a_c8r32
3989	35272	0	0.0	499.1	17.1	0.000	0.000	0.125	4.401	133846	55.4	3.795	126	10.9	41.4	13.1	0.023	8902	8759	my5744_rel.cz11a_c8r32
3987	34911	0	0.0	530.5	18.0	0.000	0.000	0.133	4.621	133043	55.0	3.811	126	14.4	46.4	17.9	0.023	8711	8567	my5744_rel.cz11apur1_c8r32
3989	31420	0	0.0	689.2	21.6	0.000	0.000	0.173	5.538	120566	55.1	3.837	140	9.8	40.6	12.0	0.026	7896	7738	my8036_rel.cz11a_c8r32
3989	31321	0	0.0	753.6	23.2	0.000	0.000	0.189	5.966	119836	55.0	3.826	140	13.0	45.0	16.2	0.024	7832	7736	my8036_rel.cz11apur1_c8r32
qp1000.L6
qp1000.L6: point queries with 1000 insert/s per client
Performance metrics for all DBMS, not just the ones listed above. Some are normalized by throughput, others are not. Legend for results is here.
ips	qps	rps	rmbps	wps	wmbps	rpq	rkbpq	wpi	wkbpi	csps	cpups	cspq	cpupq	dbgb1	dbgb2	rss	maxop	p50	p99	tag
3989	33386	120	0.5	757.8	24.3	0.004	0.014	0.190	6.229	134785	54.0	4.037	129	10.7	41.2	12.4	0.022	8359	8006	my5651_rel.cz11a_c8r32
3989	29187	0	0.0	458.2	16.0	0.000	0.000	0.115	4.108	116278	54.7	3.984	150	10.9	41.4	13.1	0.022	7304	7098	my5744_rel.cz11a_c8r32
3989	29085	0	0.0	499.9	17.2	0.000	0.000	0.125	4.409	116373	54.3	4.001	149	14.4	46.4	17.9	0.021	7290	7160	my5744_rel.cz11apur1_c8r32
3989	23295	0	0.0	671.3	21.1	0.000	0.000	0.168	5.423	93949	54.4	4.033	187	9.8	40.7	12.0	0.029	5834	5722	my8036_rel.cz11a_c8r32
3989	23278	0	0.0	747.0	23.1	0.000	0.000	0.187	5.933	93567	54.4	4.020	187	13.0	45.1	16.2	0.023	5834	5706	my8036_rel.cz11apur1_c8r32
l.i0
- l.i0: load without secondary indexes
- Legend for results is here.
- Each entry lists the percentage of responses that fit in that bucket (slower than max time for previous bucket, faster than min time for next bucket).
Insert response time histogram
256us	1ms	4ms	16ms	64ms	256ms	1s	4s	16s	gt	max	tag
0.000	96.565	3.342	0.021	0.066	0.006	0.000	0.000	0.000	0.000	0.162	my5651_rel.cz11a_c8r32
0.000	97.747	1.918	0.279	0.050	0.006	0.000	0.000	0.000	0.000	0.159	my5744_rel.cz11a_c8r32
0.000	97.703	1.965	0.273	0.053	0.006	0.000	0.000	0.000	0.000	0.167	my5744_rel.cz11apur1_c8r32
0.000	97.057	2.472	0.372	0.091	0.007	0.000	0.000	0.000	0.000	0.146	my8036_rel.cz11a_c8r32
0.000	97.095	2.449	0.361	0.086	0.010	0.000	0.000	0.000	0.000	0.144	my8036_rel.cz11apur1_c8r32
l.x
- l.x: create secondary indexes
- Legend for results is here.
- Each entry lists the percentage of responses that fit in that bucket (slower than max time for previous bucket, faster than min time for next bucket).
TODO - determine whether there is data for create index response time
l.i1
- l.i1: continue load after secondary indexes created with 50 inserts per transaction
- Legend for results is here.
- Each entry lists the percentage of responses that fit in that bucket (slower than max time for previous bucket, faster than min time for next bucket).
Insert response time histogram
256us	1ms	4ms	16ms	64ms	256ms	1s	4s	16s	gt	max	tag
0.000	0.029	81.084	18.177	0.699	0.010	0.000	0.000	0.000	0.000	0.099	my5651_rel.cz11a_c8r32
0.000	0.002	87.751	12.122	0.120	0.006	0.000	0.000	0.000	0.000	0.169	my5744_rel.cz11a_c8r32
0.000	0.009	96.160	3.287	0.048	0.139	0.358	0.000	0.000	0.000	0.276	my5744_rel.cz11apur1_c8r32
0.000	0.000	90.062	7.846	0.200	1.891	0.000	0.000	0.000	0.000	0.217	my8036_rel.cz11a_c8r32
0.000	0.000	95.412	2.933	0.134	1.520	0.000	0.000	0.000	0.000	0.141	my8036_rel.cz11apur1_c8r32
Delete response time histogram
256us	1ms	4ms	16ms	64ms	256ms	1s	4s	16s	gt	max	tag
0.000	2.143	84.284	13.006	0.559	0.008	0.000	0.000	0.000	0.000	0.103	my5651_rel.cz11a_c8r32
0.000	3.227	84.999	11.676	0.092	0.005	0.000	0.000	0.000	0.000	0.168	my5744_rel.cz11a_c8r32
0.000	4.975	91.111	3.376	0.041	0.233	0.264	0.000	0.000	0.000	0.275	my5744_rel.cz11apur1_c8r32
0.000	8.039	82.425	7.593	0.149	1.794	0.000	0.000	0.000	0.000	0.217	my8036_rel.cz11a_c8r32
0.000	14.134	81.348	2.928	0.108	1.483	0.000	0.000	0.000	0.000	0.140	my8036_rel.cz11apur1_c8r32
l.i2
- l.i2: continue load after secondary indexes created with 5 inserts per transaction
- Legend for results is here.
- Each entry lists the percentage of responses that fit in that bucket (slower than max time for previous bucket, faster than min time for next bucket).
Insert response time histogram
256us	1ms	4ms	16ms	64ms	256ms	1s	4s	16s	gt	max	tag
8.936	79.310	11.044	0.662	0.046	0.001	0.000	0.000	0.000	0.000	0.095	my5651_rel.cz11a_c8r32
20.541	75.139	3.514	0.804	0.003	nonzero	0.000	0.000	0.000	0.000	0.068	my5744_rel.cz11a_c8r32
20.334	77.406	0.748	0.683	0.828	0.001	0.000	0.000	0.000	0.000	0.163	my5744_rel.cz11apur1_c8r32
0.611	96.080	2.476	0.487	0.003	0.344	0.000	0.000	0.000	0.000	0.127	my8036_rel.cz11a_c8r32
0.692	93.547	3.684	1.784	0.007	0.286	0.000	0.000	0.000	0.000	0.130	my8036_rel.cz11apur1_c8r32
Delete response time histogram
256us	1ms	4ms	16ms	64ms	256ms	1s	4s	16s	gt	max	tag
11.800	75.971	11.524	0.658	0.045	0.001	0.000	0.000	0.000	0.000	0.094	my5651_rel.cz11a_c8r32
21.990	73.798	3.407	0.803	0.002	nonzero	0.000	0.000	0.000	0.000	0.068	my5744_rel.cz11a_c8r32
21.445	76.315	0.731	0.681	0.828	0.001	0.000	0.000	0.000	0.000	0.163	my5744_rel.cz11apur1_c8r32
3.392	93.422	2.354	0.488	0.003	0.341	0.000	0.000	0.000	0.000	0.127	my8036_rel.cz11a_c8r32
1.876	92.393	3.657	1.781	0.007	0.285	0.000	0.000	0.000	0.000	0.130	my8036_rel.cz11apur1_c8r32
qr100.L1
- qr100.L1: range queries with 100 insert/s per client
- Legend for results is here.
- Each entry lists the percentage of responses that fit in that bucket (slower than max time for previous bucket, faster than min time for next bucket).
Query response time histogram
256us	1ms	4ms	16ms	64ms	256ms	1s	4s	16s	gt	max	tag
99.964	0.025	0.004	0.008	nonzero	0.000	0.000	0.000	0.000	0.000	0.019	my5651_rel.cz11a_c8r32
99.996	0.004	nonzero	nonzero	0.000	0.000	0.000	0.000	0.000	0.000	0.010	my5744_rel.cz11a_c8r32
99.997	0.003	nonzero	nonzero	0.000	0.000	0.000	0.000	0.000	0.000	0.010	my5744_rel.cz11apur1_c8r32
99.973	0.027	nonzero	0.000	0.000	0.000	0.000	0.000	0.000	0.000	0.004	my8036_rel.cz11a_c8r32
99.970	0.030	nonzero	0.000	0.000	0.000	0.000	0.000	0.000	0.000	0.002	my8036_rel.cz11apur1_c8r32
Insert response time histogram
256us	1ms	4ms	16ms	64ms	256ms	1s	4s	16s	gt	max	tag
0.000	0.069	66.750	32.743	0.438	0.000	0.000	0.000	0.000	0.000	0.028	my5651_rel.cz11a_c8r32
0.000	0.125	98.104	1.757	0.014	0.000	0.000	0.000	0.000	0.000	0.019	my5744_rel.cz11a_c8r32
0.000	0.160	99.500	0.340	0.000	0.000	0.000	0.000	0.000	0.000	0.011	my5744_rel.cz11apur1_c8r32
0.000	0.000	99.514	0.479	0.007	0.000	0.000	0.000	0.000	0.000	0.023	my8036_rel.cz11a_c8r32
0.000	0.000	99.542	0.451	0.000	0.007	0.000	0.000	0.000	0.000	0.102	my8036_rel.cz11apur1_c8r32
Delete response time histogram
256us	1ms	4ms	16ms	64ms	256ms	1s	4s	16s	gt	max	tag
0.000	15.604	54.104	30.056	0.236	0.000	0.000	0.000	0.000	0.000	0.023	my5651_rel.cz11a_c8r32
0.000	67.812	30.764	1.389	0.035	0.000	0.000	0.000	0.000	0.000	0.021	my5744_rel.cz11a_c8r32
0.000	66.132	33.576	0.292	0.000	0.000	0.000	0.000	0.000	0.000	0.011	my5744_rel.cz11apur1_c8r32
0.000	41.924	57.667	0.403	0.007	0.000	0.000	0.000	0.000	0.000	0.022	my8036_rel.cz11a_c8r32
0.000	48.785	50.847	0.354	0.007	0.007	0.000	0.000	0.000	0.000	0.101	my8036_rel.cz11apur1_c8r32
qp100.L2
- qp100.L2: point queries with 100 insert/s per client
- Legend for results is here.
- Each entry lists the percentage of responses that fit in that bucket (slower than max time for previous bucket, faster than min time for next bucket).
Query response time histogram
256us	1ms	4ms	16ms	64ms	256ms	1s	4s	16s	gt	max	tag
99.917	0.060	0.010	0.012	0.000	0.000	0.000	0.000	0.000	0.000	0.012	my5651_rel.cz11a_c8r32
99.939	0.059	0.002	0.000	0.000	0.000	0.000	0.000	0.000	0.000	0.004	my5744_rel.cz11a_c8r32
99.964	0.035	0.001	0.000	0.000	0.000	0.000	0.000	0.000	0.000	0.004	my5744_rel.cz11apur1_c8r32
99.674	0.326	nonzero	0.000	0.000	0.000	0.000	0.000	0.000	0.000	0.003	my8036_rel.cz11a_c8r32
99.606	0.394	nonzero	0.000	0.000	0.000	0.000	0.000	0.000	0.000	0.002	my8036_rel.cz11apur1_c8r32
Insert response time histogram
256us	1ms	4ms	16ms	64ms	256ms	1s	4s	16s	gt	max	tag
0.000	0.000	52.764	47.021	0.215	0.000	0.000	0.000	0.000	0.000	0.021	my5651_rel.cz11a_c8r32
0.000	0.000	99.764	0.236	0.000	0.000	0.000	0.000	0.000	0.000	0.010	my5744_rel.cz11a_c8r32
0.000	0.049	99.590	0.361	0.000	0.000	0.000	0.000	0.000	0.000	0.012	my5744_rel.cz11apur1_c8r32
0.000	0.000	99.833	0.139	0.000	0.028	0.000	0.000	0.000	0.000	0.102	my8036_rel.cz11a_c8r32
0.000	0.000	99.882	0.097	0.021	0.000	0.000	0.000	0.000	0.000	0.023	my8036_rel.cz11apur1_c8r32
Delete response time histogram
256us	1ms	4ms	16ms	64ms	256ms	1s	4s	16s	gt	max	tag
0.000	3.472	49.604	46.771	0.153	0.000	0.000	0.000	0.000	0.000	0.020	my5651_rel.cz11a_c8r32
0.000	47.944	51.840	0.215	0.000	0.000	0.000	0.000	0.000	0.000	0.010	my5744_rel.cz11a_c8r32
0.000	58.062	41.632	0.306	0.000	0.000	0.000	0.000	0.000	0.000	0.012	my5744_rel.cz11apur1_c8r32
0.000	29.174	70.694	0.118	0.000	0.014	0.000	0.000	0.000	0.000	0.100	my8036_rel.cz11a_c8r32
0.000	36.618	63.264	0.097	0.021	0.000	0.000	0.000	0.000	0.000	0.023	my8036_rel.cz11apur1_c8r32
qr500.L3
- qr500.L3: range queries with 500 insert/s per client
- Legend for results is here.
- Each entry lists the percentage of responses that fit in that bucket (slower than max time for previous bucket, faster than min time for next bucket).
Query response time histogram
256us	1ms	4ms	16ms	64ms	256ms	1s	4s	16s	gt	max	tag
99.874	0.090	0.026	0.010	nonzero	0.000	0.000	0.000	0.000	0.000	0.029	my5651_rel.cz11a_c8r32
99.991	0.007	0.002	nonzero	nonzero	0.000	0.000	0.000	0.000	0.000	0.018	my5744_rel.cz11a_c8r32
99.992	0.006	0.002	nonzero	0.000	0.000	0.000	0.000	0.000	0.000	0.014	my5744_rel.cz11apur1_c8r32
99.973	0.022	0.004	0.001	0.000	0.000	0.000	0.000	0.000	0.000	0.016	my8036_rel.cz11a_c8r32
99.976	0.022	0.002	nonzero	0.000	0.000	0.000	0.000	0.000	0.000	0.010	my8036_rel.cz11apur1_c8r32
Insert response time histogram
256us	1ms	4ms	16ms	64ms	256ms	1s	4s	16s	gt	max	tag
0.000	0.235	68.112	31.454	0.199	0.000	0.000	0.000	0.000	0.000	0.044	my5651_rel.cz11a_c8r32
0.000	4.428	93.781	1.774	0.018	0.000	0.000	0.000	0.000	0.000	0.038	my5744_rel.cz11a_c8r32
0.000	1.339	97.365	1.283	0.013	0.000	0.000	0.000	0.000	0.000	0.046	my5744_rel.cz11apur1_c8r32
0.000	0.000	95.112	4.444	0.089	0.354	0.000	0.000	0.000	0.000	0.117	my8036_rel.cz11a_c8r32
0.000	0.000	97.496	2.297	0.043	0.164	0.000	0.000	0.000	0.000	0.107	my8036_rel.cz11apur1_c8r32
Delete response time histogram
256us	1ms	4ms	16ms	64ms	256ms	1s	4s	16s	gt	max	tag
0.000	5.588	69.435	24.864	0.114	0.000	0.000	0.000	0.000	0.000	0.042	my5651_rel.cz11a_c8r32
0.000	77.579	20.879	1.536	0.006	0.000	0.000	0.000	0.000	0.000	0.038	my5744_rel.cz11a_c8r32
0.000	71.565	27.158	1.274	0.003	0.000	0.000	0.000	0.000	0.000	0.022	my5744_rel.cz11apur1_c8r32
0.000	53.146	43.228	3.263	0.058	0.306	0.000	0.000	0.000	0.000	0.110	my8036_rel.cz11a_c8r32
0.000	53.478	44.490	1.864	0.024	0.144	0.000	0.000	0.000	0.000	0.107	my8036_rel.cz11apur1_c8r32
qp500.L4
- qp500.L4: point queries with 500 insert/s per client
- Legend for results is here.
- Each entry lists the percentage of responses that fit in that bucket (slower than max time for previous bucket, faster than min time for next bucket).
Query response time histogram
256us	1ms	4ms	16ms	64ms	256ms	1s	4s	16s	gt	max	tag
99.756	0.185	0.050	0.009	0.000	0.000	0.000	0.000	0.000	0.000	0.012	my5651_rel.cz11a_c8r32
99.842	0.145	0.011	0.001	0.000	0.000	0.000	0.000	0.000	0.000	0.014	my5744_rel.cz11a_c8r32
99.878	0.107	0.013	0.001	nonzero	0.000	0.000	0.000	0.000	0.000	0.018	my5744_rel.cz11apur1_c8r32
99.570	0.424	0.005	0.001	nonzero	0.000	0.000	0.000	0.000	0.000	0.017	my8036_rel.cz11a_c8r32
99.604	0.391	0.005	0.001	0.000	0.000	0.000	0.000	0.000	0.000	0.013	my8036_rel.cz11apur1_c8r32
Insert response time histogram
256us	1ms	4ms	16ms	64ms	256ms	1s	4s	16s	gt	max	tag
0.000	0.417	72.204	27.203	0.176	0.000	0.000	0.000	0.000	0.000	0.044	my5651_rel.cz11a_c8r32
0.000	2.585	96.040	1.365	0.010	0.000	0.000	0.000	0.000	0.000	0.048	my5744_rel.cz11a_c8r32
0.000	1.439	97.279	1.279	0.003	0.000	0.000	0.000	0.000	0.000	0.039	my5744_rel.cz11apur1_c8r32
0.000	0.000	96.668	3.011	0.054	0.267	0.000	0.000	0.000	0.000	0.109	my8036_rel.cz11a_c8r32
0.000	0.000	96.722	2.944	0.033	0.300	0.000	0.000	0.000	0.000	0.108	my8036_rel.cz11apur1_c8r32
Delete response time histogram
256us	1ms	4ms	16ms	64ms	256ms	1s	4s	16s	gt	max	tag
0.000	6.592	71.846	21.456	0.107	0.000	0.000	0.000	0.000	0.000	0.043	my5651_rel.cz11a_c8r32
0.000	72.343	26.610	1.040	0.007	0.000	0.000	0.000	0.000	0.000	0.021	my5744_rel.cz11a_c8r32
0.000	65.576	33.346	1.071	0.007	0.000	0.000	0.000	0.000	0.000	0.039	my5744_rel.cz11apur1_c8r32
0.000	52.786	44.825	2.138	0.019	0.232	0.000	0.000	0.000	0.000	0.112	my8036_rel.cz11a_c8r32
0.000	39.639	57.832	2.246	0.024	0.260	0.000	0.000	0.000	0.000	0.110	my8036_rel.cz11apur1_c8r32
qr1000.L5
- qr1000.L5: range queries with 1000 insert/s per client
- Legend for results is here.
- Each entry lists the percentage of responses that fit in that bucket (slower than max time for previous bucket, faster than min time for next bucket).
Query response time histogram
256us	1ms	4ms	16ms	64ms	256ms	1s	4s	16s	gt	max	tag
99.770	0.191	0.034	0.005	nonzero	0.000	0.000	0.000	0.000	0.000	0.026	my5651_rel.cz11a_c8r32
99.975	0.017	0.006	0.001	nonzero	0.000	0.000	0.000	0.000	0.000	0.023	my5744_rel.cz11a_c8r32
99.975	0.015	0.009	0.001	nonzero	0.000	0.000	0.000	0.000	0.000	0.023	my5744_rel.cz11apur1_c8r32
99.933	0.052	0.012	0.003	nonzero	0.000	0.000	0.000	0.000	0.000	0.026	my8036_rel.cz11a_c8r32
99.940	0.050	0.009	0.001	nonzero	0.000	0.000	0.000	0.000	0.000	0.024	my8036_rel.cz11apur1_c8r32
Insert response time histogram
256us	1ms	4ms	16ms	64ms	256ms	1s	4s	16s	gt	max	tag
0.000	6.053	81.241	12.579	0.127	0.000	0.000	0.000	0.000	0.000	0.043	my5651_rel.cz11a_c8r32
0.000	3.653	93.866	2.380	0.101	0.000	0.000	0.000	0.000	0.000	0.049	my5744_rel.cz11a_c8r32
0.000	0.960	95.072	3.799	0.168	0.000	0.000	0.000	0.000	0.000	0.047	my5744_rel.cz11apur1_c8r32
0.000	0.000	92.894	6.156	0.497	0.452	0.000	0.000	0.000	0.000	0.122	my8036_rel.cz11a_c8r32
0.000	0.000	94.743	4.708	0.223	0.326	0.000	0.000	0.000	0.000	0.115	my8036_rel.cz11apur1_c8r32
Delete response time histogram
256us	1ms	4ms	16ms	64ms	256ms	1s	4s	16s	gt	max	tag
0.000	22.594	67.772	9.536	0.098	0.000	0.000	0.000	0.000	0.000	0.039	my5651_rel.cz11a_c8r32
0.000	78.911	19.024	1.977	0.088	0.000	0.000	0.000	0.000	0.000	0.049	my5744_rel.cz11a_c8r32
0.000	62.174	34.350	3.325	0.151	0.000	0.000	0.000	0.000	0.000	0.047	my5744_rel.cz11apur1_c8r32
0.000	49.599	44.983	4.618	0.398	0.403	0.000	0.000	0.000	0.000	0.122	my8036_rel.cz11a_c8r32
0.000	43.574	52.253	3.698	0.192	0.283	0.000	0.000	0.000	0.000	0.113	my8036_rel.cz11apur1_c8r32
qp1000.L6
- qp1000.L6: point queries with 1000 insert/s per client
- Legend for results is here.
- Each entry lists the percentage of responses that fit in that bucket (slower than max time for previous bucket, faster than min time for next bucket).
Query response time histogram
256us	1ms	4ms	16ms	64ms	256ms	1s	4s	16s	gt	max	tag
99.601	0.329	0.064	0.007	nonzero	0.000	0.000	0.000	0.000	0.000	0.022	my5651_rel.cz11a_c8r32
99.653	0.308	0.035	0.003	nonzero	0.000	0.000	0.000	0.000	0.000	0.022	my5744_rel.cz11a_c8r32
99.733	0.225	0.037	0.004	nonzero	0.000	0.000	0.000	0.000	0.000	0.021	my5744_rel.cz11apur1_c8r32
99.466	0.503	0.025	0.005	nonzero	0.000	0.000	0.000	0.000	0.000	0.029	my8036_rel.cz11a_c8r32
99.499	0.478	0.021	0.002	nonzero	0.000	0.000	0.000	0.000	0.000	0.023	my8036_rel.cz11apur1_c8r32
Insert response time histogram
256us	1ms	4ms	16ms	64ms	256ms	1s	4s	16s	gt	max	tag
0.000	5.337	74.606	19.783	0.274	0.000	0.000	0.000	0.000	0.000	0.043	my5651_rel.cz11a_c8r32
0.000	2.140	95.331	2.476	0.053	0.000	0.000	0.000	0.000	0.000	0.050	my5744_rel.cz11a_c8r32
0.000	0.511	96.442	2.984	0.063	0.000	0.000	0.000	0.000	0.000	0.049	my5744_rel.cz11apur1_c8r32
0.000	0.000	90.559	8.308	0.613	0.520	0.000	0.000	0.000	0.000	0.130	my8036_rel.cz11a_c8r32
0.000	0.000	93.152	6.215	0.201	0.432	0.000	0.000	0.000	0.000	0.115	my8036_rel.cz11apur1_c8r32
Delete response time histogram
256us	1ms	4ms	16ms	64ms	256ms	1s	4s	16s	gt	max	tag
0.000	13.966	70.122	15.722	0.191	0.000	0.000	0.000	0.000	0.000	0.042	my5651_rel.cz11a_c8r32
0.000	66.362	31.615	1.992	0.032	0.000	0.000	0.000	0.000	0.000	0.050	my5744_rel.cz11a_c8r32
0.000	48.847	48.506	2.577	0.070	0.000	0.000	0.000	0.000	0.000	0.048	my5744_rel.cz11apur1_c8r32
0.000	32.828	59.790	6.435	0.483	0.465	0.000	0.000	0.000	0.000	0.124	my8036_rel.cz11a_c8r32
0.000	28.958	65.598	4.889	0.158	0.397	0.000	0.000	0.000	0.000	0.114	my8036_rel.cz11apur1_c8r32