Introduction
This is a report for the insert benchmark with 48M docs and 4 client(s). It is generated by scripts (bash, awk, sed) and Tufte might not be impressed. An overview of the insert benchmark is here and a short update is here. Below, by DBMS, I mean DBMS+version.config. An example is my8020.c10b40 where my means MySQL, 8020 is version 8.0.20 and c10b40 is the name for the configuration file.
The test server has 8 AMD cores, 32G RAM and an NVMe SSD. It is described here as the ASUS PN53. The benchmark was run with 4 clients and there were 1 or 3 connections per client (1 for queries or inserts without rate limits, 1+1 for rate limited inserts+deletes). It uses 4 tables with a table per client. It loads 12M rows per table without secondary indexes, creates 3 secondary indexes per table, then inserts 40 rows per table with a delete per insert to avoid growing the table. It then does 6 read+write tests for 1800s each that do queries as fast as possible with 100,100,500,500,1000,1000 inserts/s and the same for deletes/s per client concurrent with the queries. The database is cached in memory. Clients and the DBMS share one server. The per-database configs are in the per-database subdirectories here.
The tested DBMS are:
- ma101107_rel.cz11a_c8r32 - MariaDB 10.11.7 with the cz11a_c8r32 config that uses innodb_purge_threads=4
- ma110401_rel.cz11b_c8r32 - MariaDB 11.4.1 with the cz11a_c8r32 config that uses innodb_purge_threads=4
- my8036_rel.cz11a_c8r32 - MySQL 8.0.36 with the cz11a_c8r32 config that uses innodb_purge_threads=4
Contents
- Summary
- l.i0: load without secondary indexes
- l.x: create secondary indexes
- l.i1: continue load after secondary indexes created with 50 inserts per transaction
- l.i2: continue load after secondary indexes created with 5 inserts per transaction
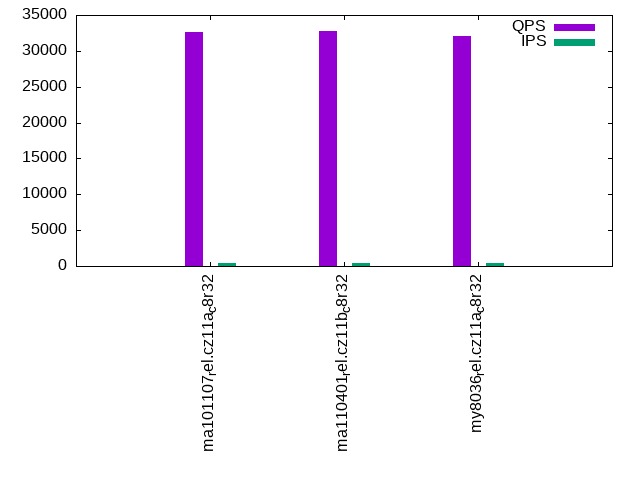
- qr100.L1: range queries with 100 insert/s per client
- qp100.L2: point queries with 100 insert/s per client
- qr500.L3: range queries with 500 insert/s per client
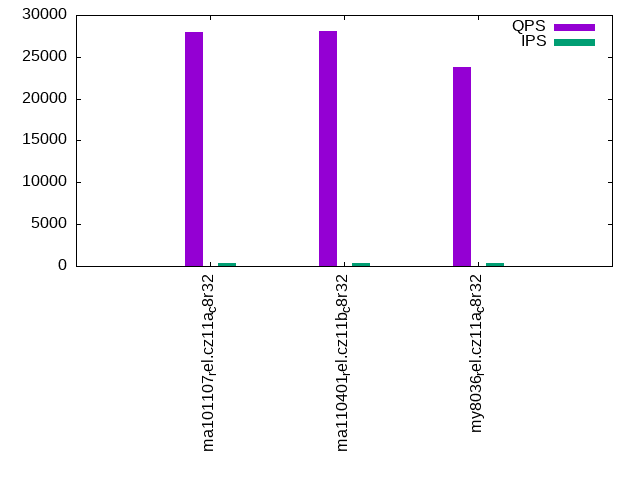
- qp500.L4: point queries with 500 insert/s per client
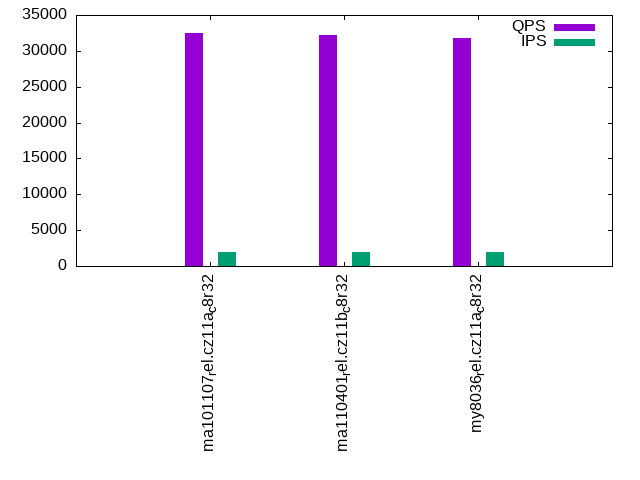
- qr1000.L5: range queries with 1000 insert/s per client
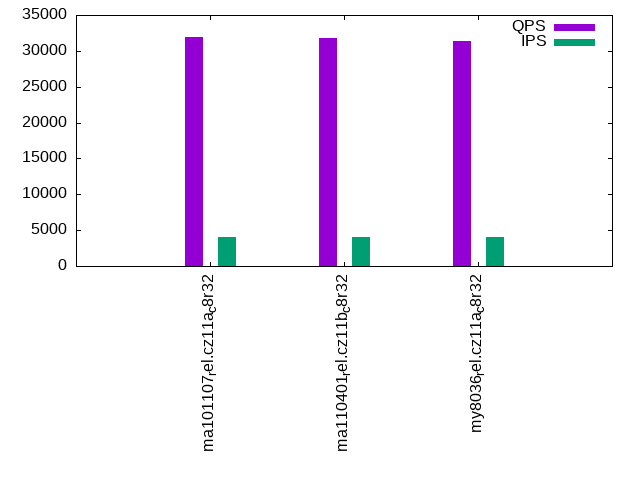
- qp1000.L6: point queries with 1000 insert/s per client
Summary
The numbers are inserts/s for l.i0, l.i1 and l.i2, indexed docs (or rows) /s for l.x and queries/s for qr100, qp100 thru qr1000, qp1000" The values are the average rate over the entire test for inserts (IPS) and queries (QPS). The range of values for IPS and QPS is split into 3 parts: bottom 25%, middle 50%, top 25%. Values in the bottom 25% have a red background, values in the top 25% have a green background and values in the middle have no color. A gray background is used for values that can be ignored because the DBMS did not sustain the target insert rate. Red backgrounds are not used when the minimum value is within 80% of the max value.
| dbms | l.i0 | l.x | l.i1 | l.i2 | qr100 | qp100 | qr500 | qp500 | qr1000 | qp1000 |
|---|---|---|---|---|---|---|---|---|---|---|
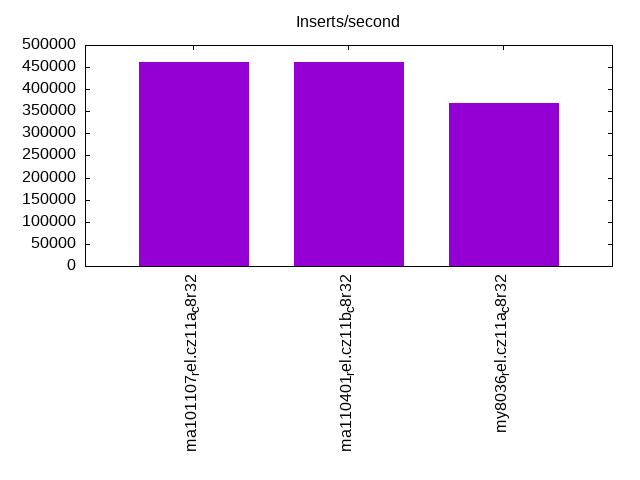
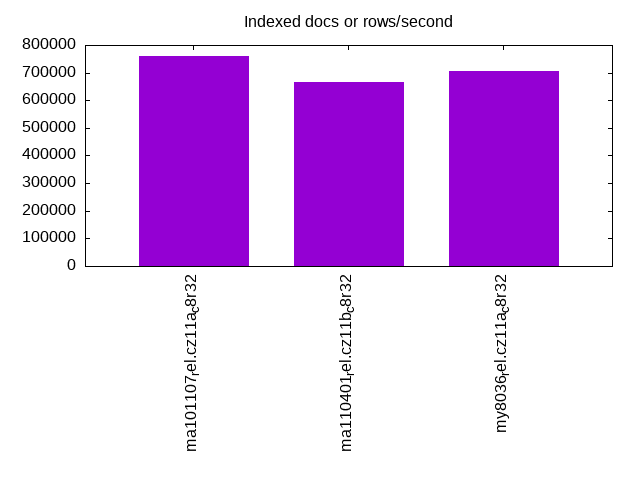
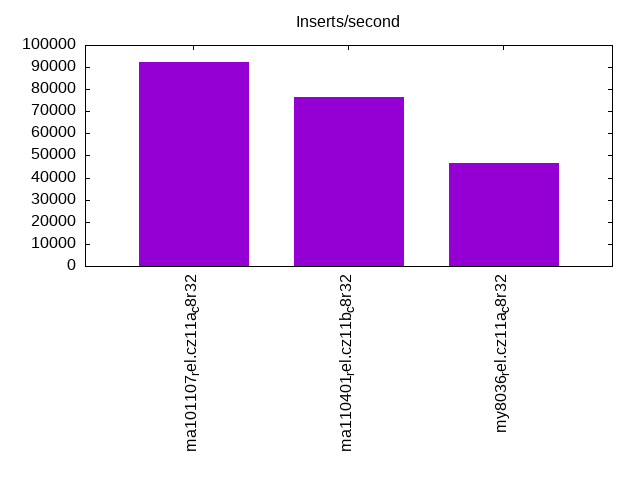
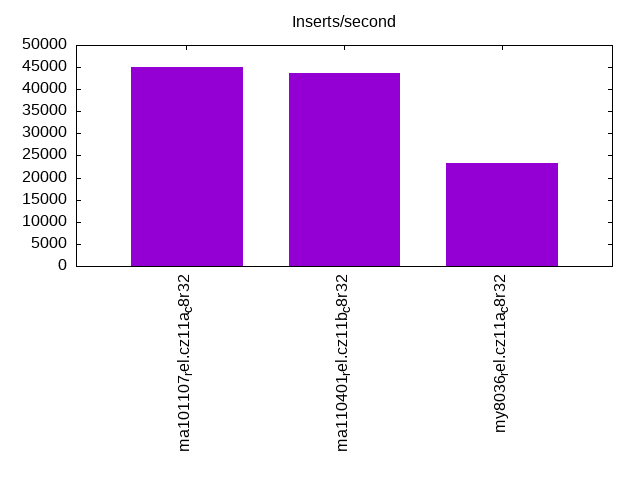
| ma101107_rel.cz11a_c8r32 | 461538 | 761906 | 92219 | 45134 | 32657 | 28016 | 32449 | 27863 | 31928 | 27489 |
| ma110401_rel.cz11b_c8r32 | 461538 | 666668 | 76509 | 43716 | 32780 | 28093 | 32263 | 27772 | 31845 | 27413 |
| my8036_rel.cz11a_c8r32 | 369231 | 705884 | 46394 | 23375 | 32064 | 23808 | 31779 | 23541 | 31420 | 23295 |
This table has relative throughput, throughput for the DBMS relative to the DBMS in the first line, using the absolute throughput from the previous table. Values less than 0.95 have a yellow background. Values greater than 1.05 have a blue background.
| dbms | l.i0 | l.x | l.i1 | l.i2 | qr100 | qp100 | qr500 | qp500 | qr1000 | qp1000 |
|---|---|---|---|---|---|---|---|---|---|---|
| ma101107_rel.cz11a_c8r32 | 1.00 | 1.00 | 1.00 | 1.00 | 1.00 | 1.00 | 1.00 | 1.00 | 1.00 | 1.00 |
| ma110401_rel.cz11b_c8r32 | 1.00 | 0.88 | 0.83 | 0.97 | 1.00 | 1.00 | 0.99 | 1.00 | 1.00 | 1.00 |
| my8036_rel.cz11a_c8r32 | 0.80 | 0.93 | 0.50 | 0.52 | 0.98 | 0.85 | 0.98 | 0.84 | 0.98 | 0.85 |
This lists the average rate of inserts/s for the tests that do inserts concurrent with queries. For such tests the query rate is listed in the table above. The read+write tests are setup so that the insert rate should match the target rate every second. Cells that are not at least 95% of the target have a red background to indicate a failure to satisfy the target.
| dbms | qr100.L1 | qp100.L2 | qr500.L3 | qp500.L4 | qr1000.L5 | qp1000.L6 |
|---|---|---|---|---|---|---|
| ma101107_rel.cz11a_c8r32 | 399 | 399 | 1994 | 1994 | 3989 | 3989 |
| ma110401_rel.cz11b_c8r32 | 399 | 399 | 1994 | 1994 | 3989 | 3989 |
| my8036_rel.cz11a_c8r32 | 399 | 399 | 1994 | 1994 | 3989 | 3989 |
| target | 400 | 400 | 2000 | 2000 | 4000 | 4000 |
l.i0
l.i0: load without secondary indexes. Graphs for performance per 1-second interval are here.
Average throughput:
Insert response time histogram: each cell has the percentage of responses that take <= the time in the header and max is the max response time in seconds. For the max column values in the top 25% of the range have a red background and in the bottom 25% of the range have a green background. The red background is not used when the min value is within 80% of the max value.
| dbms | 256us | 1ms | 4ms | 16ms | 64ms | 256ms | 1s | 4s | 16s | gt | max |
|---|---|---|---|---|---|---|---|---|---|---|---|
| ma101107_rel.cz11a_c8r32 | 90.347 | 9.297 | 0.321 | 0.018 | 0.017 | 0.203 | |||||
| ma110401_rel.cz11b_c8r32 | 90.299 | 9.361 | 0.305 | 0.018 | 0.018 | 0.196 | |||||
| my8036_rel.cz11a_c8r32 | 97.057 | 2.472 | 0.372 | 0.091 | 0.007 | 0.146 |
Performance metrics for the DBMS listed above. Some are normalized by throughput, others are not. Legend for results is here.
ips	qps	rps	rmbps	wps	wmbps	rpq	rkbpq	wpi	wkbpi	csps	cpups	cspq	cpupq	dbgb1	dbgb2	rss	maxop	p50	p99	tag
461538	0	0	0.0	1817.1	116.1	0.000	0.000	0.004	0.258	51490	73.5	0.112	13	3.2	34.0	3.3	0.203	132160	111481	ma101107_rel.cz11a_c8r32
461538	0	0	0.0	1811.9	115.9	0.000	0.000	0.004	0.257	53668	73.8	0.116	13	3.2	34.0	3.3	0.196	131553	99694	ma110401_rel.cz11b_c8r32
369231	0	0	0.0	1497.7	109.3	0.000	0.000	0.004	0.303	39456	64.2	0.107	14	3.2	33.8	5.1	0.146	102691	87330	my8036_rel.cz11a_c8r32
l.x
l.x: create secondary indexes.
Average throughput:
Performance metrics for the DBMS listed above. Some are normalized by throughput, others are not. Legend for results is here.
ips	qps	rps	rmbps	wps	wmbps	rpq	rkbpq	wpi	wkbpi	csps	cpups	cspq	cpupq	dbgb1	dbgb2	rss	maxop	p50	p99	tag
761906	0	0	0.0	6675.2	568.1	0.000	0.000	0.009	0.763	11343	45.2	0.015	5	7.2	38.0	6.9	0.001	NA	NA	ma101107_rel.cz11a_c8r32
666668	0	0	0.0	6068.1	498.4	0.000	0.000	0.009	0.765	11238	42.3	0.017	5	7.2	38.0	6.2	2.582	NA	NA	ma110401_rel.cz11b_c8r32
705884	0	3782	236.6	11907.1	730.1	0.005	0.343	0.017	1.059	34102	89.8	0.048	10	7.3	37.9	7.6	0.004	NA	NA	my8036_rel.cz11a_c8r32
l.i1
l.i1: continue load after secondary indexes created with 50 inserts per transaction. Graphs for performance per 1-second interval are here.
Average throughput:
Insert response time histogram: each cell has the percentage of responses that take <= the time in the header and max is the max response time in seconds. For the max column values in the top 25% of the range have a red background and in the bottom 25% of the range have a green background. The red background is not used when the min value is within 80% of the max value.
| dbms | 256us | 1ms | 4ms | 16ms | 64ms | 256ms | 1s | 4s | 16s | gt | max |
|---|---|---|---|---|---|---|---|---|---|---|---|
| ma101107_rel.cz11a_c8r32 | 0.622 | 94.637 | 4.629 | 0.096 | 0.015 | nonzero | 0.266 | ||||
| ma110401_rel.cz11b_c8r32 | 3.075 | 87.926 | 7.640 | 1.328 | 0.029 | 0.002 | 0.714 | ||||
| my8036_rel.cz11a_c8r32 | 90.062 | 7.846 | 0.200 | 1.891 | 0.217 |
Delete response time histogram: each cell has the percentage of responses that take <= the time in the header and max is the max response time in seconds. For the max column values in the top 25% of the range have a red background and in the bottom 25% of the range have a green background. The red background is not used when the min value is within 80% of the max value.
| dbms | 256us | 1ms | 4ms | 16ms | 64ms | 256ms | 1s | 4s | 16s | gt | max |
|---|---|---|---|---|---|---|---|---|---|---|---|
| ma101107_rel.cz11a_c8r32 | 16.692 | 79.130 | 4.083 | 0.081 | 0.013 | 0.208 | |||||
| ma110401_rel.cz11b_c8r32 | 22.684 | 69.498 | 6.697 | 1.095 | 0.025 | 0.001 | 0.681 | ||||
| my8036_rel.cz11a_c8r32 | 8.039 | 82.425 | 7.593 | 0.149 | 1.794 | 0.217 |
Performance metrics for the DBMS listed above. Some are normalized by throughput, others are not. Legend for results is here.
ips	qps	rps	rmbps	wps	wmbps	rpq	rkbpq	wpi	wkbpi	csps	cpups	cspq	cpupq	dbgb1	dbgb2	rss	maxop	p50	p99	tag
92219	0	3797	14.8	9695.1	339.7	0.041	0.165	0.105	3.772	123979	83.2	1.344	72	10.0	40.8	10.1	0.266	23725	12041	ma101107_rel.cz11a_c8r32
76509	0	2911	11.4	8556.0	289.4	0.038	0.152	0.112	3.874	109946	67.3	1.437	70	10.1	41.0	10.1	0.714	19829	7842	ma110401_rel.cz11b_c8r32
46394	0	84	1.3	5139.4	193.7	0.002	0.029	0.111	4.276	30534	50.3	0.658	87	9.8	40.4	12.0	0.217	11537	6443	my8036_rel.cz11a_c8r32
l.i2
l.i2: continue load after secondary indexes created with 5 inserts per transaction. Graphs for performance per 1-second interval are here.
Average throughput:
Insert response time histogram: each cell has the percentage of responses that take <= the time in the header and max is the max response time in seconds. For the max column values in the top 25% of the range have a red background and in the bottom 25% of the range have a green background. The red background is not used when the min value is within 80% of the max value.
| dbms | 256us | 1ms | 4ms | 16ms | 64ms | 256ms | 1s | 4s | 16s | gt | max |
|---|---|---|---|---|---|---|---|---|---|---|---|
| ma101107_rel.cz11a_c8r32 | 17.259 | 79.386 | 3.254 | 0.098 | 0.001 | 0.002 | 0.139 | ||||
| ma110401_rel.cz11b_c8r32 | 21.896 | 74.945 | 2.801 | 0.326 | 0.030 | 0.002 | 0.143 | ||||
| my8036_rel.cz11a_c8r32 | 0.611 | 96.080 | 2.476 | 0.487 | 0.003 | 0.344 | 0.127 |
Delete response time histogram: each cell has the percentage of responses that take <= the time in the header and max is the max response time in seconds. For the max column values in the top 25% of the range have a red background and in the bottom 25% of the range have a green background. The red background is not used when the min value is within 80% of the max value.
| dbms | 256us | 1ms | 4ms | 16ms | 64ms | 256ms | 1s | 4s | 16s | gt | max |
|---|---|---|---|---|---|---|---|---|---|---|---|
| ma101107_rel.cz11a_c8r32 | 22.189 | 74.286 | 3.419 | 0.104 | 0.001 | 0.002 | 0.138 | ||||
| ma110401_rel.cz11b_c8r32 | 25.235 | 71.560 | 2.873 | 0.303 | 0.026 | 0.002 | 0.144 | ||||
| my8036_rel.cz11a_c8r32 | 3.392 | 93.422 | 2.354 | 0.488 | 0.003 | 0.341 | 0.127 |
Performance metrics for the DBMS listed above. Some are normalized by throughput, others are not. Legend for results is here.
ips	qps	rps	rmbps	wps	wmbps	rpq	rkbpq	wpi	wkbpi	csps	cpups	cspq	cpupq	dbgb1	dbgb2	rss	maxop	p50	p99	tag
45134	0	5903	23.1	4807.8	168.7	0.131	0.523	0.107	3.828	178328	83.5	3.951	148	10.0	40.8	10.1	0.139	11313	9964	ma101107_rel.cz11a_c8r32
43716	0	5646	22.1	4743.0	162.1	0.129	0.517	0.108	3.797	175773	80.5	4.021	147	10.1	41.0	10.1	0.143	11183	8259	ma110401_rel.cz11b_c8r32
23375	0	0	0.0	2846.3	101.4	0.000	0.000	0.122	4.443	79709	50.9	3.410	174	9.8	40.4	12.0	0.127	5806	3536	my8036_rel.cz11a_c8r32
qr100.L1
qr100.L1: range queries with 100 insert/s per client. Graphs for performance per 1-second interval are here.
Average throughput:
Query response time histogram: each cell has the percentage of responses that take <= the time in the header and max is the max response time in seconds. For max values in the top 25% of the range have a red background and in the bottom 25% of the range have a green background. The red background is not used when the min value is within 80% of the max value.
| dbms | 256us | 1ms | 4ms | 16ms | 64ms | 256ms | 1s | 4s | 16s | gt | max |
|---|---|---|---|---|---|---|---|---|---|---|---|
| ma101107_rel.cz11a_c8r32 | 99.990 | 0.009 | 0.001 | nonzero | 0.005 | ||||||
| ma110401_rel.cz11b_c8r32 | 99.991 | 0.008 | 0.001 | nonzero | 0.008 | ||||||
| my8036_rel.cz11a_c8r32 | 99.973 | 0.027 | nonzero | 0.004 |
Insert response time histogram: each cell has the percentage of responses that take <= the time in the header and max is the max response time in seconds. For max values in the top 25% of the range have a red background and in the bottom 25% of the range have a green background. The red background is not used when the min value is within 80% of the max value.
| dbms | 256us | 1ms | 4ms | 16ms | 64ms | 256ms | 1s | 4s | 16s | gt | max |
|---|---|---|---|---|---|---|---|---|---|---|---|
| ma101107_rel.cz11a_c8r32 | 1.083 | 62.111 | 36.806 | 0.012 | |||||||
| ma110401_rel.cz11b_c8r32 | 2.611 | 55.528 | 41.861 | 0.012 | |||||||
| my8036_rel.cz11a_c8r32 | 99.514 | 0.479 | 0.007 | 0.023 |
Delete response time histogram: each cell has the percentage of responses that take <= the time in the header and max is the max response time in seconds. For max values in the top 25% of the range have a red background and in the bottom 25% of the range have a green background. The red background is not used when the min value is within 80% of the max value.
| dbms | 256us | 1ms | 4ms | 16ms | 64ms | 256ms | 1s | 4s | 16s | gt | max |
|---|---|---|---|---|---|---|---|---|---|---|---|
| ma101107_rel.cz11a_c8r32 | 12.340 | 49.562 | 38.097 | 0.012 | |||||||
| ma110401_rel.cz11b_c8r32 | 12.424 | 45.729 | 41.847 | 0.011 | |||||||
| my8036_rel.cz11a_c8r32 | 41.924 | 57.667 | 0.403 | 0.007 | 0.022 |
Performance metrics for the DBMS listed above. Some are normalized by throughput, others are not. Legend for results is here.
ips	qps	rps	rmbps	wps	wmbps	rpq	rkbpq	wpi	wkbpi	csps	cpups	cspq	cpupq	dbgb1	dbgb2	rss	maxop	p50	p99	tag
399	32657	8	0.0	11.3	0.6	0.000	0.001	0.028	1.571	124766	52.2	3.821	128	10.0	40.8	10.0	0.005	8103	8023	ma101107_rel.cz11a_c8r32
399	32780	8	0.0	18.0	0.8	0.000	0.001	0.045	2.018	125270	52.2	3.822	127	10.1	41.0	10.1	0.008	8167	8103	ma110401_rel.cz11b_c8r32
399	32064	0	0.0	532.2	13.7	0.000	0.000	1.335	35.064	123880	52.0	3.863	130	9.8	40.4	12.0	0.004	8007	7911	my8036_rel.cz11a_c8r32
qp100.L2
qp100.L2: point queries with 100 insert/s per client. Graphs for performance per 1-second interval are here.
Average throughput:
Query response time histogram: each cell has the percentage of responses that take <= the time in the header and max is the max response time in seconds. For max values in the top 25% of the range have a red background and in the bottom 25% of the range have a green background. The red background is not used when the min value is within 80% of the max value.
| dbms | 256us | 1ms | 4ms | 16ms | 64ms | 256ms | 1s | 4s | 16s | gt | max |
|---|---|---|---|---|---|---|---|---|---|---|---|
| ma101107_rel.cz11a_c8r32 | 99.914 | 0.082 | 0.004 | 0.004 | |||||||
| ma110401_rel.cz11b_c8r32 | 99.922 | 0.075 | 0.002 | 0.002 | |||||||
| my8036_rel.cz11a_c8r32 | 99.674 | 0.326 | nonzero | 0.003 |
Insert response time histogram: each cell has the percentage of responses that take <= the time in the header and max is the max response time in seconds. For max values in the top 25% of the range have a red background and in the bottom 25% of the range have a green background. The red background is not used when the min value is within 80% of the max value.
| dbms | 256us | 1ms | 4ms | 16ms | 64ms | 256ms | 1s | 4s | 16s | gt | max |
|---|---|---|---|---|---|---|---|---|---|---|---|
| ma101107_rel.cz11a_c8r32 | 0.062 | 53.299 | 46.639 | 0.012 | |||||||
| ma110401_rel.cz11b_c8r32 | 3.097 | 61.785 | 35.118 | 0.011 | |||||||
| my8036_rel.cz11a_c8r32 | 99.833 | 0.139 | 0.028 | 0.102 |
Delete response time histogram: each cell has the percentage of responses that take <= the time in the header and max is the max response time in seconds. For max values in the top 25% of the range have a red background and in the bottom 25% of the range have a green background. The red background is not used when the min value is within 80% of the max value.
| dbms | 256us | 1ms | 4ms | 16ms | 64ms | 256ms | 1s | 4s | 16s | gt | max |
|---|---|---|---|---|---|---|---|---|---|---|---|
| ma101107_rel.cz11a_c8r32 | 3.583 | 49.792 | 46.625 | 0.012 | |||||||
| ma110401_rel.cz11b_c8r32 | 10.000 | 54.889 | 35.111 | 0.011 | |||||||
| my8036_rel.cz11a_c8r32 | 29.174 | 70.694 | 0.118 | 0.014 | 0.100 |
Performance metrics for the DBMS listed above. Some are normalized by throughput, others are not. Legend for results is here.
ips	qps	rps	rmbps	wps	wmbps	rpq	rkbpq	wpi	wkbpi	csps	cpups	cspq	cpupq	dbgb1	dbgb2	rss	maxop	p50	p99	tag
399	28016	8	0.0	23.7	0.9	0.000	0.001	0.060	2.437	111714	51.9	3.988	148	10.0	40.8	10.0	0.004	7000	6937	ma101107_rel.cz11a_c8r32
399	28093	10	0.0	24.3	0.9	0.000	0.001	0.061	2.439	112059	51.9	3.989	148	10.1	41.0	10.1	0.002	7019	6954	ma110401_rel.cz11b_c8r32
399	23808	0	0.0	72.0	2.2	0.000	0.000	0.181	5.654	95195	51.3	3.999	172	9.8	40.5	12.0	0.003	5962	5898	my8036_rel.cz11a_c8r32
qr500.L3
qr500.L3: range queries with 500 insert/s per client. Graphs for performance per 1-second interval are here.
Average throughput:
Query response time histogram: each cell has the percentage of responses that take <= the time in the header and max is the max response time in seconds. For max values in the top 25% of the range have a red background and in the bottom 25% of the range have a green background. The red background is not used when the min value is within 80% of the max value.
| dbms | 256us | 1ms | 4ms | 16ms | 64ms | 256ms | 1s | 4s | 16s | gt | max |
|---|---|---|---|---|---|---|---|---|---|---|---|
| ma101107_rel.cz11a_c8r32 | 99.938 | 0.047 | 0.015 | nonzero | 0.014 | ||||||
| ma110401_rel.cz11b_c8r32 | 99.940 | 0.046 | 0.013 | nonzero | 0.015 | ||||||
| my8036_rel.cz11a_c8r32 | 99.973 | 0.022 | 0.004 | 0.001 | 0.016 |
Insert response time histogram: each cell has the percentage of responses that take <= the time in the header and max is the max response time in seconds. For max values in the top 25% of the range have a red background and in the bottom 25% of the range have a green background. The red background is not used when the min value is within 80% of the max value.
| dbms | 256us | 1ms | 4ms | 16ms | 64ms | 256ms | 1s | 4s | 16s | gt | max |
|---|---|---|---|---|---|---|---|---|---|---|---|
| ma101107_rel.cz11a_c8r32 | 1.479 | 88.206 | 10.303 | 0.013 | 0.030 | ||||||
| ma110401_rel.cz11b_c8r32 | 4.203 | 88.297 | 7.487 | 0.013 | 0.032 | ||||||
| my8036_rel.cz11a_c8r32 | 95.112 | 4.444 | 0.089 | 0.354 | 0.117 |
Delete response time histogram: each cell has the percentage of responses that take <= the time in the header and max is the max response time in seconds. For max values in the top 25% of the range have a red background and in the bottom 25% of the range have a green background. The red background is not used when the min value is within 80% of the max value.
| dbms | 256us | 1ms | 4ms | 16ms | 64ms | 256ms | 1s | 4s | 16s | gt | max |
|---|---|---|---|---|---|---|---|---|---|---|---|
| ma101107_rel.cz11a_c8r32 | 18.286 | 72.489 | 9.213 | 0.013 | 0.034 | ||||||
| ma110401_rel.cz11b_c8r32 | 17.947 | 75.671 | 6.371 | 0.011 | 0.033 | ||||||
| my8036_rel.cz11a_c8r32 | 53.146 | 43.228 | 3.263 | 0.058 | 0.306 | 0.110 |
Performance metrics for the DBMS listed above. Some are normalized by throughput, others are not. Legend for results is here.
ips	qps	rps	rmbps	wps	wmbps	rpq	rkbpq	wpi	wkbpi	csps	cpups	cspq	cpupq	dbgb1	dbgb2	rss	maxop	p50	p99	tag
1994	32449	57	0.2	165.0	6.0	0.002	0.007	0.083	3.062	124428	53.3	3.835	131	10.0	40.8	10.0	0.014	8135	7928	ma101107_rel.cz11a_c8r32
1994	32263	59	0.2	167.5	5.9	0.002	0.007	0.084	3.043	123788	53.3	3.837	132	10.1	41.0	10.1	0.015	8074	7816	ma110401_rel.cz11b_c8r32
1994	31779	0	0.0	341.2	10.7	0.000	0.000	0.171	5.471	121670	53.3	3.829	134	9.8	40.5	12.0	0.016	7960	7896	my8036_rel.cz11a_c8r32
qp500.L4
qp500.L4: point queries with 500 insert/s per client. Graphs for performance per 1-second interval are here.
Average throughput:

Query response time histogram: each cell has the percentage of responses that take <= the time in the header and max is the max response time in seconds. For max values in the top 25% of the range have a red background and in the bottom 25% of the range have a green background. The red background is not used when the min value is within 80% of the max value.
| dbms | 256us | 1ms | 4ms | 16ms | 64ms | 256ms | 1s | 4s | 16s | gt | max |
|---|---|---|---|---|---|---|---|---|---|---|---|
| ma101107_rel.cz11a_c8r32 | 99.868 | 0.122 | 0.010 | nonzero | 0.014 | ||||||
| ma110401_rel.cz11b_c8r32 | 99.885 | 0.107 | 0.008 | nonzero | nonzero | 0.017 | |||||
| my8036_rel.cz11a_c8r32 | 99.570 | 0.424 | 0.005 | 0.001 | nonzero | 0.017 |
Insert response time histogram: each cell has the percentage of responses that take <= the time in the header and max is the max response time in seconds. For max values in the top 25% of the range have a red background and in the bottom 25% of the range have a green background. The red background is not used when the min value is within 80% of the max value.
| dbms | 256us | 1ms | 4ms | 16ms | 64ms | 256ms | 1s | 4s | 16s | gt | max |
|---|---|---|---|---|---|---|---|---|---|---|---|
| ma101107_rel.cz11a_c8r32 | 8.876 | 83.806 | 7.308 | 0.010 | 0.037 | ||||||
| ma110401_rel.cz11b_c8r32 | 13.196 | 81.103 | 5.688 | 0.014 | 0.031 | ||||||
| my8036_rel.cz11a_c8r32 | 96.668 | 3.011 | 0.054 | 0.267 | 0.109 |
Delete response time histogram: each cell has the percentage of responses that take <= the time in the header and max is the max response time in seconds. For max values in the top 25% of the range have a red background and in the bottom 25% of the range have a green background. The red background is not used when the min value is within 80% of the max value.
| dbms | 256us | 1ms | 4ms | 16ms | 64ms | 256ms | 1s | 4s | 16s | gt | max |
|---|---|---|---|---|---|---|---|---|---|---|---|
| ma101107_rel.cz11a_c8r32 | 41.258 | 51.547 | 7.185 | 0.010 | 0.036 | ||||||
| ma110401_rel.cz11b_c8r32 | 37.340 | 56.994 | 5.651 | 0.014 | 0.031 | ||||||
| my8036_rel.cz11a_c8r32 | 52.786 | 44.825 | 2.138 | 0.019 | 0.232 | 0.112 |
Performance metrics for the DBMS listed above. Some are normalized by throughput, others are not. Legend for results is here.
ips	qps	rps	rmbps	wps	wmbps	rpq	rkbpq	wpi	wkbpi	csps	cpups	cspq	cpupq	dbgb1	dbgb2	rss	maxop	p50	p99	tag
1994	27863	69	0.3	164.9	6.0	0.002	0.010	0.083	3.059	111838	53.2	4.014	153	10.0	40.8	10.1	0.014	6968	6856	ma101107_rel.cz11a_c8r32
1994	27772	69	0.3	170.0	6.0	0.002	0.010	0.085	3.055	111605	53.1	4.019	153	10.1	41.0	10.1	0.017	6937	6811	ma110401_rel.cz11b_c8r32
1994	23541	0	0.0	315.6	10.1	0.000	0.000	0.158	5.166	94463	52.6	4.013	179	9.8	40.6	12.0	0.017	5883	5818	my8036_rel.cz11a_c8r32
qr1000.L5
qr1000.L5: range queries with 1000 insert/s per client. Graphs for performance per 1-second interval are here.
Average throughput:
Query response time histogram: each cell has the percentage of responses that take <= the time in the header and max is the max response time in seconds. For max values in the top 25% of the range have a red background and in the bottom 25% of the range have a green background. The red background is not used when the min value is within 80% of the max value.
| dbms | 256us | 1ms | 4ms | 16ms | 64ms | 256ms | 1s | 4s | 16s | gt | max |
|---|---|---|---|---|---|---|---|---|---|---|---|
| ma101107_rel.cz11a_c8r32 | 99.924 | 0.065 | 0.010 | 0.001 | 0.015 | ||||||
| ma110401_rel.cz11b_c8r32 | 99.911 | 0.074 | 0.014 | 0.001 | nonzero | 0.020 | |||||
| my8036_rel.cz11a_c8r32 | 99.933 | 0.052 | 0.012 | 0.003 | nonzero | 0.026 |
Insert response time histogram: each cell has the percentage of responses that take <= the time in the header and max is the max response time in seconds. For max values in the top 25% of the range have a red background and in the bottom 25% of the range have a green background. The red background is not used when the min value is within 80% of the max value.
| dbms | 256us | 1ms | 4ms | 16ms | 64ms | 256ms | 1s | 4s | 16s | gt | max |
|---|---|---|---|---|---|---|---|---|---|---|---|
| ma101107_rel.cz11a_c8r32 | 30.652 | 67.385 | 1.956 | 0.007 | 0.040 | ||||||
| ma110401_rel.cz11b_c8r32 | 23.608 | 73.288 | 3.064 | 0.040 | 0.042 | ||||||
| my8036_rel.cz11a_c8r32 | 92.894 | 6.156 | 0.497 | 0.452 | 0.122 |
Delete response time histogram: each cell has the percentage of responses that take <= the time in the header and max is the max response time in seconds. For max values in the top 25% of the range have a red background and in the bottom 25% of the range have a green background. The red background is not used when the min value is within 80% of the max value.
| dbms | 256us | 1ms | 4ms | 16ms | 64ms | 256ms | 1s | 4s | 16s | gt | max |
|---|---|---|---|---|---|---|---|---|---|---|---|
| ma101107_rel.cz11a_c8r32 | 74.677 | 23.603 | 1.715 | 0.005 | 0.038 | ||||||
| ma110401_rel.cz11b_c8r32 | 56.348 | 41.070 | 2.550 | 0.032 | 0.043 | ||||||
| my8036_rel.cz11a_c8r32 | 49.599 | 44.983 | 4.618 | 0.398 | 0.403 | 0.122 |
Performance metrics for the DBMS listed above. Some are normalized by throughput, others are not. Legend for results is here.
ips	qps	rps	rmbps	wps	wmbps	rpq	rkbpq	wpi	wkbpi	csps	cpups	cspq	cpupq	dbgb1	dbgb2	rss	maxop	p50	p99	tag
3989	31928	107	0.4	427.1	14.5	0.003	0.013	0.107	3.724	123793	54.8	3.877	137	10.0	40.8	10.1	0.015	7991	7802	ma101107_rel.cz11a_c8r32
3989	31845	104	0.4	432.9	14.3	0.003	0.013	0.109	3.683	123217	54.7	3.869	137	10.1	41.0	10.1	0.020	7975	7754	ma110401_rel.cz11b_c8r32
3989	31420	0	0.0	689.2	21.6	0.000	0.000	0.173	5.538	120566	55.1	3.837	140	9.8	40.6	12.0	0.026	7896	7738	my8036_rel.cz11a_c8r32
qp1000.L6
qp1000.L6: point queries with 1000 insert/s per client. Graphs for performance per 1-second interval are here.
Average throughput:
Query response time histogram: each cell has the percentage of responses that take <= the time in the header and max is the max response time in seconds. For max values in the top 25% of the range have a red background and in the bottom 25% of the range have a green background. The red background is not used when the min value is within 80% of the max value.
| dbms | 256us | 1ms | 4ms | 16ms | 64ms | 256ms | 1s | 4s | 16s | gt | max |
|---|---|---|---|---|---|---|---|---|---|---|---|
| ma101107_rel.cz11a_c8r32 | 99.835 | 0.151 | 0.014 | nonzero | 0.008 | ||||||
| ma110401_rel.cz11b_c8r32 | 99.869 | 0.125 | 0.005 | nonzero | 0.013 | ||||||
| my8036_rel.cz11a_c8r32 | 99.466 | 0.503 | 0.025 | 0.005 | nonzero | 0.029 |
Insert response time histogram: each cell has the percentage of responses that take <= the time in the header and max is the max response time in seconds. For max values in the top 25% of the range have a red background and in the bottom 25% of the range have a green background. The red background is not used when the min value is within 80% of the max value.
| dbms | 256us | 1ms | 4ms | 16ms | 64ms | 256ms | 1s | 4s | 16s | gt | max |
|---|---|---|---|---|---|---|---|---|---|---|---|
| ma101107_rel.cz11a_c8r32 | 15.353 | 81.567 | 3.069 | 0.011 | 0.040 | ||||||
| ma110401_rel.cz11b_c8r32 | 29.667 | 68.490 | 1.826 | 0.017 | 0.033 | ||||||
| my8036_rel.cz11a_c8r32 | 90.559 | 8.308 | 0.613 | 0.520 | 0.130 |
Delete response time histogram: each cell has the percentage of responses that take <= the time in the header and max is the max response time in seconds. For max values in the top 25% of the range have a red background and in the bottom 25% of the range have a green background. The red background is not used when the min value is within 80% of the max value.
| dbms | 256us | 1ms | 4ms | 16ms | 64ms | 256ms | 1s | 4s | 16s | gt | max |
|---|---|---|---|---|---|---|---|---|---|---|---|
| ma101107_rel.cz11a_c8r32 | 63.165 | 34.381 | 2.444 | 0.010 | 0.039 | ||||||
| ma110401_rel.cz11b_c8r32 | 74.533 | 23.835 | 1.625 | 0.008 | 0.032 | ||||||
| my8036_rel.cz11a_c8r32 | 32.828 | 59.790 | 6.435 | 0.483 | 0.465 | 0.124 |
Performance metrics for the DBMS listed above. Some are normalized by throughput, others are not. Legend for results is here.
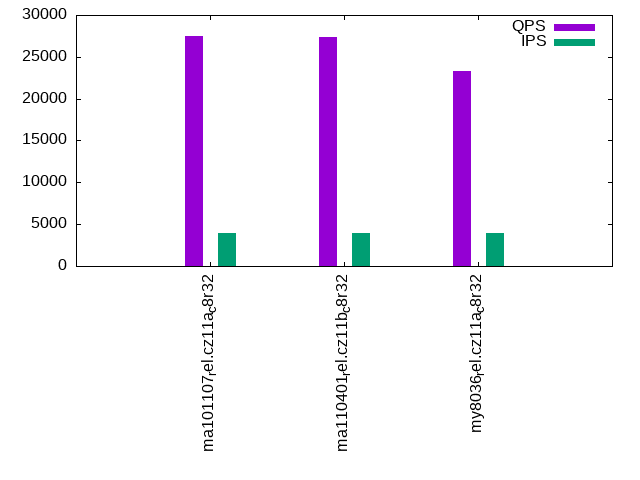
ips	qps	rps	rmbps	wps	wmbps	rpq	rkbpq	wpi	wkbpi	csps	cpups	cspq	cpupq	dbgb1	dbgb2	rss	maxop	p50	p99	tag
3989	27489	150	0.6	360.9	12.7	0.005	0.022	0.090	3.258	111671	54.8	4.062	159	10.0	40.8	10.1	0.008	6889	6777	ma101107_rel.cz11a_c8r32
3989	27413	154	0.6	370.8	12.7	0.006	0.022	0.093	3.262	111794	54.7	4.078	160	10.1	41.0	10.1	0.013	6841	6699	ma110401_rel.cz11b_c8r32
3989	23295	0	0.0	671.3	21.1	0.000	0.000	0.168	5.423	93949	54.4	4.033	187	9.8	40.7	12.0	0.029	5834	5722	my8036_rel.cz11a_c8r32
l.i0
l.i0: load without secondary indexes
Performance metrics for all DBMS, not just the ones listed above. Some are normalized by throughput, others are not. Legend for results is here.
ips	qps	rps	rmbps	wps	wmbps	rpq	rkbpq	wpi	wkbpi	csps	cpups	cspq	cpupq	dbgb1	dbgb2	rss	maxop	p50	p99	tag
461538	0	0	0.0	1817.1	116.1	0.000	0.000	0.004	0.258	51490	73.5	0.112	13	3.2	34.0	3.3	0.203	132160	111481	ma101107_rel.cz11a_c8r32
461538	0	0	0.0	1811.9	115.9	0.000	0.000	0.004	0.257	53668	73.8	0.116	13	3.2	34.0	3.3	0.196	131553	99694	ma110401_rel.cz11b_c8r32
369231	0	0	0.0	1497.7	109.3	0.000	0.000	0.004	0.303	39456	64.2	0.107	14	3.2	33.8	5.1	0.146	102691	87330	my8036_rel.cz11a_c8r32
l.x
l.x: create secondary indexes
Performance metrics for all DBMS, not just the ones listed above. Some are normalized by throughput, others are not. Legend for results is here.
ips	qps	rps	rmbps	wps	wmbps	rpq	rkbpq	wpi	wkbpi	csps	cpups	cspq	cpupq	dbgb1	dbgb2	rss	maxop	p50	p99	tag
761906	0	0	0.0	6675.2	568.1	0.000	0.000	0.009	0.763	11343	45.2	0.015	5	7.2	38.0	6.9	0.001	NA	NA	ma101107_rel.cz11a_c8r32
666668	0	0	0.0	6068.1	498.4	0.000	0.000	0.009	0.765	11238	42.3	0.017	5	7.2	38.0	6.2	2.582	NA	NA	ma110401_rel.cz11b_c8r32
705884	0	3782	236.6	11907.1	730.1	0.005	0.343	0.017	1.059	34102	89.8	0.048	10	7.3	37.9	7.6	0.004	NA	NA	my8036_rel.cz11a_c8r32
l.i1
l.i1: continue load after secondary indexes created with 50 inserts per transaction
Performance metrics for all DBMS, not just the ones listed above. Some are normalized by throughput, others are not. Legend for results is here.
ips	qps	rps	rmbps	wps	wmbps	rpq	rkbpq	wpi	wkbpi	csps	cpups	cspq	cpupq	dbgb1	dbgb2	rss	maxop	p50	p99	tag
92219	0	3797	14.8	9695.1	339.7	0.041	0.165	0.105	3.772	123979	83.2	1.344	72	10.0	40.8	10.1	0.266	23725	12041	ma101107_rel.cz11a_c8r32
76509	0	2911	11.4	8556.0	289.4	0.038	0.152	0.112	3.874	109946	67.3	1.437	70	10.1	41.0	10.1	0.714	19829	7842	ma110401_rel.cz11b_c8r32
46394	0	84	1.3	5139.4	193.7	0.002	0.029	0.111	4.276	30534	50.3	0.658	87	9.8	40.4	12.0	0.217	11537	6443	my8036_rel.cz11a_c8r32
l.i2
l.i2: continue load after secondary indexes created with 5 inserts per transaction
Performance metrics for all DBMS, not just the ones listed above. Some are normalized by throughput, others are not. Legend for results is here.
ips	qps	rps	rmbps	wps	wmbps	rpq	rkbpq	wpi	wkbpi	csps	cpups	cspq	cpupq	dbgb1	dbgb2	rss	maxop	p50	p99	tag
45134	0	5903	23.1	4807.8	168.7	0.131	0.523	0.107	3.828	178328	83.5	3.951	148	10.0	40.8	10.1	0.139	11313	9964	ma101107_rel.cz11a_c8r32
43716	0	5646	22.1	4743.0	162.1	0.129	0.517	0.108	3.797	175773	80.5	4.021	147	10.1	41.0	10.1	0.143	11183	8259	ma110401_rel.cz11b_c8r32
23375	0	0	0.0	2846.3	101.4	0.000	0.000	0.122	4.443	79709	50.9	3.410	174	9.8	40.4	12.0	0.127	5806	3536	my8036_rel.cz11a_c8r32
qr100.L1
qr100.L1: range queries with 100 insert/s per client
Performance metrics for all DBMS, not just the ones listed above. Some are normalized by throughput, others are not. Legend for results is here.
ips	qps	rps	rmbps	wps	wmbps	rpq	rkbpq	wpi	wkbpi	csps	cpups	cspq	cpupq	dbgb1	dbgb2	rss	maxop	p50	p99	tag
399	32657	8	0.0	11.3	0.6	0.000	0.001	0.028	1.571	124766	52.2	3.821	128	10.0	40.8	10.0	0.005	8103	8023	ma101107_rel.cz11a_c8r32
399	32780	8	0.0	18.0	0.8	0.000	0.001	0.045	2.018	125270	52.2	3.822	127	10.1	41.0	10.1	0.008	8167	8103	ma110401_rel.cz11b_c8r32
399	32064	0	0.0	532.2	13.7	0.000	0.000	1.335	35.064	123880	52.0	3.863	130	9.8	40.4	12.0	0.004	8007	7911	my8036_rel.cz11a_c8r32
qp100.L2
qp100.L2: point queries with 100 insert/s per client
Performance metrics for all DBMS, not just the ones listed above. Some are normalized by throughput, others are not. Legend for results is here.
ips	qps	rps	rmbps	wps	wmbps	rpq	rkbpq	wpi	wkbpi	csps	cpups	cspq	cpupq	dbgb1	dbgb2	rss	maxop	p50	p99	tag
399	28016	8	0.0	23.7	0.9	0.000	0.001	0.060	2.437	111714	51.9	3.988	148	10.0	40.8	10.0	0.004	7000	6937	ma101107_rel.cz11a_c8r32
399	28093	10	0.0	24.3	0.9	0.000	0.001	0.061	2.439	112059	51.9	3.989	148	10.1	41.0	10.1	0.002	7019	6954	ma110401_rel.cz11b_c8r32
399	23808	0	0.0	72.0	2.2	0.000	0.000	0.181	5.654	95195	51.3	3.999	172	9.8	40.5	12.0	0.003	5962	5898	my8036_rel.cz11a_c8r32
qr500.L3
qr500.L3: range queries with 500 insert/s per client
Performance metrics for all DBMS, not just the ones listed above. Some are normalized by throughput, others are not. Legend for results is here.
ips	qps	rps	rmbps	wps	wmbps	rpq	rkbpq	wpi	wkbpi	csps	cpups	cspq	cpupq	dbgb1	dbgb2	rss	maxop	p50	p99	tag
1994	32449	57	0.2	165.0	6.0	0.002	0.007	0.083	3.062	124428	53.3	3.835	131	10.0	40.8	10.0	0.014	8135	7928	ma101107_rel.cz11a_c8r32
1994	32263	59	0.2	167.5	5.9	0.002	0.007	0.084	3.043	123788	53.3	3.837	132	10.1	41.0	10.1	0.015	8074	7816	ma110401_rel.cz11b_c8r32
1994	31779	0	0.0	341.2	10.7	0.000	0.000	0.171	5.471	121670	53.3	3.829	134	9.8	40.5	12.0	0.016	7960	7896	my8036_rel.cz11a_c8r32
qp500.L4
qp500.L4: point queries with 500 insert/s per client
Performance metrics for all DBMS, not just the ones listed above. Some are normalized by throughput, others are not. Legend for results is here.
ips	qps	rps	rmbps	wps	wmbps	rpq	rkbpq	wpi	wkbpi	csps	cpups	cspq	cpupq	dbgb1	dbgb2	rss	maxop	p50	p99	tag
1994	27863	69	0.3	164.9	6.0	0.002	0.010	0.083	3.059	111838	53.2	4.014	153	10.0	40.8	10.1	0.014	6968	6856	ma101107_rel.cz11a_c8r32
1994	27772	69	0.3	170.0	6.0	0.002	0.010	0.085	3.055	111605	53.1	4.019	153	10.1	41.0	10.1	0.017	6937	6811	ma110401_rel.cz11b_c8r32
1994	23541	0	0.0	315.6	10.1	0.000	0.000	0.158	5.166	94463	52.6	4.013	179	9.8	40.6	12.0	0.017	5883	5818	my8036_rel.cz11a_c8r32
qr1000.L5
qr1000.L5: range queries with 1000 insert/s per client
Performance metrics for all DBMS, not just the ones listed above. Some are normalized by throughput, others are not. Legend for results is here.
ips	qps	rps	rmbps	wps	wmbps	rpq	rkbpq	wpi	wkbpi	csps	cpups	cspq	cpupq	dbgb1	dbgb2	rss	maxop	p50	p99	tag
3989	31928	107	0.4	427.1	14.5	0.003	0.013	0.107	3.724	123793	54.8	3.877	137	10.0	40.8	10.1	0.015	7991	7802	ma101107_rel.cz11a_c8r32
3989	31845	104	0.4	432.9	14.3	0.003	0.013	0.109	3.683	123217	54.7	3.869	137	10.1	41.0	10.1	0.020	7975	7754	ma110401_rel.cz11b_c8r32
3989	31420	0	0.0	689.2	21.6	0.000	0.000	0.173	5.538	120566	55.1	3.837	140	9.8	40.6	12.0	0.026	7896	7738	my8036_rel.cz11a_c8r32
qp1000.L6
qp1000.L6: point queries with 1000 insert/s per client
Performance metrics for all DBMS, not just the ones listed above. Some are normalized by throughput, others are not. Legend for results is here.
ips	qps	rps	rmbps	wps	wmbps	rpq	rkbpq	wpi	wkbpi	csps	cpups	cspq	cpupq	dbgb1	dbgb2	rss	maxop	p50	p99	tag
3989	27489	150	0.6	360.9	12.7	0.005	0.022	0.090	3.258	111671	54.8	4.062	159	10.0	40.8	10.1	0.008	6889	6777	ma101107_rel.cz11a_c8r32
3989	27413	154	0.6	370.8	12.7	0.006	0.022	0.093	3.262	111794	54.7	4.078	160	10.1	41.0	10.1	0.013	6841	6699	ma110401_rel.cz11b_c8r32
3989	23295	0	0.0	671.3	21.1	0.000	0.000	0.168	5.423	93949	54.4	4.033	187	9.8	40.7	12.0	0.029	5834	5722	my8036_rel.cz11a_c8r32
l.i0
- l.i0: load without secondary indexes
- Legend for results is here.
- Each entry lists the percentage of responses that fit in that bucket (slower than max time for previous bucket, faster than min time for next bucket).
Insert response time histogram
256us	1ms	4ms	16ms	64ms	256ms	1s	4s	16s	gt	max	tag
0.000	90.347	9.297	0.321	0.018	0.017	0.000	0.000	0.000	0.000	0.203	ma101107_rel.cz11a_c8r32
0.000	90.299	9.361	0.305	0.018	0.018	0.000	0.000	0.000	0.000	0.196	ma110401_rel.cz11b_c8r32
0.000	97.057	2.472	0.372	0.091	0.007	0.000	0.000	0.000	0.000	0.146	my8036_rel.cz11a_c8r32
l.x
- l.x: create secondary indexes
- Legend for results is here.
- Each entry lists the percentage of responses that fit in that bucket (slower than max time for previous bucket, faster than min time for next bucket).
TODO - determine whether there is data for create index response time
l.i1
- l.i1: continue load after secondary indexes created with 50 inserts per transaction
- Legend for results is here.
- Each entry lists the percentage of responses that fit in that bucket (slower than max time for previous bucket, faster than min time for next bucket).
Insert response time histogram
256us	1ms	4ms	16ms	64ms	256ms	1s	4s	16s	gt	max	tag
0.000	0.622	94.637	4.629	0.096	0.015	nonzero	0.000	0.000	0.000	0.266	ma101107_rel.cz11a_c8r32
0.000	3.075	87.926	7.640	1.328	0.029	0.002	0.000	0.000	0.000	0.714	ma110401_rel.cz11b_c8r32
0.000	0.000	90.062	7.846	0.200	1.891	0.000	0.000	0.000	0.000	0.217	my8036_rel.cz11a_c8r32
Delete response time histogram
256us	1ms	4ms	16ms	64ms	256ms	1s	4s	16s	gt	max	tag
0.000	16.692	79.130	4.083	0.081	0.013	0.000	0.000	0.000	0.000	0.208	ma101107_rel.cz11a_c8r32
0.000	22.684	69.498	6.697	1.095	0.025	0.001	0.000	0.000	0.000	0.681	ma110401_rel.cz11b_c8r32
0.000	8.039	82.425	7.593	0.149	1.794	0.000	0.000	0.000	0.000	0.217	my8036_rel.cz11a_c8r32
l.i2
- l.i2: continue load after secondary indexes created with 5 inserts per transaction
- Legend for results is here.
- Each entry lists the percentage of responses that fit in that bucket (slower than max time for previous bucket, faster than min time for next bucket).
Insert response time histogram
256us	1ms	4ms	16ms	64ms	256ms	1s	4s	16s	gt	max	tag
17.259	79.386	3.254	0.098	0.001	0.002	0.000	0.000	0.000	0.000	0.139	ma101107_rel.cz11a_c8r32
21.896	74.945	2.801	0.326	0.030	0.002	0.000	0.000	0.000	0.000	0.143	ma110401_rel.cz11b_c8r32
0.611	96.080	2.476	0.487	0.003	0.344	0.000	0.000	0.000	0.000	0.127	my8036_rel.cz11a_c8r32
Delete response time histogram
256us	1ms	4ms	16ms	64ms	256ms	1s	4s	16s	gt	max	tag
22.189	74.286	3.419	0.104	0.001	0.002	0.000	0.000	0.000	0.000	0.138	ma101107_rel.cz11a_c8r32
25.235	71.560	2.873	0.303	0.026	0.002	0.000	0.000	0.000	0.000	0.144	ma110401_rel.cz11b_c8r32
3.392	93.422	2.354	0.488	0.003	0.341	0.000	0.000	0.000	0.000	0.127	my8036_rel.cz11a_c8r32
qr100.L1
- qr100.L1: range queries with 100 insert/s per client
- Legend for results is here.
- Each entry lists the percentage of responses that fit in that bucket (slower than max time for previous bucket, faster than min time for next bucket).
Query response time histogram
256us	1ms	4ms	16ms	64ms	256ms	1s	4s	16s	gt	max	tag
99.990	0.009	0.001	nonzero	0.000	0.000	0.000	0.000	0.000	0.000	0.005	ma101107_rel.cz11a_c8r32
99.991	0.008	0.001	nonzero	0.000	0.000	0.000	0.000	0.000	0.000	0.008	ma110401_rel.cz11b_c8r32
99.973	0.027	nonzero	0.000	0.000	0.000	0.000	0.000	0.000	0.000	0.004	my8036_rel.cz11a_c8r32
Insert response time histogram
256us	1ms	4ms	16ms	64ms	256ms	1s	4s	16s	gt	max	tag
0.000	1.083	62.111	36.806	0.000	0.000	0.000	0.000	0.000	0.000	0.012	ma101107_rel.cz11a_c8r32
0.000	2.611	55.528	41.861	0.000	0.000	0.000	0.000	0.000	0.000	0.012	ma110401_rel.cz11b_c8r32
0.000	0.000	99.514	0.479	0.007	0.000	0.000	0.000	0.000	0.000	0.023	my8036_rel.cz11a_c8r32
Delete response time histogram
256us	1ms	4ms	16ms	64ms	256ms	1s	4s	16s	gt	max	tag
0.000	12.340	49.562	38.097	0.000	0.000	0.000	0.000	0.000	0.000	0.012	ma101107_rel.cz11a_c8r32
0.000	12.424	45.729	41.847	0.000	0.000	0.000	0.000	0.000	0.000	0.011	ma110401_rel.cz11b_c8r32
0.000	41.924	57.667	0.403	0.007	0.000	0.000	0.000	0.000	0.000	0.022	my8036_rel.cz11a_c8r32
qp100.L2
- qp100.L2: point queries with 100 insert/s per client
- Legend for results is here.
- Each entry lists the percentage of responses that fit in that bucket (slower than max time for previous bucket, faster than min time for next bucket).
Query response time histogram
256us	1ms	4ms	16ms	64ms	256ms	1s	4s	16s	gt	max	tag
99.914	0.082	0.004	0.000	0.000	0.000	0.000	0.000	0.000	0.000	0.004	ma101107_rel.cz11a_c8r32
99.922	0.075	0.002	0.000	0.000	0.000	0.000	0.000	0.000	0.000	0.002	ma110401_rel.cz11b_c8r32
99.674	0.326	nonzero	0.000	0.000	0.000	0.000	0.000	0.000	0.000	0.003	my8036_rel.cz11a_c8r32
Insert response time histogram
256us	1ms	4ms	16ms	64ms	256ms	1s	4s	16s	gt	max	tag
0.000	0.062	53.299	46.639	0.000	0.000	0.000	0.000	0.000	0.000	0.012	ma101107_rel.cz11a_c8r32
0.000	3.097	61.785	35.118	0.000	0.000	0.000	0.000	0.000	0.000	0.011	ma110401_rel.cz11b_c8r32
0.000	0.000	99.833	0.139	0.000	0.028	0.000	0.000	0.000	0.000	0.102	my8036_rel.cz11a_c8r32
Delete response time histogram
256us	1ms	4ms	16ms	64ms	256ms	1s	4s	16s	gt	max	tag
0.000	3.583	49.792	46.625	0.000	0.000	0.000	0.000	0.000	0.000	0.012	ma101107_rel.cz11a_c8r32
0.000	10.000	54.889	35.111	0.000	0.000	0.000	0.000	0.000	0.000	0.011	ma110401_rel.cz11b_c8r32
0.000	29.174	70.694	0.118	0.000	0.014	0.000	0.000	0.000	0.000	0.100	my8036_rel.cz11a_c8r32
qr500.L3
- qr500.L3: range queries with 500 insert/s per client
- Legend for results is here.
- Each entry lists the percentage of responses that fit in that bucket (slower than max time for previous bucket, faster than min time for next bucket).
Query response time histogram
256us	1ms	4ms	16ms	64ms	256ms	1s	4s	16s	gt	max	tag
99.938	0.047	0.015	nonzero	0.000	0.000	0.000	0.000	0.000	0.000	0.014	ma101107_rel.cz11a_c8r32
99.940	0.046	0.013	nonzero	0.000	0.000	0.000	0.000	0.000	0.000	0.015	ma110401_rel.cz11b_c8r32
99.973	0.022	0.004	0.001	0.000	0.000	0.000	0.000	0.000	0.000	0.016	my8036_rel.cz11a_c8r32
Insert response time histogram
256us	1ms	4ms	16ms	64ms	256ms	1s	4s	16s	gt	max	tag
0.000	1.479	88.206	10.303	0.013	0.000	0.000	0.000	0.000	0.000	0.030	ma101107_rel.cz11a_c8r32
0.000	4.203	88.297	7.487	0.013	0.000	0.000	0.000	0.000	0.000	0.032	ma110401_rel.cz11b_c8r32
0.000	0.000	95.112	4.444	0.089	0.354	0.000	0.000	0.000	0.000	0.117	my8036_rel.cz11a_c8r32
Delete response time histogram
256us	1ms	4ms	16ms	64ms	256ms	1s	4s	16s	gt	max	tag
0.000	18.286	72.489	9.213	0.013	0.000	0.000	0.000	0.000	0.000	0.034	ma101107_rel.cz11a_c8r32
0.000	17.947	75.671	6.371	0.011	0.000	0.000	0.000	0.000	0.000	0.033	ma110401_rel.cz11b_c8r32
0.000	53.146	43.228	3.263	0.058	0.306	0.000	0.000	0.000	0.000	0.110	my8036_rel.cz11a_c8r32
qp500.L4
- qp500.L4: point queries with 500 insert/s per client
- Legend for results is here.
- Each entry lists the percentage of responses that fit in that bucket (slower than max time for previous bucket, faster than min time for next bucket).
Query response time histogram
256us	1ms	4ms	16ms	64ms	256ms	1s	4s	16s	gt	max	tag
99.868	0.122	0.010	nonzero	0.000	0.000	0.000	0.000	0.000	0.000	0.014	ma101107_rel.cz11a_c8r32
99.885	0.107	0.008	nonzero	nonzero	0.000	0.000	0.000	0.000	0.000	0.017	ma110401_rel.cz11b_c8r32
99.570	0.424	0.005	0.001	nonzero	0.000	0.000	0.000	0.000	0.000	0.017	my8036_rel.cz11a_c8r32
Insert response time histogram
256us	1ms	4ms	16ms	64ms	256ms	1s	4s	16s	gt	max	tag
0.000	8.876	83.806	7.308	0.010	0.000	0.000	0.000	0.000	0.000	0.037	ma101107_rel.cz11a_c8r32
0.000	13.196	81.103	5.688	0.014	0.000	0.000	0.000	0.000	0.000	0.031	ma110401_rel.cz11b_c8r32
0.000	0.000	96.668	3.011	0.054	0.267	0.000	0.000	0.000	0.000	0.109	my8036_rel.cz11a_c8r32
Delete response time histogram
256us	1ms	4ms	16ms	64ms	256ms	1s	4s	16s	gt	max	tag
0.000	41.258	51.547	7.185	0.010	0.000	0.000	0.000	0.000	0.000	0.036	ma101107_rel.cz11a_c8r32
0.000	37.340	56.994	5.651	0.014	0.000	0.000	0.000	0.000	0.000	0.031	ma110401_rel.cz11b_c8r32
0.000	52.786	44.825	2.138	0.019	0.232	0.000	0.000	0.000	0.000	0.112	my8036_rel.cz11a_c8r32
qr1000.L5
- qr1000.L5: range queries with 1000 insert/s per client
- Legend for results is here.
- Each entry lists the percentage of responses that fit in that bucket (slower than max time for previous bucket, faster than min time for next bucket).
Query response time histogram
256us	1ms	4ms	16ms	64ms	256ms	1s	4s	16s	gt	max	tag
99.924	0.065	0.010	0.001	0.000	0.000	0.000	0.000	0.000	0.000	0.015	ma101107_rel.cz11a_c8r32
99.911	0.074	0.014	0.001	nonzero	0.000	0.000	0.000	0.000	0.000	0.020	ma110401_rel.cz11b_c8r32
99.933	0.052	0.012	0.003	nonzero	0.000	0.000	0.000	0.000	0.000	0.026	my8036_rel.cz11a_c8r32
Insert response time histogram
256us	1ms	4ms	16ms	64ms	256ms	1s	4s	16s	gt	max	tag
0.000	30.652	67.385	1.956	0.007	0.000	0.000	0.000	0.000	0.000	0.040	ma101107_rel.cz11a_c8r32
0.000	23.608	73.288	3.064	0.040	0.000	0.000	0.000	0.000	0.000	0.042	ma110401_rel.cz11b_c8r32
0.000	0.000	92.894	6.156	0.497	0.452	0.000	0.000	0.000	0.000	0.122	my8036_rel.cz11a_c8r32
Delete response time histogram
256us	1ms	4ms	16ms	64ms	256ms	1s	4s	16s	gt	max	tag
0.000	74.677	23.603	1.715	0.005	0.000	0.000	0.000	0.000	0.000	0.038	ma101107_rel.cz11a_c8r32
0.000	56.348	41.070	2.550	0.032	0.000	0.000	0.000	0.000	0.000	0.043	ma110401_rel.cz11b_c8r32
0.000	49.599	44.983	4.618	0.398	0.403	0.000	0.000	0.000	0.000	0.122	my8036_rel.cz11a_c8r32
qp1000.L6
- qp1000.L6: point queries with 1000 insert/s per client
- Legend for results is here.
- Each entry lists the percentage of responses that fit in that bucket (slower than max time for previous bucket, faster than min time for next bucket).
Query response time histogram
256us	1ms	4ms	16ms	64ms	256ms	1s	4s	16s	gt	max	tag
99.835	0.151	0.014	nonzero	0.000	0.000	0.000	0.000	0.000	0.000	0.008	ma101107_rel.cz11a_c8r32
99.869	0.125	0.005	nonzero	0.000	0.000	0.000	0.000	0.000	0.000	0.013	ma110401_rel.cz11b_c8r32
99.466	0.503	0.025	0.005	nonzero	0.000	0.000	0.000	0.000	0.000	0.029	my8036_rel.cz11a_c8r32
Insert response time histogram
256us	1ms	4ms	16ms	64ms	256ms	1s	4s	16s	gt	max	tag
0.000	15.353	81.567	3.069	0.011	0.000	0.000	0.000	0.000	0.000	0.040	ma101107_rel.cz11a_c8r32
0.000	29.667	68.490	1.826	0.017	0.000	0.000	0.000	0.000	0.000	0.033	ma110401_rel.cz11b_c8r32
0.000	0.000	90.559	8.308	0.613	0.520	0.000	0.000	0.000	0.000	0.130	my8036_rel.cz11a_c8r32
Delete response time histogram
256us	1ms	4ms	16ms	64ms	256ms	1s	4s	16s	gt	max	tag
0.000	63.165	34.381	2.444	0.010	0.000	0.000	0.000	0.000	0.000	0.039	ma101107_rel.cz11a_c8r32
0.000	74.533	23.835	1.625	0.008	0.000	0.000	0.000	0.000	0.000	0.032	ma110401_rel.cz11b_c8r32
0.000	32.828	59.790	6.435	0.483	0.465	0.000	0.000	0.000	0.000	0.124	my8036_rel.cz11a_c8r32