Introduction
This is a report for the insert benchmark with 48M docs and 4 client(s). It is generated by scripts (bash, awk, sed) and Tufte might not be impressed. An overview of the insert benchmark is here and a short update is here. Below, by DBMS, I mean DBMS+version.config. An example is my8020.c10b40 where my means MySQL, 8020 is version 8.0.20 and c10b40 is the name for the configuration file.
The test server has 8 AMD cores, 32G RAM and an NVMe SSD. It is described here as the ASUS PN53. The benchmark was run with 4 clients and there were 1 or 3 connections per client (1 for queries or inserts without rate limits, 1+1 for rate limited inserts+deletes). It uses 4 tables with a table per client. It loads 12M rows per table without secondary indexes, creates 3 secondary indexes per table, then inserts 40 rows per table with a delete per insert to avoid growing the table. It then does 6 read+write tests for 1800s each that do queries as fast as possible with 100,100,500,500,1000,1000 inserts/s and the same for deletes/s per client concurrent with the queries. The database is cached in memory. Clients and the DBMS share one server. The per-database configs are in the per-database subdirectories here.
The tested DBMS are:
- ma100244_rel.cz11a_c8r32 - MariaDB 10.2.44 with the cz11a_c8r32 config that uses innodb_purge_threads=4
- ma100339_rel.cz11a_c8r32 - MariaDB 10.3.39 with the cz11a_c8r32 config that uses innodb_purge_threads=4
- ma100433_rel.cz11a_c8r32 - MariaDB 10.4.33 with the cz11a_c8r32 config that uses innodb_purge_threads=4
- ma100524_rel.cz11a_c8r32 - MariaDB 10.5.24 with the cz11a_c8r32 config that uses innodb_purge_threads=4
- ma100617_rel.cz11a_c8r32 - MariaDB 10.6.17 with the cz11a_c8r32 config that uses innodb_purge_threads=4
- ma101107_rel.cz11a_c8r32 - MariaDB 10.11.7 with the cz11a_c8r32 config that uses innodb_purge_threads=4
- ma110401_rel.cz11b_c8r32 - MariaDB 11.4.1 with the cz11a_c8r32 config that uses innodb_purge_threads=4
Contents
- Summary
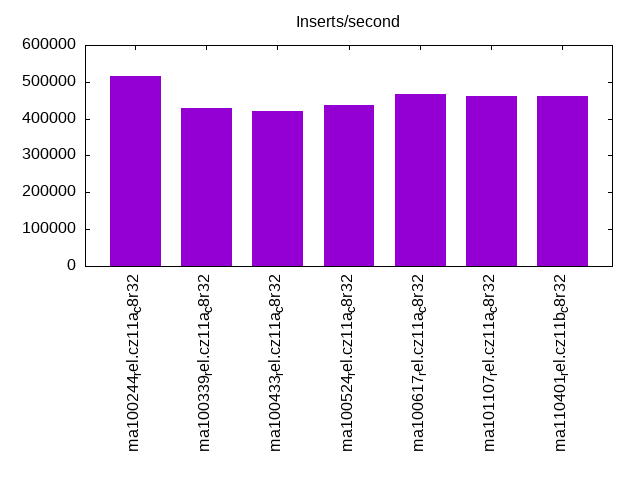
- l.i0: load without secondary indexes
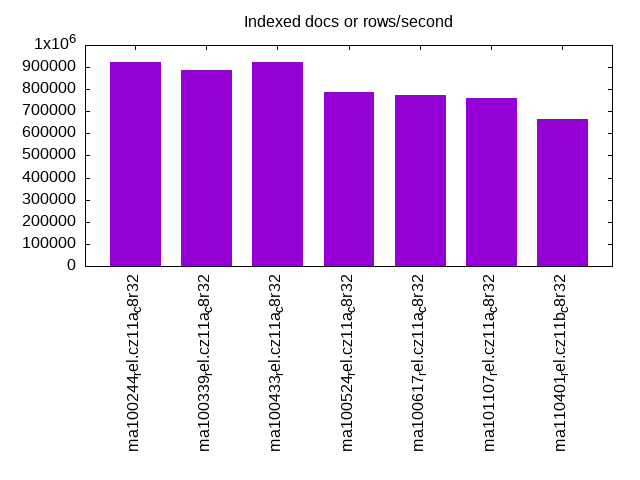
- l.x: create secondary indexes
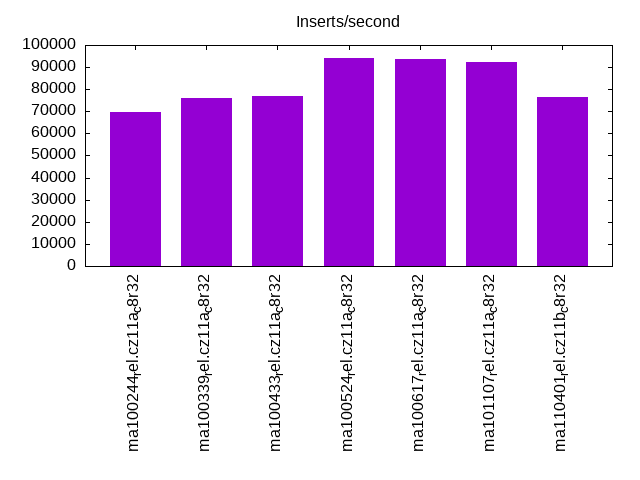
- l.i1: continue load after secondary indexes created with 50 inserts per transaction
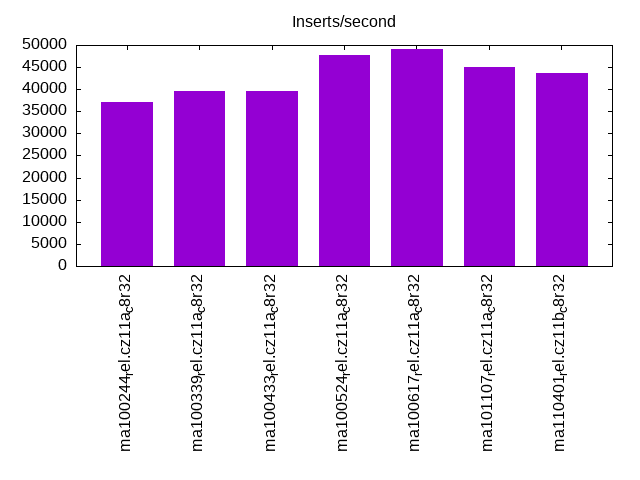
- l.i2: continue load after secondary indexes created with 5 inserts per transaction
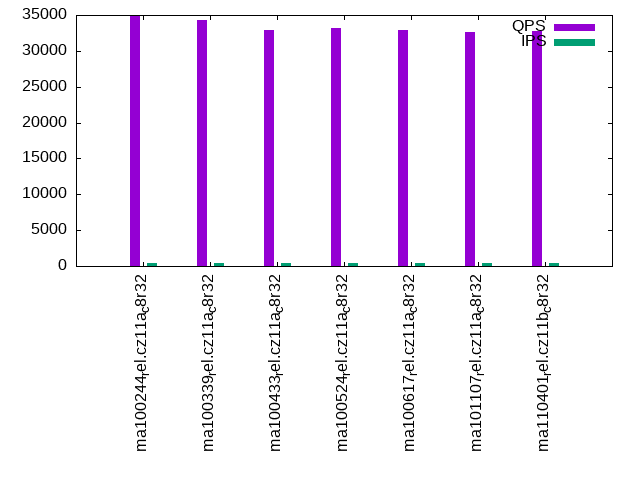
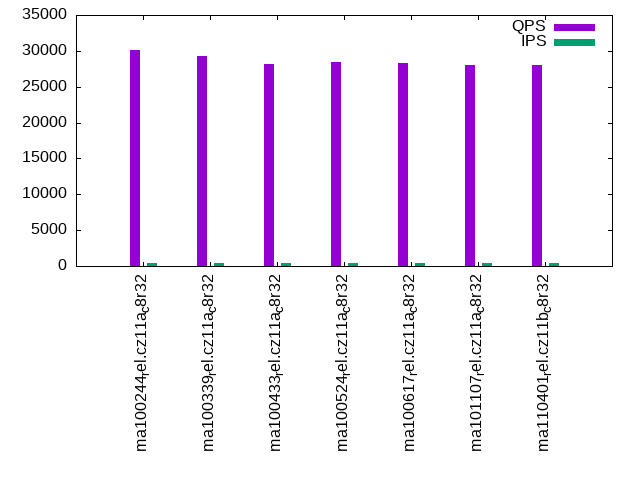
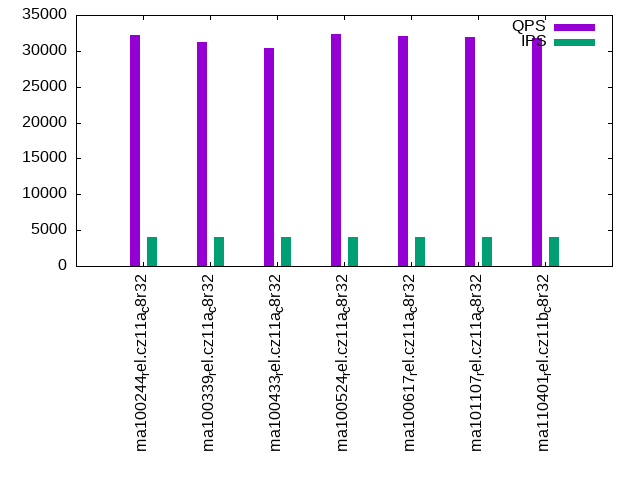
- qr100.L1: range queries with 100 insert/s per client
- qp100.L2: point queries with 100 insert/s per client
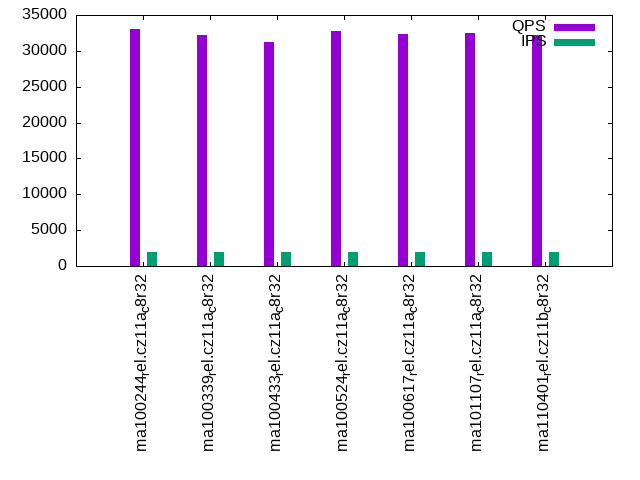
- qr500.L3: range queries with 500 insert/s per client
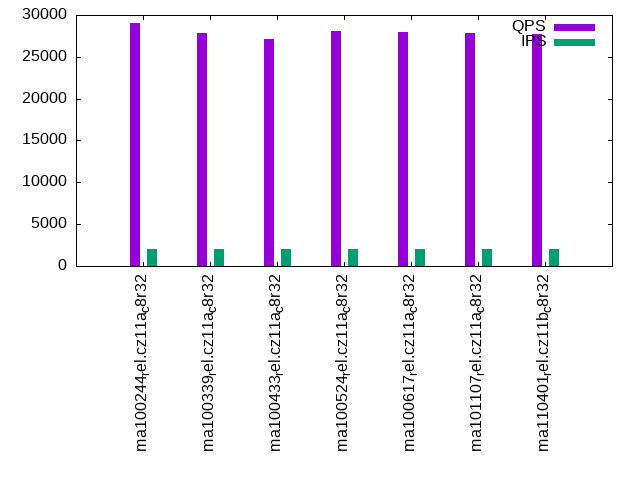
- qp500.L4: point queries with 500 insert/s per client
- qr1000.L5: range queries with 1000 insert/s per client
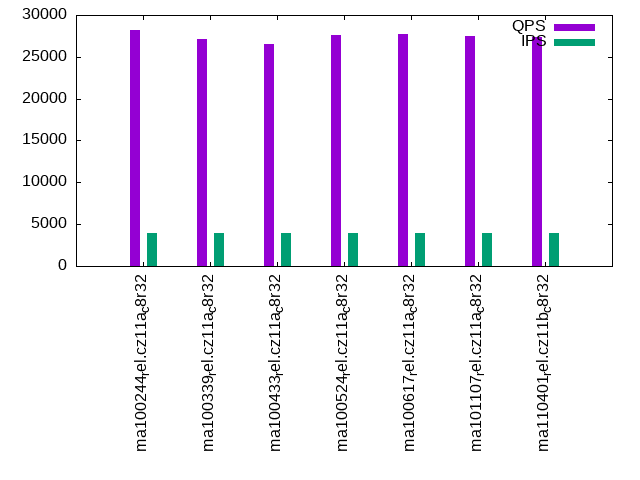
- qp1000.L6: point queries with 1000 insert/s per client
Summary
The numbers are inserts/s for l.i0, l.i1 and l.i2, indexed docs (or rows) /s for l.x and queries/s for qr100, qp100 thru qr1000, qp1000" The values are the average rate over the entire test for inserts (IPS) and queries (QPS). The range of values for IPS and QPS is split into 3 parts: bottom 25%, middle 50%, top 25%. Values in the bottom 25% have a red background, values in the top 25% have a green background and values in the middle have no color. A gray background is used for values that can be ignored because the DBMS did not sustain the target insert rate. Red backgrounds are not used when the minimum value is within 80% of the max value.
| dbms | l.i0 | l.x | l.i1 | l.i2 | qr100 | qp100 | qr500 | qp500 | qr1000 | qp1000 |
|---|---|---|---|---|---|---|---|---|---|---|
| ma100244_rel.cz11a_c8r32 | 516129 | 923079 | 69717 | 36994 | 34905 | 30160 | 33111 | 29078 | 32160 | 28177 |
| ma100339_rel.cz11a_c8r32 | 428571 | 888891 | 76010 | 39555 | 34250 | 29240 | 32245 | 27890 | 31190 | 27168 |
| ma100433_rel.cz11a_c8r32 | 421053 | 923079 | 76831 | 39653 | 32956 | 28177 | 31303 | 27098 | 30358 | 26492 |
| ma100524_rel.cz11a_c8r32 | 436364 | 786887 | 93910 | 47761 | 33134 | 28405 | 32789 | 28085 | 32315 | 27638 |
| ma100617_rel.cz11a_c8r32 | 466019 | 774195 | 93704 | 49155 | 32866 | 28288 | 32364 | 27994 | 32060 | 27681 |
| ma101107_rel.cz11a_c8r32 | 461538 | 761906 | 92219 | 45134 | 32657 | 28016 | 32449 | 27863 | 31928 | 27489 |
| ma110401_rel.cz11b_c8r32 | 461538 | 666668 | 76509 | 43716 | 32780 | 28093 | 32263 | 27772 | 31845 | 27413 |
This table has relative throughput, throughput for the DBMS relative to the DBMS in the first line, using the absolute throughput from the previous table. Values less than 0.95 have a yellow background. Values greater than 1.05 have a blue background.
| dbms | l.i0 | l.x | l.i1 | l.i2 | qr100 | qp100 | qr500 | qp500 | qr1000 | qp1000 |
|---|---|---|---|---|---|---|---|---|---|---|
| ma100244_rel.cz11a_c8r32 | 1.00 | 1.00 | 1.00 | 1.00 | 1.00 | 1.00 | 1.00 | 1.00 | 1.00 | 1.00 |
| ma100339_rel.cz11a_c8r32 | 0.83 | 0.96 | 1.09 | 1.07 | 0.98 | 0.97 | 0.97 | 0.96 | 0.97 | 0.96 |
| ma100433_rel.cz11a_c8r32 | 0.82 | 1.00 | 1.10 | 1.07 | 0.94 | 0.93 | 0.95 | 0.93 | 0.94 | 0.94 |
| ma100524_rel.cz11a_c8r32 | 0.85 | 0.85 | 1.35 | 1.29 | 0.95 | 0.94 | 0.99 | 0.97 | 1.00 | 0.98 |
| ma100617_rel.cz11a_c8r32 | 0.90 | 0.84 | 1.34 | 1.33 | 0.94 | 0.94 | 0.98 | 0.96 | 1.00 | 0.98 |
| ma101107_rel.cz11a_c8r32 | 0.89 | 0.83 | 1.32 | 1.22 | 0.94 | 0.93 | 0.98 | 0.96 | 0.99 | 0.98 |
| ma110401_rel.cz11b_c8r32 | 0.89 | 0.72 | 1.10 | 1.18 | 0.94 | 0.93 | 0.97 | 0.96 | 0.99 | 0.97 |
This lists the average rate of inserts/s for the tests that do inserts concurrent with queries. For such tests the query rate is listed in the table above. The read+write tests are setup so that the insert rate should match the target rate every second. Cells that are not at least 95% of the target have a red background to indicate a failure to satisfy the target.
| dbms | qr100.L1 | qp100.L2 | qr500.L3 | qp500.L4 | qr1000.L5 | qp1000.L6 |
|---|---|---|---|---|---|---|
| ma100244_rel.cz11a_c8r32 | 399 | 399 | 1994 | 1994 | 3989 | 3989 |
| ma100339_rel.cz11a_c8r32 | 399 | 399 | 1994 | 1993 | 3989 | 3989 |
| ma100433_rel.cz11a_c8r32 | 399 | 399 | 1994 | 1994 | 3989 | 3989 |
| ma100524_rel.cz11a_c8r32 | 399 | 399 | 1994 | 1994 | 3989 | 3989 |
| ma100617_rel.cz11a_c8r32 | 399 | 399 | 1994 | 1993 | 3989 | 3989 |
| ma101107_rel.cz11a_c8r32 | 399 | 399 | 1994 | 1994 | 3989 | 3989 |
| ma110401_rel.cz11b_c8r32 | 399 | 399 | 1994 | 1994 | 3989 | 3989 |
| target | 400 | 400 | 2000 | 2000 | 4000 | 4000 |
l.i0
l.i0: load without secondary indexes. Graphs for performance per 1-second interval are here.
Average throughput:
Insert response time histogram: each cell has the percentage of responses that take <= the time in the header and max is the max response time in seconds. For the max column values in the top 25% of the range have a red background and in the bottom 25% of the range have a green background. The red background is not used when the min value is within 80% of the max value.
| dbms | 256us | 1ms | 4ms | 16ms | 64ms | 256ms | 1s | 4s | 16s | gt | max |
|---|---|---|---|---|---|---|---|---|---|---|---|
| ma100244_rel.cz11a_c8r32 | 97.433 | 2.227 | 0.316 | 0.008 | 0.016 | 0.127 | |||||
| ma100339_rel.cz11a_c8r32 | 86.240 | 13.360 | 0.371 | 0.012 | 0.016 | 0.136 | |||||
| ma100433_rel.cz11a_c8r32 | 86.226 | 13.386 | 0.361 | 0.011 | 0.016 | 0.129 | |||||
| ma100524_rel.cz11a_c8r32 | 94.533 | 4.818 | 0.502 | 0.125 | 0.022 | 0.176 | |||||
| ma100617_rel.cz11a_c8r32 | 92.352 | 7.293 | 0.320 | 0.019 | 0.017 | 0.184 | |||||
| ma101107_rel.cz11a_c8r32 | 90.347 | 9.297 | 0.321 | 0.018 | 0.017 | 0.203 | |||||
| ma110401_rel.cz11b_c8r32 | 90.299 | 9.361 | 0.305 | 0.018 | 0.018 | 0.196 |
Performance metrics for the DBMS listed above. Some are normalized by throughput, others are not. Legend for results is here.
ips	qps	rps	rmbps	wps	wmbps	rpq	rkbpq	wpi	wkbpi	csps	cpups	cspq	cpupq	dbgb1	dbgb2	rss	maxop	p50	p99	tag
516129	0	1	0.0	2542.1	164.2	0.000	0.000	0.005	0.326	49301	71.3	0.096	11	3.2	34.0	4.1	0.127	151537	130760	ma100244_rel.cz11a_c8r32
428571	0	1	0.0	2288.0	148.0	0.000	0.000	0.005	0.354	56300	76.2	0.131	14	3.2	34.0	3.5	0.136	119867	87769	ma100339_rel.cz11a_c8r32
421053	0	1	0.0	2208.7	145.0	0.000	0.000	0.005	0.353	56505	76.5	0.134	15	3.2	34.0	NA	0.129	119273	100393	ma100433_rel.cz11a_c8r32
436364	0	0	0.0	3033.6	129.9	0.000	0.000	0.007	0.305	95101	71.0	0.218	13	3.2	34.0	3.4	0.176	124265	105585	ma100524_rel.cz11a_c8r32
466019	0	0	0.0	1701.9	111.1	0.000	0.000	0.004	0.244	60824	74.7	0.131	13	3.2	34.0	3.3	0.184	133058	105415	ma100617_rel.cz11a_c8r32
461538	0	0	0.0	1817.1	116.1	0.000	0.000	0.004	0.258	51490	73.5	0.112	13	3.2	34.0	3.3	0.203	132160	111481	ma101107_rel.cz11a_c8r32
461538	0	0	0.0	1811.9	115.9	0.000	0.000	0.004	0.257	53668	73.8	0.116	13	3.2	34.0	3.3	0.196	131553	99694	ma110401_rel.cz11b_c8r32
l.x
l.x: create secondary indexes.
Average throughput:
Performance metrics for the DBMS listed above. Some are normalized by throughput, others are not. Legend for results is here.
ips	qps	rps	rmbps	wps	wmbps	rpq	rkbpq	wpi	wkbpi	csps	cpups	cspq	cpupq	dbgb1	dbgb2	rss	maxop	p50	p99	tag
923079	0	0	0.0	8897.2	746.3	0.000	0.000	0.010	0.828	35642	45.1	0.039	4	7.3	38.1	5.3	0.001	NA	NA	ma100244_rel.cz11a_c8r32
888891	0	0	0.0	8333.0	718.1	0.000	0.000	0.009	0.827	29646	44.9	0.033	4	7.3	38.1	5.1	0.001	NA	NA	ma100339_rel.cz11a_c8r32
923079	0	0	0.0	8319.4	724.0	0.000	0.000	0.009	0.803	30976	45.5	0.034	4	7.2	38.0	NA	0.001	NA	NA	ma100433_rel.cz11a_c8r32
786887	0	0	0.0	4376.6	541.2	0.000	0.000	0.006	0.704	818	44.4	0.001	5	7.2	38.0	7.5	0.002	NA	NA	ma100524_rel.cz11a_c8r32
774195	0	0	0.0	6954.9	578.9	0.000	0.000	0.009	0.766	12407	45.3	0.016	5	7.2	38.0	7.1	0.001	NA	NA	ma100617_rel.cz11a_c8r32
761906	0	0	0.0	6675.2	568.1	0.000	0.000	0.009	0.763	11343	45.2	0.015	5	7.2	38.0	6.9	0.001	NA	NA	ma101107_rel.cz11a_c8r32
666668	0	0	0.0	6068.1	498.4	0.000	0.000	0.009	0.765	11238	42.3	0.017	5	7.2	38.0	6.2	2.582	NA	NA	ma110401_rel.cz11b_c8r32
l.i1
l.i1: continue load after secondary indexes created with 50 inserts per transaction. Graphs for performance per 1-second interval are here.
Average throughput:
Insert response time histogram: each cell has the percentage of responses that take <= the time in the header and max is the max response time in seconds. For the max column values in the top 25% of the range have a red background and in the bottom 25% of the range have a green background. The red background is not used when the min value is within 80% of the max value.
| dbms | 256us | 1ms | 4ms | 16ms | 64ms | 256ms | 1s | 4s | 16s | gt | max |
|---|---|---|---|---|---|---|---|---|---|---|---|
| ma100244_rel.cz11a_c8r32 | 0.032 | 84.507 | 14.926 | 0.523 | 0.012 | 0.177 | |||||
| ma100339_rel.cz11a_c8r32 | 0.068 | 87.488 | 11.964 | 0.468 | 0.013 | 0.150 | |||||
| ma100433_rel.cz11a_c8r32 | 0.042 | 87.489 | 12.020 | 0.436 | 0.013 | 0.159 | |||||
| ma100524_rel.cz11a_c8r32 | 0.096 | 96.297 | 3.517 | 0.061 | 0.017 | 0.011 | nonzero | 1.036 | |||
| ma100617_rel.cz11a_c8r32 | 0.739 | 95.450 | 3.686 | 0.108 | 0.016 | nonzero | 0.420 | ||||
| ma101107_rel.cz11a_c8r32 | 0.622 | 94.637 | 4.629 | 0.096 | 0.015 | nonzero | 0.266 | ||||
| ma110401_rel.cz11b_c8r32 | 3.075 | 87.926 | 7.640 | 1.328 | 0.029 | 0.002 | 0.714 |
Delete response time histogram: each cell has the percentage of responses that take <= the time in the header and max is the max response time in seconds. For the max column values in the top 25% of the range have a red background and in the bottom 25% of the range have a green background. The red background is not used when the min value is within 80% of the max value.
| dbms | 256us | 1ms | 4ms | 16ms | 64ms | 256ms | 1s | 4s | 16s | gt | max |
|---|---|---|---|---|---|---|---|---|---|---|---|
| ma100244_rel.cz11a_c8r32 | 7.247 | 78.098 | 14.233 | 0.410 | 0.012 | 0.159 | |||||
| ma100339_rel.cz11a_c8r32 | 21.120 | 67.045 | 11.485 | 0.338 | 0.011 | 0.144 | |||||
| ma100433_rel.cz11a_c8r32 | 20.700 | 67.406 | 11.559 | 0.323 | 0.012 | 0.153 | |||||
| ma100524_rel.cz11a_c8r32 | 20.726 | 76.520 | 2.682 | 0.046 | 0.019 | 0.007 | nonzero | 1.036 | |||
| ma100617_rel.cz11a_c8r32 | 17.661 | 79.410 | 2.828 | 0.088 | 0.013 | nonzero | 0.422 | ||||
| ma101107_rel.cz11a_c8r32 | 16.692 | 79.130 | 4.083 | 0.081 | 0.013 | 0.208 | |||||
| ma110401_rel.cz11b_c8r32 | 22.684 | 69.498 | 6.697 | 1.095 | 0.025 | 0.001 | 0.681 |
Performance metrics for the DBMS listed above. Some are normalized by throughput, others are not. Legend for results is here.
ips	qps	rps	rmbps	wps	wmbps	rpq	rkbpq	wpi	wkbpi	csps	cpups	cspq	cpupq	dbgb1	dbgb2	rss	maxop	p50	p99	tag
69717	0	0	0.0	8545.6	310.5	0.000	0.000	0.123	4.561	41904	80.8	0.601	93	10.7	41.5	11.9	0.177	17381	10039	ma100244_rel.cz11a_c8r32
76010	0	0	0.0	7992.9	301.6	0.000	0.000	0.105	4.064	43609	80.1	0.574	84	10.9	41.8	12.2	0.150	19129	8890	ma100339_rel.cz11a_c8r32
76831	0	0	0.0	8137.7	303.4	0.000	0.000	0.106	4.044	44861	80.3	0.584	84	11.0	41.9	NA	0.159	19080	10953	ma100433_rel.cz11a_c8r32
93910	0	0	0.0	7899.0	286.4	0.000	0.000	0.084	3.123	71667	88.5	0.763	75	10.8	43.1	12.2	1.036	24474	1398	ma100524_rel.cz11a_c8r32
93704	0	0	0.0	9676.9	338.4	0.000	0.000	0.103	3.699	132762	85.2	1.417	73	10.0	40.9	10.2	0.420	24067	11837	ma100617_rel.cz11a_c8r32
92219	0	3797	14.8	9695.1	339.7	0.041	0.165	0.105	3.772	123979	83.2	1.344	72	10.0	40.8	10.1	0.266	23725	12041	ma101107_rel.cz11a_c8r32
76509	0	2911	11.4	8556.0	289.4	0.038	0.152	0.112	3.874	109946	67.3	1.437	70	10.1	41.0	10.1	0.714	19829	7842	ma110401_rel.cz11b_c8r32
l.i2
l.i2: continue load after secondary indexes created with 5 inserts per transaction. Graphs for performance per 1-second interval are here.
Average throughput:
Insert response time histogram: each cell has the percentage of responses that take <= the time in the header and max is the max response time in seconds. For the max column values in the top 25% of the range have a red background and in the bottom 25% of the range have a green background. The red background is not used when the min value is within 80% of the max value.
| dbms | 256us | 1ms | 4ms | 16ms | 64ms | 256ms | 1s | 4s | 16s | gt | max |
|---|---|---|---|---|---|---|---|---|---|---|---|
| ma100244_rel.cz11a_c8r32 | 23.158 | 72.144 | 3.523 | 1.170 | 0.003 | 0.002 | 0.135 | ||||
| ma100339_rel.cz11a_c8r32 | 26.328 | 69.413 | 3.358 | 0.895 | 0.005 | 0.002 | 0.139 | ||||
| ma100433_rel.cz11a_c8r32 | 25.457 | 70.415 | 3.263 | 0.861 | 0.003 | 0.002 | 0.134 | ||||
| ma100524_rel.cz11a_c8r32 | 25.209 | 72.854 | 1.849 | 0.085 | 0.002 | 0.002 | 0.144 | ||||
| ma100617_rel.cz11a_c8r32 | 31.943 | 64.924 | 3.011 | 0.119 | 0.002 | 0.002 | 0.138 | ||||
| ma101107_rel.cz11a_c8r32 | 17.259 | 79.386 | 3.254 | 0.098 | 0.001 | 0.002 | 0.139 | ||||
| ma110401_rel.cz11b_c8r32 | 21.896 | 74.945 | 2.801 | 0.326 | 0.030 | 0.002 | 0.143 |
Delete response time histogram: each cell has the percentage of responses that take <= the time in the header and max is the max response time in seconds. For the max column values in the top 25% of the range have a red background and in the bottom 25% of the range have a green background. The red background is not used when the min value is within 80% of the max value.
| dbms | 256us | 1ms | 4ms | 16ms | 64ms | 256ms | 1s | 4s | 16s | gt | max |
|---|---|---|---|---|---|---|---|---|---|---|---|
| ma100244_rel.cz11a_c8r32 | 24.374 | 71.122 | 3.339 | 1.160 | 0.003 | 0.002 | 0.135 | ||||
| ma100339_rel.cz11a_c8r32 | 28.297 | 67.431 | 3.376 | 0.890 | 0.004 | 0.002 | 0.141 | ||||
| ma100433_rel.cz11a_c8r32 | 27.613 | 68.268 | 3.259 | 0.855 | 0.003 | 0.002 | 0.134 | ||||
| ma100524_rel.cz11a_c8r32 | 27.518 | 70.612 | 1.789 | 0.077 | 0.002 | 0.002 | 0.144 | ||||
| ma100617_rel.cz11a_c8r32 | 33.983 | 62.663 | 3.230 | 0.122 | 0.002 | 0.002 | 0.139 | ||||
| ma101107_rel.cz11a_c8r32 | 22.189 | 74.286 | 3.419 | 0.104 | 0.001 | 0.002 | 0.138 | ||||
| ma110401_rel.cz11b_c8r32 | 25.235 | 71.560 | 2.873 | 0.303 | 0.026 | 0.002 | 0.144 |
Performance metrics for the DBMS listed above. Some are normalized by throughput, others are not. Legend for results is here.
ips	qps	rps	rmbps	wps	wmbps	rpq	rkbpq	wpi	wkbpi	csps	cpups	cspq	cpupq	dbgb1	dbgb2	rss	maxop	p50	p99	tag
36994	0	0	0.0	6797.9	226.5	0.000	0.000	0.184	6.271	118806	81.1	3.211	175	10.7	41.5	11.9	0.135	9323	7382	ma100244_rel.cz11a_c8r32
39555	0	0	0.0	5708.9	200.5	0.000	0.000	0.144	5.190	123364	82.3	3.119	166	10.9	41.8	12.2	0.139	9864	8266	ma100339_rel.cz11a_c8r32
39653	0	0	0.0	5628.0	196.9	0.000	0.000	0.142	5.086	125547	82.7	3.166	167	11.0	41.9	NA	0.134	9954	8358	ma100433_rel.cz11a_c8r32
47761	0	0	0.0	10476.7	324.4	0.000	0.000	0.219	6.954	182758	89.0	3.827	149	10.8	43.1	12.2	0.144	11952	10374	ma100524_rel.cz11a_c8r32
49155	0	0	0.0	5044.6	177.0	0.000	0.000	0.103	3.687	169250	87.7	3.443	143	10.0	40.9	10.1	0.138	12342	10708	ma100617_rel.cz11a_c8r32
45134	0	5903	23.1	4807.8	168.7	0.131	0.523	0.107	3.828	178328	83.5	3.951	148	10.0	40.8	10.1	0.139	11313	9964	ma101107_rel.cz11a_c8r32
43716	0	5646	22.1	4743.0	162.1	0.129	0.517	0.108	3.797	175773	80.5	4.021	147	10.1	41.0	10.1	0.143	11183	8259	ma110401_rel.cz11b_c8r32
qr100.L1
qr100.L1: range queries with 100 insert/s per client. Graphs for performance per 1-second interval are here.
Average throughput:
Query response time histogram: each cell has the percentage of responses that take <= the time in the header and max is the max response time in seconds. For max values in the top 25% of the range have a red background and in the bottom 25% of the range have a green background. The red background is not used when the min value is within 80% of the max value.
| dbms | 256us | 1ms | 4ms | 16ms | 64ms | 256ms | 1s | 4s | 16s | gt | max |
|---|---|---|---|---|---|---|---|---|---|---|---|
| ma100244_rel.cz11a_c8r32 | 99.947 | 0.050 | 0.003 | nonzero | nonzero | 0.020 | |||||
| ma100339_rel.cz11a_c8r32 | 99.955 | 0.043 | 0.002 | nonzero | nonzero | 0.025 | |||||
| ma100433_rel.cz11a_c8r32 | 99.941 | 0.056 | 0.003 | nonzero | nonzero | 0.020 | |||||
| ma100524_rel.cz11a_c8r32 | 99.993 | 0.007 | nonzero | 0.003 | |||||||
| ma100617_rel.cz11a_c8r32 | 99.993 | 0.007 | nonzero | nonzero | 0.011 | ||||||
| ma101107_rel.cz11a_c8r32 | 99.990 | 0.009 | 0.001 | nonzero | 0.005 | ||||||
| ma110401_rel.cz11b_c8r32 | 99.991 | 0.008 | 0.001 | nonzero | 0.008 |
Insert response time histogram: each cell has the percentage of responses that take <= the time in the header and max is the max response time in seconds. For max values in the top 25% of the range have a red background and in the bottom 25% of the range have a green background. The red background is not used when the min value is within 80% of the max value.
| dbms | 256us | 1ms | 4ms | 16ms | 64ms | 256ms | 1s | 4s | 16s | gt | max |
|---|---|---|---|---|---|---|---|---|---|---|---|
| ma100244_rel.cz11a_c8r32 | 1.660 | 95.438 | 2.701 | 0.201 | 0.036 | ||||||
| ma100339_rel.cz11a_c8r32 | 1.118 | 95.903 | 2.799 | 0.181 | 0.030 | ||||||
| ma100433_rel.cz11a_c8r32 | 0.674 | 96.160 | 2.965 | 0.201 | 0.036 | ||||||
| ma100524_rel.cz11a_c8r32 | 7.028 | 92.965 | 0.007 | 0.004 | |||||||
| ma100617_rel.cz11a_c8r32 | 20.465 | 79.521 | 0.014 | 0.007 | |||||||
| ma101107_rel.cz11a_c8r32 | 1.083 | 62.111 | 36.806 | 0.012 | |||||||
| ma110401_rel.cz11b_c8r32 | 2.611 | 55.528 | 41.861 | 0.012 |
Delete response time histogram: each cell has the percentage of responses that take <= the time in the header and max is the max response time in seconds. For max values in the top 25% of the range have a red background and in the bottom 25% of the range have a green background. The red background is not used when the min value is within 80% of the max value.
| dbms | 256us | 1ms | 4ms | 16ms | 64ms | 256ms | 1s | 4s | 16s | gt | max |
|---|---|---|---|---|---|---|---|---|---|---|---|
| ma100244_rel.cz11a_c8r32 | 60.639 | 36.722 | 2.562 | 0.076 | 0.031 | ||||||
| ma100339_rel.cz11a_c8r32 | 76.694 | 20.771 | 2.424 | 0.111 | 0.023 | ||||||
| ma100433_rel.cz11a_c8r32 | 74.931 | 22.438 | 2.528 | 0.104 | 0.023 | ||||||
| ma100524_rel.cz11a_c8r32 | 96.069 | 3.931 | 0.004 | ||||||||
| ma100617_rel.cz11a_c8r32 | 72.722 | 27.271 | 0.007 | 0.008 | |||||||
| ma101107_rel.cz11a_c8r32 | 12.340 | 49.562 | 38.097 | 0.012 | |||||||
| ma110401_rel.cz11b_c8r32 | 12.424 | 45.729 | 41.847 | 0.011 |
Performance metrics for the DBMS listed above. Some are normalized by throughput, others are not. Legend for results is here.
ips	qps	rps	rmbps	wps	wmbps	rpq	rkbpq	wpi	wkbpi	csps	cpups	cspq	cpupq	dbgb1	dbgb2	rss	maxop	p50	p99	tag
399	34905	0	0.0	3315.9	92.3	0.000	0.000	8.315	237.015	143650	53.1	4.115	122	10.7	41.5	12.0	0.020	8743	8647	ma100244_rel.cz11a_c8r32
399	34250	0	0.0	3325.7	92.6	0.000	0.000	8.339	237.734	140545	53.1	4.103	124	10.9	41.8	12.2	0.025	8612	8503	ma100339_rel.cz11a_c8r32
399	32956	0	0.0	3316.4	92.3	0.000	0.000	8.316	237.059	137112	53.0	4.160	129	11.0	41.9	NA	0.020	8247	8139	ma100433_rel.cz11a_c8r32
399	33134	0	0.0	4.9	0.4	0.000	0.000	0.012	1.081	127402	52.2	3.845	126	10.8	43.1	12.2	0.003	8279	8199	ma100524_rel.cz11a_c8r32
399	32866	0	0.0	17.4	0.8	0.000	0.000	0.044	1.981	125542	52.1	3.820	127	10.0	40.9	10.1	0.011	8199	8119	ma100617_rel.cz11a_c8r32
399	32657	8	0.0	11.3	0.6	0.000	0.001	0.028	1.571	124766	52.2	3.821	128	10.0	40.8	10.0	0.005	8103	8023	ma101107_rel.cz11a_c8r32
399	32780	8	0.0	18.0	0.8	0.000	0.001	0.045	2.018	125270	52.2	3.822	127	10.1	41.0	10.1	0.008	8167	8103	ma110401_rel.cz11b_c8r32
qp100.L2
qp100.L2: point queries with 100 insert/s per client. Graphs for performance per 1-second interval are here.
Average throughput:
Query response time histogram: each cell has the percentage of responses that take <= the time in the header and max is the max response time in seconds. For max values in the top 25% of the range have a red background and in the bottom 25% of the range have a green background. The red background is not used when the min value is within 80% of the max value.
| dbms | 256us | 1ms | 4ms | 16ms | 64ms | 256ms | 1s | 4s | 16s | gt | max |
|---|---|---|---|---|---|---|---|---|---|---|---|
| ma100244_rel.cz11a_c8r32 | 99.973 | 0.026 | 0.001 | nonzero | 0.013 | ||||||
| ma100339_rel.cz11a_c8r32 | 99.960 | 0.039 | 0.001 | nonzero | nonzero | 0.016 | |||||
| ma100433_rel.cz11a_c8r32 | 99.943 | 0.056 | 0.001 | nonzero | nonzero | 0.020 | |||||
| ma100524_rel.cz11a_c8r32 | 99.957 | 0.042 | 0.001 | 0.003 | |||||||
| ma100617_rel.cz11a_c8r32 | 99.927 | 0.073 | 0.001 | 0.002 | |||||||
| ma101107_rel.cz11a_c8r32 | 99.914 | 0.082 | 0.004 | 0.004 | |||||||
| ma110401_rel.cz11b_c8r32 | 99.922 | 0.075 | 0.002 | 0.002 |
Insert response time histogram: each cell has the percentage of responses that take <= the time in the header and max is the max response time in seconds. For max values in the top 25% of the range have a red background and in the bottom 25% of the range have a green background. The red background is not used when the min value is within 80% of the max value.
| dbms | 256us | 1ms | 4ms | 16ms | 64ms | 256ms | 1s | 4s | 16s | gt | max |
|---|---|---|---|---|---|---|---|---|---|---|---|
| ma100244_rel.cz11a_c8r32 | 0.326 | 96.646 | 2.812 | 0.215 | 0.027 | ||||||
| ma100339_rel.cz11a_c8r32 | 0.389 | 96.486 | 2.931 | 0.194 | 0.030 | ||||||
| ma100433_rel.cz11a_c8r32 | 0.042 | 97.167 | 2.611 | 0.181 | 0.029 | ||||||
| ma100524_rel.cz11a_c8r32 | 0.222 | 99.778 | 0.003 | ||||||||
| ma100617_rel.cz11a_c8r32 | 7.694 | 92.292 | 0.014 | 0.010 | |||||||
| ma101107_rel.cz11a_c8r32 | 0.062 | 53.299 | 46.639 | 0.012 | |||||||
| ma110401_rel.cz11b_c8r32 | 3.097 | 61.785 | 35.118 | 0.011 |
Delete response time histogram: each cell has the percentage of responses that take <= the time in the header and max is the max response time in seconds. For max values in the top 25% of the range have a red background and in the bottom 25% of the range have a green background. The red background is not used when the min value is within 80% of the max value.
| dbms | 256us | 1ms | 4ms | 16ms | 64ms | 256ms | 1s | 4s | 16s | gt | max |
|---|---|---|---|---|---|---|---|---|---|---|---|
| ma100244_rel.cz11a_c8r32 | 38.785 | 58.549 | 2.528 | 0.139 | 0.026 | ||||||
| ma100339_rel.cz11a_c8r32 | 69.354 | 27.896 | 2.694 | 0.056 | 0.029 | ||||||
| ma100433_rel.cz11a_c8r32 | 60.410 | 37.201 | 2.312 | 0.076 | 0.029 | ||||||
| ma100524_rel.cz11a_c8r32 | 64.208 | 35.792 | 0.003 | ||||||||
| ma100617_rel.cz11a_c8r32 | 63.236 | 36.764 | 0.003 | ||||||||
| ma101107_rel.cz11a_c8r32 | 3.583 | 49.792 | 46.625 | 0.012 | |||||||
| ma110401_rel.cz11b_c8r32 | 10.000 | 54.889 | 35.111 | 0.011 |
Performance metrics for the DBMS listed above. Some are normalized by throughput, others are not. Legend for results is here.
ips	qps	rps	rmbps	wps	wmbps	rpq	rkbpq	wpi	wkbpi	csps	cpups	cspq	cpupq	dbgb1	dbgb2	rss	maxop	p50	p99	tag
399	30160	0	0.0	3304.6	92.0	0.000	0.000	8.286	236.212	129969	53.0	4.309	141	10.7	41.5	12.0	0.013	7544	7480	ma100244_rel.cz11a_c8r32
399	29240	0	0.0	3301.4	91.9	0.000	0.000	8.278	236.005	126138	52.7	4.314	144	10.9	41.8	12.3	0.016	7320	7256	ma100339_rel.cz11a_c8r32
399	28177	0	0.0	3303.2	92.0	0.000	0.000	8.283	236.126	123019	52.8	4.366	150	11.0	41.9	NA	0.020	7067	6987	ma100433_rel.cz11a_c8r32
399	28405	0	0.0	4.9	0.4	0.000	0.000	0.012	1.082	114015	52.1	4.014	147	10.8	43.1	12.2	0.003	7128	7064	ma100524_rel.cz11a_c8r32
399	28288	0	0.0	23.7	0.9	0.000	0.000	0.059	2.421	112798	52.0	3.988	147	10.0	40.9	10.1	0.002	7080	7003	ma100617_rel.cz11a_c8r32
399	28016	8	0.0	23.7	0.9	0.000	0.001	0.060	2.437	111714	51.9	3.988	148	10.0	40.8	10.0	0.004	7000	6937	ma101107_rel.cz11a_c8r32
399	28093	10	0.0	24.3	0.9	0.000	0.001	0.061	2.439	112059	51.9	3.989	148	10.1	41.0	10.1	0.002	7019	6954	ma110401_rel.cz11b_c8r32
qr500.L3
qr500.L3: range queries with 500 insert/s per client. Graphs for performance per 1-second interval are here.
Average throughput:
Query response time histogram: each cell has the percentage of responses that take <= the time in the header and max is the max response time in seconds. For max values in the top 25% of the range have a red background and in the bottom 25% of the range have a green background. The red background is not used when the min value is within 80% of the max value.
| dbms | 256us | 1ms | 4ms | 16ms | 64ms | 256ms | 1s | 4s | 16s | gt | max |
|---|---|---|---|---|---|---|---|---|---|---|---|
| ma100244_rel.cz11a_c8r32 | 99.737 | 0.230 | 0.031 | 0.003 | nonzero | 0.030 | |||||
| ma100339_rel.cz11a_c8r32 | 99.660 | 0.301 | 0.037 | 0.002 | nonzero | 0.029 | |||||
| ma100433_rel.cz11a_c8r32 | 99.649 | 0.307 | 0.041 | 0.003 | nonzero | 0.036 | |||||
| ma100524_rel.cz11a_c8r32 | 99.973 | 0.021 | 0.006 | nonzero | 0.015 | ||||||
| ma100617_rel.cz11a_c8r32 | 99.959 | 0.036 | 0.005 | nonzero | 0.015 | ||||||
| ma101107_rel.cz11a_c8r32 | 99.938 | 0.047 | 0.015 | nonzero | 0.014 | ||||||
| ma110401_rel.cz11b_c8r32 | 99.940 | 0.046 | 0.013 | nonzero | 0.015 |
Insert response time histogram: each cell has the percentage of responses that take <= the time in the header and max is the max response time in seconds. For max values in the top 25% of the range have a red background and in the bottom 25% of the range have a green background. The red background is not used when the min value is within 80% of the max value.
| dbms | 256us | 1ms | 4ms | 16ms | 64ms | 256ms | 1s | 4s | 16s | gt | max |
|---|---|---|---|---|---|---|---|---|---|---|---|
| ma100244_rel.cz11a_c8r32 | 6.132 | 83.535 | 9.750 | 0.583 | 0.043 | ||||||
| ma100339_rel.cz11a_c8r32 | 5.324 | 84.001 | 10.043 | 0.632 | 0.063 | ||||||
| ma100433_rel.cz11a_c8r32 | 5.281 | 83.867 | 10.274 | 0.579 | 0.050 | ||||||
| ma100524_rel.cz11a_c8r32 | 13.321 | 85.362 | 1.307 | 0.010 | 0.035 | ||||||
| ma100617_rel.cz11a_c8r32 | 27.133 | 71.772 | 1.083 | 0.011 | 0.039 | ||||||
| ma101107_rel.cz11a_c8r32 | 1.479 | 88.206 | 10.303 | 0.013 | 0.030 | ||||||
| ma110401_rel.cz11b_c8r32 | 4.203 | 88.297 | 7.487 | 0.013 | 0.032 |
Delete response time histogram: each cell has the percentage of responses that take <= the time in the header and max is the max response time in seconds. For max values in the top 25% of the range have a red background and in the bottom 25% of the range have a green background. The red background is not used when the min value is within 80% of the max value.
| dbms | 256us | 1ms | 4ms | 16ms | 64ms | 256ms | 1s | 4s | 16s | gt | max |
|---|---|---|---|---|---|---|---|---|---|---|---|
| ma100244_rel.cz11a_c8r32 | 45.751 | 45.649 | 8.132 | 0.468 | 0.045 | ||||||
| ma100339_rel.cz11a_c8r32 | 61.433 | 29.704 | 8.358 | 0.504 | 0.049 | ||||||
| ma100433_rel.cz11a_c8r32 | 62.518 | 28.421 | 8.646 | 0.415 | 0.049 | ||||||
| ma100524_rel.cz11a_c8r32 | 82.583 | 16.483 | 0.922 | 0.011 | 0.035 | ||||||
| ma100617_rel.cz11a_c8r32 | 70.254 | 28.882 | 0.856 | 0.008 | 0.037 | ||||||
| ma101107_rel.cz11a_c8r32 | 18.286 | 72.489 | 9.213 | 0.013 | 0.034 | ||||||
| ma110401_rel.cz11b_c8r32 | 17.947 | 75.671 | 6.371 | 0.011 | 0.033 |
Performance metrics for the DBMS listed above. Some are normalized by throughput, others are not. Legend for results is here.
ips	qps	rps	rmbps	wps	wmbps	rpq	rkbpq	wpi	wkbpi	csps	cpups	cspq	cpupq	dbgb1	dbgb2	rss	maxop	p50	p99	tag
1994	33111	0	0.0	11934.1	333.0	0.000	0.000	5.984	170.999	160673	56.8	4.853	137	10.7	41.5	12.0	0.030	8250	8087	ma100244_rel.cz11a_c8r32
1994	32245	0	0.0	11840.2	330.5	0.000	0.000	5.937	169.677	156369	56.8	4.849	141	10.9	41.8	12.3	0.029	8039	7816	ma100339_rel.cz11a_c8r32
1994	31303	0	0.0	11922.0	332.7	0.000	0.000	5.978	170.841	157434	56.4	5.029	144	11.0	41.9	NA	0.036	7752	7576	ma100433_rel.cz11a_c8r32
1994	32789	0	0.0	18.9	2.1	0.000	0.000	0.009	1.075	125757	53.4	3.835	130	10.8	43.1	12.2	0.015	8169	8106	ma100524_rel.cz11a_c8r32
1994	32364	0	0.0	163.0	5.9	0.000	0.000	0.082	3.019	123944	53.3	3.830	132	10.0	40.9	10.1	0.015	8074	7895	ma100617_rel.cz11a_c8r32
1994	32449	57	0.2	165.0	6.0	0.002	0.007	0.083	3.062	124428	53.3	3.835	131	10.0	40.8	10.0	0.014	8135	7928	ma101107_rel.cz11a_c8r32
1994	32263	59	0.2	167.5	5.9	0.002	0.007	0.084	3.043	123788	53.3	3.837	132	10.1	41.0	10.1	0.015	8074	7816	ma110401_rel.cz11b_c8r32
qp500.L4
qp500.L4: point queries with 500 insert/s per client. Graphs for performance per 1-second interval are here.
Average throughput:
Query response time histogram: each cell has the percentage of responses that take <= the time in the header and max is the max response time in seconds. For max values in the top 25% of the range have a red background and in the bottom 25% of the range have a green background. The red background is not used when the min value is within 80% of the max value.
| dbms | 256us | 1ms | 4ms | 16ms | 64ms | 256ms | 1s | 4s | 16s | gt | max |
|---|---|---|---|---|---|---|---|---|---|---|---|
| ma100244_rel.cz11a_c8r32 | 99.834 | 0.146 | 0.019 | 0.001 | nonzero | 0.020 | |||||
| ma100339_rel.cz11a_c8r32 | 99.824 | 0.153 | 0.021 | 0.002 | nonzero | 0.035 | |||||
| ma100433_rel.cz11a_c8r32 | 99.771 | 0.206 | 0.022 | 0.001 | nonzero | 0.027 | |||||
| ma100524_rel.cz11a_c8r32 | 99.934 | 0.058 | 0.008 | nonzero | 0.015 | ||||||
| ma100617_rel.cz11a_c8r32 | 99.851 | 0.141 | 0.008 | nonzero | 0.011 | ||||||
| ma101107_rel.cz11a_c8r32 | 99.868 | 0.122 | 0.010 | nonzero | 0.014 | ||||||
| ma110401_rel.cz11b_c8r32 | 99.885 | 0.107 | 0.008 | nonzero | nonzero | 0.017 |
Insert response time histogram: each cell has the percentage of responses that take <= the time in the header and max is the max response time in seconds. For max values in the top 25% of the range have a red background and in the bottom 25% of the range have a green background. The red background is not used when the min value is within 80% of the max value.
| dbms | 256us | 1ms | 4ms | 16ms | 64ms | 256ms | 1s | 4s | 16s | gt | max |
|---|---|---|---|---|---|---|---|---|---|---|---|
| ma100244_rel.cz11a_c8r32 | 6.776 | 83.300 | 9.228 | 0.694 | 0.001 | 0.068 | |||||
| ma100339_rel.cz11a_c8r32 | 4.994 | 83.793 | 10.426 | 0.785 | 0.001 | 0.067 | |||||
| ma100433_rel.cz11a_c8r32 | 5.260 | 84.332 | 9.715 | 0.693 | 0.053 | ||||||
| ma100524_rel.cz11a_c8r32 | 7.958 | 90.656 | 1.376 | 0.010 | 0.038 | ||||||
| ma100617_rel.cz11a_c8r32 | 18.147 | 80.897 | 0.944 | 0.011 | 0.036 | ||||||
| ma101107_rel.cz11a_c8r32 | 8.876 | 83.806 | 7.308 | 0.010 | 0.037 | ||||||
| ma110401_rel.cz11b_c8r32 | 13.196 | 81.103 | 5.688 | 0.014 | 0.031 |
Delete response time histogram: each cell has the percentage of responses that take <= the time in the header and max is the max response time in seconds. For max values in the top 25% of the range have a red background and in the bottom 25% of the range have a green background. The red background is not used when the min value is within 80% of the max value.
| dbms | 256us | 1ms | 4ms | 16ms | 64ms | 256ms | 1s | 4s | 16s | gt | max |
|---|---|---|---|---|---|---|---|---|---|---|---|
| ma100244_rel.cz11a_c8r32 | 46.718 | 44.838 | 7.935 | 0.510 | 0.048 | ||||||
| ma100339_rel.cz11a_c8r32 | 58.651 | 32.474 | 8.292 | 0.583 | 0.045 | ||||||
| ma100433_rel.cz11a_c8r32 | 61.406 | 30.175 | 7.919 | 0.500 | 0.049 | ||||||
| ma100524_rel.cz11a_c8r32 | 74.732 | 24.403 | 0.860 | 0.006 | 0.035 | ||||||
| ma100617_rel.cz11a_c8r32 | 67.419 | 31.840 | 0.731 | 0.010 | 0.036 | ||||||
| ma101107_rel.cz11a_c8r32 | 41.258 | 51.547 | 7.185 | 0.010 | 0.036 | ||||||
| ma110401_rel.cz11b_c8r32 | 37.340 | 56.994 | 5.651 | 0.014 | 0.031 |
Performance metrics for the DBMS listed above. Some are normalized by throughput, others are not. Legend for results is here.
ips	qps	rps	rmbps	wps	wmbps	rpq	rkbpq	wpi	wkbpi	csps	cpups	cspq	cpupq	dbgb1	dbgb2	rss	maxop	p50	p99	tag
1994	29078	0	0.0	12016.4	335.3	0.000	0.000	6.025	172.173	150152	56.9	5.164	157	10.7	41.5	12.0	0.020	7272	7160	ma100244_rel.cz11a_c8r32
1993	27890	0	0.0	12037.9	336.0	0.000	0.000	6.039	172.594	145045	56.8	5.201	163	10.9	41.8	12.3	0.035	6968	6857	ma100339_rel.cz11a_c8r32
1994	27098	0	0.0	12037.3	335.9	0.000	0.000	6.036	172.482	146397	56.6	5.402	167	11.0	41.9	NA	0.027	6763	6649	ma100433_rel.cz11a_c8r32
1994	28085	0	0.0	19.0	2.1	0.000	0.000	0.010	1.075	112419	53.2	4.003	152	10.8	43.1	12.2	0.015	7048	6984	ma100524_rel.cz11a_c8r32
1993	27994	0	0.0	163.5	5.9	0.000	0.000	0.082	3.031	112203	53.1	4.008	152	10.0	40.9	10.1	0.011	7016	6920	ma100617_rel.cz11a_c8r32
1994	27863	69	0.3	164.9	6.0	0.002	0.010	0.083	3.059	111838	53.2	4.014	153	10.0	40.8	10.1	0.014	6968	6856	ma101107_rel.cz11a_c8r32
1994	27772	69	0.3	170.0	6.0	0.002	0.010	0.085	3.055	111605	53.1	4.019	153	10.1	41.0	10.1	0.017	6937	6811	ma110401_rel.cz11b_c8r32
qr1000.L5
qr1000.L5: range queries with 1000 insert/s per client. Graphs for performance per 1-second interval are here.
Average throughput:
Query response time histogram: each cell has the percentage of responses that take <= the time in the header and max is the max response time in seconds. For max values in the top 25% of the range have a red background and in the bottom 25% of the range have a green background. The red background is not used when the min value is within 80% of the max value.
| dbms | 256us | 1ms | 4ms | 16ms | 64ms | 256ms | 1s | 4s | 16s | gt | max |
|---|---|---|---|---|---|---|---|---|---|---|---|
| ma100244_rel.cz11a_c8r32 | 99.341 | 0.563 | 0.088 | 0.008 | nonzero | 0.032 | |||||
| ma100339_rel.cz11a_c8r32 | 99.217 | 0.692 | 0.084 | 0.006 | nonzero | 0.029 | |||||
| ma100433_rel.cz11a_c8r32 | 99.291 | 0.602 | 0.098 | 0.009 | nonzero | 0.032 | |||||
| ma100524_rel.cz11a_c8r32 | 99.910 | 0.071 | 0.018 | 0.001 | nonzero | 0.024 | |||||
| ma100617_rel.cz11a_c8r32 | 99.915 | 0.073 | 0.012 | 0.001 | nonzero | 0.018 | |||||
| ma101107_rel.cz11a_c8r32 | 99.924 | 0.065 | 0.010 | 0.001 | 0.015 | ||||||
| ma110401_rel.cz11b_c8r32 | 99.911 | 0.074 | 0.014 | 0.001 | nonzero | 0.020 |
Insert response time histogram: each cell has the percentage of responses that take <= the time in the header and max is the max response time in seconds. For max values in the top 25% of the range have a red background and in the bottom 25% of the range have a green background. The red background is not used when the min value is within 80% of the max value.
| dbms | 256us | 1ms | 4ms | 16ms | 64ms | 256ms | 1s | 4s | 16s | gt | max |
|---|---|---|---|---|---|---|---|---|---|---|---|
| ma100244_rel.cz11a_c8r32 | 7.933 | 81.058 | 10.563 | 0.446 | 0.048 | ||||||
| ma100339_rel.cz11a_c8r32 | 6.975 | 81.835 | 10.796 | 0.394 | 0.061 | ||||||
| ma100433_rel.cz11a_c8r32 | 3.340 | 83.322 | 12.810 | 0.528 | 0.050 | ||||||
| ma100524_rel.cz11a_c8r32 | 15.824 | 81.435 | 2.692 | 0.049 | 0.040 | ||||||
| ma100617_rel.cz11a_c8r32 | 25.000 | 73.064 | 1.908 | 0.028 | 0.039 | ||||||
| ma101107_rel.cz11a_c8r32 | 30.652 | 67.385 | 1.956 | 0.007 | 0.040 | ||||||
| ma110401_rel.cz11b_c8r32 | 23.608 | 73.288 | 3.064 | 0.040 | 0.042 |
Delete response time histogram: each cell has the percentage of responses that take <= the time in the header and max is the max response time in seconds. For max values in the top 25% of the range have a red background and in the bottom 25% of the range have a green background. The red background is not used when the min value is within 80% of the max value.
| dbms | 256us | 1ms | 4ms | 16ms | 64ms | 256ms | 1s | 4s | 16s | gt | max |
|---|---|---|---|---|---|---|---|---|---|---|---|
| ma100244_rel.cz11a_c8r32 | 42.900 | 47.933 | 8.864 | 0.303 | 0.047 | ||||||
| ma100339_rel.cz11a_c8r32 | 59.785 | 31.132 | 8.803 | 0.279 | 0.054 | ||||||
| ma100433_rel.cz11a_c8r32 | 56.384 | 33.037 | 10.217 | 0.361 | 0.047 | ||||||
| ma100524_rel.cz11a_c8r32 | 81.404 | 16.629 | 1.931 | 0.036 | 0.039 | ||||||
| ma100617_rel.cz11a_c8r32 | 67.029 | 31.282 | 1.672 | 0.017 | 0.039 | ||||||
| ma101107_rel.cz11a_c8r32 | 74.677 | 23.603 | 1.715 | 0.005 | 0.038 | ||||||
| ma110401_rel.cz11b_c8r32 | 56.348 | 41.070 | 2.550 | 0.032 | 0.043 |
Performance metrics for the DBMS listed above. Some are normalized by throughput, others are not. Legend for results is here.
ips	qps	rps	rmbps	wps	wmbps	rpq	rkbpq	wpi	wkbpi	csps	cpups	cspq	cpupq	dbgb1	dbgb2	rss	maxop	p50	p99	tag
3989	32160	0	0.0	13642.2	382.2	0.000	0.000	3.420	98.125	162258	58.5	5.045	146	10.7	41.5	12.0	0.032	8042	7832	ma100244_rel.cz11a_c8r32
3989	31190	0	0.0	13572.1	380.4	0.000	0.000	3.402	97.647	158768	58.3	5.090	150	10.9	41.8	12.3	0.029	7816	7608	ma100339_rel.cz11a_c8r32
3989	30358	0	0.0	13840.1	387.8	0.000	0.000	3.470	99.550	159469	58.2	5.253	153	11.0	41.9	NA	0.032	7592	7384	ma100433_rel.cz11a_c8r32
3989	32315	0	0.0	36.8	4.2	0.000	0.000	0.009	1.079	124219	54.7	3.844	135	10.8	43.1	12.2	0.024	8087	7946	ma100524_rel.cz11a_c8r32
3989	32060	0	0.0	404.6	13.8	0.000	0.000	0.101	3.552	123359	54.6	3.848	136	10.0	40.9	10.1	0.018	7975	7800	ma100617_rel.cz11a_c8r32
3989	31928	107	0.4	427.1	14.5	0.003	0.013	0.107	3.724	123793	54.8	3.877	137	10.0	40.8	10.1	0.015	7991	7802	ma101107_rel.cz11a_c8r32
3989	31845	104	0.4	432.9	14.3	0.003	0.013	0.109	3.683	123217	54.7	3.869	137	10.1	41.0	10.1	0.020	7975	7754	ma110401_rel.cz11b_c8r32
qp1000.L6
qp1000.L6: point queries with 1000 insert/s per client. Graphs for performance per 1-second interval are here.
Average throughput:
Query response time histogram: each cell has the percentage of responses that take <= the time in the header and max is the max response time in seconds. For max values in the top 25% of the range have a red background and in the bottom 25% of the range have a green background. The red background is not used when the min value is within 80% of the max value.
| dbms | 256us | 1ms | 4ms | 16ms | 64ms | 256ms | 1s | 4s | 16s | gt | max |
|---|---|---|---|---|---|---|---|---|---|---|---|
| ma100244_rel.cz11a_c8r32 | 99.641 | 0.309 | 0.046 | 0.004 | nonzero | 0.026 | |||||
| ma100339_rel.cz11a_c8r32 | 99.554 | 0.407 | 0.036 | 0.003 | nonzero | 0.023 | |||||
| ma100433_rel.cz11a_c8r32 | 99.536 | 0.423 | 0.038 | 0.003 | nonzero | 0.022 | |||||
| ma100524_rel.cz11a_c8r32 | 99.879 | 0.101 | 0.019 | 0.001 | nonzero | 0.016 | |||||
| ma100617_rel.cz11a_c8r32 | 99.846 | 0.141 | 0.012 | nonzero | nonzero | 0.020 | |||||
| ma101107_rel.cz11a_c8r32 | 99.835 | 0.151 | 0.014 | nonzero | 0.008 | ||||||
| ma110401_rel.cz11b_c8r32 | 99.869 | 0.125 | 0.005 | nonzero | 0.013 |
Insert response time histogram: each cell has the percentage of responses that take <= the time in the header and max is the max response time in seconds. For max values in the top 25% of the range have a red background and in the bottom 25% of the range have a green background. The red background is not used when the min value is within 80% of the max value.
| dbms | 256us | 1ms | 4ms | 16ms | 64ms | 256ms | 1s | 4s | 16s | gt | max |
|---|---|---|---|---|---|---|---|---|---|---|---|
| ma100244_rel.cz11a_c8r32 | 8.969 | 80.237 | 10.181 | 0.613 | 0.046 | ||||||
| ma100339_rel.cz11a_c8r32 | 11.957 | 77.506 | 9.944 | 0.593 | 0.048 | ||||||
| ma100433_rel.cz11a_c8r32 | 9.827 | 79.756 | 9.847 | 0.569 | 0.001 | 0.066 | |||||
| ma100524_rel.cz11a_c8r32 | 13.398 | 83.283 | 3.278 | 0.041 | 0.039 | ||||||
| ma100617_rel.cz11a_c8r32 | 13.489 | 83.981 | 2.513 | 0.017 | 0.040 | ||||||
| ma101107_rel.cz11a_c8r32 | 15.353 | 81.567 | 3.069 | 0.011 | 0.040 | ||||||
| ma110401_rel.cz11b_c8r32 | 29.667 | 68.490 | 1.826 | 0.017 | 0.033 |
Delete response time histogram: each cell has the percentage of responses that take <= the time in the header and max is the max response time in seconds. For max values in the top 25% of the range have a red background and in the bottom 25% of the range have a green background. The red background is not used when the min value is within 80% of the max value.
| dbms | 256us | 1ms | 4ms | 16ms | 64ms | 256ms | 1s | 4s | 16s | gt | max |
|---|---|---|---|---|---|---|---|---|---|---|---|
| ma100244_rel.cz11a_c8r32 | 45.526 | 45.783 | 8.217 | 0.474 | 0.047 | ||||||
| ma100339_rel.cz11a_c8r32 | 63.270 | 28.362 | 7.960 | 0.408 | 0.044 | ||||||
| ma100433_rel.cz11a_c8r32 | 62.969 | 28.824 | 7.835 | 0.372 | 0.058 | ||||||
| ma100524_rel.cz11a_c8r32 | 76.154 | 21.379 | 2.437 | 0.030 | 0.040 | ||||||
| ma100617_rel.cz11a_c8r32 | 57.972 | 39.674 | 2.334 | 0.020 | 0.039 | ||||||
| ma101107_rel.cz11a_c8r32 | 63.165 | 34.381 | 2.444 | 0.010 | 0.039 | ||||||
| ma110401_rel.cz11b_c8r32 | 74.533 | 23.835 | 1.625 | 0.008 | 0.032 |
Performance metrics for the DBMS listed above. Some are normalized by throughput, others are not. Legend for results is here.
ips	qps	rps	rmbps	wps	wmbps	rpq	rkbpq	wpi	wkbpi	csps	cpups	cspq	cpupq	dbgb1	dbgb2	rss	maxop	p50	p99	tag
3989	28177	0	0.0	13683.1	383.4	0.000	0.000	3.430	98.418	150450	59.4	5.339	169	10.7	41.5	12.0	0.026	7048	6875	ma100244_rel.cz11a_c8r32
3989	27168	0	0.0	13776.3	386.0	0.000	0.000	3.454	99.090	149232	59.2	5.493	174	10.9	41.8	12.3	0.023	6811	6665	ma100339_rel.cz11a_c8r32
3989	26492	0	0.0	13794.9	386.5	0.000	0.000	3.458	99.224	150046	59.0	5.664	178	11.0	41.9	NA	0.022	6617	6489	ma100433_rel.cz11a_c8r32
3989	27638	0	0.0	36.2	4.2	0.000	0.000	0.009	1.075	110882	54.7	4.012	158	10.8	43.1	12.2	0.016	6921	6841	ma100524_rel.cz11a_c8r32
3989	27681	0	0.0	370.3	12.8	0.000	0.000	0.093	3.298	111334	54.8	4.022	158	10.0	40.9	10.1	0.020	6921	6793	ma100617_rel.cz11a_c8r32
3989	27489	150	0.6	360.9	12.7	0.005	0.022	0.090	3.258	111671	54.8	4.062	159	10.0	40.8	10.1	0.008	6889	6777	ma101107_rel.cz11a_c8r32
3989	27413	154	0.6	370.8	12.7	0.006	0.022	0.093	3.262	111794	54.7	4.078	160	10.1	41.0	10.1	0.013	6841	6699	ma110401_rel.cz11b_c8r32
l.i0
l.i0: load without secondary indexes
Performance metrics for all DBMS, not just the ones listed above. Some are normalized by throughput, others are not. Legend for results is here.
ips	qps	rps	rmbps	wps	wmbps	rpq	rkbpq	wpi	wkbpi	csps	cpups	cspq	cpupq	dbgb1	dbgb2	rss	maxop	p50	p99	tag
516129	0	1	0.0	2542.1	164.2	0.000	0.000	0.005	0.326	49301	71.3	0.096	11	3.2	34.0	4.1	0.127	151537	130760	ma100244_rel.cz11a_c8r32
428571	0	1	0.0	2288.0	148.0	0.000	0.000	0.005	0.354	56300	76.2	0.131	14	3.2	34.0	3.5	0.136	119867	87769	ma100339_rel.cz11a_c8r32
421053	0	1	0.0	2208.7	145.0	0.000	0.000	0.005	0.353	56505	76.5	0.134	15	3.2	34.0	NA	0.129	119273	100393	ma100433_rel.cz11a_c8r32
436364	0	0	0.0	3033.6	129.9	0.000	0.000	0.007	0.305	95101	71.0	0.218	13	3.2	34.0	3.4	0.176	124265	105585	ma100524_rel.cz11a_c8r32
466019	0	0	0.0	1701.9	111.1	0.000	0.000	0.004	0.244	60824	74.7	0.131	13	3.2	34.0	3.3	0.184	133058	105415	ma100617_rel.cz11a_c8r32
461538	0	0	0.0	1817.1	116.1	0.000	0.000	0.004	0.258	51490	73.5	0.112	13	3.2	34.0	3.3	0.203	132160	111481	ma101107_rel.cz11a_c8r32
461538	0	0	0.0	1811.9	115.9	0.000	0.000	0.004	0.257	53668	73.8	0.116	13	3.2	34.0	3.3	0.196	131553	99694	ma110401_rel.cz11b_c8r32
l.x
l.x: create secondary indexes
Performance metrics for all DBMS, not just the ones listed above. Some are normalized by throughput, others are not. Legend for results is here.
ips	qps	rps	rmbps	wps	wmbps	rpq	rkbpq	wpi	wkbpi	csps	cpups	cspq	cpupq	dbgb1	dbgb2	rss	maxop	p50	p99	tag
923079	0	0	0.0	8897.2	746.3	0.000	0.000	0.010	0.828	35642	45.1	0.039	4	7.3	38.1	5.3	0.001	NA	NA	ma100244_rel.cz11a_c8r32
888891	0	0	0.0	8333.0	718.1	0.000	0.000	0.009	0.827	29646	44.9	0.033	4	7.3	38.1	5.1	0.001	NA	NA	ma100339_rel.cz11a_c8r32
923079	0	0	0.0	8319.4	724.0	0.000	0.000	0.009	0.803	30976	45.5	0.034	4	7.2	38.0	NA	0.001	NA	NA	ma100433_rel.cz11a_c8r32
786887	0	0	0.0	4376.6	541.2	0.000	0.000	0.006	0.704	818	44.4	0.001	5	7.2	38.0	7.5	0.002	NA	NA	ma100524_rel.cz11a_c8r32
774195	0	0	0.0	6954.9	578.9	0.000	0.000	0.009	0.766	12407	45.3	0.016	5	7.2	38.0	7.1	0.001	NA	NA	ma100617_rel.cz11a_c8r32
761906	0	0	0.0	6675.2	568.1	0.000	0.000	0.009	0.763	11343	45.2	0.015	5	7.2	38.0	6.9	0.001	NA	NA	ma101107_rel.cz11a_c8r32
666668	0	0	0.0	6068.1	498.4	0.000	0.000	0.009	0.765	11238	42.3	0.017	5	7.2	38.0	6.2	2.582	NA	NA	ma110401_rel.cz11b_c8r32
l.i1
l.i1: continue load after secondary indexes created with 50 inserts per transaction
Performance metrics for all DBMS, not just the ones listed above. Some are normalized by throughput, others are not. Legend for results is here.
ips	qps	rps	rmbps	wps	wmbps	rpq	rkbpq	wpi	wkbpi	csps	cpups	cspq	cpupq	dbgb1	dbgb2	rss	maxop	p50	p99	tag
69717	0	0	0.0	8545.6	310.5	0.000	0.000	0.123	4.561	41904	80.8	0.601	93	10.7	41.5	11.9	0.177	17381	10039	ma100244_rel.cz11a_c8r32
76010	0	0	0.0	7992.9	301.6	0.000	0.000	0.105	4.064	43609	80.1	0.574	84	10.9	41.8	12.2	0.150	19129	8890	ma100339_rel.cz11a_c8r32
76831	0	0	0.0	8137.7	303.4	0.000	0.000	0.106	4.044	44861	80.3	0.584	84	11.0	41.9	NA	0.159	19080	10953	ma100433_rel.cz11a_c8r32
93910	0	0	0.0	7899.0	286.4	0.000	0.000	0.084	3.123	71667	88.5	0.763	75	10.8	43.1	12.2	1.036	24474	1398	ma100524_rel.cz11a_c8r32
93704	0	0	0.0	9676.9	338.4	0.000	0.000	0.103	3.699	132762	85.2	1.417	73	10.0	40.9	10.2	0.420	24067	11837	ma100617_rel.cz11a_c8r32
92219	0	3797	14.8	9695.1	339.7	0.041	0.165	0.105	3.772	123979	83.2	1.344	72	10.0	40.8	10.1	0.266	23725	12041	ma101107_rel.cz11a_c8r32
76509	0	2911	11.4	8556.0	289.4	0.038	0.152	0.112	3.874	109946	67.3	1.437	70	10.1	41.0	10.1	0.714	19829	7842	ma110401_rel.cz11b_c8r32
l.i2
l.i2: continue load after secondary indexes created with 5 inserts per transaction
Performance metrics for all DBMS, not just the ones listed above. Some are normalized by throughput, others are not. Legend for results is here.
ips	qps	rps	rmbps	wps	wmbps	rpq	rkbpq	wpi	wkbpi	csps	cpups	cspq	cpupq	dbgb1	dbgb2	rss	maxop	p50	p99	tag
36994	0	0	0.0	6797.9	226.5	0.000	0.000	0.184	6.271	118806	81.1	3.211	175	10.7	41.5	11.9	0.135	9323	7382	ma100244_rel.cz11a_c8r32
39555	0	0	0.0	5708.9	200.5	0.000	0.000	0.144	5.190	123364	82.3	3.119	166	10.9	41.8	12.2	0.139	9864	8266	ma100339_rel.cz11a_c8r32
39653	0	0	0.0	5628.0	196.9	0.000	0.000	0.142	5.086	125547	82.7	3.166	167	11.0	41.9	NA	0.134	9954	8358	ma100433_rel.cz11a_c8r32
47761	0	0	0.0	10476.7	324.4	0.000	0.000	0.219	6.954	182758	89.0	3.827	149	10.8	43.1	12.2	0.144	11952	10374	ma100524_rel.cz11a_c8r32
49155	0	0	0.0	5044.6	177.0	0.000	0.000	0.103	3.687	169250	87.7	3.443	143	10.0	40.9	10.1	0.138	12342	10708	ma100617_rel.cz11a_c8r32
45134	0	5903	23.1	4807.8	168.7	0.131	0.523	0.107	3.828	178328	83.5	3.951	148	10.0	40.8	10.1	0.139	11313	9964	ma101107_rel.cz11a_c8r32
43716	0	5646	22.1	4743.0	162.1	0.129	0.517	0.108	3.797	175773	80.5	4.021	147	10.1	41.0	10.1	0.143	11183	8259	ma110401_rel.cz11b_c8r32
qr100.L1
qr100.L1: range queries with 100 insert/s per client
Performance metrics for all DBMS, not just the ones listed above. Some are normalized by throughput, others are not. Legend for results is here.
ips	qps	rps	rmbps	wps	wmbps	rpq	rkbpq	wpi	wkbpi	csps	cpups	cspq	cpupq	dbgb1	dbgb2	rss	maxop	p50	p99	tag
399	34905	0	0.0	3315.9	92.3	0.000	0.000	8.315	237.015	143650	53.1	4.115	122	10.7	41.5	12.0	0.020	8743	8647	ma100244_rel.cz11a_c8r32
399	34250	0	0.0	3325.7	92.6	0.000	0.000	8.339	237.734	140545	53.1	4.103	124	10.9	41.8	12.2	0.025	8612	8503	ma100339_rel.cz11a_c8r32
399	32956	0	0.0	3316.4	92.3	0.000	0.000	8.316	237.059	137112	53.0	4.160	129	11.0	41.9	NA	0.020	8247	8139	ma100433_rel.cz11a_c8r32
399	33134	0	0.0	4.9	0.4	0.000	0.000	0.012	1.081	127402	52.2	3.845	126	10.8	43.1	12.2	0.003	8279	8199	ma100524_rel.cz11a_c8r32
399	32866	0	0.0	17.4	0.8	0.000	0.000	0.044	1.981	125542	52.1	3.820	127	10.0	40.9	10.1	0.011	8199	8119	ma100617_rel.cz11a_c8r32
399	32657	8	0.0	11.3	0.6	0.000	0.001	0.028	1.571	124766	52.2	3.821	128	10.0	40.8	10.0	0.005	8103	8023	ma101107_rel.cz11a_c8r32
399	32780	8	0.0	18.0	0.8	0.000	0.001	0.045	2.018	125270	52.2	3.822	127	10.1	41.0	10.1	0.008	8167	8103	ma110401_rel.cz11b_c8r32
qp100.L2
qp100.L2: point queries with 100 insert/s per client
Performance metrics for all DBMS, not just the ones listed above. Some are normalized by throughput, others are not. Legend for results is here.
ips	qps	rps	rmbps	wps	wmbps	rpq	rkbpq	wpi	wkbpi	csps	cpups	cspq	cpupq	dbgb1	dbgb2	rss	maxop	p50	p99	tag
399	30160	0	0.0	3304.6	92.0	0.000	0.000	8.286	236.212	129969	53.0	4.309	141	10.7	41.5	12.0	0.013	7544	7480	ma100244_rel.cz11a_c8r32
399	29240	0	0.0	3301.4	91.9	0.000	0.000	8.278	236.005	126138	52.7	4.314	144	10.9	41.8	12.3	0.016	7320	7256	ma100339_rel.cz11a_c8r32
399	28177	0	0.0	3303.2	92.0	0.000	0.000	8.283	236.126	123019	52.8	4.366	150	11.0	41.9	NA	0.020	7067	6987	ma100433_rel.cz11a_c8r32
399	28405	0	0.0	4.9	0.4	0.000	0.000	0.012	1.082	114015	52.1	4.014	147	10.8	43.1	12.2	0.003	7128	7064	ma100524_rel.cz11a_c8r32
399	28288	0	0.0	23.7	0.9	0.000	0.000	0.059	2.421	112798	52.0	3.988	147	10.0	40.9	10.1	0.002	7080	7003	ma100617_rel.cz11a_c8r32
399	28016	8	0.0	23.7	0.9	0.000	0.001	0.060	2.437	111714	51.9	3.988	148	10.0	40.8	10.0	0.004	7000	6937	ma101107_rel.cz11a_c8r32
399	28093	10	0.0	24.3	0.9	0.000	0.001	0.061	2.439	112059	51.9	3.989	148	10.1	41.0	10.1	0.002	7019	6954	ma110401_rel.cz11b_c8r32
qr500.L3
qr500.L3: range queries with 500 insert/s per client
Performance metrics for all DBMS, not just the ones listed above. Some are normalized by throughput, others are not. Legend for results is here.
ips	qps	rps	rmbps	wps	wmbps	rpq	rkbpq	wpi	wkbpi	csps	cpups	cspq	cpupq	dbgb1	dbgb2	rss	maxop	p50	p99	tag
1994	33111	0	0.0	11934.1	333.0	0.000	0.000	5.984	170.999	160673	56.8	4.853	137	10.7	41.5	12.0	0.030	8250	8087	ma100244_rel.cz11a_c8r32
1994	32245	0	0.0	11840.2	330.5	0.000	0.000	5.937	169.677	156369	56.8	4.849	141	10.9	41.8	12.3	0.029	8039	7816	ma100339_rel.cz11a_c8r32
1994	31303	0	0.0	11922.0	332.7	0.000	0.000	5.978	170.841	157434	56.4	5.029	144	11.0	41.9	NA	0.036	7752	7576	ma100433_rel.cz11a_c8r32
1994	32789	0	0.0	18.9	2.1	0.000	0.000	0.009	1.075	125757	53.4	3.835	130	10.8	43.1	12.2	0.015	8169	8106	ma100524_rel.cz11a_c8r32
1994	32364	0	0.0	163.0	5.9	0.000	0.000	0.082	3.019	123944	53.3	3.830	132	10.0	40.9	10.1	0.015	8074	7895	ma100617_rel.cz11a_c8r32
1994	32449	57	0.2	165.0	6.0	0.002	0.007	0.083	3.062	124428	53.3	3.835	131	10.0	40.8	10.0	0.014	8135	7928	ma101107_rel.cz11a_c8r32
1994	32263	59	0.2	167.5	5.9	0.002	0.007	0.084	3.043	123788	53.3	3.837	132	10.1	41.0	10.1	0.015	8074	7816	ma110401_rel.cz11b_c8r32
qp500.L4
qp500.L4: point queries with 500 insert/s per client
Performance metrics for all DBMS, not just the ones listed above. Some are normalized by throughput, others are not. Legend for results is here.
ips	qps	rps	rmbps	wps	wmbps	rpq	rkbpq	wpi	wkbpi	csps	cpups	cspq	cpupq	dbgb1	dbgb2	rss	maxop	p50	p99	tag
1994	29078	0	0.0	12016.4	335.3	0.000	0.000	6.025	172.173	150152	56.9	5.164	157	10.7	41.5	12.0	0.020	7272	7160	ma100244_rel.cz11a_c8r32
1993	27890	0	0.0	12037.9	336.0	0.000	0.000	6.039	172.594	145045	56.8	5.201	163	10.9	41.8	12.3	0.035	6968	6857	ma100339_rel.cz11a_c8r32
1994	27098	0	0.0	12037.3	335.9	0.000	0.000	6.036	172.482	146397	56.6	5.402	167	11.0	41.9	NA	0.027	6763	6649	ma100433_rel.cz11a_c8r32
1994	28085	0	0.0	19.0	2.1	0.000	0.000	0.010	1.075	112419	53.2	4.003	152	10.8	43.1	12.2	0.015	7048	6984	ma100524_rel.cz11a_c8r32
1993	27994	0	0.0	163.5	5.9	0.000	0.000	0.082	3.031	112203	53.1	4.008	152	10.0	40.9	10.1	0.011	7016	6920	ma100617_rel.cz11a_c8r32
1994	27863	69	0.3	164.9	6.0	0.002	0.010	0.083	3.059	111838	53.2	4.014	153	10.0	40.8	10.1	0.014	6968	6856	ma101107_rel.cz11a_c8r32
1994	27772	69	0.3	170.0	6.0	0.002	0.010	0.085	3.055	111605	53.1	4.019	153	10.1	41.0	10.1	0.017	6937	6811	ma110401_rel.cz11b_c8r32
qr1000.L5
qr1000.L5: range queries with 1000 insert/s per client
Performance metrics for all DBMS, not just the ones listed above. Some are normalized by throughput, others are not. Legend for results is here.
ips	qps	rps	rmbps	wps	wmbps	rpq	rkbpq	wpi	wkbpi	csps	cpups	cspq	cpupq	dbgb1	dbgb2	rss	maxop	p50	p99	tag
3989	32160	0	0.0	13642.2	382.2	0.000	0.000	3.420	98.125	162258	58.5	5.045	146	10.7	41.5	12.0	0.032	8042	7832	ma100244_rel.cz11a_c8r32
3989	31190	0	0.0	13572.1	380.4	0.000	0.000	3.402	97.647	158768	58.3	5.090	150	10.9	41.8	12.3	0.029	7816	7608	ma100339_rel.cz11a_c8r32
3989	30358	0	0.0	13840.1	387.8	0.000	0.000	3.470	99.550	159469	58.2	5.253	153	11.0	41.9	NA	0.032	7592	7384	ma100433_rel.cz11a_c8r32
3989	32315	0	0.0	36.8	4.2	0.000	0.000	0.009	1.079	124219	54.7	3.844	135	10.8	43.1	12.2	0.024	8087	7946	ma100524_rel.cz11a_c8r32
3989	32060	0	0.0	404.6	13.8	0.000	0.000	0.101	3.552	123359	54.6	3.848	136	10.0	40.9	10.1	0.018	7975	7800	ma100617_rel.cz11a_c8r32
3989	31928	107	0.4	427.1	14.5	0.003	0.013	0.107	3.724	123793	54.8	3.877	137	10.0	40.8	10.1	0.015	7991	7802	ma101107_rel.cz11a_c8r32
3989	31845	104	0.4	432.9	14.3	0.003	0.013	0.109	3.683	123217	54.7	3.869	137	10.1	41.0	10.1	0.020	7975	7754	ma110401_rel.cz11b_c8r32
qp1000.L6
qp1000.L6: point queries with 1000 insert/s per client
Performance metrics for all DBMS, not just the ones listed above. Some are normalized by throughput, others are not. Legend for results is here.
ips	qps	rps	rmbps	wps	wmbps	rpq	rkbpq	wpi	wkbpi	csps	cpups	cspq	cpupq	dbgb1	dbgb2	rss	maxop	p50	p99	tag
3989	28177	0	0.0	13683.1	383.4	0.000	0.000	3.430	98.418	150450	59.4	5.339	169	10.7	41.5	12.0	0.026	7048	6875	ma100244_rel.cz11a_c8r32
3989	27168	0	0.0	13776.3	386.0	0.000	0.000	3.454	99.090	149232	59.2	5.493	174	10.9	41.8	12.3	0.023	6811	6665	ma100339_rel.cz11a_c8r32
3989	26492	0	0.0	13794.9	386.5	0.000	0.000	3.458	99.224	150046	59.0	5.664	178	11.0	41.9	NA	0.022	6617	6489	ma100433_rel.cz11a_c8r32
3989	27638	0	0.0	36.2	4.2	0.000	0.000	0.009	1.075	110882	54.7	4.012	158	10.8	43.1	12.2	0.016	6921	6841	ma100524_rel.cz11a_c8r32
3989	27681	0	0.0	370.3	12.8	0.000	0.000	0.093	3.298	111334	54.8	4.022	158	10.0	40.9	10.1	0.020	6921	6793	ma100617_rel.cz11a_c8r32
3989	27489	150	0.6	360.9	12.7	0.005	0.022	0.090	3.258	111671	54.8	4.062	159	10.0	40.8	10.1	0.008	6889	6777	ma101107_rel.cz11a_c8r32
3989	27413	154	0.6	370.8	12.7	0.006	0.022	0.093	3.262	111794	54.7	4.078	160	10.1	41.0	10.1	0.013	6841	6699	ma110401_rel.cz11b_c8r32
l.i0
- l.i0: load without secondary indexes
- Legend for results is here.
- Each entry lists the percentage of responses that fit in that bucket (slower than max time for previous bucket, faster than min time for next bucket).
Insert response time histogram
256us	1ms	4ms	16ms	64ms	256ms	1s	4s	16s	gt	max	tag
0.000	97.433	2.227	0.316	0.008	0.016	0.000	0.000	0.000	0.000	0.127	ma100244_rel.cz11a_c8r32
0.000	86.240	13.360	0.371	0.012	0.016	0.000	0.000	0.000	0.000	0.136	ma100339_rel.cz11a_c8r32
0.000	86.226	13.386	0.361	0.011	0.016	0.000	0.000	0.000	0.000	0.129	ma100433_rel.cz11a_c8r32
0.000	94.533	4.818	0.502	0.125	0.022	0.000	0.000	0.000	0.000	0.176	ma100524_rel.cz11a_c8r32
0.000	92.352	7.293	0.320	0.019	0.017	0.000	0.000	0.000	0.000	0.184	ma100617_rel.cz11a_c8r32
0.000	90.347	9.297	0.321	0.018	0.017	0.000	0.000	0.000	0.000	0.203	ma101107_rel.cz11a_c8r32
0.000	90.299	9.361	0.305	0.018	0.018	0.000	0.000	0.000	0.000	0.196	ma110401_rel.cz11b_c8r32
l.x
- l.x: create secondary indexes
- Legend for results is here.
- Each entry lists the percentage of responses that fit in that bucket (slower than max time for previous bucket, faster than min time for next bucket).
TODO - determine whether there is data for create index response time
l.i1
- l.i1: continue load after secondary indexes created with 50 inserts per transaction
- Legend for results is here.
- Each entry lists the percentage of responses that fit in that bucket (slower than max time for previous bucket, faster than min time for next bucket).
Insert response time histogram
256us	1ms	4ms	16ms	64ms	256ms	1s	4s	16s	gt	max	tag
0.000	0.032	84.507	14.926	0.523	0.012	0.000	0.000	0.000	0.000	0.177	ma100244_rel.cz11a_c8r32
0.000	0.068	87.488	11.964	0.468	0.013	0.000	0.000	0.000	0.000	0.150	ma100339_rel.cz11a_c8r32
0.000	0.042	87.489	12.020	0.436	0.013	0.000	0.000	0.000	0.000	0.159	ma100433_rel.cz11a_c8r32
0.000	0.096	96.297	3.517	0.061	0.017	0.011	nonzero	0.000	0.000	1.036	ma100524_rel.cz11a_c8r32
0.000	0.739	95.450	3.686	0.108	0.016	nonzero	0.000	0.000	0.000	0.420	ma100617_rel.cz11a_c8r32
0.000	0.622	94.637	4.629	0.096	0.015	nonzero	0.000	0.000	0.000	0.266	ma101107_rel.cz11a_c8r32
0.000	3.075	87.926	7.640	1.328	0.029	0.002	0.000	0.000	0.000	0.714	ma110401_rel.cz11b_c8r32
Delete response time histogram
256us	1ms	4ms	16ms	64ms	256ms	1s	4s	16s	gt	max	tag
0.000	7.247	78.098	14.233	0.410	0.012	0.000	0.000	0.000	0.000	0.159	ma100244_rel.cz11a_c8r32
0.000	21.120	67.045	11.485	0.338	0.011	0.000	0.000	0.000	0.000	0.144	ma100339_rel.cz11a_c8r32
0.000	20.700	67.406	11.559	0.323	0.012	0.000	0.000	0.000	0.000	0.153	ma100433_rel.cz11a_c8r32
0.000	20.726	76.520	2.682	0.046	0.019	0.007	nonzero	0.000	0.000	1.036	ma100524_rel.cz11a_c8r32
0.000	17.661	79.410	2.828	0.088	0.013	nonzero	0.000	0.000	0.000	0.422	ma100617_rel.cz11a_c8r32
0.000	16.692	79.130	4.083	0.081	0.013	0.000	0.000	0.000	0.000	0.208	ma101107_rel.cz11a_c8r32
0.000	22.684	69.498	6.697	1.095	0.025	0.001	0.000	0.000	0.000	0.681	ma110401_rel.cz11b_c8r32
l.i2
- l.i2: continue load after secondary indexes created with 5 inserts per transaction
- Legend for results is here.
- Each entry lists the percentage of responses that fit in that bucket (slower than max time for previous bucket, faster than min time for next bucket).
Insert response time histogram
256us	1ms	4ms	16ms	64ms	256ms	1s	4s	16s	gt	max	tag
23.158	72.144	3.523	1.170	0.003	0.002	0.000	0.000	0.000	0.000	0.135	ma100244_rel.cz11a_c8r32
26.328	69.413	3.358	0.895	0.005	0.002	0.000	0.000	0.000	0.000	0.139	ma100339_rel.cz11a_c8r32
25.457	70.415	3.263	0.861	0.003	0.002	0.000	0.000	0.000	0.000	0.134	ma100433_rel.cz11a_c8r32
25.209	72.854	1.849	0.085	0.002	0.002	0.000	0.000	0.000	0.000	0.144	ma100524_rel.cz11a_c8r32
31.943	64.924	3.011	0.119	0.002	0.002	0.000	0.000	0.000	0.000	0.138	ma100617_rel.cz11a_c8r32
17.259	79.386	3.254	0.098	0.001	0.002	0.000	0.000	0.000	0.000	0.139	ma101107_rel.cz11a_c8r32
21.896	74.945	2.801	0.326	0.030	0.002	0.000	0.000	0.000	0.000	0.143	ma110401_rel.cz11b_c8r32
Delete response time histogram
256us	1ms	4ms	16ms	64ms	256ms	1s	4s	16s	gt	max	tag
24.374	71.122	3.339	1.160	0.003	0.002	0.000	0.000	0.000	0.000	0.135	ma100244_rel.cz11a_c8r32
28.297	67.431	3.376	0.890	0.004	0.002	0.000	0.000	0.000	0.000	0.141	ma100339_rel.cz11a_c8r32
27.613	68.268	3.259	0.855	0.003	0.002	0.000	0.000	0.000	0.000	0.134	ma100433_rel.cz11a_c8r32
27.518	70.612	1.789	0.077	0.002	0.002	0.000	0.000	0.000	0.000	0.144	ma100524_rel.cz11a_c8r32
33.983	62.663	3.230	0.122	0.002	0.002	0.000	0.000	0.000	0.000	0.139	ma100617_rel.cz11a_c8r32
22.189	74.286	3.419	0.104	0.001	0.002	0.000	0.000	0.000	0.000	0.138	ma101107_rel.cz11a_c8r32
25.235	71.560	2.873	0.303	0.026	0.002	0.000	0.000	0.000	0.000	0.144	ma110401_rel.cz11b_c8r32
qr100.L1
- qr100.L1: range queries with 100 insert/s per client
- Legend for results is here.
- Each entry lists the percentage of responses that fit in that bucket (slower than max time for previous bucket, faster than min time for next bucket).
Query response time histogram
256us	1ms	4ms	16ms	64ms	256ms	1s	4s	16s	gt	max	tag
99.947	0.050	0.003	nonzero	nonzero	0.000	0.000	0.000	0.000	0.000	0.020	ma100244_rel.cz11a_c8r32
99.955	0.043	0.002	nonzero	nonzero	0.000	0.000	0.000	0.000	0.000	0.025	ma100339_rel.cz11a_c8r32
99.941	0.056	0.003	nonzero	nonzero	0.000	0.000	0.000	0.000	0.000	0.020	ma100433_rel.cz11a_c8r32
99.993	0.007	nonzero	0.000	0.000	0.000	0.000	0.000	0.000	0.000	0.003	ma100524_rel.cz11a_c8r32
99.993	0.007	nonzero	nonzero	0.000	0.000	0.000	0.000	0.000	0.000	0.011	ma100617_rel.cz11a_c8r32
99.990	0.009	0.001	nonzero	0.000	0.000	0.000	0.000	0.000	0.000	0.005	ma101107_rel.cz11a_c8r32
99.991	0.008	0.001	nonzero	0.000	0.000	0.000	0.000	0.000	0.000	0.008	ma110401_rel.cz11b_c8r32
Insert response time histogram
256us	1ms	4ms	16ms	64ms	256ms	1s	4s	16s	gt	max	tag
0.000	1.660	95.438	2.701	0.201	0.000	0.000	0.000	0.000	0.000	0.036	ma100244_rel.cz11a_c8r32
0.000	1.118	95.903	2.799	0.181	0.000	0.000	0.000	0.000	0.000	0.030	ma100339_rel.cz11a_c8r32
0.000	0.674	96.160	2.965	0.201	0.000	0.000	0.000	0.000	0.000	0.036	ma100433_rel.cz11a_c8r32
0.000	7.028	92.965	0.007	0.000	0.000	0.000	0.000	0.000	0.000	0.004	ma100524_rel.cz11a_c8r32
0.000	20.465	79.521	0.014	0.000	0.000	0.000	0.000	0.000	0.000	0.007	ma100617_rel.cz11a_c8r32
0.000	1.083	62.111	36.806	0.000	0.000	0.000	0.000	0.000	0.000	0.012	ma101107_rel.cz11a_c8r32
0.000	2.611	55.528	41.861	0.000	0.000	0.000	0.000	0.000	0.000	0.012	ma110401_rel.cz11b_c8r32
Delete response time histogram
256us	1ms	4ms	16ms	64ms	256ms	1s	4s	16s	gt	max	tag
0.000	60.639	36.722	2.562	0.076	0.000	0.000	0.000	0.000	0.000	0.031	ma100244_rel.cz11a_c8r32
0.000	76.694	20.771	2.424	0.111	0.000	0.000	0.000	0.000	0.000	0.023	ma100339_rel.cz11a_c8r32
0.000	74.931	22.438	2.528	0.104	0.000	0.000	0.000	0.000	0.000	0.023	ma100433_rel.cz11a_c8r32
0.000	96.069	3.931	0.000	0.000	0.000	0.000	0.000	0.000	0.000	0.004	ma100524_rel.cz11a_c8r32
0.000	72.722	27.271	0.007	0.000	0.000	0.000	0.000	0.000	0.000	0.008	ma100617_rel.cz11a_c8r32
0.000	12.340	49.562	38.097	0.000	0.000	0.000	0.000	0.000	0.000	0.012	ma101107_rel.cz11a_c8r32
0.000	12.424	45.729	41.847	0.000	0.000	0.000	0.000	0.000	0.000	0.011	ma110401_rel.cz11b_c8r32
qp100.L2
- qp100.L2: point queries with 100 insert/s per client
- Legend for results is here.
- Each entry lists the percentage of responses that fit in that bucket (slower than max time for previous bucket, faster than min time for next bucket).
Query response time histogram
256us	1ms	4ms	16ms	64ms	256ms	1s	4s	16s	gt	max	tag
99.973	0.026	0.001	nonzero	0.000	0.000	0.000	0.000	0.000	0.000	0.013	ma100244_rel.cz11a_c8r32
99.960	0.039	0.001	nonzero	nonzero	0.000	0.000	0.000	0.000	0.000	0.016	ma100339_rel.cz11a_c8r32
99.943	0.056	0.001	nonzero	nonzero	0.000	0.000	0.000	0.000	0.000	0.020	ma100433_rel.cz11a_c8r32
99.957	0.042	0.001	0.000	0.000	0.000	0.000	0.000	0.000	0.000	0.003	ma100524_rel.cz11a_c8r32
99.927	0.073	0.001	0.000	0.000	0.000	0.000	0.000	0.000	0.000	0.002	ma100617_rel.cz11a_c8r32
99.914	0.082	0.004	0.000	0.000	0.000	0.000	0.000	0.000	0.000	0.004	ma101107_rel.cz11a_c8r32
99.922	0.075	0.002	0.000	0.000	0.000	0.000	0.000	0.000	0.000	0.002	ma110401_rel.cz11b_c8r32
Insert response time histogram
256us	1ms	4ms	16ms	64ms	256ms	1s	4s	16s	gt	max	tag
0.000	0.326	96.646	2.812	0.215	0.000	0.000	0.000	0.000	0.000	0.027	ma100244_rel.cz11a_c8r32
0.000	0.389	96.486	2.931	0.194	0.000	0.000	0.000	0.000	0.000	0.030	ma100339_rel.cz11a_c8r32
0.000	0.042	97.167	2.611	0.181	0.000	0.000	0.000	0.000	0.000	0.029	ma100433_rel.cz11a_c8r32
0.000	0.222	99.778	0.000	0.000	0.000	0.000	0.000	0.000	0.000	0.003	ma100524_rel.cz11a_c8r32
0.000	7.694	92.292	0.014	0.000	0.000	0.000	0.000	0.000	0.000	0.010	ma100617_rel.cz11a_c8r32
0.000	0.062	53.299	46.639	0.000	0.000	0.000	0.000	0.000	0.000	0.012	ma101107_rel.cz11a_c8r32
0.000	3.097	61.785	35.118	0.000	0.000	0.000	0.000	0.000	0.000	0.011	ma110401_rel.cz11b_c8r32
Delete response time histogram
256us	1ms	4ms	16ms	64ms	256ms	1s	4s	16s	gt	max	tag
0.000	38.785	58.549	2.528	0.139	0.000	0.000	0.000	0.000	0.000	0.026	ma100244_rel.cz11a_c8r32
0.000	69.354	27.896	2.694	0.056	0.000	0.000	0.000	0.000	0.000	0.029	ma100339_rel.cz11a_c8r32
0.000	60.410	37.201	2.312	0.076	0.000	0.000	0.000	0.000	0.000	0.029	ma100433_rel.cz11a_c8r32
0.000	64.208	35.792	0.000	0.000	0.000	0.000	0.000	0.000	0.000	0.003	ma100524_rel.cz11a_c8r32
0.000	63.236	36.764	0.000	0.000	0.000	0.000	0.000	0.000	0.000	0.003	ma100617_rel.cz11a_c8r32
0.000	3.583	49.792	46.625	0.000	0.000	0.000	0.000	0.000	0.000	0.012	ma101107_rel.cz11a_c8r32
0.000	10.000	54.889	35.111	0.000	0.000	0.000	0.000	0.000	0.000	0.011	ma110401_rel.cz11b_c8r32
qr500.L3
- qr500.L3: range queries with 500 insert/s per client
- Legend for results is here.
- Each entry lists the percentage of responses that fit in that bucket (slower than max time for previous bucket, faster than min time for next bucket).
Query response time histogram
256us	1ms	4ms	16ms	64ms	256ms	1s	4s	16s	gt	max	tag
99.737	0.230	0.031	0.003	nonzero	0.000	0.000	0.000	0.000	0.000	0.030	ma100244_rel.cz11a_c8r32
99.660	0.301	0.037	0.002	nonzero	0.000	0.000	0.000	0.000	0.000	0.029	ma100339_rel.cz11a_c8r32
99.649	0.307	0.041	0.003	nonzero	0.000	0.000	0.000	0.000	0.000	0.036	ma100433_rel.cz11a_c8r32
99.973	0.021	0.006	nonzero	0.000	0.000	0.000	0.000	0.000	0.000	0.015	ma100524_rel.cz11a_c8r32
99.959	0.036	0.005	nonzero	0.000	0.000	0.000	0.000	0.000	0.000	0.015	ma100617_rel.cz11a_c8r32
99.938	0.047	0.015	nonzero	0.000	0.000	0.000	0.000	0.000	0.000	0.014	ma101107_rel.cz11a_c8r32
99.940	0.046	0.013	nonzero	0.000	0.000	0.000	0.000	0.000	0.000	0.015	ma110401_rel.cz11b_c8r32
Insert response time histogram
256us	1ms	4ms	16ms	64ms	256ms	1s	4s	16s	gt	max	tag
0.000	6.132	83.535	9.750	0.583	0.000	0.000	0.000	0.000	0.000	0.043	ma100244_rel.cz11a_c8r32
0.000	5.324	84.001	10.043	0.632	0.000	0.000	0.000	0.000	0.000	0.063	ma100339_rel.cz11a_c8r32
0.000	5.281	83.867	10.274	0.579	0.000	0.000	0.000	0.000	0.000	0.050	ma100433_rel.cz11a_c8r32
0.000	13.321	85.362	1.307	0.010	0.000	0.000	0.000	0.000	0.000	0.035	ma100524_rel.cz11a_c8r32
0.000	27.133	71.772	1.083	0.011	0.000	0.000	0.000	0.000	0.000	0.039	ma100617_rel.cz11a_c8r32
0.000	1.479	88.206	10.303	0.013	0.000	0.000	0.000	0.000	0.000	0.030	ma101107_rel.cz11a_c8r32
0.000	4.203	88.297	7.487	0.013	0.000	0.000	0.000	0.000	0.000	0.032	ma110401_rel.cz11b_c8r32
Delete response time histogram
256us	1ms	4ms	16ms	64ms	256ms	1s	4s	16s	gt	max	tag
0.000	45.751	45.649	8.132	0.468	0.000	0.000	0.000	0.000	0.000	0.045	ma100244_rel.cz11a_c8r32
0.000	61.433	29.704	8.358	0.504	0.000	0.000	0.000	0.000	0.000	0.049	ma100339_rel.cz11a_c8r32
0.000	62.518	28.421	8.646	0.415	0.000	0.000	0.000	0.000	0.000	0.049	ma100433_rel.cz11a_c8r32
0.000	82.583	16.483	0.922	0.011	0.000	0.000	0.000	0.000	0.000	0.035	ma100524_rel.cz11a_c8r32
0.000	70.254	28.882	0.856	0.008	0.000	0.000	0.000	0.000	0.000	0.037	ma100617_rel.cz11a_c8r32
0.000	18.286	72.489	9.213	0.013	0.000	0.000	0.000	0.000	0.000	0.034	ma101107_rel.cz11a_c8r32
0.000	17.947	75.671	6.371	0.011	0.000	0.000	0.000	0.000	0.000	0.033	ma110401_rel.cz11b_c8r32
qp500.L4
- qp500.L4: point queries with 500 insert/s per client
- Legend for results is here.
- Each entry lists the percentage of responses that fit in that bucket (slower than max time for previous bucket, faster than min time for next bucket).
Query response time histogram
256us	1ms	4ms	16ms	64ms	256ms	1s	4s	16s	gt	max	tag
99.834	0.146	0.019	0.001	nonzero	0.000	0.000	0.000	0.000	0.000	0.020	ma100244_rel.cz11a_c8r32
99.824	0.153	0.021	0.002	nonzero	0.000	0.000	0.000	0.000	0.000	0.035	ma100339_rel.cz11a_c8r32
99.771	0.206	0.022	0.001	nonzero	0.000	0.000	0.000	0.000	0.000	0.027	ma100433_rel.cz11a_c8r32
99.934	0.058	0.008	nonzero	0.000	0.000	0.000	0.000	0.000	0.000	0.015	ma100524_rel.cz11a_c8r32
99.851	0.141	0.008	nonzero	0.000	0.000	0.000	0.000	0.000	0.000	0.011	ma100617_rel.cz11a_c8r32
99.868	0.122	0.010	nonzero	0.000	0.000	0.000	0.000	0.000	0.000	0.014	ma101107_rel.cz11a_c8r32
99.885	0.107	0.008	nonzero	nonzero	0.000	0.000	0.000	0.000	0.000	0.017	ma110401_rel.cz11b_c8r32
Insert response time histogram
256us	1ms	4ms	16ms	64ms	256ms	1s	4s	16s	gt	max	tag
0.000	6.776	83.300	9.228	0.694	0.001	0.000	0.000	0.000	0.000	0.068	ma100244_rel.cz11a_c8r32
0.000	4.994	83.793	10.426	0.785	0.001	0.000	0.000	0.000	0.000	0.067	ma100339_rel.cz11a_c8r32
0.000	5.260	84.332	9.715	0.693	0.000	0.000	0.000	0.000	0.000	0.053	ma100433_rel.cz11a_c8r32
0.000	7.958	90.656	1.376	0.010	0.000	0.000	0.000	0.000	0.000	0.038	ma100524_rel.cz11a_c8r32
0.000	18.147	80.897	0.944	0.011	0.000	0.000	0.000	0.000	0.000	0.036	ma100617_rel.cz11a_c8r32
0.000	8.876	83.806	7.308	0.010	0.000	0.000	0.000	0.000	0.000	0.037	ma101107_rel.cz11a_c8r32
0.000	13.196	81.103	5.688	0.014	0.000	0.000	0.000	0.000	0.000	0.031	ma110401_rel.cz11b_c8r32
Delete response time histogram
256us	1ms	4ms	16ms	64ms	256ms	1s	4s	16s	gt	max	tag
0.000	46.718	44.838	7.935	0.510	0.000	0.000	0.000	0.000	0.000	0.048	ma100244_rel.cz11a_c8r32
0.000	58.651	32.474	8.292	0.583	0.000	0.000	0.000	0.000	0.000	0.045	ma100339_rel.cz11a_c8r32
0.000	61.406	30.175	7.919	0.500	0.000	0.000	0.000	0.000	0.000	0.049	ma100433_rel.cz11a_c8r32
0.000	74.732	24.403	0.860	0.006	0.000	0.000	0.000	0.000	0.000	0.035	ma100524_rel.cz11a_c8r32
0.000	67.419	31.840	0.731	0.010	0.000	0.000	0.000	0.000	0.000	0.036	ma100617_rel.cz11a_c8r32
0.000	41.258	51.547	7.185	0.010	0.000	0.000	0.000	0.000	0.000	0.036	ma101107_rel.cz11a_c8r32
0.000	37.340	56.994	5.651	0.014	0.000	0.000	0.000	0.000	0.000	0.031	ma110401_rel.cz11b_c8r32
qr1000.L5
- qr1000.L5: range queries with 1000 insert/s per client
- Legend for results is here.
- Each entry lists the percentage of responses that fit in that bucket (slower than max time for previous bucket, faster than min time for next bucket).
Query response time histogram
256us	1ms	4ms	16ms	64ms	256ms	1s	4s	16s	gt	max	tag
99.341	0.563	0.088	0.008	nonzero	0.000	0.000	0.000	0.000	0.000	0.032	ma100244_rel.cz11a_c8r32
99.217	0.692	0.084	0.006	nonzero	0.000	0.000	0.000	0.000	0.000	0.029	ma100339_rel.cz11a_c8r32
99.291	0.602	0.098	0.009	nonzero	0.000	0.000	0.000	0.000	0.000	0.032	ma100433_rel.cz11a_c8r32
99.910	0.071	0.018	0.001	nonzero	0.000	0.000	0.000	0.000	0.000	0.024	ma100524_rel.cz11a_c8r32
99.915	0.073	0.012	0.001	nonzero	0.000	0.000	0.000	0.000	0.000	0.018	ma100617_rel.cz11a_c8r32
99.924	0.065	0.010	0.001	0.000	0.000	0.000	0.000	0.000	0.000	0.015	ma101107_rel.cz11a_c8r32
99.911	0.074	0.014	0.001	nonzero	0.000	0.000	0.000	0.000	0.000	0.020	ma110401_rel.cz11b_c8r32
Insert response time histogram
256us	1ms	4ms	16ms	64ms	256ms	1s	4s	16s	gt	max	tag
0.000	7.933	81.058	10.563	0.446	0.000	0.000	0.000	0.000	0.000	0.048	ma100244_rel.cz11a_c8r32
0.000	6.975	81.835	10.796	0.394	0.000	0.000	0.000	0.000	0.000	0.061	ma100339_rel.cz11a_c8r32
0.000	3.340	83.322	12.810	0.528	0.000	0.000	0.000	0.000	0.000	0.050	ma100433_rel.cz11a_c8r32
0.000	15.824	81.435	2.692	0.049	0.000	0.000	0.000	0.000	0.000	0.040	ma100524_rel.cz11a_c8r32
0.000	25.000	73.064	1.908	0.028	0.000	0.000	0.000	0.000	0.000	0.039	ma100617_rel.cz11a_c8r32
0.000	30.652	67.385	1.956	0.007	0.000	0.000	0.000	0.000	0.000	0.040	ma101107_rel.cz11a_c8r32
0.000	23.608	73.288	3.064	0.040	0.000	0.000	0.000	0.000	0.000	0.042	ma110401_rel.cz11b_c8r32
Delete response time histogram
256us	1ms	4ms	16ms	64ms	256ms	1s	4s	16s	gt	max	tag
0.000	42.900	47.933	8.864	0.303	0.000	0.000	0.000	0.000	0.000	0.047	ma100244_rel.cz11a_c8r32
0.000	59.785	31.132	8.803	0.279	0.000	0.000	0.000	0.000	0.000	0.054	ma100339_rel.cz11a_c8r32
0.000	56.384	33.037	10.217	0.361	0.000	0.000	0.000	0.000	0.000	0.047	ma100433_rel.cz11a_c8r32
0.000	81.404	16.629	1.931	0.036	0.000	0.000	0.000	0.000	0.000	0.039	ma100524_rel.cz11a_c8r32
0.000	67.029	31.282	1.672	0.017	0.000	0.000	0.000	0.000	0.000	0.039	ma100617_rel.cz11a_c8r32
0.000	74.677	23.603	1.715	0.005	0.000	0.000	0.000	0.000	0.000	0.038	ma101107_rel.cz11a_c8r32
0.000	56.348	41.070	2.550	0.032	0.000	0.000	0.000	0.000	0.000	0.043	ma110401_rel.cz11b_c8r32
qp1000.L6
- qp1000.L6: point queries with 1000 insert/s per client
- Legend for results is here.
- Each entry lists the percentage of responses that fit in that bucket (slower than max time for previous bucket, faster than min time for next bucket).
Query response time histogram
256us	1ms	4ms	16ms	64ms	256ms	1s	4s	16s	gt	max	tag
99.641	0.309	0.046	0.004	nonzero	0.000	0.000	0.000	0.000	0.000	0.026	ma100244_rel.cz11a_c8r32
99.554	0.407	0.036	0.003	nonzero	0.000	0.000	0.000	0.000	0.000	0.023	ma100339_rel.cz11a_c8r32
99.536	0.423	0.038	0.003	nonzero	0.000	0.000	0.000	0.000	0.000	0.022	ma100433_rel.cz11a_c8r32
99.879	0.101	0.019	0.001	nonzero	0.000	0.000	0.000	0.000	0.000	0.016	ma100524_rel.cz11a_c8r32
99.846	0.141	0.012	nonzero	nonzero	0.000	0.000	0.000	0.000	0.000	0.020	ma100617_rel.cz11a_c8r32
99.835	0.151	0.014	nonzero	0.000	0.000	0.000	0.000	0.000	0.000	0.008	ma101107_rel.cz11a_c8r32
99.869	0.125	0.005	nonzero	0.000	0.000	0.000	0.000	0.000	0.000	0.013	ma110401_rel.cz11b_c8r32
Insert response time histogram
256us	1ms	4ms	16ms	64ms	256ms	1s	4s	16s	gt	max	tag
0.000	8.969	80.237	10.181	0.613	0.000	0.000	0.000	0.000	0.000	0.046	ma100244_rel.cz11a_c8r32
0.000	11.957	77.506	9.944	0.593	0.000	0.000	0.000	0.000	0.000	0.048	ma100339_rel.cz11a_c8r32
0.000	9.827	79.756	9.847	0.569	0.001	0.000	0.000	0.000	0.000	0.066	ma100433_rel.cz11a_c8r32
0.000	13.398	83.283	3.278	0.041	0.000	0.000	0.000	0.000	0.000	0.039	ma100524_rel.cz11a_c8r32
0.000	13.489	83.981	2.513	0.017	0.000	0.000	0.000	0.000	0.000	0.040	ma100617_rel.cz11a_c8r32
0.000	15.353	81.567	3.069	0.011	0.000	0.000	0.000	0.000	0.000	0.040	ma101107_rel.cz11a_c8r32
0.000	29.667	68.490	1.826	0.017	0.000	0.000	0.000	0.000	0.000	0.033	ma110401_rel.cz11b_c8r32
Delete response time histogram
256us	1ms	4ms	16ms	64ms	256ms	1s	4s	16s	gt	max	tag
0.000	45.526	45.783	8.217	0.474	0.000	0.000	0.000	0.000	0.000	0.047	ma100244_rel.cz11a_c8r32
0.000	63.270	28.362	7.960	0.408	0.000	0.000	0.000	0.000	0.000	0.044	ma100339_rel.cz11a_c8r32
0.000	62.969	28.824	7.835	0.372	0.000	0.000	0.000	0.000	0.000	0.058	ma100433_rel.cz11a_c8r32
0.000	76.154	21.379	2.437	0.030	0.000	0.000	0.000	0.000	0.000	0.040	ma100524_rel.cz11a_c8r32
0.000	57.972	39.674	2.334	0.020	0.000	0.000	0.000	0.000	0.000	0.039	ma100617_rel.cz11a_c8r32
0.000	63.165	34.381	2.444	0.010	0.000	0.000	0.000	0.000	0.000	0.039	ma101107_rel.cz11a_c8r32
0.000	74.533	23.835	1.625	0.008	0.000	0.000	0.000	0.000	0.000	0.032	ma110401_rel.cz11b_c8r32