Introduction
This is a report for the insert benchmark with 48M docs and 4 client(s). It is generated by scripts (bash, awk, sed) and Tufte might not be impressed. An overview of the insert benchmark is here and a short update is here. Below, by DBMS, I mean DBMS+version.config. An example is my8020.c10b40 where my means MySQL, 8020 is version 8.0.20 and c10b40 is the name for the configuration file.
The test server has 8 AMD cores, 32G RAM and an NVMe SSD. It is described here as the ASUS PN53. The benchmark was run with 4 clients and there were 1 or 3 connections per client (1 for queries or inserts without rate limits, 1+1 for rate limited inserts+deletes). It uses 4 tables with a table per client. It loads 12M rows per table without secondary indexes, creates 3 secondary indexes per table, then inserts 40 rows per table with a delete per insert to avoid growing the table. It then does 6 read+write tests for 1800s each that do queries as fast as possible with 100,100,500,500,1000,1000 inserts/s and the same for deletes/s per client concurrent with the queries. The database is cached in memory. Clients and the DBMS share one server. The per-database configs are in the per-database subdirectories here.
The tested DBMS are:
- ma101107_rel.cz11apur1_c8r32 - MariaDB 10.11.7 with the cz11apur1_c8r32 config that uses innodb_purge_threads=1
- ma110401_rel.cz11bpur1_c8r32 - MariaDB 11.4.1 with the cz11apur1_c8r32 config that uses innodb_purge_threads=1
- my8036_rel.cz11apur1_c8r32 - MySQL 8.0.36 with the cz11apur1_c8r32 config that uses innodb_purge_threads=1
Contents
- Summary
- l.i0: load without secondary indexes
- l.x: create secondary indexes
- l.i1: continue load after secondary indexes created with 50 inserts per transaction
- l.i2: continue load after secondary indexes created with 5 inserts per transaction
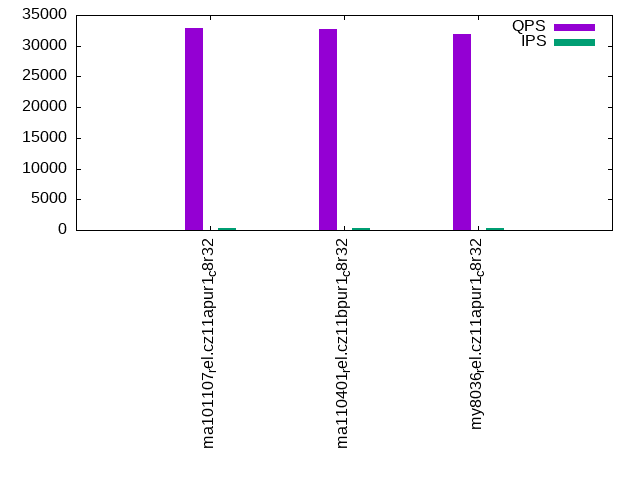
- qr100.L1: range queries with 100 insert/s per client
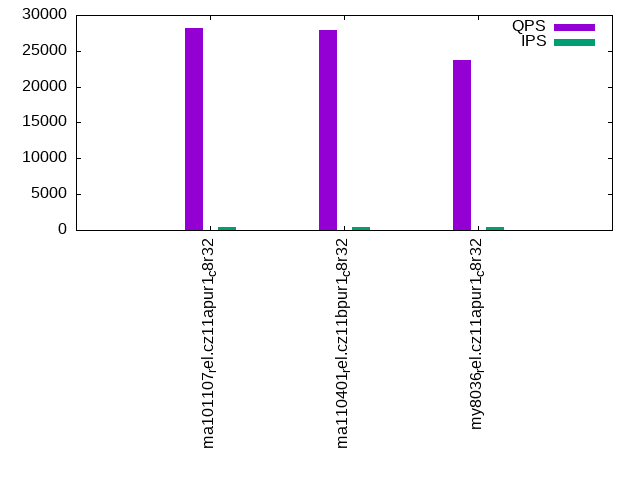
- qp100.L2: point queries with 100 insert/s per client
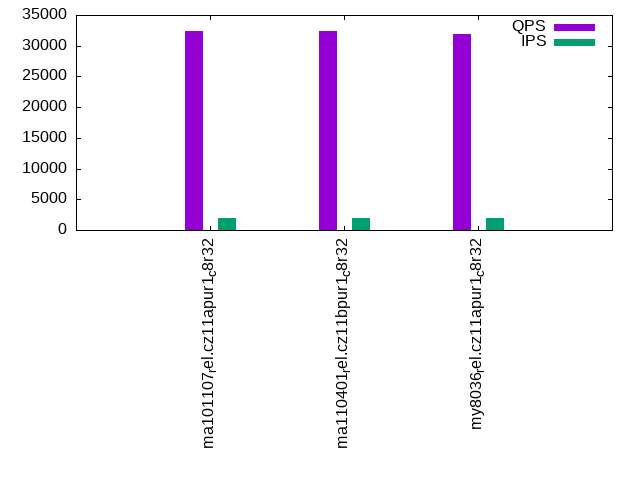
- qr500.L3: range queries with 500 insert/s per client
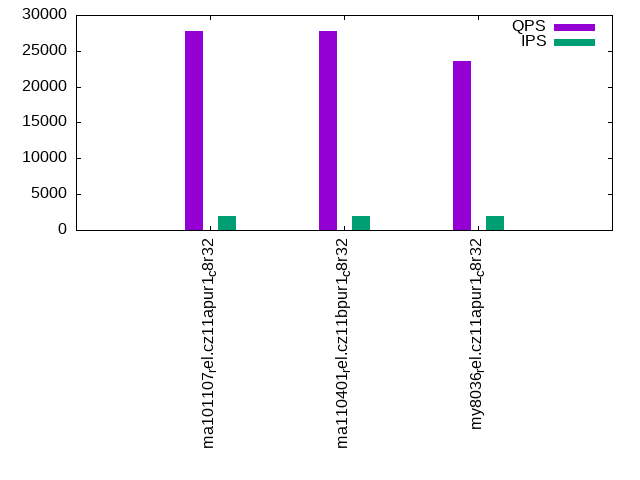
- qp500.L4: point queries with 500 insert/s per client
- qr1000.L5: range queries with 1000 insert/s per client
- qp1000.L6: point queries with 1000 insert/s per client
Summary
The numbers are inserts/s for l.i0, l.i1 and l.i2, indexed docs (or rows) /s for l.x and queries/s for qr100, qp100 thru qr1000, qp1000" The values are the average rate over the entire test for inserts (IPS) and queries (QPS). The range of values for IPS and QPS is split into 3 parts: bottom 25%, middle 50%, top 25%. Values in the bottom 25% have a red background, values in the top 25% have a green background and values in the middle have no color. A gray background is used for values that can be ignored because the DBMS did not sustain the target insert rate. Red backgrounds are not used when the minimum value is within 80% of the max value.
| dbms | l.i0 | l.x | l.i1 | l.i2 | qr100 | qp100 | qr500 | qp500 | qr1000 | qp1000 |
|---|---|---|---|---|---|---|---|---|---|---|
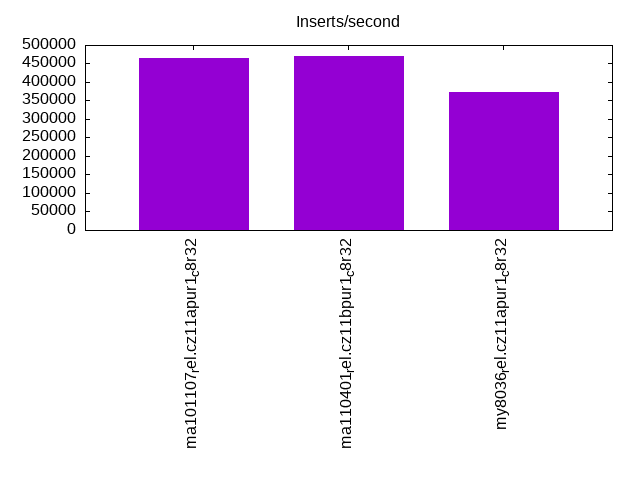
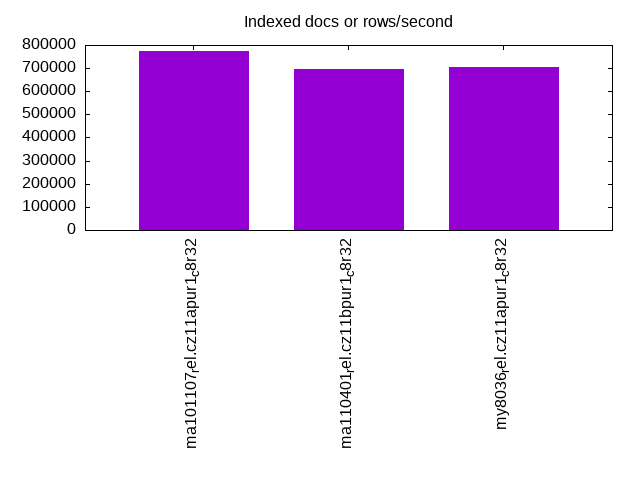
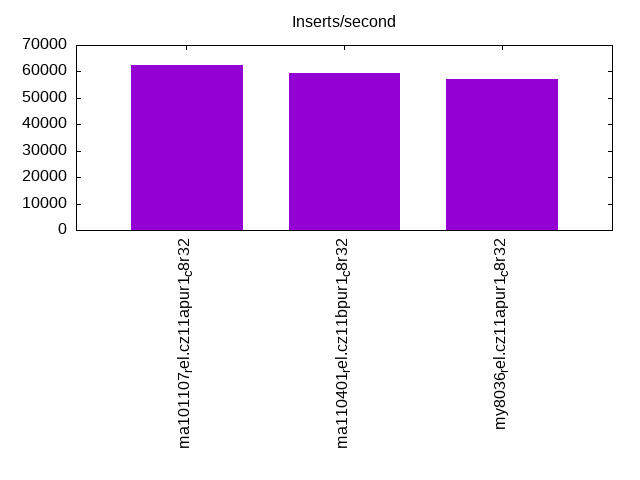
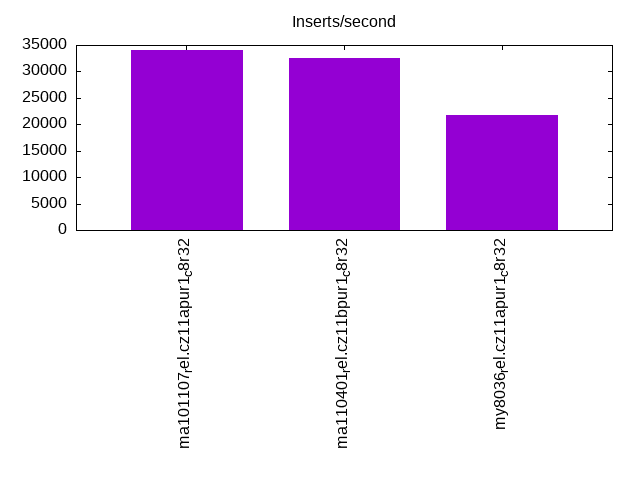
| ma101107_rel.cz11apur1_c8r32 | 466019 | 774195 | 62530 | 34115 | 32921 | 28142 | 32371 | 27836 | 31977 | 27367 |
| ma110401_rel.cz11bpur1_c8r32 | 470588 | 695654 | 59452 | 32620 | 32774 | 27960 | 32452 | 27740 | 31931 | 27384 |
| my8036_rel.cz11apur1_c8r32 | 372093 | 705884 | 57296 | 21813 | 31955 | 23736 | 31840 | 23571 | 31321 | 23278 |
This table has relative throughput, throughput for the DBMS relative to the DBMS in the first line, using the absolute throughput from the previous table. Values less than 0.95 have a yellow background. Values greater than 1.05 have a blue background.
| dbms | l.i0 | l.x | l.i1 | l.i2 | qr100 | qp100 | qr500 | qp500 | qr1000 | qp1000 |
|---|---|---|---|---|---|---|---|---|---|---|
| ma101107_rel.cz11apur1_c8r32 | 1.00 | 1.00 | 1.00 | 1.00 | 1.00 | 1.00 | 1.00 | 1.00 | 1.00 | 1.00 |
| ma110401_rel.cz11bpur1_c8r32 | 1.01 | 0.90 | 0.95 | 0.96 | 1.00 | 0.99 | 1.00 | 1.00 | 1.00 | 1.00 |
| my8036_rel.cz11apur1_c8r32 | 0.80 | 0.91 | 0.92 | 0.64 | 0.97 | 0.84 | 0.98 | 0.85 | 0.98 | 0.85 |
This lists the average rate of inserts/s for the tests that do inserts concurrent with queries. For such tests the query rate is listed in the table above. The read+write tests are setup so that the insert rate should match the target rate every second. Cells that are not at least 95% of the target have a red background to indicate a failure to satisfy the target.
| dbms | qr100.L1 | qp100.L2 | qr500.L3 | qp500.L4 | qr1000.L5 | qp1000.L6 |
|---|---|---|---|---|---|---|
| ma101107_rel.cz11apur1_c8r32 | 399 | 399 | 1993 | 1994 | 3989 | 3989 |
| ma110401_rel.cz11bpur1_c8r32 | 399 | 399 | 1994 | 1994 | 3987 | 3987 |
| my8036_rel.cz11apur1_c8r32 | 399 | 399 | 1993 | 1994 | 3989 | 3989 |
| target | 400 | 400 | 2000 | 2000 | 4000 | 4000 |
l.i0
l.i0: load without secondary indexes. Graphs for performance per 1-second interval are here.
Average throughput:
Insert response time histogram: each cell has the percentage of responses that take <= the time in the header and max is the max response time in seconds. For the max column values in the top 25% of the range have a red background and in the bottom 25% of the range have a green background. The red background is not used when the min value is within 80% of the max value.
| dbms | 256us | 1ms | 4ms | 16ms | 64ms | 256ms | 1s | 4s | 16s | gt | max |
|---|---|---|---|---|---|---|---|---|---|---|---|
| ma101107_rel.cz11apur1_c8r32 | 89.152 | 10.508 | 0.305 | 0.018 | 0.017 | 0.182 | |||||
| ma110401_rel.cz11bpur1_c8r32 | 89.670 | 9.994 | 0.308 | 0.012 | 0.017 | 0.229 | |||||
| my8036_rel.cz11apur1_c8r32 | 97.095 | 2.449 | 0.361 | 0.086 | 0.010 | 0.144 |
Performance metrics for the DBMS listed above. Some are normalized by throughput, others are not. Legend for results is here.
ips	qps	rps	rmbps	wps	wmbps	rpq	rkbpq	wpi	wkbpi	csps	cpups	cspq	cpupq	dbgb1	dbgb2	rss	maxop	p50	p99	tag
466019	0	0	0.0	1888.0	120.0	0.000	0.000	0.004	0.264	48154	73.5	0.103	13	3.2	34.0	3.5	0.182	133358	109184	ma101107_rel.cz11apur1_c8r32
470588	0	0	0.0	1890.0	119.9	0.000	0.000	0.004	0.261	49993	73.8	0.106	13	3.2	34.0	3.5	0.229	132559	100694	ma110401_rel.cz11bpur1_c8r32
372093	0	0	0.0	1495.7	109.1	0.000	0.000	0.004	0.300	39412	64.1	0.106	14	3.2	33.8	5.1	0.144	103990	75168	my8036_rel.cz11apur1_c8r32
l.x
l.x: create secondary indexes.
Average throughput:
Performance metrics for the DBMS listed above. Some are normalized by throughput, others are not. Legend for results is here.
ips	qps	rps	rmbps	wps	wmbps	rpq	rkbpq	wpi	wkbpi	csps	cpups	cspq	cpupq	dbgb1	dbgb2	rss	maxop	p50	p99	tag
774195	0	0	0.0	6633.6	568.1	0.000	0.000	0.009	0.751	11080	45.1	0.014	5	7.2	38.0	7.1	0.001	NA	NA	ma101107_rel.cz11apur1_c8r32
695654	0	0	0.0	6391.3	533.4	0.000	0.000	0.009	0.785	11455	44.4	0.016	5	7.2	38.0	6.6	1.843	NA	NA	ma110401_rel.cz11bpur1_c8r32
705884	0	3774	236.1	12784.3	744.9	0.005	0.342	0.018	1.081	35942	89.6	0.051	10	7.3	37.9	7.7	0.004	NA	NA	my8036_rel.cz11apur1_c8r32
l.i1
l.i1: continue load after secondary indexes created with 50 inserts per transaction. Graphs for performance per 1-second interval are here.
Average throughput:
Insert response time histogram: each cell has the percentage of responses that take <= the time in the header and max is the max response time in seconds. For the max column values in the top 25% of the range have a red background and in the bottom 25% of the range have a green background. The red background is not used when the min value is within 80% of the max value.
| dbms | 256us | 1ms | 4ms | 16ms | 64ms | 256ms | 1s | 4s | 16s | gt | max |
|---|---|---|---|---|---|---|---|---|---|---|---|
| ma101107_rel.cz11apur1_c8r32 | 6.033 | 91.772 | 1.527 | 0.057 | 0.057 | 0.554 | 0.323 | ||||
| ma110401_rel.cz11bpur1_c8r32 | 14.169 | 82.965 | 1.953 | 0.252 | 0.077 | 0.584 | 0.390 | ||||
| my8036_rel.cz11apur1_c8r32 | 95.412 | 2.933 | 0.134 | 1.520 | 0.141 |
Delete response time histogram: each cell has the percentage of responses that take <= the time in the header and max is the max response time in seconds. For the max column values in the top 25% of the range have a red background and in the bottom 25% of the range have a green background. The red background is not used when the min value is within 80% of the max value.
| dbms | 256us | 1ms | 4ms | 16ms | 64ms | 256ms | 1s | 4s | 16s | gt | max |
|---|---|---|---|---|---|---|---|---|---|---|---|
| ma101107_rel.cz11apur1_c8r32 | 34.696 | 63.206 | 1.440 | 0.048 | 0.068 | 0.542 | 0.322 | ||||
| ma110401_rel.cz11bpur1_c8r32 | 42.335 | 54.953 | 1.827 | 0.226 | 0.087 | 0.572 | 0.372 | ||||
| my8036_rel.cz11apur1_c8r32 | 14.134 | 81.348 | 2.928 | 0.108 | 1.483 | 0.140 |
Performance metrics for the DBMS listed above. Some are normalized by throughput, others are not. Legend for results is here.
ips	qps	rps	rmbps	wps	wmbps	rpq	rkbpq	wpi	wkbpi	csps	cpups	cspq	cpupq	dbgb1	dbgb2	rss	maxop	p50	p99	tag
62530	0	1502	5.9	5446.6	168.8	0.024	0.096	0.087	2.764	53375	49.0	0.854	63	12.8	45.0	14.2	0.323	18138	150	ma101107_rel.cz11apur1_c8r32
59452	0	1471	5.7	5380.3	160.8	0.025	0.099	0.090	2.770	52506	46.2	0.883	62	12.9	45.0	14.2	0.390	14485	150	ma110401_rel.cz11bpur1_c8r32
57296	0	104	1.6	4548.7	154.1	0.002	0.029	0.079	2.754	29265	52.8	0.511	74	13.0	44.9	15.9	0.141	14284	7492	my8036_rel.cz11apur1_c8r32
l.i2
l.i2: continue load after secondary indexes created with 5 inserts per transaction. Graphs for performance per 1-second interval are here.
Average throughput:
Insert response time histogram: each cell has the percentage of responses that take <= the time in the header and max is the max response time in seconds. For the max column values in the top 25% of the range have a red background and in the bottom 25% of the range have a green background. The red background is not used when the min value is within 80% of the max value.
| dbms | 256us | 1ms | 4ms | 16ms | 64ms | 256ms | 1s | 4s | 16s | gt | max |
|---|---|---|---|---|---|---|---|---|---|---|---|
| ma101107_rel.cz11apur1_c8r32 | 11.980 | 86.305 | 1.031 | 0.184 | 0.497 | 0.003 | 0.146 | ||||
| ma110401_rel.cz11bpur1_c8r32 | 17.777 | 80.342 | 0.913 | 0.347 | 0.618 | 0.003 | 0.142 | ||||
| my8036_rel.cz11apur1_c8r32 | 0.692 | 93.547 | 3.684 | 1.784 | 0.007 | 0.286 | 0.130 |
Delete response time histogram: each cell has the percentage of responses that take <= the time in the header and max is the max response time in seconds. For the max column values in the top 25% of the range have a red background and in the bottom 25% of the range have a green background. The red background is not used when the min value is within 80% of the max value.
| dbms | 256us | 1ms | 4ms | 16ms | 64ms | 256ms | 1s | 4s | 16s | gt | max |
|---|---|---|---|---|---|---|---|---|---|---|---|
| ma101107_rel.cz11apur1_c8r32 | 16.434 | 81.854 | 1.031 | 0.181 | 0.497 | 0.003 | 0.146 | ||||
| ma110401_rel.cz11bpur1_c8r32 | 21.802 | 76.348 | 0.912 | 0.318 | 0.617 | 0.003 | 0.142 | ||||
| my8036_rel.cz11apur1_c8r32 | 1.876 | 92.393 | 3.657 | 1.781 | 0.007 | 0.285 | 0.130 |
Performance metrics for the DBMS listed above. Some are normalized by throughput, others are not. Legend for results is here.
ips	qps	rps	rmbps	wps	wmbps	rpq	rkbpq	wpi	wkbpi	csps	cpups	cspq	cpupq	dbgb1	dbgb2	rss	maxop	p50	p99	tag
34115	0	4682	18.3	4205.9	144.1	0.137	0.549	0.123	4.325	142515	66.0	4.177	155	12.8	45.0	14.2	0.146	11088	160	ma101107_rel.cz11apur1_c8r32
32620	0	4426	17.3	4138.9	137.4	0.136	0.543	0.127	4.315	136772	62.3	4.193	153	12.9	45.0	14.2	0.142	11007	165	ma110401_rel.cz11bpur1_c8r32
21813	0	0	0.0	3167.2	108.3	0.000	0.000	0.145	5.086	76001	50.6	3.484	186	13.0	44.9	16.1	0.130	5932	909	my8036_rel.cz11apur1_c8r32
qr100.L1
qr100.L1: range queries with 100 insert/s per client. Graphs for performance per 1-second interval are here.
Average throughput:
Query response time histogram: each cell has the percentage of responses that take <= the time in the header and max is the max response time in seconds. For max values in the top 25% of the range have a red background and in the bottom 25% of the range have a green background. The red background is not used when the min value is within 80% of the max value.
| dbms | 256us | 1ms | 4ms | 16ms | 64ms | 256ms | 1s | 4s | 16s | gt | max |
|---|---|---|---|---|---|---|---|---|---|---|---|
| ma101107_rel.cz11apur1_c8r32 | 99.992 | 0.008 | 0.001 | 0.003 | |||||||
| ma110401_rel.cz11bpur1_c8r32 | 99.992 | 0.007 | 0.001 | 0.002 | |||||||
| my8036_rel.cz11apur1_c8r32 | 99.970 | 0.030 | nonzero | 0.002 |
Insert response time histogram: each cell has the percentage of responses that take <= the time in the header and max is the max response time in seconds. For max values in the top 25% of the range have a red background and in the bottom 25% of the range have a green background. The red background is not used when the min value is within 80% of the max value.
| dbms | 256us | 1ms | 4ms | 16ms | 64ms | 256ms | 1s | 4s | 16s | gt | max |
|---|---|---|---|---|---|---|---|---|---|---|---|
| ma101107_rel.cz11apur1_c8r32 | 1.424 | 57.028 | 41.549 | 0.012 | |||||||
| ma110401_rel.cz11bpur1_c8r32 | 1.146 | 52.660 | 46.194 | 0.012 | |||||||
| my8036_rel.cz11apur1_c8r32 | 99.542 | 0.451 | 0.007 | 0.102 |
Delete response time histogram: each cell has the percentage of responses that take <= the time in the header and max is the max response time in seconds. For max values in the top 25% of the range have a red background and in the bottom 25% of the range have a green background. The red background is not used when the min value is within 80% of the max value.
| dbms | 256us | 1ms | 4ms | 16ms | 64ms | 256ms | 1s | 4s | 16s | gt | max |
|---|---|---|---|---|---|---|---|---|---|---|---|
| ma101107_rel.cz11apur1_c8r32 | 13.514 | 44.944 | 41.542 | 0.012 | |||||||
| ma110401_rel.cz11bpur1_c8r32 | 10.632 | 43.188 | 46.181 | 0.011 | |||||||
| my8036_rel.cz11apur1_c8r32 | 48.785 | 50.847 | 0.354 | 0.007 | 0.007 | 0.101 |
Performance metrics for the DBMS listed above. Some are normalized by throughput, others are not. Legend for results is here.
ips	qps	rps	rmbps	wps	wmbps	rpq	rkbpq	wpi	wkbpi	csps	cpups	cspq	cpupq	dbgb1	dbgb2	rss	maxop	p50	p99	tag
399	32921	8	0.0	5.3	0.5	0.000	0.001	0.013	1.198	125819	52.1	3.822	127	12.8	45.0	13.9	0.003	8247	8122	ma101107_rel.cz11apur1_c8r32
399	32774	8	0.0	11.8	0.6	0.000	0.001	0.030	1.655	125317	52.2	3.824	127	12.9	45.0	13.9	0.002	8170	8087	ma110401_rel.cz11bpur1_c8r32
399	31955	0	0.0	593.3	15.2	0.000	0.000	1.488	39.012	123691	51.9	3.871	130	13.0	44.9	16.2	0.002	7991	7902	my8036_rel.cz11apur1_c8r32
qp100.L2
qp100.L2: point queries with 100 insert/s per client. Graphs for performance per 1-second interval are here.
Average throughput:
Query response time histogram: each cell has the percentage of responses that take <= the time in the header and max is the max response time in seconds. For max values in the top 25% of the range have a red background and in the bottom 25% of the range have a green background. The red background is not used when the min value is within 80% of the max value.
| dbms | 256us | 1ms | 4ms | 16ms | 64ms | 256ms | 1s | 4s | 16s | gt | max |
|---|---|---|---|---|---|---|---|---|---|---|---|
| ma101107_rel.cz11apur1_c8r32 | 99.939 | 0.061 | nonzero | 0.002 | |||||||
| ma110401_rel.cz11bpur1_c8r32 | 99.937 | 0.061 | 0.002 | 0.002 | |||||||
| my8036_rel.cz11apur1_c8r32 | 99.606 | 0.394 | nonzero | 0.002 |
Insert response time histogram: each cell has the percentage of responses that take <= the time in the header and max is the max response time in seconds. For max values in the top 25% of the range have a red background and in the bottom 25% of the range have a green background. The red background is not used when the min value is within 80% of the max value.
| dbms | 256us | 1ms | 4ms | 16ms | 64ms | 256ms | 1s | 4s | 16s | gt | max |
|---|---|---|---|---|---|---|---|---|---|---|---|
| ma101107_rel.cz11apur1_c8r32 | 11.361 | 87.250 | 1.389 | 0.013 | |||||||
| ma110401_rel.cz11bpur1_c8r32 | 0.521 | 54.153 | 45.326 | 0.012 | |||||||
| my8036_rel.cz11apur1_c8r32 | 99.882 | 0.097 | 0.021 | 0.023 |
Delete response time histogram: each cell has the percentage of responses that take <= the time in the header and max is the max response time in seconds. For max values in the top 25% of the range have a red background and in the bottom 25% of the range have a green background. The red background is not used when the min value is within 80% of the max value.
| dbms | 256us | 1ms | 4ms | 16ms | 64ms | 256ms | 1s | 4s | 16s | gt | max |
|---|---|---|---|---|---|---|---|---|---|---|---|
| ma101107_rel.cz11apur1_c8r32 | 68.299 | 30.250 | 1.451 | 0.012 | |||||||
| ma110401_rel.cz11bpur1_c8r32 | 5.729 | 48.611 | 45.660 | 0.012 | |||||||
| my8036_rel.cz11apur1_c8r32 | 36.618 | 63.264 | 0.097 | 0.021 | 0.023 |
Performance metrics for the DBMS listed above. Some are normalized by throughput, others are not. Legend for results is here.
ips	qps	rps	rmbps	wps	wmbps	rpq	rkbpq	wpi	wkbpi	csps	cpups	cspq	cpupq	dbgb1	dbgb2	rss	maxop	p50	p99	tag
399	28142	0	0.0	23.7	1.0	0.000	0.000	0.059	2.440	112321	52.0	3.991	148	12.8	45.0	13.9	0.002	7032	6953	ma101107_rel.cz11apur1_c8r32
399	27960	8	0.0	11.5	0.6	0.000	0.001	0.029	1.567	111543	51.9	3.989	149	12.9	45.0	13.9	0.002	6987	6907	ma110401_rel.cz11bpur1_c8r32
399	23736	0	0.0	66.6	2.1	0.000	0.000	0.167	5.295	94969	51.2	4.001	173	13.0	44.9	16.2	0.002	5930	5866	my8036_rel.cz11apur1_c8r32
qr500.L3
qr500.L3: range queries with 500 insert/s per client. Graphs for performance per 1-second interval are here.
Average throughput:
Query response time histogram: each cell has the percentage of responses that take <= the time in the header and max is the max response time in seconds. For max values in the top 25% of the range have a red background and in the bottom 25% of the range have a green background. The red background is not used when the min value is within 80% of the max value.
| dbms | 256us | 1ms | 4ms | 16ms | 64ms | 256ms | 1s | 4s | 16s | gt | max |
|---|---|---|---|---|---|---|---|---|---|---|---|
| ma101107_rel.cz11apur1_c8r32 | 99.954 | 0.036 | 0.010 | nonzero | nonzero | 0.022 | |||||
| ma110401_rel.cz11bpur1_c8r32 | 99.950 | 0.038 | 0.013 | nonzero | nonzero | 0.016 | |||||
| my8036_rel.cz11apur1_c8r32 | 99.976 | 0.022 | 0.002 | nonzero | 0.010 |
Insert response time histogram: each cell has the percentage of responses that take <= the time in the header and max is the max response time in seconds. For max values in the top 25% of the range have a red background and in the bottom 25% of the range have a green background. The red background is not used when the min value is within 80% of the max value.
| dbms | 256us | 1ms | 4ms | 16ms | 64ms | 256ms | 1s | 4s | 16s | gt | max |
|---|---|---|---|---|---|---|---|---|---|---|---|
| ma101107_rel.cz11apur1_c8r32 | 7.587 | 86.171 | 6.229 | 0.013 | 0.028 | ||||||
| ma110401_rel.cz11bpur1_c8r32 | 2.461 | 87.375 | 10.143 | 0.021 | 0.062 | ||||||
| my8036_rel.cz11apur1_c8r32 | 97.496 | 2.297 | 0.043 | 0.164 | 0.107 |
Delete response time histogram: each cell has the percentage of responses that take <= the time in the header and max is the max response time in seconds. For max values in the top 25% of the range have a red background and in the bottom 25% of the range have a green background. The red background is not used when the min value is within 80% of the max value.
| dbms | 256us | 1ms | 4ms | 16ms | 64ms | 256ms | 1s | 4s | 16s | gt | max |
|---|---|---|---|---|---|---|---|---|---|---|---|
| ma101107_rel.cz11apur1_c8r32 | 38.828 | 55.560 | 5.603 | 0.010 | 0.027 | ||||||
| ma110401_rel.cz11bpur1_c8r32 | 17.339 | 73.460 | 9.188 | 0.014 | 0.032 | ||||||
| my8036_rel.cz11apur1_c8r32 | 53.478 | 44.490 | 1.864 | 0.024 | 0.144 | 0.107 |
Performance metrics for the DBMS listed above. Some are normalized by throughput, others are not. Legend for results is here.
ips	qps	rps	rmbps	wps	wmbps	rpq	rkbpq	wpi	wkbpi	csps	cpups	cspq	cpupq	dbgb1	dbgb2	rss	maxop	p50	p99	tag
1993	32371	57	0.2	162.1	5.9	0.002	0.007	0.081	3.047	124628	53.3	3.850	132	12.8	45.0	13.9	0.022	8087	7895	ma101107_rel.cz11apur1_c8r32
1994	32452	57	0.2	168.2	6.0	0.002	0.007	0.084	3.056	124845	53.3	3.847	131	12.9	45.0	13.9	0.016	8103	7817	ma110401_rel.cz11bpur1_c8r32
1993	31840	0	0.0	363.8	11.2	0.000	0.000	0.183	5.768	121963	53.1	3.831	133	13.0	44.9	16.2	0.010	7928	7866	my8036_rel.cz11apur1_c8r32
qp500.L4
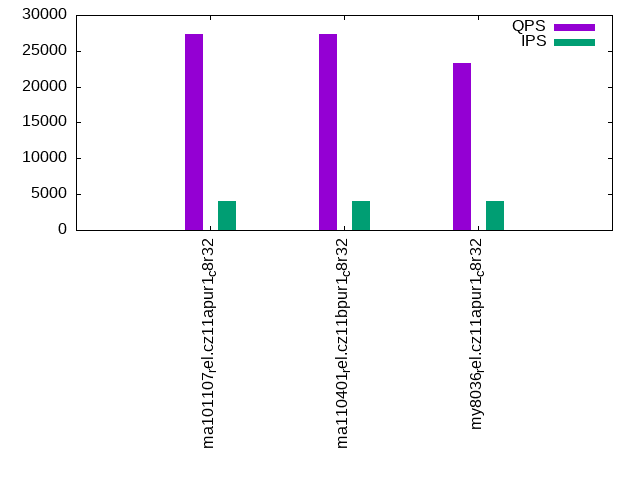
qp500.L4: point queries with 500 insert/s per client. Graphs for performance per 1-second interval are here.
Average throughput:
Query response time histogram: each cell has the percentage of responses that take <= the time in the header and max is the max response time in seconds. For max values in the top 25% of the range have a red background and in the bottom 25% of the range have a green background. The red background is not used when the min value is within 80% of the max value.
| dbms | 256us | 1ms | 4ms | 16ms | 64ms | 256ms | 1s | 4s | 16s | gt | max |
|---|---|---|---|---|---|---|---|---|---|---|---|
| ma101107_rel.cz11apur1_c8r32 | 99.887 | 0.097 | 0.016 | nonzero | 0.008 | ||||||
| ma110401_rel.cz11bpur1_c8r32 | 99.889 | 0.096 | 0.015 | nonzero | 0.011 | ||||||
| my8036_rel.cz11apur1_c8r32 | 99.604 | 0.391 | 0.005 | 0.001 | 0.013 |
Insert response time histogram: each cell has the percentage of responses that take <= the time in the header and max is the max response time in seconds. For max values in the top 25% of the range have a red background and in the bottom 25% of the range have a green background. The red background is not used when the min value is within 80% of the max value.
| dbms | 256us | 1ms | 4ms | 16ms | 64ms | 256ms | 1s | 4s | 16s | gt | max |
|---|---|---|---|---|---|---|---|---|---|---|---|
| ma101107_rel.cz11apur1_c8r32 | 0.661 | 89.006 | 10.322 | 0.011 | 0.029 | ||||||
| ma110401_rel.cz11bpur1_c8r32 | 1.196 | 87.918 | 10.867 | 0.019 | 0.032 | ||||||
| my8036_rel.cz11apur1_c8r32 | 96.722 | 2.944 | 0.033 | 0.300 | 0.108 |
Delete response time histogram: each cell has the percentage of responses that take <= the time in the header and max is the max response time in seconds. For max values in the top 25% of the range have a red background and in the bottom 25% of the range have a green background. The red background is not used when the min value is within 80% of the max value.
| dbms | 256us | 1ms | 4ms | 16ms | 64ms | 256ms | 1s | 4s | 16s | gt | max |
|---|---|---|---|---|---|---|---|---|---|---|---|
| ma101107_rel.cz11apur1_c8r32 | 14.156 | 76.596 | 9.238 | 0.011 | 0.029 | ||||||
| ma110401_rel.cz11bpur1_c8r32 | 13.908 | 75.981 | 10.100 | 0.011 | 0.032 | ||||||
| my8036_rel.cz11apur1_c8r32 | 39.639 | 57.832 | 2.246 | 0.024 | 0.260 | 0.110 |
Performance metrics for the DBMS listed above. Some are normalized by throughput, others are not. Legend for results is here.
ips	qps	rps	rmbps	wps	wmbps	rpq	rkbpq	wpi	wkbpi	csps	cpups	cspq	cpupq	dbgb1	dbgb2	rss	maxop	p50	p99	tag
1994	27836	57	0.2	165.1	6.0	0.002	0.008	0.083	3.065	111952	53.1	4.022	153	12.8	45.0	13.9	0.008	6953	6841	ma101107_rel.cz11apur1_c8r32
1994	27740	56	0.2	170.7	6.0	0.002	0.008	0.086	3.083	111581	53.1	4.022	153	12.9	45.0	13.9	0.011	6936	6811	ma110401_rel.cz11bpur1_c8r32
1994	23571	0	0.0	351.4	11.0	0.000	0.000	0.176	5.630	94416	52.5	4.006	178	13.0	45.0	16.2	0.013	5914	5834	my8036_rel.cz11apur1_c8r32
qr1000.L5
qr1000.L5: range queries with 1000 insert/s per client. Graphs for performance per 1-second interval are here.
Average throughput:
Query response time histogram: each cell has the percentage of responses that take <= the time in the header and max is the max response time in seconds. For max values in the top 25% of the range have a red background and in the bottom 25% of the range have a green background. The red background is not used when the min value is within 80% of the max value.
| dbms | 256us | 1ms | 4ms | 16ms | 64ms | 256ms | 1s | 4s | 16s | gt | max |
|---|---|---|---|---|---|---|---|---|---|---|---|
| ma101107_rel.cz11apur1_c8r32 | 99.931 | 0.057 | 0.012 | nonzero | 0.012 | ||||||
| ma110401_rel.cz11bpur1_c8r32 | 99.942 | 0.050 | 0.008 | 0.001 | nonzero | 0.031 | |||||
| my8036_rel.cz11apur1_c8r32 | 99.940 | 0.050 | 0.009 | 0.001 | nonzero | 0.024 |
Insert response time histogram: each cell has the percentage of responses that take <= the time in the header and max is the max response time in seconds. For max values in the top 25% of the range have a red background and in the bottom 25% of the range have a green background. The red background is not used when the min value is within 80% of the max value.
| dbms | 256us | 1ms | 4ms | 16ms | 64ms | 256ms | 1s | 4s | 16s | gt | max |
|---|---|---|---|---|---|---|---|---|---|---|---|
| ma101107_rel.cz11apur1_c8r32 | 18.163 | 78.803 | 3.026 | 0.008 | 0.033 | ||||||
| ma110401_rel.cz11bpur1_c8r32 | 32.204 | 65.633 | 2.131 | 0.032 | 0.032 | ||||||
| my8036_rel.cz11apur1_c8r32 | 94.743 | 4.708 | 0.223 | 0.326 | 0.115 |
Delete response time histogram: each cell has the percentage of responses that take <= the time in the header and max is the max response time in seconds. For max values in the top 25% of the range have a red background and in the bottom 25% of the range have a green background. The red background is not used when the min value is within 80% of the max value.
| dbms | 256us | 1ms | 4ms | 16ms | 64ms | 256ms | 1s | 4s | 16s | gt | max |
|---|---|---|---|---|---|---|---|---|---|---|---|
| ma101107_rel.cz11apur1_c8r32 | 64.862 | 32.660 | 2.473 | 0.006 | 0.032 | ||||||
| ma110401_rel.cz11bpur1_c8r32 | 70.389 | 27.787 | 1.808 | 0.016 | 0.032 | ||||||
| my8036_rel.cz11apur1_c8r32 | 43.574 | 52.253 | 3.698 | 0.192 | 0.283 | 0.113 |
Performance metrics for the DBMS listed above. Some are normalized by throughput, others are not. Legend for results is here.
ips	qps	rps	rmbps	wps	wmbps	rpq	rkbpq	wpi	wkbpi	csps	cpups	cspq	cpupq	dbgb1	dbgb2	rss	maxop	p50	p99	tag
3989	31977	147	0.6	429.1	14.6	0.005	0.018	0.108	3.754	124707	54.7	3.900	137	12.8	45.0	13.9	0.012	8007	7832	ma101107_rel.cz11apur1_c8r32
3987	31931	125	0.5	446.8	14.8	0.004	0.016	0.112	3.794	124722	54.6	3.906	137	12.9	45.0	13.9	0.031	8039	7816	ma110401_rel.cz11bpur1_c8r32
3989	31321	0	0.0	753.6	23.2	0.000	0.000	0.189	5.966	119836	55.0	3.826	140	13.0	45.0	16.2	0.024	7832	7736	my8036_rel.cz11apur1_c8r32
qp1000.L6
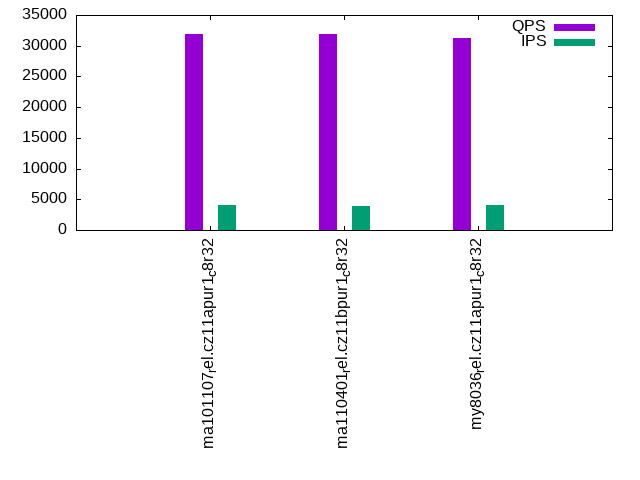
qp1000.L6: point queries with 1000 insert/s per client. Graphs for performance per 1-second interval are here.
Average throughput:
Query response time histogram: each cell has the percentage of responses that take <= the time in the header and max is the max response time in seconds. For max values in the top 25% of the range have a red background and in the bottom 25% of the range have a green background. The red background is not used when the min value is within 80% of the max value.
| dbms | 256us | 1ms | 4ms | 16ms | 64ms | 256ms | 1s | 4s | 16s | gt | max |
|---|---|---|---|---|---|---|---|---|---|---|---|
| ma101107_rel.cz11apur1_c8r32 | 99.873 | 0.117 | 0.010 | nonzero | nonzero | 0.016 | |||||
| ma110401_rel.cz11bpur1_c8r32 | 99.876 | 0.113 | 0.010 | nonzero | 0.016 | ||||||
| my8036_rel.cz11apur1_c8r32 | 99.499 | 0.478 | 0.021 | 0.002 | nonzero | 0.023 |
Insert response time histogram: each cell has the percentage of responses that take <= the time in the header and max is the max response time in seconds. For max values in the top 25% of the range have a red background and in the bottom 25% of the range have a green background. The red background is not used when the min value is within 80% of the max value.
| dbms | 256us | 1ms | 4ms | 16ms | 64ms | 256ms | 1s | 4s | 16s | gt | max |
|---|---|---|---|---|---|---|---|---|---|---|---|
| ma101107_rel.cz11apur1_c8r32 | 13.897 | 83.936 | 2.162 | 0.006 | 0.035 | ||||||
| ma110401_rel.cz11bpur1_c8r32 | 19.472 | 77.906 | 2.594 | 0.027 | 0.033 | ||||||
| my8036_rel.cz11apur1_c8r32 | 93.152 | 6.215 | 0.201 | 0.432 | 0.115 |
Delete response time histogram: each cell has the percentage of responses that take <= the time in the header and max is the max response time in seconds. For max values in the top 25% of the range have a red background and in the bottom 25% of the range have a green background. The red background is not used when the min value is within 80% of the max value.
| dbms | 256us | 1ms | 4ms | 16ms | 64ms | 256ms | 1s | 4s | 16s | gt | max |
|---|---|---|---|---|---|---|---|---|---|---|---|
| ma101107_rel.cz11apur1_c8r32 | 61.240 | 36.850 | 1.907 | 0.003 | 0.034 | ||||||
| ma110401_rel.cz11bpur1_c8r32 | 60.481 | 37.293 | 2.214 | 0.012 | 0.033 | ||||||
| my8036_rel.cz11apur1_c8r32 | 28.958 | 65.598 | 4.889 | 0.158 | 0.397 | 0.114 |
Performance metrics for the DBMS listed above. Some are normalized by throughput, others are not. Legend for results is here.
ips	qps	rps	rmbps	wps	wmbps	rpq	rkbpq	wpi	wkbpi	csps	cpups	cspq	cpupq	dbgb1	dbgb2	rss	maxop	p50	p99	tag
3989	27367	153	0.6	357.9	12.7	0.006	0.022	0.090	3.251	111758	54.8	4.084	160	12.8	45.0	13.9	0.016	6857	6745	ma101107_rel.cz11apur1_c8r32
3987	27384	149	0.6	358.5	12.5	0.005	0.022	0.090	3.203	111875	54.7	4.085	160	12.9	45.0	13.9	0.016	6841	6731	ma110401_rel.cz11bpur1_c8r32
3989	23278	0	0.0	747.0	23.1	0.000	0.000	0.187	5.933	93567	54.4	4.020	187	13.0	45.1	16.2	0.023	5834	5706	my8036_rel.cz11apur1_c8r32
l.i0
l.i0: load without secondary indexes
Performance metrics for all DBMS, not just the ones listed above. Some are normalized by throughput, others are not. Legend for results is here.
ips	qps	rps	rmbps	wps	wmbps	rpq	rkbpq	wpi	wkbpi	csps	cpups	cspq	cpupq	dbgb1	dbgb2	rss	maxop	p50	p99	tag
466019	0	0	0.0	1888.0	120.0	0.000	0.000	0.004	0.264	48154	73.5	0.103	13	3.2	34.0	3.5	0.182	133358	109184	ma101107_rel.cz11apur1_c8r32
470588	0	0	0.0	1890.0	119.9	0.000	0.000	0.004	0.261	49993	73.8	0.106	13	3.2	34.0	3.5	0.229	132559	100694	ma110401_rel.cz11bpur1_c8r32
372093	0	0	0.0	1495.7	109.1	0.000	0.000	0.004	0.300	39412	64.1	0.106	14	3.2	33.8	5.1	0.144	103990	75168	my8036_rel.cz11apur1_c8r32
l.x
l.x: create secondary indexes
Performance metrics for all DBMS, not just the ones listed above. Some are normalized by throughput, others are not. Legend for results is here.
ips	qps	rps	rmbps	wps	wmbps	rpq	rkbpq	wpi	wkbpi	csps	cpups	cspq	cpupq	dbgb1	dbgb2	rss	maxop	p50	p99	tag
774195	0	0	0.0	6633.6	568.1	0.000	0.000	0.009	0.751	11080	45.1	0.014	5	7.2	38.0	7.1	0.001	NA	NA	ma101107_rel.cz11apur1_c8r32
695654	0	0	0.0	6391.3	533.4	0.000	0.000	0.009	0.785	11455	44.4	0.016	5	7.2	38.0	6.6	1.843	NA	NA	ma110401_rel.cz11bpur1_c8r32
705884	0	3774	236.1	12784.3	744.9	0.005	0.342	0.018	1.081	35942	89.6	0.051	10	7.3	37.9	7.7	0.004	NA	NA	my8036_rel.cz11apur1_c8r32
l.i1
l.i1: continue load after secondary indexes created with 50 inserts per transaction
Performance metrics for all DBMS, not just the ones listed above. Some are normalized by throughput, others are not. Legend for results is here.
ips	qps	rps	rmbps	wps	wmbps	rpq	rkbpq	wpi	wkbpi	csps	cpups	cspq	cpupq	dbgb1	dbgb2	rss	maxop	p50	p99	tag
62530	0	1502	5.9	5446.6	168.8	0.024	0.096	0.087	2.764	53375	49.0	0.854	63	12.8	45.0	14.2	0.323	18138	150	ma101107_rel.cz11apur1_c8r32
59452	0	1471	5.7	5380.3	160.8	0.025	0.099	0.090	2.770	52506	46.2	0.883	62	12.9	45.0	14.2	0.390	14485	150	ma110401_rel.cz11bpur1_c8r32
57296	0	104	1.6	4548.7	154.1	0.002	0.029	0.079	2.754	29265	52.8	0.511	74	13.0	44.9	15.9	0.141	14284	7492	my8036_rel.cz11apur1_c8r32
l.i2
l.i2: continue load after secondary indexes created with 5 inserts per transaction
Performance metrics for all DBMS, not just the ones listed above. Some are normalized by throughput, others are not. Legend for results is here.
ips	qps	rps	rmbps	wps	wmbps	rpq	rkbpq	wpi	wkbpi	csps	cpups	cspq	cpupq	dbgb1	dbgb2	rss	maxop	p50	p99	tag
34115	0	4682	18.3	4205.9	144.1	0.137	0.549	0.123	4.325	142515	66.0	4.177	155	12.8	45.0	14.2	0.146	11088	160	ma101107_rel.cz11apur1_c8r32
32620	0	4426	17.3	4138.9	137.4	0.136	0.543	0.127	4.315	136772	62.3	4.193	153	12.9	45.0	14.2	0.142	11007	165	ma110401_rel.cz11bpur1_c8r32
21813	0	0	0.0	3167.2	108.3	0.000	0.000	0.145	5.086	76001	50.6	3.484	186	13.0	44.9	16.1	0.130	5932	909	my8036_rel.cz11apur1_c8r32
qr100.L1
qr100.L1: range queries with 100 insert/s per client
Performance metrics for all DBMS, not just the ones listed above. Some are normalized by throughput, others are not. Legend for results is here.
ips	qps	rps	rmbps	wps	wmbps	rpq	rkbpq	wpi	wkbpi	csps	cpups	cspq	cpupq	dbgb1	dbgb2	rss	maxop	p50	p99	tag
399	32921	8	0.0	5.3	0.5	0.000	0.001	0.013	1.198	125819	52.1	3.822	127	12.8	45.0	13.9	0.003	8247	8122	ma101107_rel.cz11apur1_c8r32
399	32774	8	0.0	11.8	0.6	0.000	0.001	0.030	1.655	125317	52.2	3.824	127	12.9	45.0	13.9	0.002	8170	8087	ma110401_rel.cz11bpur1_c8r32
399	31955	0	0.0	593.3	15.2	0.000	0.000	1.488	39.012	123691	51.9	3.871	130	13.0	44.9	16.2	0.002	7991	7902	my8036_rel.cz11apur1_c8r32
qp100.L2
qp100.L2: point queries with 100 insert/s per client
Performance metrics for all DBMS, not just the ones listed above. Some are normalized by throughput, others are not. Legend for results is here.
ips	qps	rps	rmbps	wps	wmbps	rpq	rkbpq	wpi	wkbpi	csps	cpups	cspq	cpupq	dbgb1	dbgb2	rss	maxop	p50	p99	tag
399	28142	0	0.0	23.7	1.0	0.000	0.000	0.059	2.440	112321	52.0	3.991	148	12.8	45.0	13.9	0.002	7032	6953	ma101107_rel.cz11apur1_c8r32
399	27960	8	0.0	11.5	0.6	0.000	0.001	0.029	1.567	111543	51.9	3.989	149	12.9	45.0	13.9	0.002	6987	6907	ma110401_rel.cz11bpur1_c8r32
399	23736	0	0.0	66.6	2.1	0.000	0.000	0.167	5.295	94969	51.2	4.001	173	13.0	44.9	16.2	0.002	5930	5866	my8036_rel.cz11apur1_c8r32
qr500.L3
qr500.L3: range queries with 500 insert/s per client
Performance metrics for all DBMS, not just the ones listed above. Some are normalized by throughput, others are not. Legend for results is here.
ips	qps	rps	rmbps	wps	wmbps	rpq	rkbpq	wpi	wkbpi	csps	cpups	cspq	cpupq	dbgb1	dbgb2	rss	maxop	p50	p99	tag
1993	32371	57	0.2	162.1	5.9	0.002	0.007	0.081	3.047	124628	53.3	3.850	132	12.8	45.0	13.9	0.022	8087	7895	ma101107_rel.cz11apur1_c8r32
1994	32452	57	0.2	168.2	6.0	0.002	0.007	0.084	3.056	124845	53.3	3.847	131	12.9	45.0	13.9	0.016	8103	7817	ma110401_rel.cz11bpur1_c8r32
1993	31840	0	0.0	363.8	11.2	0.000	0.000	0.183	5.768	121963	53.1	3.831	133	13.0	44.9	16.2	0.010	7928	7866	my8036_rel.cz11apur1_c8r32
qp500.L4
qp500.L4: point queries with 500 insert/s per client
Performance metrics for all DBMS, not just the ones listed above. Some are normalized by throughput, others are not. Legend for results is here.
ips	qps	rps	rmbps	wps	wmbps	rpq	rkbpq	wpi	wkbpi	csps	cpups	cspq	cpupq	dbgb1	dbgb2	rss	maxop	p50	p99	tag
1994	27836	57	0.2	165.1	6.0	0.002	0.008	0.083	3.065	111952	53.1	4.022	153	12.8	45.0	13.9	0.008	6953	6841	ma101107_rel.cz11apur1_c8r32
1994	27740	56	0.2	170.7	6.0	0.002	0.008	0.086	3.083	111581	53.1	4.022	153	12.9	45.0	13.9	0.011	6936	6811	ma110401_rel.cz11bpur1_c8r32
1994	23571	0	0.0	351.4	11.0	0.000	0.000	0.176	5.630	94416	52.5	4.006	178	13.0	45.0	16.2	0.013	5914	5834	my8036_rel.cz11apur1_c8r32
qr1000.L5
qr1000.L5: range queries with 1000 insert/s per client
Performance metrics for all DBMS, not just the ones listed above. Some are normalized by throughput, others are not. Legend for results is here.
ips	qps	rps	rmbps	wps	wmbps	rpq	rkbpq	wpi	wkbpi	csps	cpups	cspq	cpupq	dbgb1	dbgb2	rss	maxop	p50	p99	tag
3989	31977	147	0.6	429.1	14.6	0.005	0.018	0.108	3.754	124707	54.7	3.900	137	12.8	45.0	13.9	0.012	8007	7832	ma101107_rel.cz11apur1_c8r32
3987	31931	125	0.5	446.8	14.8	0.004	0.016	0.112	3.794	124722	54.6	3.906	137	12.9	45.0	13.9	0.031	8039	7816	ma110401_rel.cz11bpur1_c8r32
3989	31321	0	0.0	753.6	23.2	0.000	0.000	0.189	5.966	119836	55.0	3.826	140	13.0	45.0	16.2	0.024	7832	7736	my8036_rel.cz11apur1_c8r32
qp1000.L6
qp1000.L6: point queries with 1000 insert/s per client
Performance metrics for all DBMS, not just the ones listed above. Some are normalized by throughput, others are not. Legend for results is here.
ips	qps	rps	rmbps	wps	wmbps	rpq	rkbpq	wpi	wkbpi	csps	cpups	cspq	cpupq	dbgb1	dbgb2	rss	maxop	p50	p99	tag
3989	27367	153	0.6	357.9	12.7	0.006	0.022	0.090	3.251	111758	54.8	4.084	160	12.8	45.0	13.9	0.016	6857	6745	ma101107_rel.cz11apur1_c8r32
3987	27384	149	0.6	358.5	12.5	0.005	0.022	0.090	3.203	111875	54.7	4.085	160	12.9	45.0	13.9	0.016	6841	6731	ma110401_rel.cz11bpur1_c8r32
3989	23278	0	0.0	747.0	23.1	0.000	0.000	0.187	5.933	93567	54.4	4.020	187	13.0	45.1	16.2	0.023	5834	5706	my8036_rel.cz11apur1_c8r32
l.i0
- l.i0: load without secondary indexes
- Legend for results is here.
- Each entry lists the percentage of responses that fit in that bucket (slower than max time for previous bucket, faster than min time for next bucket).
Insert response time histogram
256us	1ms	4ms	16ms	64ms	256ms	1s	4s	16s	gt	max	tag
0.000	89.152	10.508	0.305	0.018	0.017	0.000	0.000	0.000	0.000	0.182	ma101107_rel.cz11apur1_c8r32
0.000	89.670	9.994	0.308	0.012	0.017	0.000	0.000	0.000	0.000	0.229	ma110401_rel.cz11bpur1_c8r32
0.000	97.095	2.449	0.361	0.086	0.010	0.000	0.000	0.000	0.000	0.144	my8036_rel.cz11apur1_c8r32
l.x
- l.x: create secondary indexes
- Legend for results is here.
- Each entry lists the percentage of responses that fit in that bucket (slower than max time for previous bucket, faster than min time for next bucket).
TODO - determine whether there is data for create index response time
l.i1
- l.i1: continue load after secondary indexes created with 50 inserts per transaction
- Legend for results is here.
- Each entry lists the percentage of responses that fit in that bucket (slower than max time for previous bucket, faster than min time for next bucket).
Insert response time histogram
256us	1ms	4ms	16ms	64ms	256ms	1s	4s	16s	gt	max	tag
0.000	6.033	91.772	1.527	0.057	0.057	0.554	0.000	0.000	0.000	0.323	ma101107_rel.cz11apur1_c8r32
0.000	14.169	82.965	1.953	0.252	0.077	0.584	0.000	0.000	0.000	0.390	ma110401_rel.cz11bpur1_c8r32
0.000	0.000	95.412	2.933	0.134	1.520	0.000	0.000	0.000	0.000	0.141	my8036_rel.cz11apur1_c8r32
Delete response time histogram
256us	1ms	4ms	16ms	64ms	256ms	1s	4s	16s	gt	max	tag
0.000	34.696	63.206	1.440	0.048	0.068	0.542	0.000	0.000	0.000	0.322	ma101107_rel.cz11apur1_c8r32
0.000	42.335	54.953	1.827	0.226	0.087	0.572	0.000	0.000	0.000	0.372	ma110401_rel.cz11bpur1_c8r32
0.000	14.134	81.348	2.928	0.108	1.483	0.000	0.000	0.000	0.000	0.140	my8036_rel.cz11apur1_c8r32
l.i2
- l.i2: continue load after secondary indexes created with 5 inserts per transaction
- Legend for results is here.
- Each entry lists the percentage of responses that fit in that bucket (slower than max time for previous bucket, faster than min time for next bucket).
Insert response time histogram
256us	1ms	4ms	16ms	64ms	256ms	1s	4s	16s	gt	max	tag
11.980	86.305	1.031	0.184	0.497	0.003	0.000	0.000	0.000	0.000	0.146	ma101107_rel.cz11apur1_c8r32
17.777	80.342	0.913	0.347	0.618	0.003	0.000	0.000	0.000	0.000	0.142	ma110401_rel.cz11bpur1_c8r32
0.692	93.547	3.684	1.784	0.007	0.286	0.000	0.000	0.000	0.000	0.130	my8036_rel.cz11apur1_c8r32
Delete response time histogram
256us	1ms	4ms	16ms	64ms	256ms	1s	4s	16s	gt	max	tag
16.434	81.854	1.031	0.181	0.497	0.003	0.000	0.000	0.000	0.000	0.146	ma101107_rel.cz11apur1_c8r32
21.802	76.348	0.912	0.318	0.617	0.003	0.000	0.000	0.000	0.000	0.142	ma110401_rel.cz11bpur1_c8r32
1.876	92.393	3.657	1.781	0.007	0.285	0.000	0.000	0.000	0.000	0.130	my8036_rel.cz11apur1_c8r32
qr100.L1
- qr100.L1: range queries with 100 insert/s per client
- Legend for results is here.
- Each entry lists the percentage of responses that fit in that bucket (slower than max time for previous bucket, faster than min time for next bucket).
Query response time histogram
256us	1ms	4ms	16ms	64ms	256ms	1s	4s	16s	gt	max	tag
99.992	0.008	0.001	0.000	0.000	0.000	0.000	0.000	0.000	0.000	0.003	ma101107_rel.cz11apur1_c8r32
99.992	0.007	0.001	0.000	0.000	0.000	0.000	0.000	0.000	0.000	0.002	ma110401_rel.cz11bpur1_c8r32
99.970	0.030	nonzero	0.000	0.000	0.000	0.000	0.000	0.000	0.000	0.002	my8036_rel.cz11apur1_c8r32
Insert response time histogram
256us	1ms	4ms	16ms	64ms	256ms	1s	4s	16s	gt	max	tag
0.000	1.424	57.028	41.549	0.000	0.000	0.000	0.000	0.000	0.000	0.012	ma101107_rel.cz11apur1_c8r32
0.000	1.146	52.660	46.194	0.000	0.000	0.000	0.000	0.000	0.000	0.012	ma110401_rel.cz11bpur1_c8r32
0.000	0.000	99.542	0.451	0.000	0.007	0.000	0.000	0.000	0.000	0.102	my8036_rel.cz11apur1_c8r32
Delete response time histogram
256us	1ms	4ms	16ms	64ms	256ms	1s	4s	16s	gt	max	tag
0.000	13.514	44.944	41.542	0.000	0.000	0.000	0.000	0.000	0.000	0.012	ma101107_rel.cz11apur1_c8r32
0.000	10.632	43.188	46.181	0.000	0.000	0.000	0.000	0.000	0.000	0.011	ma110401_rel.cz11bpur1_c8r32
0.000	48.785	50.847	0.354	0.007	0.007	0.000	0.000	0.000	0.000	0.101	my8036_rel.cz11apur1_c8r32
qp100.L2
- qp100.L2: point queries with 100 insert/s per client
- Legend for results is here.
- Each entry lists the percentage of responses that fit in that bucket (slower than max time for previous bucket, faster than min time for next bucket).
Query response time histogram
256us	1ms	4ms	16ms	64ms	256ms	1s	4s	16s	gt	max	tag
99.939	0.061	nonzero	0.000	0.000	0.000	0.000	0.000	0.000	0.000	0.002	ma101107_rel.cz11apur1_c8r32
99.937	0.061	0.002	0.000	0.000	0.000	0.000	0.000	0.000	0.000	0.002	ma110401_rel.cz11bpur1_c8r32
99.606	0.394	nonzero	0.000	0.000	0.000	0.000	0.000	0.000	0.000	0.002	my8036_rel.cz11apur1_c8r32
Insert response time histogram
256us	1ms	4ms	16ms	64ms	256ms	1s	4s	16s	gt	max	tag
0.000	11.361	87.250	1.389	0.000	0.000	0.000	0.000	0.000	0.000	0.013	ma101107_rel.cz11apur1_c8r32
0.000	0.521	54.153	45.326	0.000	0.000	0.000	0.000	0.000	0.000	0.012	ma110401_rel.cz11bpur1_c8r32
0.000	0.000	99.882	0.097	0.021	0.000	0.000	0.000	0.000	0.000	0.023	my8036_rel.cz11apur1_c8r32
Delete response time histogram
256us	1ms	4ms	16ms	64ms	256ms	1s	4s	16s	gt	max	tag
0.000	68.299	30.250	1.451	0.000	0.000	0.000	0.000	0.000	0.000	0.012	ma101107_rel.cz11apur1_c8r32
0.000	5.729	48.611	45.660	0.000	0.000	0.000	0.000	0.000	0.000	0.012	ma110401_rel.cz11bpur1_c8r32
0.000	36.618	63.264	0.097	0.021	0.000	0.000	0.000	0.000	0.000	0.023	my8036_rel.cz11apur1_c8r32
qr500.L3
- qr500.L3: range queries with 500 insert/s per client
- Legend for results is here.
- Each entry lists the percentage of responses that fit in that bucket (slower than max time for previous bucket, faster than min time for next bucket).
Query response time histogram
256us	1ms	4ms	16ms	64ms	256ms	1s	4s	16s	gt	max	tag
99.954	0.036	0.010	nonzero	nonzero	0.000	0.000	0.000	0.000	0.000	0.022	ma101107_rel.cz11apur1_c8r32
99.950	0.038	0.013	nonzero	nonzero	0.000	0.000	0.000	0.000	0.000	0.016	ma110401_rel.cz11bpur1_c8r32
99.976	0.022	0.002	nonzero	0.000	0.000	0.000	0.000	0.000	0.000	0.010	my8036_rel.cz11apur1_c8r32
Insert response time histogram
256us	1ms	4ms	16ms	64ms	256ms	1s	4s	16s	gt	max	tag
0.000	7.587	86.171	6.229	0.013	0.000	0.000	0.000	0.000	0.000	0.028	ma101107_rel.cz11apur1_c8r32
0.000	2.461	87.375	10.143	0.021	0.000	0.000	0.000	0.000	0.000	0.062	ma110401_rel.cz11bpur1_c8r32
0.000	0.000	97.496	2.297	0.043	0.164	0.000	0.000	0.000	0.000	0.107	my8036_rel.cz11apur1_c8r32
Delete response time histogram
256us	1ms	4ms	16ms	64ms	256ms	1s	4s	16s	gt	max	tag
0.000	38.828	55.560	5.603	0.010	0.000	0.000	0.000	0.000	0.000	0.027	ma101107_rel.cz11apur1_c8r32
0.000	17.339	73.460	9.188	0.014	0.000	0.000	0.000	0.000	0.000	0.032	ma110401_rel.cz11bpur1_c8r32
0.000	53.478	44.490	1.864	0.024	0.144	0.000	0.000	0.000	0.000	0.107	my8036_rel.cz11apur1_c8r32
qp500.L4
- qp500.L4: point queries with 500 insert/s per client
- Legend for results is here.
- Each entry lists the percentage of responses that fit in that bucket (slower than max time for previous bucket, faster than min time for next bucket).
Query response time histogram
256us	1ms	4ms	16ms	64ms	256ms	1s	4s	16s	gt	max	tag
99.887	0.097	0.016	nonzero	0.000	0.000	0.000	0.000	0.000	0.000	0.008	ma101107_rel.cz11apur1_c8r32
99.889	0.096	0.015	nonzero	0.000	0.000	0.000	0.000	0.000	0.000	0.011	ma110401_rel.cz11bpur1_c8r32
99.604	0.391	0.005	0.001	0.000	0.000	0.000	0.000	0.000	0.000	0.013	my8036_rel.cz11apur1_c8r32
Insert response time histogram
256us	1ms	4ms	16ms	64ms	256ms	1s	4s	16s	gt	max	tag
0.000	0.661	89.006	10.322	0.011	0.000	0.000	0.000	0.000	0.000	0.029	ma101107_rel.cz11apur1_c8r32
0.000	1.196	87.918	10.867	0.019	0.000	0.000	0.000	0.000	0.000	0.032	ma110401_rel.cz11bpur1_c8r32
0.000	0.000	96.722	2.944	0.033	0.300	0.000	0.000	0.000	0.000	0.108	my8036_rel.cz11apur1_c8r32
Delete response time histogram
256us	1ms	4ms	16ms	64ms	256ms	1s	4s	16s	gt	max	tag
0.000	14.156	76.596	9.238	0.011	0.000	0.000	0.000	0.000	0.000	0.029	ma101107_rel.cz11apur1_c8r32
0.000	13.908	75.981	10.100	0.011	0.000	0.000	0.000	0.000	0.000	0.032	ma110401_rel.cz11bpur1_c8r32
0.000	39.639	57.832	2.246	0.024	0.260	0.000	0.000	0.000	0.000	0.110	my8036_rel.cz11apur1_c8r32
qr1000.L5
- qr1000.L5: range queries with 1000 insert/s per client
- Legend for results is here.
- Each entry lists the percentage of responses that fit in that bucket (slower than max time for previous bucket, faster than min time for next bucket).
Query response time histogram
256us	1ms	4ms	16ms	64ms	256ms	1s	4s	16s	gt	max	tag
99.931	0.057	0.012	nonzero	0.000	0.000	0.000	0.000	0.000	0.000	0.012	ma101107_rel.cz11apur1_c8r32
99.942	0.050	0.008	0.001	nonzero	0.000	0.000	0.000	0.000	0.000	0.031	ma110401_rel.cz11bpur1_c8r32
99.940	0.050	0.009	0.001	nonzero	0.000	0.000	0.000	0.000	0.000	0.024	my8036_rel.cz11apur1_c8r32
Insert response time histogram
256us	1ms	4ms	16ms	64ms	256ms	1s	4s	16s	gt	max	tag
0.000	18.163	78.803	3.026	0.008	0.000	0.000	0.000	0.000	0.000	0.033	ma101107_rel.cz11apur1_c8r32
0.000	32.204	65.633	2.131	0.032	0.000	0.000	0.000	0.000	0.000	0.032	ma110401_rel.cz11bpur1_c8r32
0.000	0.000	94.743	4.708	0.223	0.326	0.000	0.000	0.000	0.000	0.115	my8036_rel.cz11apur1_c8r32
Delete response time histogram
256us	1ms	4ms	16ms	64ms	256ms	1s	4s	16s	gt	max	tag
0.000	64.862	32.660	2.473	0.006	0.000	0.000	0.000	0.000	0.000	0.032	ma101107_rel.cz11apur1_c8r32
0.000	70.389	27.787	1.808	0.016	0.000	0.000	0.000	0.000	0.000	0.032	ma110401_rel.cz11bpur1_c8r32
0.000	43.574	52.253	3.698	0.192	0.283	0.000	0.000	0.000	0.000	0.113	my8036_rel.cz11apur1_c8r32
qp1000.L6
- qp1000.L6: point queries with 1000 insert/s per client
- Legend for results is here.
- Each entry lists the percentage of responses that fit in that bucket (slower than max time for previous bucket, faster than min time for next bucket).
Query response time histogram
256us	1ms	4ms	16ms	64ms	256ms	1s	4s	16s	gt	max	tag
99.873	0.117	0.010	nonzero	nonzero	0.000	0.000	0.000	0.000	0.000	0.016	ma101107_rel.cz11apur1_c8r32
99.876	0.113	0.010	nonzero	0.000	0.000	0.000	0.000	0.000	0.000	0.016	ma110401_rel.cz11bpur1_c8r32
99.499	0.478	0.021	0.002	nonzero	0.000	0.000	0.000	0.000	0.000	0.023	my8036_rel.cz11apur1_c8r32
Insert response time histogram
256us	1ms	4ms	16ms	64ms	256ms	1s	4s	16s	gt	max	tag
0.000	13.897	83.936	2.162	0.006	0.000	0.000	0.000	0.000	0.000	0.035	ma101107_rel.cz11apur1_c8r32
0.000	19.472	77.906	2.594	0.027	0.000	0.000	0.000	0.000	0.000	0.033	ma110401_rel.cz11bpur1_c8r32
0.000	0.000	93.152	6.215	0.201	0.432	0.000	0.000	0.000	0.000	0.115	my8036_rel.cz11apur1_c8r32
Delete response time histogram
256us	1ms	4ms	16ms	64ms	256ms	1s	4s	16s	gt	max	tag
0.000	61.240	36.850	1.907	0.003	0.000	0.000	0.000	0.000	0.000	0.034	ma101107_rel.cz11apur1_c8r32
0.000	60.481	37.293	2.214	0.012	0.000	0.000	0.000	0.000	0.000	0.033	ma110401_rel.cz11bpur1_c8r32
0.000	28.958	65.598	4.889	0.158	0.397	0.000	0.000	0.000	0.000	0.114	my8036_rel.cz11apur1_c8r32