Introduction
This is a report for the insert benchmark with 48M docs and 4 client(s). It is generated by scripts (bash, awk, sed) and Tufte might not be impressed. An overview of the insert benchmark is here and a short update is here. Below, by DBMS, I mean DBMS+version.config. An example is my8020.c10b40 where my means MySQL, 8020 is version 8.0.20 and c10b40 is the name for the configuration file.
The test server has 8 AMD cores, 32G RAM and an NVMe SSD. It is described here as the ASUS PN53. The benchmark was run with 4 clients and there were 1 or 3 connections per client (1 for queries or inserts without rate limits, 1+1 for rate limited inserts+deletes). It uses 4 tables with a table per client. It loads 12M rows per table without secondary indexes, creates 3 secondary indexes per table, then inserts 40 rows per table with a delete per insert to avoid growing the table. It then does 6 read+write tests for 1800s each that do queries as fast as possible with 100,100,500,500,1000,1000 inserts/s and the same for deletes/s per client concurrent with the queries. The database is cached in memory. Clients and the DBMS share one server. The per-database configs are in the per-database subdirectories here.
The tested DBMS are:
- ma100244_rel.cz11apur1_c8r32 - MariaDB 10.2.44 with the cz11apur1_c8r32 config that uses innodb_purge_threads=1
- ma100339_rel.cz11apur1_c8r32 - MariaDB 10.3.39 with the cz11apur1_c8r32 config that uses innodb_purge_threads=1
- ma100433_rel.cz11apur1_c8r32 - MariaDB 10.4.33 with the cz11apur1_c8r32 config that uses innodb_purge_threads=1
- ma100524_rel.cz11apur1_c8r32 - MariaDB 10.5.24 with the cz11apur1_c8r32 config that uses innodb_purge_threads=1
- ma100617_rel.cz11apur1_c8r32 - MariaDB 10.6.17 with the cz11apur1_c8r32 config that uses innodb_purge_threads=1
- ma101107_rel.cz11apur1_c8r32 - MariaDB 10.11.7 with the cz11apur1_c8r32 config that uses innodb_purge_threads=1
- ma110401_rel.cz11bpur1_c8r32 - MariaDB 11.4.1 with the cz11apur1_c8r32 config that uses innodb_purge_threads=1
Contents
- Summary
- l.i0: load without secondary indexes
- l.x: create secondary indexes
- l.i1: continue load after secondary indexes created with 50 inserts per transaction
- l.i2: continue load after secondary indexes created with 5 inserts per transaction
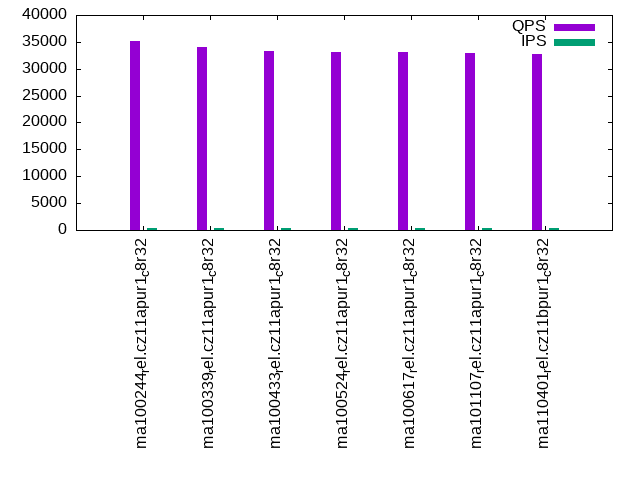
- qr100.L1: range queries with 100 insert/s per client
- qp100.L2: point queries with 100 insert/s per client
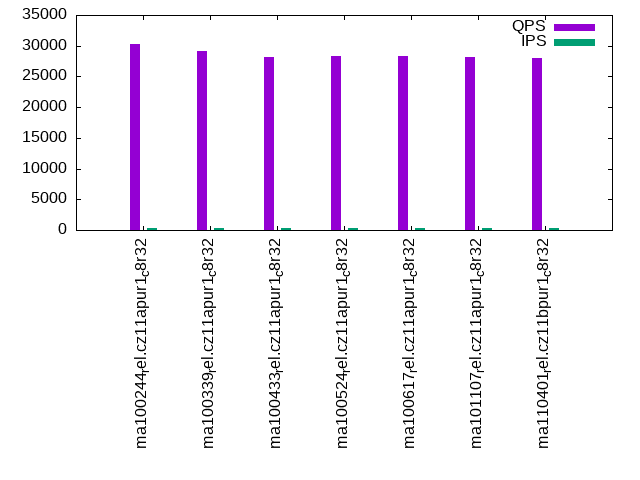
- qr500.L3: range queries with 500 insert/s per client
- qp500.L4: point queries with 500 insert/s per client
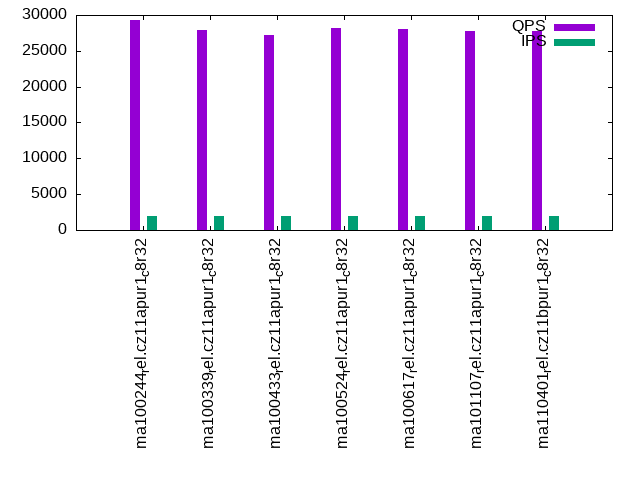
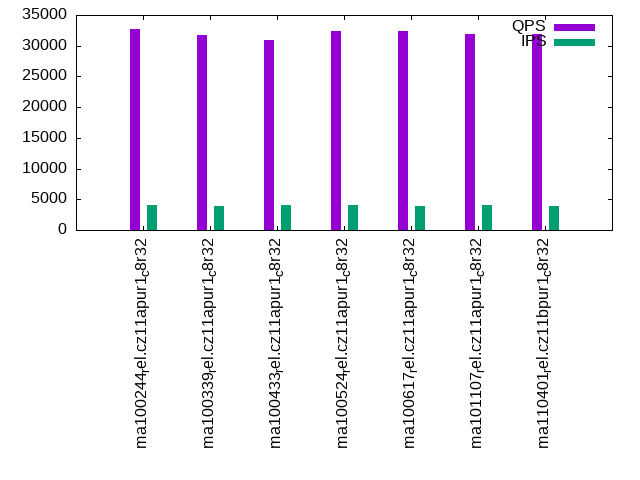
- qr1000.L5: range queries with 1000 insert/s per client
- qp1000.L6: point queries with 1000 insert/s per client
Summary
The numbers are inserts/s for l.i0, l.i1 and l.i2, indexed docs (or rows) /s for l.x and queries/s for qr100, qp100 thru qr1000, qp1000" The values are the average rate over the entire test for inserts (IPS) and queries (QPS). The range of values for IPS and QPS is split into 3 parts: bottom 25%, middle 50%, top 25%. Values in the bottom 25% have a red background, values in the top 25% have a green background and values in the middle have no color. A gray background is used for values that can be ignored because the DBMS did not sustain the target insert rate. Red backgrounds are not used when the minimum value is within 80% of the max value.
| dbms | l.i0 | l.x | l.i1 | l.i2 | qr100 | qp100 | qr500 | qp500 | qr1000 | qp1000 |
|---|---|---|---|---|---|---|---|---|---|---|
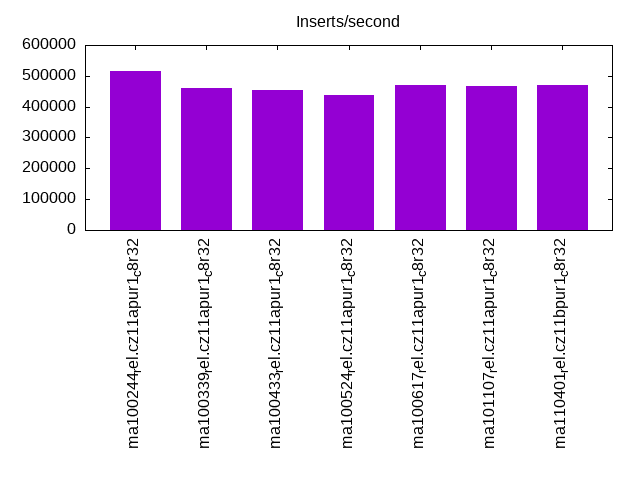
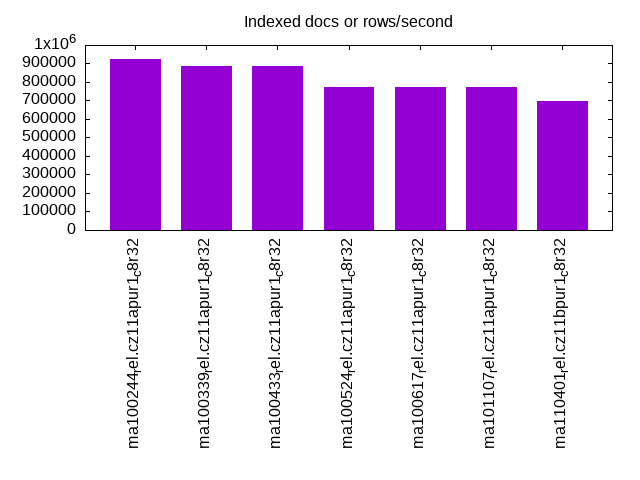
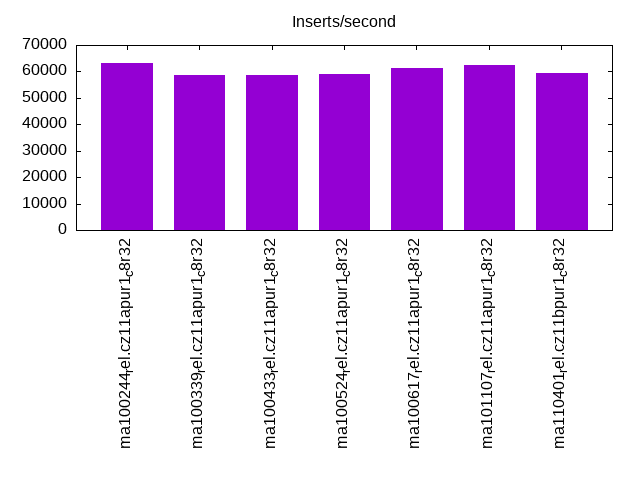
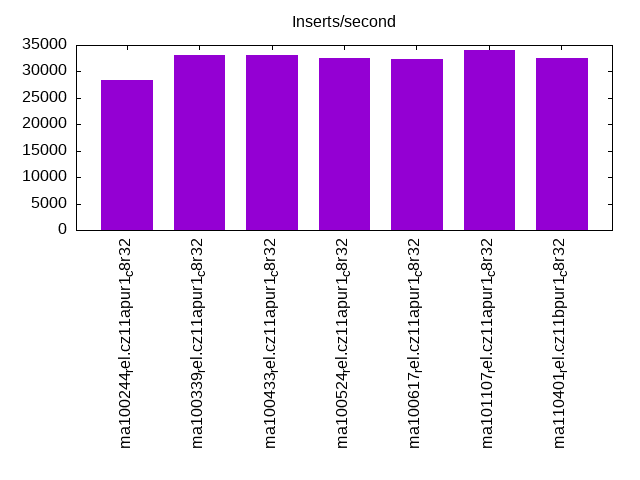
| ma100244_rel.cz11apur1_c8r32 | 516129 | 923079 | 63272 | 28318 | 35182 | 30315 | 33522 | 29242 | 32762 | 28626 |
| ma100339_rel.cz11apur1_c8r32 | 461538 | 888891 | 58770 | 33195 | 34085 | 29098 | 32559 | 27932 | 31813 | 27463 |
| ma100433_rel.cz11apur1_c8r32 | 452830 | 888891 | 58608 | 33195 | 33318 | 28215 | 31687 | 27243 | 30919 | 26799 |
| ma100524_rel.cz11apur1_c8r32 | 436364 | 774195 | 59095 | 32553 | 33180 | 28390 | 32803 | 28117 | 32448 | 28001 |
| ma100617_rel.cz11apur1_c8r32 | 470588 | 774195 | 61391 | 32258 | 33143 | 28264 | 32893 | 28038 | 32471 | 27770 |
| ma101107_rel.cz11apur1_c8r32 | 466019 | 774195 | 62530 | 34115 | 32921 | 28142 | 32371 | 27836 | 31977 | 27367 |
| ma110401_rel.cz11bpur1_c8r32 | 470588 | 695654 | 59452 | 32620 | 32774 | 27960 | 32452 | 27740 | 31931 | 27384 |
This table has relative throughput, throughput for the DBMS relative to the DBMS in the first line, using the absolute throughput from the previous table. Values less than 0.95 have a yellow background. Values greater than 1.05 have a blue background.
| dbms | l.i0 | l.x | l.i1 | l.i2 | qr100 | qp100 | qr500 | qp500 | qr1000 | qp1000 |
|---|---|---|---|---|---|---|---|---|---|---|
| ma100244_rel.cz11apur1_c8r32 | 1.00 | 1.00 | 1.00 | 1.00 | 1.00 | 1.00 | 1.00 | 1.00 | 1.00 | 1.00 |
| ma100339_rel.cz11apur1_c8r32 | 0.89 | 0.96 | 0.93 | 1.17 | 0.97 | 0.96 | 0.97 | 0.96 | 0.97 | 0.96 |
| ma100433_rel.cz11apur1_c8r32 | 0.88 | 0.96 | 0.93 | 1.17 | 0.95 | 0.93 | 0.95 | 0.93 | 0.94 | 0.94 |
| ma100524_rel.cz11apur1_c8r32 | 0.85 | 0.84 | 0.93 | 1.15 | 0.94 | 0.94 | 0.98 | 0.96 | 0.99 | 0.98 |
| ma100617_rel.cz11apur1_c8r32 | 0.91 | 0.84 | 0.97 | 1.14 | 0.94 | 0.93 | 0.98 | 0.96 | 0.99 | 0.97 |
| ma101107_rel.cz11apur1_c8r32 | 0.90 | 0.84 | 0.99 | 1.20 | 0.94 | 0.93 | 0.97 | 0.95 | 0.98 | 0.96 |
| ma110401_rel.cz11bpur1_c8r32 | 0.91 | 0.75 | 0.94 | 1.15 | 0.93 | 0.92 | 0.97 | 0.95 | 0.97 | 0.96 |
This lists the average rate of inserts/s for the tests that do inserts concurrent with queries. For such tests the query rate is listed in the table above. The read+write tests are setup so that the insert rate should match the target rate every second. Cells that are not at least 95% of the target have a red background to indicate a failure to satisfy the target.
| dbms | qr100.L1 | qp100.L2 | qr500.L3 | qp500.L4 | qr1000.L5 | qp1000.L6 |
|---|---|---|---|---|---|---|
| ma100244_rel.cz11apur1_c8r32 | 399 | 399 | 1994 | 1994 | 3989 | 3989 |
| ma100339_rel.cz11apur1_c8r32 | 399 | 399 | 1994 | 1994 | 3987 | 3989 |
| ma100433_rel.cz11apur1_c8r32 | 399 | 399 | 1994 | 1993 | 3989 | 3989 |
| ma100524_rel.cz11apur1_c8r32 | 399 | 399 | 1994 | 1994 | 3989 | 3989 |
| ma100617_rel.cz11apur1_c8r32 | 399 | 399 | 1994 | 1994 | 3987 | 3987 |
| ma101107_rel.cz11apur1_c8r32 | 399 | 399 | 1993 | 1994 | 3989 | 3989 |
| ma110401_rel.cz11bpur1_c8r32 | 399 | 399 | 1994 | 1994 | 3987 | 3987 |
| target | 400 | 400 | 2000 | 2000 | 4000 | 4000 |
l.i0
l.i0: load without secondary indexes. Graphs for performance per 1-second interval are here.
Average throughput:
Insert response time histogram: each cell has the percentage of responses that take <= the time in the header and max is the max response time in seconds. For the max column values in the top 25% of the range have a red background and in the bottom 25% of the range have a green background. The red background is not used when the min value is within 80% of the max value.
| dbms | 256us | 1ms | 4ms | 16ms | 64ms | 256ms | 1s | 4s | 16s | gt | max |
|---|---|---|---|---|---|---|---|---|---|---|---|
| ma100244_rel.cz11apur1_c8r32 | 97.470 | 2.196 | 0.307 | 0.011 | 0.016 | 0.153 | |||||
| ma100339_rel.cz11apur1_c8r32 | 94.629 | 5.017 | 0.321 | 0.017 | 0.016 | 0.136 | |||||
| ma100433_rel.cz11apur1_c8r32 | 95.271 | 4.370 | 0.328 | 0.014 | 0.016 | 0.131 | |||||
| ma100524_rel.cz11apur1_c8r32 | 91.725 | 7.660 | 0.484 | 0.100 | 0.031 | 0.126 | |||||
| ma100617_rel.cz11apur1_c8r32 | 92.357 | 7.297 | 0.311 | 0.017 | 0.018 | 0.181 | |||||
| ma101107_rel.cz11apur1_c8r32 | 89.152 | 10.508 | 0.305 | 0.018 | 0.017 | 0.182 | |||||
| ma110401_rel.cz11bpur1_c8r32 | 89.670 | 9.994 | 0.308 | 0.012 | 0.017 | 0.229 |
Performance metrics for the DBMS listed above. Some are normalized by throughput, others are not. Legend for results is here.
ips	qps	rps	rmbps	wps	wmbps	rpq	rkbpq	wpi	wkbpi	csps	cpups	cspq	cpupq	dbgb1	dbgb2	rss	maxop	p50	p99	tag
516129	0	1	0.0	2419.2	161.0	0.000	0.000	0.005	0.319	49142	71.1	0.095	11	3.2	34.0	4.1	0.153	150889	127264	ma100244_rel.cz11apur1_c8r32
461538	0	1	0.0	2431.2	157.4	0.000	0.000	0.005	0.349	38966	77.2	0.084	13	3.2	34.0	3.7	0.136	131660	108114	ma100339_rel.cz11apur1_c8r32
452830	0	1	0.0	2432.8	156.4	0.000	0.000	0.005	0.354	37185	72.8	0.082	13	3.2	34.0	NA	0.131	130996	109683	ma100433_rel.cz11apur1_c8r32
436364	0	0	0.0	3059.0	130.3	0.000	0.000	0.007	0.306	50283	68.6	0.115	13	3.2	34.0	3.4	0.126	124964	101929	ma100524_rel.cz11apur1_c8r32
470588	0	0	0.0	1799.3	115.4	0.000	0.000	0.004	0.251	52695	74.4	0.112	13	3.2	34.0	3.5	0.181	135191	108608	ma100617_rel.cz11apur1_c8r32
466019	0	0	0.0	1888.0	120.0	0.000	0.000	0.004	0.264	48154	73.5	0.103	13	3.2	34.0	3.5	0.182	133358	109184	ma101107_rel.cz11apur1_c8r32
470588	0	0	0.0	1890.0	119.9	0.000	0.000	0.004	0.261	49993	73.8	0.106	13	3.2	34.0	3.5	0.229	132559	100694	ma110401_rel.cz11bpur1_c8r32
l.x
l.x: create secondary indexes.
Average throughput:
Performance metrics for the DBMS listed above. Some are normalized by throughput, others are not. Legend for results is here.
ips	qps	rps	rmbps	wps	wmbps	rpq	rkbpq	wpi	wkbpi	csps	cpups	cspq	cpupq	dbgb1	dbgb2	rss	maxop	p50	p99	tag
923079	0	0	0.0	8655.1	739.8	0.000	0.000	0.009	0.821	34651	44.5	0.038	4	7.3	38.1	5.2	0.001	NA	NA	ma100244_rel.cz11apur1_c8r32
888891	0	0	0.0	8561.6	728.1	0.000	0.000	0.010	0.839	29937	45.1	0.034	4	7.3	38.1	5.1	0.002	NA	NA	ma100339_rel.cz11apur1_c8r32
888891	0	0	0.0	8628.1	731.4	0.000	0.000	0.010	0.843	30646	45.1	0.034	4	7.2	38.0	NA	0.002	NA	NA	ma100433_rel.cz11apur1_c8r32
774195	0	0	0.0	4353.6	538.2	0.000	0.000	0.006	0.712	883	44.3	0.001	5	7.2	38.0	7.5	0.001	NA	NA	ma100524_rel.cz11apur1_c8r32
774195	0	0	0.0	6980.5	581.3	0.000	0.000	0.009	0.769	12515	44.9	0.016	5	7.2	38.0	7.3	0.001	NA	NA	ma100617_rel.cz11apur1_c8r32
774195	0	0	0.0	6633.6	568.1	0.000	0.000	0.009	0.751	11080	45.1	0.014	5	7.2	38.0	7.1	0.001	NA	NA	ma101107_rel.cz11apur1_c8r32
695654	0	0	0.0	6391.3	533.4	0.000	0.000	0.009	0.785	11455	44.4	0.016	5	7.2	38.0	6.6	1.843	NA	NA	ma110401_rel.cz11bpur1_c8r32
l.i1
l.i1: continue load after secondary indexes created with 50 inserts per transaction. Graphs for performance per 1-second interval are here.
Average throughput:
Insert response time histogram: each cell has the percentage of responses that take <= the time in the header and max is the max response time in seconds. For the max column values in the top 25% of the range have a red background and in the bottom 25% of the range have a green background. The red background is not used when the min value is within 80% of the max value.
| dbms | 256us | 1ms | 4ms | 16ms | 64ms | 256ms | 1s | 4s | 16s | gt | max |
|---|---|---|---|---|---|---|---|---|---|---|---|
| ma100244_rel.cz11apur1_c8r32 | 0.096 | 89.937 | 9.509 | 0.131 | 0.177 | 0.151 | 0.276 | ||||
| ma100339_rel.cz11apur1_c8r32 | 0.558 | 91.447 | 7.365 | 0.091 | 0.269 | 0.270 | 0.339 | ||||
| ma100433_rel.cz11apur1_c8r32 | 0.360 | 91.769 | 7.236 | 0.087 | 0.232 | 0.317 | 0.274 | ||||
| ma100524_rel.cz11apur1_c8r32 | 1.888 | 96.085 | 1.272 | 0.052 | 0.377 | 0.327 | nonzero | 1.037 | |||
| ma100617_rel.cz11apur1_c8r32 | 6.274 | 91.505 | 1.494 | 0.066 | 0.087 | 0.574 | 0.361 | ||||
| ma101107_rel.cz11apur1_c8r32 | 6.033 | 91.772 | 1.527 | 0.057 | 0.057 | 0.554 | 0.323 | ||||
| ma110401_rel.cz11bpur1_c8r32 | 14.169 | 82.965 | 1.953 | 0.252 | 0.077 | 0.584 | 0.390 |
Delete response time histogram: each cell has the percentage of responses that take <= the time in the header and max is the max response time in seconds. For the max column values in the top 25% of the range have a red background and in the bottom 25% of the range have a green background. The red background is not used when the min value is within 80% of the max value.
| dbms | 256us | 1ms | 4ms | 16ms | 64ms | 256ms | 1s | 4s | 16s | gt | max |
|---|---|---|---|---|---|---|---|---|---|---|---|
| ma100244_rel.cz11apur1_c8r32 | 4.374 | 85.650 | 9.527 | 0.122 | 0.192 | 0.136 | 0.267 | ||||
| ma100339_rel.cz11apur1_c8r32 | 16.743 | 75.292 | 7.339 | 0.086 | 0.320 | 0.220 | 0.271 | ||||
| ma100433_rel.cz11apur1_c8r32 | 17.109 | 75.067 | 7.191 | 0.084 | 0.291 | 0.259 | 0.274 | ||||
| ma100524_rel.cz11apur1_c8r32 | 28.163 | 69.870 | 1.220 | 0.043 | 0.552 | 0.152 | 0.424 | ||||
| ma100617_rel.cz11apur1_c8r32 | 39.149 | 58.708 | 1.425 | 0.058 | 0.114 | 0.546 | 0.294 | ||||
| ma101107_rel.cz11apur1_c8r32 | 34.696 | 63.206 | 1.440 | 0.048 | 0.068 | 0.542 | 0.322 | ||||
| ma110401_rel.cz11bpur1_c8r32 | 42.335 | 54.953 | 1.827 | 0.226 | 0.087 | 0.572 | 0.372 |
Performance metrics for the DBMS listed above. Some are normalized by throughput, others are not. Legend for results is here.
ips	qps	rps	rmbps	wps	wmbps	rpq	rkbpq	wpi	wkbpi	csps	cpups	cspq	cpupq	dbgb1	dbgb2	rss	maxop	p50	p99	tag
63272	0	0	0.0	11376.7	352.0	0.000	0.000	0.180	5.697	49140	62.0	0.777	78	14.3	47.0	16.9	0.276	19436	150	ma100244_rel.cz11apur1_c8r32
58770	0	0	0.0	9314.6	294.0	0.000	0.000	0.158	5.123	43311	53.5	0.737	73	12.8	44.9	14.7	0.339	19979	150	ma100339_rel.cz11apur1_c8r32
58608	0	0	0.0	9654.0	303.0	0.000	0.000	0.165	5.293	44675	53.3	0.762	73	12.8	44.9	NA	0.274	20029	150	ma100433_rel.cz11apur1_c8r32
59095	0	0	0.0	8997.9	264.2	0.000	0.000	0.152	4.578	60471	50.0	1.023	68	12.8	45.0	14.0	1.037	9490	150	ma100524_rel.cz11apur1_c8r32
61391	0	0	0.0	5016.3	154.7	0.000	0.000	0.082	2.580	51880	48.4	0.845	63	12.9	45.0	14.2	0.361	12936	150	ma100617_rel.cz11apur1_c8r32
62530	0	1502	5.9	5446.6	168.8	0.024	0.096	0.087	2.764	53375	49.0	0.854	63	12.8	45.0	14.2	0.323	18138	150	ma101107_rel.cz11apur1_c8r32
59452	0	1471	5.7	5380.3	160.8	0.025	0.099	0.090	2.770	52506	46.2	0.883	62	12.9	45.0	14.2	0.390	14485	150	ma110401_rel.cz11bpur1_c8r32
l.i2
l.i2: continue load after secondary indexes created with 5 inserts per transaction. Graphs for performance per 1-second interval are here.
Average throughput:
Insert response time histogram: each cell has the percentage of responses that take <= the time in the header and max is the max response time in seconds. For the max column values in the top 25% of the range have a red background and in the bottom 25% of the range have a green background. The red background is not used when the min value is within 80% of the max value.
| dbms | 256us | 1ms | 4ms | 16ms | 64ms | 256ms | 1s | 4s | 16s | gt | max |
|---|---|---|---|---|---|---|---|---|---|---|---|
| ma100244_rel.cz11apur1_c8r32 | 24.688 | 71.926 | 1.088 | 1.586 | 0.709 | 0.002 | 0.145 | ||||
| ma100339_rel.cz11apur1_c8r32 | 27.459 | 69.692 | 1.071 | 1.349 | 0.426 | 0.002 | 0.153 | ||||
| ma100433_rel.cz11apur1_c8r32 | 26.570 | 70.582 | 1.069 | 1.345 | 0.433 | 0.002 | 0.151 | ||||
| ma100524_rel.cz11apur1_c8r32 | 26.776 | 71.145 | 1.151 | 0.144 | 0.782 | 0.002 | 0.146 | ||||
| ma100617_rel.cz11apur1_c8r32 | 26.809 | 71.327 | 0.917 | 0.125 | 0.819 | 0.003 | 0.181 | ||||
| ma101107_rel.cz11apur1_c8r32 | 11.980 | 86.305 | 1.031 | 0.184 | 0.497 | 0.003 | 0.146 | ||||
| ma110401_rel.cz11bpur1_c8r32 | 17.777 | 80.342 | 0.913 | 0.347 | 0.618 | 0.003 | 0.142 |
Delete response time histogram: each cell has the percentage of responses that take <= the time in the header and max is the max response time in seconds. For the max column values in the top 25% of the range have a red background and in the bottom 25% of the range have a green background. The red background is not used when the min value is within 80% of the max value.
| dbms | 256us | 1ms | 4ms | 16ms | 64ms | 256ms | 1s | 4s | 16s | gt | max |
|---|---|---|---|---|---|---|---|---|---|---|---|
| ma100244_rel.cz11apur1_c8r32 | 25.959 | 70.679 | 1.072 | 1.579 | 0.709 | 0.002 | 0.144 | ||||
| ma100339_rel.cz11apur1_c8r32 | 28.888 | 68.212 | 1.129 | 1.343 | 0.426 | 0.002 | 0.159 | ||||
| ma100433_rel.cz11apur1_c8r32 | 28.443 | 68.661 | 1.122 | 1.340 | 0.432 | 0.002 | 0.144 | ||||
| ma100524_rel.cz11apur1_c8r32 | 29.178 | 68.781 | 1.125 | 0.133 | 0.782 | 0.002 | 0.146 | ||||
| ma100617_rel.cz11apur1_c8r32 | 29.824 | 68.330 | 0.901 | 0.122 | 0.820 | 0.003 | 0.180 | ||||
| ma101107_rel.cz11apur1_c8r32 | 16.434 | 81.854 | 1.031 | 0.181 | 0.497 | 0.003 | 0.146 | ||||
| ma110401_rel.cz11bpur1_c8r32 | 21.802 | 76.348 | 0.912 | 0.318 | 0.617 | 0.003 | 0.142 |
Performance metrics for the DBMS listed above. Some are normalized by throughput, others are not. Legend for results is here.
ips	qps	rps	rmbps	wps	wmbps	rpq	rkbpq	wpi	wkbpi	csps	cpups	cspq	cpupq	dbgb1	dbgb2	rss	maxop	p50	p99	tag
28318	0	0	0.0	10126.4	312.7	0.000	0.000	0.358	11.306	98112	62.5	3.465	177	14.3	47.0	17.1	0.145	9410	180	ma100244_rel.cz11apur1_c8r32
33195	0	0	0.0	7941.8	258.1	0.000	0.000	0.239	7.960	103697	67.5	3.124	163	12.8	44.9	15.0	0.153	9812	180	ma100339_rel.cz11apur1_c8r32
33195	0	0	0.0	7946.5	257.1	0.000	0.000	0.239	7.932	103857	67.3	3.129	162	12.8	44.9	NA	0.151	9874	180	ma100433_rel.cz11apur1_c8r32
32553	0	0	0.0	10540.9	311.1	0.000	0.000	0.324	9.786	133146	64.7	4.090	159	12.8	45.0	14.1	0.146	9070	185	ma100524_rel.cz11apur1_c8r32
32258	0	0	0.0	3902.7	133.6	0.000	0.000	0.121	4.240	114329	60.2	3.544	149	12.9	45.0	14.2	0.181	12477	155	ma100617_rel.cz11apur1_c8r32
34115	0	4682	18.3	4205.9	144.1	0.137	0.549	0.123	4.325	142515	66.0	4.177	155	12.8	45.0	14.2	0.146	11088	160	ma101107_rel.cz11apur1_c8r32
32620	0	4426	17.3	4138.9	137.4	0.136	0.543	0.127	4.315	136772	62.3	4.193	153	12.9	45.0	14.2	0.142	11007	165	ma110401_rel.cz11bpur1_c8r32
qr100.L1
qr100.L1: range queries with 100 insert/s per client. Graphs for performance per 1-second interval are here.
Average throughput:
Query response time histogram: each cell has the percentage of responses that take <= the time in the header and max is the max response time in seconds. For max values in the top 25% of the range have a red background and in the bottom 25% of the range have a green background. The red background is not used when the min value is within 80% of the max value.
| dbms | 256us | 1ms | 4ms | 16ms | 64ms | 256ms | 1s | 4s | 16s | gt | max |
|---|---|---|---|---|---|---|---|---|---|---|---|
| ma100244_rel.cz11apur1_c8r32 | 99.977 | 0.021 | 0.001 | nonzero | nonzero | 0.022 | |||||
| ma100339_rel.cz11apur1_c8r32 | 99.975 | 0.023 | 0.002 | nonzero | nonzero | 0.021 | |||||
| ma100433_rel.cz11apur1_c8r32 | 99.970 | 0.029 | 0.001 | nonzero | nonzero | 0.021 | |||||
| ma100524_rel.cz11apur1_c8r32 | 99.992 | 0.007 | nonzero | 0.002 | |||||||
| ma100617_rel.cz11apur1_c8r32 | 99.992 | 0.008 | nonzero | nonzero | 0.004 | ||||||
| ma101107_rel.cz11apur1_c8r32 | 99.992 | 0.008 | 0.001 | 0.003 | |||||||
| ma110401_rel.cz11bpur1_c8r32 | 99.992 | 0.007 | 0.001 | 0.002 |
Insert response time histogram: each cell has the percentage of responses that take <= the time in the header and max is the max response time in seconds. For max values in the top 25% of the range have a red background and in the bottom 25% of the range have a green background. The red background is not used when the min value is within 80% of the max value.
| dbms | 256us | 1ms | 4ms | 16ms | 64ms | 256ms | 1s | 4s | 16s | gt | max |
|---|---|---|---|---|---|---|---|---|---|---|---|
| ma100244_rel.cz11apur1_c8r32 | 0.792 | 95.993 | 3.028 | 0.188 | 0.027 | ||||||
| ma100339_rel.cz11apur1_c8r32 | 1.500 | 95.424 | 2.861 | 0.215 | 0.025 | ||||||
| ma100433_rel.cz11apur1_c8r32 | 0.889 | 95.938 | 3.021 | 0.153 | 0.027 | ||||||
| ma100524_rel.cz11apur1_c8r32 | 6.611 | 93.389 | 0.003 | ||||||||
| ma100617_rel.cz11apur1_c8r32 | 11.889 | 88.104 | 0.007 | 0.005 | |||||||
| ma101107_rel.cz11apur1_c8r32 | 1.424 | 57.028 | 41.549 | 0.012 | |||||||
| ma110401_rel.cz11bpur1_c8r32 | 1.146 | 52.660 | 46.194 | 0.012 |
Delete response time histogram: each cell has the percentage of responses that take <= the time in the header and max is the max response time in seconds. For max values in the top 25% of the range have a red background and in the bottom 25% of the range have a green background. The red background is not used when the min value is within 80% of the max value.
| dbms | 256us | 1ms | 4ms | 16ms | 64ms | 256ms | 1s | 4s | 16s | gt | max |
|---|---|---|---|---|---|---|---|---|---|---|---|
| ma100244_rel.cz11apur1_c8r32 | 46.118 | 50.958 | 2.792 | 0.132 | 0.036 | ||||||
| ma100339_rel.cz11apur1_c8r32 | 77.382 | 19.979 | 2.500 | 0.139 | 0.026 | ||||||
| ma100433_rel.cz11apur1_c8r32 | 82.611 | 14.722 | 2.604 | 0.062 | 0.024 | ||||||
| ma100524_rel.cz11apur1_c8r32 | 80.292 | 19.708 | 0.003 | ||||||||
| ma100617_rel.cz11apur1_c8r32 | 50.847 | 49.146 | 0.007 | 0.005 | |||||||
| ma101107_rel.cz11apur1_c8r32 | 13.514 | 44.944 | 41.542 | 0.012 | |||||||
| ma110401_rel.cz11bpur1_c8r32 | 10.632 | 43.188 | 46.181 | 0.011 |
Performance metrics for the DBMS listed above. Some are normalized by throughput, others are not. Legend for results is here.
ips	qps	rps	rmbps	wps	wmbps	rpq	rkbpq	wpi	wkbpi	csps	cpups	cspq	cpupq	dbgb1	dbgb2	rss	maxop	p50	p99	tag
399	35182	0	0.0	3335.0	92.8	0.000	0.000	8.363	238.366	143533	53.2	4.080	121	14.3	47.0	17.1	0.022	8841	8711	ma100244_rel.cz11apur1_c8r32
399	34085	0	0.0	3378.4	94.1	0.000	0.000	8.471	241.749	139620	52.8	4.096	124	12.8	44.9	15.0	0.021	8535	8407	ma100339_rel.cz11apur1_c8r32
399	33318	0	0.0	3388.2	94.4	0.000	0.000	8.496	242.434	137162	53.0	4.117	127	12.8	44.9	NA	0.021	8343	8231	ma100433_rel.cz11apur1_c8r32
399	33180	0	0.0	6.2	0.6	0.000	0.000	0.015	1.471	126833	52.1	3.823	126	12.8	45.0	14.0	0.002	8327	8266	ma100524_rel.cz11apur1_c8r32
399	33143	0	0.0	11.5	0.6	0.000	0.000	0.029	1.624	126751	52.3	3.824	126	12.9	45.0	13.9	0.004	8279	8183	ma100617_rel.cz11apur1_c8r32
399	32921	8	0.0	5.3	0.5	0.000	0.001	0.013	1.198	125819	52.1	3.822	127	12.8	45.0	13.9	0.003	8247	8122	ma101107_rel.cz11apur1_c8r32
399	32774	8	0.0	11.8	0.6	0.000	0.001	0.030	1.655	125317	52.2	3.824	127	12.9	45.0	13.9	0.002	8170	8087	ma110401_rel.cz11bpur1_c8r32
qp100.L2
qp100.L2: point queries with 100 insert/s per client. Graphs for performance per 1-second interval are here.
Average throughput:
Query response time histogram: each cell has the percentage of responses that take <= the time in the header and max is the max response time in seconds. For max values in the top 25% of the range have a red background and in the bottom 25% of the range have a green background. The red background is not used when the min value is within 80% of the max value.
| dbms | 256us | 1ms | 4ms | 16ms | 64ms | 256ms | 1s | 4s | 16s | gt | max |
|---|---|---|---|---|---|---|---|---|---|---|---|
| ma100244_rel.cz11apur1_c8r32 | 99.983 | 0.017 | nonzero | nonzero | 0.008 | ||||||
| ma100339_rel.cz11apur1_c8r32 | 99.969 | 0.030 | 0.001 | nonzero | nonzero | 0.026 | |||||
| ma100433_rel.cz11apur1_c8r32 | 99.958 | 0.041 | 0.001 | nonzero | nonzero | 0.020 | |||||
| ma100524_rel.cz11apur1_c8r32 | 99.959 | 0.041 | nonzero | 0.002 | |||||||
| ma100617_rel.cz11apur1_c8r32 | 99.942 | 0.057 | 0.001 | 0.003 | |||||||
| ma101107_rel.cz11apur1_c8r32 | 99.939 | 0.061 | nonzero | 0.002 | |||||||
| ma110401_rel.cz11bpur1_c8r32 | 99.937 | 0.061 | 0.002 | 0.002 |
Insert response time histogram: each cell has the percentage of responses that take <= the time in the header and max is the max response time in seconds. For max values in the top 25% of the range have a red background and in the bottom 25% of the range have a green background. The red background is not used when the min value is within 80% of the max value.
| dbms | 256us | 1ms | 4ms | 16ms | 64ms | 256ms | 1s | 4s | 16s | gt | max |
|---|---|---|---|---|---|---|---|---|---|---|---|
| ma100244_rel.cz11apur1_c8r32 | 0.201 | 96.493 | 3.153 | 0.153 | 0.032 | ||||||
| ma100339_rel.cz11apur1_c8r32 | 0.472 | 96.278 | 3.014 | 0.236 | 0.036 | ||||||
| ma100433_rel.cz11apur1_c8r32 | 0.069 | 96.826 | 2.972 | 0.132 | 0.035 | ||||||
| ma100524_rel.cz11apur1_c8r32 | 3.590 | 96.403 | 0.007 | 0.004 | |||||||
| ma100617_rel.cz11apur1_c8r32 | 10.278 | 89.722 | 0.004 | ||||||||
| ma101107_rel.cz11apur1_c8r32 | 11.361 | 87.250 | 1.389 | 0.013 | |||||||
| ma110401_rel.cz11bpur1_c8r32 | 0.521 | 54.153 | 45.326 | 0.012 |
Delete response time histogram: each cell has the percentage of responses that take <= the time in the header and max is the max response time in seconds. For max values in the top 25% of the range have a red background and in the bottom 25% of the range have a green background. The red background is not used when the min value is within 80% of the max value.
| dbms | 256us | 1ms | 4ms | 16ms | 64ms | 256ms | 1s | 4s | 16s | gt | max |
|---|---|---|---|---|---|---|---|---|---|---|---|
| ma100244_rel.cz11apur1_c8r32 | 38.396 | 58.861 | 2.576 | 0.167 | 0.028 | ||||||
| ma100339_rel.cz11apur1_c8r32 | 76.160 | 21.188 | 2.535 | 0.118 | 0.028 | ||||||
| ma100433_rel.cz11apur1_c8r32 | 69.035 | 28.264 | 2.604 | 0.097 | 0.028 | ||||||
| ma100524_rel.cz11apur1_c8r32 | 69.750 | 30.250 | 0.003 | ||||||||
| ma100617_rel.cz11apur1_c8r32 | 56.556 | 43.444 | 0.004 | ||||||||
| ma101107_rel.cz11apur1_c8r32 | 68.299 | 30.250 | 1.451 | 0.012 | |||||||
| ma110401_rel.cz11bpur1_c8r32 | 5.729 | 48.611 | 45.660 | 0.012 |
Performance metrics for the DBMS listed above. Some are normalized by throughput, others are not. Legend for results is here.
ips	qps	rps	rmbps	wps	wmbps	rpq	rkbpq	wpi	wkbpi	csps	cpups	cspq	cpupq	dbgb1	dbgb2	rss	maxop	p50	p99	tag
399	30315	0	0.0	3322.7	92.5	0.000	0.000	8.336	237.620	130053	52.9	4.290	140	14.3	47.0	17.0	0.008	7624	7544	ma100244_rel.cz11apur1_c8r32
399	29098	0	0.0	3300.2	91.9	0.000	0.000	8.269	235.717	125162	52.6	4.301	145	12.8	44.9	14.9	0.026	7272	7192	ma100339_rel.cz11apur1_c8r32
399	28215	0	0.0	3300.4	91.9	0.000	0.000	8.276	235.902	121963	52.6	4.323	149	12.8	44.9	NA	0.020	7064	6984	ma100433_rel.cz11apur1_c8r32
399	28390	0	0.0	4.9	0.4	0.000	0.000	0.012	1.062	113168	52.0	3.986	147	12.8	45.0	14.1	0.002	7096	7032	ma100524_rel.cz11apur1_c8r32
399	28264	0	0.0	20.9	0.9	0.000	0.000	0.053	2.231	112779	51.9	3.990	147	12.9	45.0	13.9	0.003	7080	7000	ma100617_rel.cz11apur1_c8r32
399	28142	0	0.0	23.7	1.0	0.000	0.000	0.059	2.440	112321	52.0	3.991	148	12.8	45.0	13.9	0.002	7032	6953	ma101107_rel.cz11apur1_c8r32
399	27960	8	0.0	11.5	0.6	0.000	0.001	0.029	1.567	111543	51.9	3.989	149	12.9	45.0	13.9	0.002	6987	6907	ma110401_rel.cz11bpur1_c8r32
qr500.L3
qr500.L3: range queries with 500 insert/s per client. Graphs for performance per 1-second interval are here.
Average throughput:

Query response time histogram: each cell has the percentage of responses that take <= the time in the header and max is the max response time in seconds. For max values in the top 25% of the range have a red background and in the bottom 25% of the range have a green background. The red background is not used when the min value is within 80% of the max value.
| dbms | 256us | 1ms | 4ms | 16ms | 64ms | 256ms | 1s | 4s | 16s | gt | max |
|---|---|---|---|---|---|---|---|---|---|---|---|
| ma100244_rel.cz11apur1_c8r32 | 99.914 | 0.076 | 0.009 | 0.002 | nonzero | 0.032 | |||||
| ma100339_rel.cz11apur1_c8r32 | 99.900 | 0.087 | 0.011 | 0.002 | nonzero | 0.040 | |||||
| ma100433_rel.cz11apur1_c8r32 | 99.880 | 0.108 | 0.010 | 0.002 | nonzero | 0.038 | |||||
| ma100524_rel.cz11apur1_c8r32 | 99.969 | 0.025 | 0.006 | nonzero | 0.012 | ||||||
| ma100617_rel.cz11apur1_c8r32 | 99.965 | 0.027 | 0.008 | nonzero | nonzero | 0.016 | |||||
| ma101107_rel.cz11apur1_c8r32 | 99.954 | 0.036 | 0.010 | nonzero | nonzero | 0.022 | |||||
| ma110401_rel.cz11bpur1_c8r32 | 99.950 | 0.038 | 0.013 | nonzero | nonzero | 0.016 |
Insert response time histogram: each cell has the percentage of responses that take <= the time in the header and max is the max response time in seconds. For max values in the top 25% of the range have a red background and in the bottom 25% of the range have a green background. The red background is not used when the min value is within 80% of the max value.
| dbms | 256us | 1ms | 4ms | 16ms | 64ms | 256ms | 1s | 4s | 16s | gt | max |
|---|---|---|---|---|---|---|---|---|---|---|---|
| ma100244_rel.cz11apur1_c8r32 | 5.388 | 84.338 | 9.679 | 0.596 | 0.051 | ||||||
| ma100339_rel.cz11apur1_c8r32 | 7.282 | 82.371 | 9.804 | 0.543 | 0.052 | ||||||
| ma100433_rel.cz11apur1_c8r32 | 6.335 | 83.237 | 9.860 | 0.568 | 0.053 | ||||||
| ma100524_rel.cz11apur1_c8r32 | 17.243 | 80.996 | 1.749 | 0.013 | 0.037 | ||||||
| ma100617_rel.cz11apur1_c8r32 | 15.611 | 81.768 | 2.606 | 0.015 | 0.038 | ||||||
| ma101107_rel.cz11apur1_c8r32 | 7.587 | 86.171 | 6.229 | 0.013 | 0.028 | ||||||
| ma110401_rel.cz11bpur1_c8r32 | 2.461 | 87.375 | 10.143 | 0.021 | 0.062 |
Delete response time histogram: each cell has the percentage of responses that take <= the time in the header and max is the max response time in seconds. For max values in the top 25% of the range have a red background and in the bottom 25% of the range have a green background. The red background is not used when the min value is within 80% of the max value.
| dbms | 256us | 1ms | 4ms | 16ms | 64ms | 256ms | 1s | 4s | 16s | gt | max |
|---|---|---|---|---|---|---|---|---|---|---|---|
| ma100244_rel.cz11apur1_c8r32 | 63.847 | 27.525 | 8.153 | 0.475 | 0.057 | ||||||
| ma100339_rel.cz11apur1_c8r32 | 77.990 | 13.433 | 8.165 | 0.411 | 0.048 | ||||||
| ma100433_rel.cz11apur1_c8r32 | 76.271 | 15.024 | 8.279 | 0.426 | 0.049 | ||||||
| ma100524_rel.cz11apur1_c8r32 | 81.997 | 16.724 | 1.268 | 0.011 | 0.037 | ||||||
| ma100617_rel.cz11apur1_c8r32 | 52.210 | 45.807 | 1.969 | 0.014 | 0.036 | ||||||
| ma101107_rel.cz11apur1_c8r32 | 38.828 | 55.560 | 5.603 | 0.010 | 0.027 | ||||||
| ma110401_rel.cz11bpur1_c8r32 | 17.339 | 73.460 | 9.188 | 0.014 | 0.032 |
Performance metrics for the DBMS listed above. Some are normalized by throughput, others are not. Legend for results is here.
ips	qps	rps	rmbps	wps	wmbps	rpq	rkbpq	wpi	wkbpi	csps	cpups	cspq	cpupq	dbgb1	dbgb2	rss	maxop	p50	p99	tag
1994	33522	0	0.0	11977.1	334.2	0.000	0.000	6.005	171.613	160252	56.9	4.781	136	14.3	47.0	17.1	0.032	8311	8167	ma100244_rel.cz11apur1_c8r32
1994	32559	0	0.0	11955.6	333.7	0.000	0.000	5.995	171.312	157021	56.5	4.823	139	12.8	44.9	14.9	0.040	8135	7975	ma100339_rel.cz11apur1_c8r32
1994	31687	0	0.0	11962.3	333.8	0.000	0.000	5.998	171.402	154521	56.4	4.876	142	12.8	44.9	NA	0.038	7898	7752	ma100433_rel.cz11apur1_c8r32
1994	32803	0	0.0	18.6	2.1	0.000	0.000	0.009	1.054	124895	53.3	3.807	130	12.8	45.0	14.0	0.012	8218	8135	ma100524_rel.cz11apur1_c8r32
1994	32893	0	0.0	161.1	5.9	0.000	0.000	0.081	3.013	126160	53.4	3.836	130	12.9	45.0	13.9	0.016	8215	7986	ma100617_rel.cz11apur1_c8r32
1993	32371	57	0.2	162.1	5.9	0.002	0.007	0.081	3.047	124628	53.3	3.850	132	12.8	45.0	13.9	0.022	8087	7895	ma101107_rel.cz11apur1_c8r32
1994	32452	57	0.2	168.2	6.0	0.002	0.007	0.084	3.056	124845	53.3	3.847	131	12.9	45.0	13.9	0.016	8103	7817	ma110401_rel.cz11bpur1_c8r32
qp500.L4
qp500.L4: point queries with 500 insert/s per client. Graphs for performance per 1-second interval are here.
Average throughput:
Query response time histogram: each cell has the percentage of responses that take <= the time in the header and max is the max response time in seconds. For max values in the top 25% of the range have a red background and in the bottom 25% of the range have a green background. The red background is not used when the min value is within 80% of the max value.
| dbms | 256us | 1ms | 4ms | 16ms | 64ms | 256ms | 1s | 4s | 16s | gt | max |
|---|---|---|---|---|---|---|---|---|---|---|---|
| ma100244_rel.cz11apur1_c8r32 | 99.940 | 0.055 | 0.005 | nonzero | nonzero | 0.024 | |||||
| ma100339_rel.cz11apur1_c8r32 | 99.922 | 0.072 | 0.005 | 0.001 | nonzero | 0.032 | |||||
| ma100433_rel.cz11apur1_c8r32 | 99.914 | 0.080 | 0.005 | 0.001 | nonzero | 0.027 | |||||
| ma100524_rel.cz11apur1_c8r32 | 99.945 | 0.051 | 0.004 | nonzero | 0.012 | ||||||
| ma100617_rel.cz11apur1_c8r32 | 99.918 | 0.077 | 0.005 | nonzero | 0.012 | ||||||
| ma101107_rel.cz11apur1_c8r32 | 99.887 | 0.097 | 0.016 | nonzero | 0.008 | ||||||
| ma110401_rel.cz11bpur1_c8r32 | 99.889 | 0.096 | 0.015 | nonzero | 0.011 |
Insert response time histogram: each cell has the percentage of responses that take <= the time in the header and max is the max response time in seconds. For max values in the top 25% of the range have a red background and in the bottom 25% of the range have a green background. The red background is not used when the min value is within 80% of the max value.
| dbms | 256us | 1ms | 4ms | 16ms | 64ms | 256ms | 1s | 4s | 16s | gt | max |
|---|---|---|---|---|---|---|---|---|---|---|---|
| ma100244_rel.cz11apur1_c8r32 | 4.629 | 85.915 | 8.872 | 0.583 | 0.050 | ||||||
| ma100339_rel.cz11apur1_c8r32 | 4.758 | 85.458 | 9.257 | 0.526 | 0.048 | ||||||
| ma100433_rel.cz11apur1_c8r32 | 2.919 | 86.581 | 9.849 | 0.651 | 0.052 | ||||||
| ma100524_rel.cz11apur1_c8r32 | 14.342 | 84.404 | 1.246 | 0.008 | 0.038 | ||||||
| ma100617_rel.cz11apur1_c8r32 | 21.186 | 78.317 | 0.485 | 0.013 | 0.039 | ||||||
| ma101107_rel.cz11apur1_c8r32 | 0.661 | 89.006 | 10.322 | 0.011 | 0.029 | ||||||
| ma110401_rel.cz11bpur1_c8r32 | 1.196 | 87.918 | 10.867 | 0.019 | 0.032 |
Delete response time histogram: each cell has the percentage of responses that take <= the time in the header and max is the max response time in seconds. For max values in the top 25% of the range have a red background and in the bottom 25% of the range have a green background. The red background is not used when the min value is within 80% of the max value.
| dbms | 256us | 1ms | 4ms | 16ms | 64ms | 256ms | 1s | 4s | 16s | gt | max |
|---|---|---|---|---|---|---|---|---|---|---|---|
| ma100244_rel.cz11apur1_c8r32 | 61.369 | 30.599 | 7.599 | 0.433 | 0.050 | ||||||
| ma100339_rel.cz11apur1_c8r32 | 71.971 | 19.747 | 7.832 | 0.450 | 0.048 | ||||||
| ma100433_rel.cz11apur1_c8r32 | 70.626 | 20.535 | 8.369 | 0.469 | 0.040 | ||||||
| ma100524_rel.cz11apur1_c8r32 | 79.994 | 19.043 | 0.954 | 0.008 | 0.038 | ||||||
| ma100617_rel.cz11apur1_c8r32 | 58.825 | 40.735 | 0.431 | 0.010 | 0.039 | ||||||
| ma101107_rel.cz11apur1_c8r32 | 14.156 | 76.596 | 9.238 | 0.011 | 0.029 | ||||||
| ma110401_rel.cz11bpur1_c8r32 | 13.908 | 75.981 | 10.100 | 0.011 | 0.032 |
Performance metrics for the DBMS listed above. Some are normalized by throughput, others are not. Legend for results is here.
ips	qps	rps	rmbps	wps	wmbps	rpq	rkbpq	wpi	wkbpi	csps	cpups	cspq	cpupq	dbgb1	dbgb2	rss	maxop	p50	p99	tag
1994	29242	0	0.0	12062.0	336.6	0.000	0.000	6.048	172.826	149452	56.6	5.111	155	14.3	47.0	17.1	0.024	7274	7176	ma100244_rel.cz11apur1_c8r32
1994	27932	0	0.0	12067.3	336.8	0.000	0.000	6.051	172.908	144540	56.5	5.175	162	12.8	44.9	14.9	0.032	6969	6873	ma100339_rel.cz11apur1_c8r32
1993	27243	0	0.0	12075.6	337.0	0.000	0.000	6.058	173.123	142493	56.5	5.230	166	12.8	44.9	NA	0.027	6809	6715	ma100433_rel.cz11apur1_c8r32
1994	28117	0	0.0	18.6	2.1	0.000	0.000	0.009	1.061	111640	53.1	3.971	151	12.8	45.0	14.0	0.012	7032	6969	ma100524_rel.cz11apur1_c8r32
1994	28038	0	0.0	165.2	6.0	0.000	0.000	0.083	3.055	112582	53.2	4.015	152	12.9	45.0	13.9	0.012	7017	6905	ma100617_rel.cz11apur1_c8r32
1994	27836	57	0.2	165.1	6.0	0.002	0.008	0.083	3.065	111952	53.1	4.022	153	12.8	45.0	13.9	0.008	6953	6841	ma101107_rel.cz11apur1_c8r32
1994	27740	56	0.2	170.7	6.0	0.002	0.008	0.086	3.083	111581	53.1	4.022	153	12.9	45.0	13.9	0.011	6936	6811	ma110401_rel.cz11bpur1_c8r32
qr1000.L5
qr1000.L5: range queries with 1000 insert/s per client. Graphs for performance per 1-second interval are here.
Average throughput:
Query response time histogram: each cell has the percentage of responses that take <= the time in the header and max is the max response time in seconds. For max values in the top 25% of the range have a red background and in the bottom 25% of the range have a green background. The red background is not used when the min value is within 80% of the max value.
| dbms | 256us | 1ms | 4ms | 16ms | 64ms | 256ms | 1s | 4s | 16s | gt | max |
|---|---|---|---|---|---|---|---|---|---|---|---|
| ma100244_rel.cz11apur1_c8r32 | 99.824 | 0.146 | 0.026 | 0.004 | nonzero | 0.035 | |||||
| ma100339_rel.cz11apur1_c8r32 | 99.798 | 0.172 | 0.026 | 0.004 | nonzero | 0.057 | |||||
| ma100433_rel.cz11apur1_c8r32 | 99.735 | 0.232 | 0.030 | 0.004 | nonzero | 0.040 | |||||
| ma100524_rel.cz11apur1_c8r32 | 99.921 | 0.062 | 0.015 | 0.002 | nonzero | 0.022 | |||||
| ma100617_rel.cz11apur1_c8r32 | 99.902 | 0.081 | 0.016 | 0.001 | nonzero | 0.032 | |||||
| ma101107_rel.cz11apur1_c8r32 | 99.931 | 0.057 | 0.012 | nonzero | 0.012 | ||||||
| ma110401_rel.cz11bpur1_c8r32 | 99.942 | 0.050 | 0.008 | 0.001 | nonzero | 0.031 |
Insert response time histogram: each cell has the percentage of responses that take <= the time in the header and max is the max response time in seconds. For max values in the top 25% of the range have a red background and in the bottom 25% of the range have a green background. The red background is not used when the min value is within 80% of the max value.
| dbms | 256us | 1ms | 4ms | 16ms | 64ms | 256ms | 1s | 4s | 16s | gt | max |
|---|---|---|---|---|---|---|---|---|---|---|---|
| ma100244_rel.cz11apur1_c8r32 | 4.222 | 83.299 | 11.897 | 0.583 | 0.050 | ||||||
| ma100339_rel.cz11apur1_c8r32 | 5.960 | 82.247 | 11.298 | 0.494 | 0.059 | ||||||
| ma100433_rel.cz11apur1_c8r32 | 6.621 | 82.251 | 10.733 | 0.395 | 0.041 | ||||||
| ma100524_rel.cz11apur1_c8r32 | 10.369 | 85.096 | 4.460 | 0.075 | 0.052 | ||||||
| ma100617_rel.cz11apur1_c8r32 | 18.758 | 78.447 | 2.767 | 0.029 | 0.044 | ||||||
| ma101107_rel.cz11apur1_c8r32 | 18.163 | 78.803 | 3.026 | 0.008 | 0.033 | ||||||
| ma110401_rel.cz11bpur1_c8r32 | 32.204 | 65.633 | 2.131 | 0.032 | 0.032 |
Delete response time histogram: each cell has the percentage of responses that take <= the time in the header and max is the max response time in seconds. For max values in the top 25% of the range have a red background and in the bottom 25% of the range have a green background. The red background is not used when the min value is within 80% of the max value.
| dbms | 256us | 1ms | 4ms | 16ms | 64ms | 256ms | 1s | 4s | 16s | gt | max |
|---|---|---|---|---|---|---|---|---|---|---|---|
| ma100244_rel.cz11apur1_c8r32 | 58.361 | 31.448 | 9.727 | 0.464 | 0.044 | ||||||
| ma100339_rel.cz11apur1_c8r32 | 72.666 | 17.879 | 9.056 | 0.399 | 0.052 | ||||||
| ma100433_rel.cz11apur1_c8r32 | 75.708 | 15.339 | 8.696 | 0.258 | 0.043 | ||||||
| ma100524_rel.cz11apur1_c8r32 | 69.351 | 27.028 | 3.551 | 0.070 | 0.042 | ||||||
| ma100617_rel.cz11apur1_c8r32 | 61.049 | 36.519 | 2.406 | 0.027 | 0.042 | ||||||
| ma101107_rel.cz11apur1_c8r32 | 64.862 | 32.660 | 2.473 | 0.006 | 0.032 | ||||||
| ma110401_rel.cz11bpur1_c8r32 | 70.389 | 27.787 | 1.808 | 0.016 | 0.032 |
Performance metrics for the DBMS listed above. Some are normalized by throughput, others are not. Legend for results is here.
ips	qps	rps	rmbps	wps	wmbps	rpq	rkbpq	wpi	wkbpi	csps	cpups	cspq	cpupq	dbgb1	dbgb2	rss	maxop	p50	p99	tag
3989	32762	0	0.0	13960.8	391.1	0.000	0.000	3.500	100.405	161908	58.8	4.942	144	14.3	47.0	17.1	0.035	8151	7800	ma100244_rel.cz11apur1_c8r32
3987	31813	0	0.0	13983.9	391.8	0.000	0.000	3.508	100.637	158983	58.5	4.997	147	12.8	44.9	14.9	0.057	7912	7704	ma100339_rel.cz11apur1_c8r32
3989	30919	0	0.0	13779.8	386.1	0.000	0.000	3.455	99.118	156058	58.3	5.047	151	12.8	44.9	NA	0.040	7736	7544	ma100433_rel.cz11apur1_c8r32
3989	32448	0	0.0	36.5	4.2	0.000	0.000	0.009	1.073	123061	54.6	3.793	135	12.8	45.0	14.0	0.022	8135	7997	ma100524_rel.cz11apur1_c8r32
3987	32471	0	0.0	417.7	14.2	0.000	0.000	0.105	3.657	125657	54.8	3.870	135	12.9	45.0	14.0	0.032	8151	7962	ma100617_rel.cz11apur1_c8r32
3989	31977	147	0.6	429.1	14.6	0.005	0.018	0.108	3.754	124707	54.7	3.900	137	12.8	45.0	13.9	0.012	8007	7832	ma101107_rel.cz11apur1_c8r32
3987	31931	125	0.5	446.8	14.8	0.004	0.016	0.112	3.794	124722	54.6	3.906	137	12.9	45.0	13.9	0.031	8039	7816	ma110401_rel.cz11bpur1_c8r32
qp1000.L6
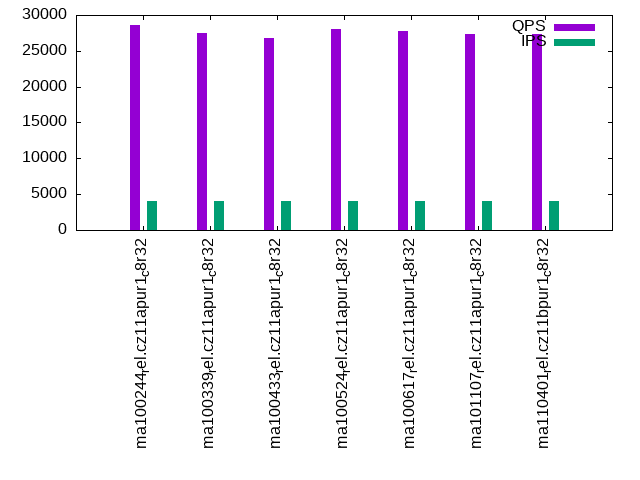
qp1000.L6: point queries with 1000 insert/s per client. Graphs for performance per 1-second interval are here.
Average throughput:
Query response time histogram: each cell has the percentage of responses that take <= the time in the header and max is the max response time in seconds. For max values in the top 25% of the range have a red background and in the bottom 25% of the range have a green background. The red background is not used when the min value is within 80% of the max value.
| dbms | 256us | 1ms | 4ms | 16ms | 64ms | 256ms | 1s | 4s | 16s | gt | max |
|---|---|---|---|---|---|---|---|---|---|---|---|
| ma100244_rel.cz11apur1_c8r32 | 99.858 | 0.126 | 0.015 | 0.002 | nonzero | 0.034 | |||||
| ma100339_rel.cz11apur1_c8r32 | 99.835 | 0.146 | 0.016 | 0.002 | nonzero | 0.022 | |||||
| ma100433_rel.cz11apur1_c8r32 | 99.834 | 0.149 | 0.016 | 0.002 | nonzero | 0.036 | |||||
| ma100524_rel.cz11apur1_c8r32 | 99.889 | 0.093 | 0.016 | 0.002 | nonzero | 0.018 | |||||
| ma100617_rel.cz11apur1_c8r32 | 99.885 | 0.103 | 0.011 | nonzero | nonzero | 0.028 | |||||
| ma101107_rel.cz11apur1_c8r32 | 99.873 | 0.117 | 0.010 | nonzero | nonzero | 0.016 | |||||
| ma110401_rel.cz11bpur1_c8r32 | 99.876 | 0.113 | 0.010 | nonzero | 0.016 |
Insert response time histogram: each cell has the percentage of responses that take <= the time in the header and max is the max response time in seconds. For max values in the top 25% of the range have a red background and in the bottom 25% of the range have a green background. The red background is not used when the min value is within 80% of the max value.
| dbms | 256us | 1ms | 4ms | 16ms | 64ms | 256ms | 1s | 4s | 16s | gt | max |
|---|---|---|---|---|---|---|---|---|---|---|---|
| ma100244_rel.cz11apur1_c8r32 | 5.600 | 83.405 | 10.438 | 0.558 | 0.055 | ||||||
| ma100339_rel.cz11apur1_c8r32 | 5.736 | 82.470 | 11.243 | 0.551 | 0.057 | ||||||
| ma100433_rel.cz11apur1_c8r32 | 4.295 | 84.271 | 10.898 | 0.536 | 0.057 | ||||||
| ma100524_rel.cz11apur1_c8r32 | 6.126 | 88.704 | 5.084 | 0.086 | 0.044 | ||||||
| ma100617_rel.cz11apur1_c8r32 | 15.144 | 82.567 | 2.273 | 0.017 | 0.041 | ||||||
| ma101107_rel.cz11apur1_c8r32 | 13.897 | 83.936 | 2.162 | 0.006 | 0.035 | ||||||
| ma110401_rel.cz11bpur1_c8r32 | 19.472 | 77.906 | 2.594 | 0.027 | 0.033 |
Delete response time histogram: each cell has the percentage of responses that take <= the time in the header and max is the max response time in seconds. For max values in the top 25% of the range have a red background and in the bottom 25% of the range have a green background. The red background is not used when the min value is within 80% of the max value.
| dbms | 256us | 1ms | 4ms | 16ms | 64ms | 256ms | 1s | 4s | 16s | gt | max |
|---|---|---|---|---|---|---|---|---|---|---|---|
| ma100244_rel.cz11apur1_c8r32 | 63.269 | 27.808 | 8.497 | 0.426 | 0.059 | ||||||
| ma100339_rel.cz11apur1_c8r32 | 71.812 | 18.771 | 9.003 | 0.414 | 0.058 | ||||||
| ma100433_rel.cz11apur1_c8r32 | 71.837 | 19.031 | 8.730 | 0.401 | 0.001 | 0.066 | |||||
| ma100524_rel.cz11apur1_c8r32 | 63.878 | 31.813 | 4.231 | 0.078 | 0.048 | ||||||
| ma100617_rel.cz11apur1_c8r32 | 60.304 | 37.633 | 2.040 | 0.023 | 0.043 | ||||||
| ma101107_rel.cz11apur1_c8r32 | 61.240 | 36.850 | 1.907 | 0.003 | 0.034 | ||||||
| ma110401_rel.cz11bpur1_c8r32 | 60.481 | 37.293 | 2.214 | 0.012 | 0.033 |
Performance metrics for the DBMS listed above. Some are normalized by throughput, others are not. Legend for results is here.
ips	qps	rps	rmbps	wps	wmbps	rpq	rkbpq	wpi	wkbpi	csps	cpups	cspq	cpupq	dbgb1	dbgb2	rss	maxop	p50	p99	tag
3989	28626	0	0.0	14207.2	398.0	0.000	0.000	3.562	102.163	151989	58.8	5.309	164	14.3	47.0	17.1	0.034	7130	7000	ma100244_rel.cz11apur1_c8r32
3989	27463	0	0.0	14140.0	396.1	0.000	0.000	3.545	101.696	147459	58.6	5.369	171	12.8	44.9	15.0	0.022	6857	6722	ma100339_rel.cz11apur1_c8r32
3989	26799	0	0.0	14070.1	394.2	0.000	0.000	3.527	101.190	145589	58.6	5.433	175	12.8	44.9	NA	0.036	6683	6553	ma100433_rel.cz11apur1_c8r32
3989	28001	0	0.0	37.1	4.2	0.000	0.000	0.009	1.087	110768	54.7	3.956	156	12.8	45.0	14.0	0.018	6989	6905	ma100524_rel.cz11apur1_c8r32
3987	27770	0	0.0	355.4	12.5	0.000	0.000	0.089	3.210	112308	54.7	4.044	158	12.9	45.0	14.0	0.028	6953	6825	ma100617_rel.cz11apur1_c8r32
3989	27367	153	0.6	357.9	12.7	0.006	0.022	0.090	3.251	111758	54.8	4.084	160	12.8	45.0	13.9	0.016	6857	6745	ma101107_rel.cz11apur1_c8r32
3987	27384	149	0.6	358.5	12.5	0.005	0.022	0.090	3.203	111875	54.7	4.085	160	12.9	45.0	13.9	0.016	6841	6731	ma110401_rel.cz11bpur1_c8r32
l.i0
l.i0: load without secondary indexes
Performance metrics for all DBMS, not just the ones listed above. Some are normalized by throughput, others are not. Legend for results is here.
ips	qps	rps	rmbps	wps	wmbps	rpq	rkbpq	wpi	wkbpi	csps	cpups	cspq	cpupq	dbgb1	dbgb2	rss	maxop	p50	p99	tag
516129	0	1	0.0	2419.2	161.0	0.000	0.000	0.005	0.319	49142	71.1	0.095	11	3.2	34.0	4.1	0.153	150889	127264	ma100244_rel.cz11apur1_c8r32
461538	0	1	0.0	2431.2	157.4	0.000	0.000	0.005	0.349	38966	77.2	0.084	13	3.2	34.0	3.7	0.136	131660	108114	ma100339_rel.cz11apur1_c8r32
452830	0	1	0.0	2432.8	156.4	0.000	0.000	0.005	0.354	37185	72.8	0.082	13	3.2	34.0	NA	0.131	130996	109683	ma100433_rel.cz11apur1_c8r32
436364	0	0	0.0	3059.0	130.3	0.000	0.000	0.007	0.306	50283	68.6	0.115	13	3.2	34.0	3.4	0.126	124964	101929	ma100524_rel.cz11apur1_c8r32
470588	0	0	0.0	1799.3	115.4	0.000	0.000	0.004	0.251	52695	74.4	0.112	13	3.2	34.0	3.5	0.181	135191	108608	ma100617_rel.cz11apur1_c8r32
466019	0	0	0.0	1888.0	120.0	0.000	0.000	0.004	0.264	48154	73.5	0.103	13	3.2	34.0	3.5	0.182	133358	109184	ma101107_rel.cz11apur1_c8r32
470588	0	0	0.0	1890.0	119.9	0.000	0.000	0.004	0.261	49993	73.8	0.106	13	3.2	34.0	3.5	0.229	132559	100694	ma110401_rel.cz11bpur1_c8r32
l.x
l.x: create secondary indexes
Performance metrics for all DBMS, not just the ones listed above. Some are normalized by throughput, others are not. Legend for results is here.
ips	qps	rps	rmbps	wps	wmbps	rpq	rkbpq	wpi	wkbpi	csps	cpups	cspq	cpupq	dbgb1	dbgb2	rss	maxop	p50	p99	tag
923079	0	0	0.0	8655.1	739.8	0.000	0.000	0.009	0.821	34651	44.5	0.038	4	7.3	38.1	5.2	0.001	NA	NA	ma100244_rel.cz11apur1_c8r32
888891	0	0	0.0	8561.6	728.1	0.000	0.000	0.010	0.839	29937	45.1	0.034	4	7.3	38.1	5.1	0.002	NA	NA	ma100339_rel.cz11apur1_c8r32
888891	0	0	0.0	8628.1	731.4	0.000	0.000	0.010	0.843	30646	45.1	0.034	4	7.2	38.0	NA	0.002	NA	NA	ma100433_rel.cz11apur1_c8r32
774195	0	0	0.0	4353.6	538.2	0.000	0.000	0.006	0.712	883	44.3	0.001	5	7.2	38.0	7.5	0.001	NA	NA	ma100524_rel.cz11apur1_c8r32
774195	0	0	0.0	6980.5	581.3	0.000	0.000	0.009	0.769	12515	44.9	0.016	5	7.2	38.0	7.3	0.001	NA	NA	ma100617_rel.cz11apur1_c8r32
774195	0	0	0.0	6633.6	568.1	0.000	0.000	0.009	0.751	11080	45.1	0.014	5	7.2	38.0	7.1	0.001	NA	NA	ma101107_rel.cz11apur1_c8r32
695654	0	0	0.0	6391.3	533.4	0.000	0.000	0.009	0.785	11455	44.4	0.016	5	7.2	38.0	6.6	1.843	NA	NA	ma110401_rel.cz11bpur1_c8r32
l.i1
l.i1: continue load after secondary indexes created with 50 inserts per transaction
Performance metrics for all DBMS, not just the ones listed above. Some are normalized by throughput, others are not. Legend for results is here.
ips	qps	rps	rmbps	wps	wmbps	rpq	rkbpq	wpi	wkbpi	csps	cpups	cspq	cpupq	dbgb1	dbgb2	rss	maxop	p50	p99	tag
63272	0	0	0.0	11376.7	352.0	0.000	0.000	0.180	5.697	49140	62.0	0.777	78	14.3	47.0	16.9	0.276	19436	150	ma100244_rel.cz11apur1_c8r32
58770	0	0	0.0	9314.6	294.0	0.000	0.000	0.158	5.123	43311	53.5	0.737	73	12.8	44.9	14.7	0.339	19979	150	ma100339_rel.cz11apur1_c8r32
58608	0	0	0.0	9654.0	303.0	0.000	0.000	0.165	5.293	44675	53.3	0.762	73	12.8	44.9	NA	0.274	20029	150	ma100433_rel.cz11apur1_c8r32
59095	0	0	0.0	8997.9	264.2	0.000	0.000	0.152	4.578	60471	50.0	1.023	68	12.8	45.0	14.0	1.037	9490	150	ma100524_rel.cz11apur1_c8r32
61391	0	0	0.0	5016.3	154.7	0.000	0.000	0.082	2.580	51880	48.4	0.845	63	12.9	45.0	14.2	0.361	12936	150	ma100617_rel.cz11apur1_c8r32
62530	0	1502	5.9	5446.6	168.8	0.024	0.096	0.087	2.764	53375	49.0	0.854	63	12.8	45.0	14.2	0.323	18138	150	ma101107_rel.cz11apur1_c8r32
59452	0	1471	5.7	5380.3	160.8	0.025	0.099	0.090	2.770	52506	46.2	0.883	62	12.9	45.0	14.2	0.390	14485	150	ma110401_rel.cz11bpur1_c8r32
l.i2
l.i2: continue load after secondary indexes created with 5 inserts per transaction
Performance metrics for all DBMS, not just the ones listed above. Some are normalized by throughput, others are not. Legend for results is here.
ips	qps	rps	rmbps	wps	wmbps	rpq	rkbpq	wpi	wkbpi	csps	cpups	cspq	cpupq	dbgb1	dbgb2	rss	maxop	p50	p99	tag
28318	0	0	0.0	10126.4	312.7	0.000	0.000	0.358	11.306	98112	62.5	3.465	177	14.3	47.0	17.1	0.145	9410	180	ma100244_rel.cz11apur1_c8r32
33195	0	0	0.0	7941.8	258.1	0.000	0.000	0.239	7.960	103697	67.5	3.124	163	12.8	44.9	15.0	0.153	9812	180	ma100339_rel.cz11apur1_c8r32
33195	0	0	0.0	7946.5	257.1	0.000	0.000	0.239	7.932	103857	67.3	3.129	162	12.8	44.9	NA	0.151	9874	180	ma100433_rel.cz11apur1_c8r32
32553	0	0	0.0	10540.9	311.1	0.000	0.000	0.324	9.786	133146	64.7	4.090	159	12.8	45.0	14.1	0.146	9070	185	ma100524_rel.cz11apur1_c8r32
32258	0	0	0.0	3902.7	133.6	0.000	0.000	0.121	4.240	114329	60.2	3.544	149	12.9	45.0	14.2	0.181	12477	155	ma100617_rel.cz11apur1_c8r32
34115	0	4682	18.3	4205.9	144.1	0.137	0.549	0.123	4.325	142515	66.0	4.177	155	12.8	45.0	14.2	0.146	11088	160	ma101107_rel.cz11apur1_c8r32
32620	0	4426	17.3	4138.9	137.4	0.136	0.543	0.127	4.315	136772	62.3	4.193	153	12.9	45.0	14.2	0.142	11007	165	ma110401_rel.cz11bpur1_c8r32
qr100.L1
qr100.L1: range queries with 100 insert/s per client
Performance metrics for all DBMS, not just the ones listed above. Some are normalized by throughput, others are not. Legend for results is here.
ips	qps	rps	rmbps	wps	wmbps	rpq	rkbpq	wpi	wkbpi	csps	cpups	cspq	cpupq	dbgb1	dbgb2	rss	maxop	p50	p99	tag
399	35182	0	0.0	3335.0	92.8	0.000	0.000	8.363	238.366	143533	53.2	4.080	121	14.3	47.0	17.1	0.022	8841	8711	ma100244_rel.cz11apur1_c8r32
399	34085	0	0.0	3378.4	94.1	0.000	0.000	8.471	241.749	139620	52.8	4.096	124	12.8	44.9	15.0	0.021	8535	8407	ma100339_rel.cz11apur1_c8r32
399	33318	0	0.0	3388.2	94.4	0.000	0.000	8.496	242.434	137162	53.0	4.117	127	12.8	44.9	NA	0.021	8343	8231	ma100433_rel.cz11apur1_c8r32
399	33180	0	0.0	6.2	0.6	0.000	0.000	0.015	1.471	126833	52.1	3.823	126	12.8	45.0	14.0	0.002	8327	8266	ma100524_rel.cz11apur1_c8r32
399	33143	0	0.0	11.5	0.6	0.000	0.000	0.029	1.624	126751	52.3	3.824	126	12.9	45.0	13.9	0.004	8279	8183	ma100617_rel.cz11apur1_c8r32
399	32921	8	0.0	5.3	0.5	0.000	0.001	0.013	1.198	125819	52.1	3.822	127	12.8	45.0	13.9	0.003	8247	8122	ma101107_rel.cz11apur1_c8r32
399	32774	8	0.0	11.8	0.6	0.000	0.001	0.030	1.655	125317	52.2	3.824	127	12.9	45.0	13.9	0.002	8170	8087	ma110401_rel.cz11bpur1_c8r32
qp100.L2
qp100.L2: point queries with 100 insert/s per client
Performance metrics for all DBMS, not just the ones listed above. Some are normalized by throughput, others are not. Legend for results is here.
ips	qps	rps	rmbps	wps	wmbps	rpq	rkbpq	wpi	wkbpi	csps	cpups	cspq	cpupq	dbgb1	dbgb2	rss	maxop	p50	p99	tag
399	30315	0	0.0	3322.7	92.5	0.000	0.000	8.336	237.620	130053	52.9	4.290	140	14.3	47.0	17.0	0.008	7624	7544	ma100244_rel.cz11apur1_c8r32
399	29098	0	0.0	3300.2	91.9	0.000	0.000	8.269	235.717	125162	52.6	4.301	145	12.8	44.9	14.9	0.026	7272	7192	ma100339_rel.cz11apur1_c8r32
399	28215	0	0.0	3300.4	91.9	0.000	0.000	8.276	235.902	121963	52.6	4.323	149	12.8	44.9	NA	0.020	7064	6984	ma100433_rel.cz11apur1_c8r32
399	28390	0	0.0	4.9	0.4	0.000	0.000	0.012	1.062	113168	52.0	3.986	147	12.8	45.0	14.1	0.002	7096	7032	ma100524_rel.cz11apur1_c8r32
399	28264	0	0.0	20.9	0.9	0.000	0.000	0.053	2.231	112779	51.9	3.990	147	12.9	45.0	13.9	0.003	7080	7000	ma100617_rel.cz11apur1_c8r32
399	28142	0	0.0	23.7	1.0	0.000	0.000	0.059	2.440	112321	52.0	3.991	148	12.8	45.0	13.9	0.002	7032	6953	ma101107_rel.cz11apur1_c8r32
399	27960	8	0.0	11.5	0.6	0.000	0.001	0.029	1.567	111543	51.9	3.989	149	12.9	45.0	13.9	0.002	6987	6907	ma110401_rel.cz11bpur1_c8r32
qr500.L3
qr500.L3: range queries with 500 insert/s per client
Performance metrics for all DBMS, not just the ones listed above. Some are normalized by throughput, others are not. Legend for results is here.
ips	qps	rps	rmbps	wps	wmbps	rpq	rkbpq	wpi	wkbpi	csps	cpups	cspq	cpupq	dbgb1	dbgb2	rss	maxop	p50	p99	tag
1994	33522	0	0.0	11977.1	334.2	0.000	0.000	6.005	171.613	160252	56.9	4.781	136	14.3	47.0	17.1	0.032	8311	8167	ma100244_rel.cz11apur1_c8r32
1994	32559	0	0.0	11955.6	333.7	0.000	0.000	5.995	171.312	157021	56.5	4.823	139	12.8	44.9	14.9	0.040	8135	7975	ma100339_rel.cz11apur1_c8r32
1994	31687	0	0.0	11962.3	333.8	0.000	0.000	5.998	171.402	154521	56.4	4.876	142	12.8	44.9	NA	0.038	7898	7752	ma100433_rel.cz11apur1_c8r32
1994	32803	0	0.0	18.6	2.1	0.000	0.000	0.009	1.054	124895	53.3	3.807	130	12.8	45.0	14.0	0.012	8218	8135	ma100524_rel.cz11apur1_c8r32
1994	32893	0	0.0	161.1	5.9	0.000	0.000	0.081	3.013	126160	53.4	3.836	130	12.9	45.0	13.9	0.016	8215	7986	ma100617_rel.cz11apur1_c8r32
1993	32371	57	0.2	162.1	5.9	0.002	0.007	0.081	3.047	124628	53.3	3.850	132	12.8	45.0	13.9	0.022	8087	7895	ma101107_rel.cz11apur1_c8r32
1994	32452	57	0.2	168.2	6.0	0.002	0.007	0.084	3.056	124845	53.3	3.847	131	12.9	45.0	13.9	0.016	8103	7817	ma110401_rel.cz11bpur1_c8r32
qp500.L4
qp500.L4: point queries with 500 insert/s per client
Performance metrics for all DBMS, not just the ones listed above. Some are normalized by throughput, others are not. Legend for results is here.
ips	qps	rps	rmbps	wps	wmbps	rpq	rkbpq	wpi	wkbpi	csps	cpups	cspq	cpupq	dbgb1	dbgb2	rss	maxop	p50	p99	tag
1994	29242	0	0.0	12062.0	336.6	0.000	0.000	6.048	172.826	149452	56.6	5.111	155	14.3	47.0	17.1	0.024	7274	7176	ma100244_rel.cz11apur1_c8r32
1994	27932	0	0.0	12067.3	336.8	0.000	0.000	6.051	172.908	144540	56.5	5.175	162	12.8	44.9	14.9	0.032	6969	6873	ma100339_rel.cz11apur1_c8r32
1993	27243	0	0.0	12075.6	337.0	0.000	0.000	6.058	173.123	142493	56.5	5.230	166	12.8	44.9	NA	0.027	6809	6715	ma100433_rel.cz11apur1_c8r32
1994	28117	0	0.0	18.6	2.1	0.000	0.000	0.009	1.061	111640	53.1	3.971	151	12.8	45.0	14.0	0.012	7032	6969	ma100524_rel.cz11apur1_c8r32
1994	28038	0	0.0	165.2	6.0	0.000	0.000	0.083	3.055	112582	53.2	4.015	152	12.9	45.0	13.9	0.012	7017	6905	ma100617_rel.cz11apur1_c8r32
1994	27836	57	0.2	165.1	6.0	0.002	0.008	0.083	3.065	111952	53.1	4.022	153	12.8	45.0	13.9	0.008	6953	6841	ma101107_rel.cz11apur1_c8r32
1994	27740	56	0.2	170.7	6.0	0.002	0.008	0.086	3.083	111581	53.1	4.022	153	12.9	45.0	13.9	0.011	6936	6811	ma110401_rel.cz11bpur1_c8r32
qr1000.L5
qr1000.L5: range queries with 1000 insert/s per client
Performance metrics for all DBMS, not just the ones listed above. Some are normalized by throughput, others are not. Legend for results is here.
ips	qps	rps	rmbps	wps	wmbps	rpq	rkbpq	wpi	wkbpi	csps	cpups	cspq	cpupq	dbgb1	dbgb2	rss	maxop	p50	p99	tag
3989	32762	0	0.0	13960.8	391.1	0.000	0.000	3.500	100.405	161908	58.8	4.942	144	14.3	47.0	17.1	0.035	8151	7800	ma100244_rel.cz11apur1_c8r32
3987	31813	0	0.0	13983.9	391.8	0.000	0.000	3.508	100.637	158983	58.5	4.997	147	12.8	44.9	14.9	0.057	7912	7704	ma100339_rel.cz11apur1_c8r32
3989	30919	0	0.0	13779.8	386.1	0.000	0.000	3.455	99.118	156058	58.3	5.047	151	12.8	44.9	NA	0.040	7736	7544	ma100433_rel.cz11apur1_c8r32
3989	32448	0	0.0	36.5	4.2	0.000	0.000	0.009	1.073	123061	54.6	3.793	135	12.8	45.0	14.0	0.022	8135	7997	ma100524_rel.cz11apur1_c8r32
3987	32471	0	0.0	417.7	14.2	0.000	0.000	0.105	3.657	125657	54.8	3.870	135	12.9	45.0	14.0	0.032	8151	7962	ma100617_rel.cz11apur1_c8r32
3989	31977	147	0.6	429.1	14.6	0.005	0.018	0.108	3.754	124707	54.7	3.900	137	12.8	45.0	13.9	0.012	8007	7832	ma101107_rel.cz11apur1_c8r32
3987	31931	125	0.5	446.8	14.8	0.004	0.016	0.112	3.794	124722	54.6	3.906	137	12.9	45.0	13.9	0.031	8039	7816	ma110401_rel.cz11bpur1_c8r32
qp1000.L6
qp1000.L6: point queries with 1000 insert/s per client
Performance metrics for all DBMS, not just the ones listed above. Some are normalized by throughput, others are not. Legend for results is here.
ips	qps	rps	rmbps	wps	wmbps	rpq	rkbpq	wpi	wkbpi	csps	cpups	cspq	cpupq	dbgb1	dbgb2	rss	maxop	p50	p99	tag
3989	28626	0	0.0	14207.2	398.0	0.000	0.000	3.562	102.163	151989	58.8	5.309	164	14.3	47.0	17.1	0.034	7130	7000	ma100244_rel.cz11apur1_c8r32
3989	27463	0	0.0	14140.0	396.1	0.000	0.000	3.545	101.696	147459	58.6	5.369	171	12.8	44.9	15.0	0.022	6857	6722	ma100339_rel.cz11apur1_c8r32
3989	26799	0	0.0	14070.1	394.2	0.000	0.000	3.527	101.190	145589	58.6	5.433	175	12.8	44.9	NA	0.036	6683	6553	ma100433_rel.cz11apur1_c8r32
3989	28001	0	0.0	37.1	4.2	0.000	0.000	0.009	1.087	110768	54.7	3.956	156	12.8	45.0	14.0	0.018	6989	6905	ma100524_rel.cz11apur1_c8r32
3987	27770	0	0.0	355.4	12.5	0.000	0.000	0.089	3.210	112308	54.7	4.044	158	12.9	45.0	14.0	0.028	6953	6825	ma100617_rel.cz11apur1_c8r32
3989	27367	153	0.6	357.9	12.7	0.006	0.022	0.090	3.251	111758	54.8	4.084	160	12.8	45.0	13.9	0.016	6857	6745	ma101107_rel.cz11apur1_c8r32
3987	27384	149	0.6	358.5	12.5	0.005	0.022	0.090	3.203	111875	54.7	4.085	160	12.9	45.0	13.9	0.016	6841	6731	ma110401_rel.cz11bpur1_c8r32
l.i0
- l.i0: load without secondary indexes
- Legend for results is here.
- Each entry lists the percentage of responses that fit in that bucket (slower than max time for previous bucket, faster than min time for next bucket).
Insert response time histogram
256us	1ms	4ms	16ms	64ms	256ms	1s	4s	16s	gt	max	tag
0.000	97.470	2.196	0.307	0.011	0.016	0.000	0.000	0.000	0.000	0.153	ma100244_rel.cz11apur1_c8r32
0.000	94.629	5.017	0.321	0.017	0.016	0.000	0.000	0.000	0.000	0.136	ma100339_rel.cz11apur1_c8r32
0.000	95.271	4.370	0.328	0.014	0.016	0.000	0.000	0.000	0.000	0.131	ma100433_rel.cz11apur1_c8r32
0.000	91.725	7.660	0.484	0.100	0.031	0.000	0.000	0.000	0.000	0.126	ma100524_rel.cz11apur1_c8r32
0.000	92.357	7.297	0.311	0.017	0.018	0.000	0.000	0.000	0.000	0.181	ma100617_rel.cz11apur1_c8r32
0.000	89.152	10.508	0.305	0.018	0.017	0.000	0.000	0.000	0.000	0.182	ma101107_rel.cz11apur1_c8r32
0.000	89.670	9.994	0.308	0.012	0.017	0.000	0.000	0.000	0.000	0.229	ma110401_rel.cz11bpur1_c8r32
l.x
- l.x: create secondary indexes
- Legend for results is here.
- Each entry lists the percentage of responses that fit in that bucket (slower than max time for previous bucket, faster than min time for next bucket).
TODO - determine whether there is data for create index response time
l.i1
- l.i1: continue load after secondary indexes created with 50 inserts per transaction
- Legend for results is here.
- Each entry lists the percentage of responses that fit in that bucket (slower than max time for previous bucket, faster than min time for next bucket).
Insert response time histogram
256us	1ms	4ms	16ms	64ms	256ms	1s	4s	16s	gt	max	tag
0.000	0.096	89.937	9.509	0.131	0.177	0.151	0.000	0.000	0.000	0.276	ma100244_rel.cz11apur1_c8r32
0.000	0.558	91.447	7.365	0.091	0.269	0.270	0.000	0.000	0.000	0.339	ma100339_rel.cz11apur1_c8r32
0.000	0.360	91.769	7.236	0.087	0.232	0.317	0.000	0.000	0.000	0.274	ma100433_rel.cz11apur1_c8r32
0.000	1.888	96.085	1.272	0.052	0.377	0.327	nonzero	0.000	0.000	1.037	ma100524_rel.cz11apur1_c8r32
0.000	6.274	91.505	1.494	0.066	0.087	0.574	0.000	0.000	0.000	0.361	ma100617_rel.cz11apur1_c8r32
0.000	6.033	91.772	1.527	0.057	0.057	0.554	0.000	0.000	0.000	0.323	ma101107_rel.cz11apur1_c8r32
0.000	14.169	82.965	1.953	0.252	0.077	0.584	0.000	0.000	0.000	0.390	ma110401_rel.cz11bpur1_c8r32
Delete response time histogram
256us	1ms	4ms	16ms	64ms	256ms	1s	4s	16s	gt	max	tag
0.000	4.374	85.650	9.527	0.122	0.192	0.136	0.000	0.000	0.000	0.267	ma100244_rel.cz11apur1_c8r32
0.000	16.743	75.292	7.339	0.086	0.320	0.220	0.000	0.000	0.000	0.271	ma100339_rel.cz11apur1_c8r32
0.000	17.109	75.067	7.191	0.084	0.291	0.259	0.000	0.000	0.000	0.274	ma100433_rel.cz11apur1_c8r32
0.000	28.163	69.870	1.220	0.043	0.552	0.152	0.000	0.000	0.000	0.424	ma100524_rel.cz11apur1_c8r32
0.000	39.149	58.708	1.425	0.058	0.114	0.546	0.000	0.000	0.000	0.294	ma100617_rel.cz11apur1_c8r32
0.000	34.696	63.206	1.440	0.048	0.068	0.542	0.000	0.000	0.000	0.322	ma101107_rel.cz11apur1_c8r32
0.000	42.335	54.953	1.827	0.226	0.087	0.572	0.000	0.000	0.000	0.372	ma110401_rel.cz11bpur1_c8r32
l.i2
- l.i2: continue load after secondary indexes created with 5 inserts per transaction
- Legend for results is here.
- Each entry lists the percentage of responses that fit in that bucket (slower than max time for previous bucket, faster than min time for next bucket).
Insert response time histogram
256us	1ms	4ms	16ms	64ms	256ms	1s	4s	16s	gt	max	tag
24.688	71.926	1.088	1.586	0.709	0.002	0.000	0.000	0.000	0.000	0.145	ma100244_rel.cz11apur1_c8r32
27.459	69.692	1.071	1.349	0.426	0.002	0.000	0.000	0.000	0.000	0.153	ma100339_rel.cz11apur1_c8r32
26.570	70.582	1.069	1.345	0.433	0.002	0.000	0.000	0.000	0.000	0.151	ma100433_rel.cz11apur1_c8r32
26.776	71.145	1.151	0.144	0.782	0.002	0.000	0.000	0.000	0.000	0.146	ma100524_rel.cz11apur1_c8r32
26.809	71.327	0.917	0.125	0.819	0.003	0.000	0.000	0.000	0.000	0.181	ma100617_rel.cz11apur1_c8r32
11.980	86.305	1.031	0.184	0.497	0.003	0.000	0.000	0.000	0.000	0.146	ma101107_rel.cz11apur1_c8r32
17.777	80.342	0.913	0.347	0.618	0.003	0.000	0.000	0.000	0.000	0.142	ma110401_rel.cz11bpur1_c8r32
Delete response time histogram
256us	1ms	4ms	16ms	64ms	256ms	1s	4s	16s	gt	max	tag
25.959	70.679	1.072	1.579	0.709	0.002	0.000	0.000	0.000	0.000	0.144	ma100244_rel.cz11apur1_c8r32
28.888	68.212	1.129	1.343	0.426	0.002	0.000	0.000	0.000	0.000	0.159	ma100339_rel.cz11apur1_c8r32
28.443	68.661	1.122	1.340	0.432	0.002	0.000	0.000	0.000	0.000	0.144	ma100433_rel.cz11apur1_c8r32
29.178	68.781	1.125	0.133	0.782	0.002	0.000	0.000	0.000	0.000	0.146	ma100524_rel.cz11apur1_c8r32
29.824	68.330	0.901	0.122	0.820	0.003	0.000	0.000	0.000	0.000	0.180	ma100617_rel.cz11apur1_c8r32
16.434	81.854	1.031	0.181	0.497	0.003	0.000	0.000	0.000	0.000	0.146	ma101107_rel.cz11apur1_c8r32
21.802	76.348	0.912	0.318	0.617	0.003	0.000	0.000	0.000	0.000	0.142	ma110401_rel.cz11bpur1_c8r32
qr100.L1
- qr100.L1: range queries with 100 insert/s per client
- Legend for results is here.
- Each entry lists the percentage of responses that fit in that bucket (slower than max time for previous bucket, faster than min time for next bucket).
Query response time histogram
256us	1ms	4ms	16ms	64ms	256ms	1s	4s	16s	gt	max	tag
99.977	0.021	0.001	nonzero	nonzero	0.000	0.000	0.000	0.000	0.000	0.022	ma100244_rel.cz11apur1_c8r32
99.975	0.023	0.002	nonzero	nonzero	0.000	0.000	0.000	0.000	0.000	0.021	ma100339_rel.cz11apur1_c8r32
99.970	0.029	0.001	nonzero	nonzero	0.000	0.000	0.000	0.000	0.000	0.021	ma100433_rel.cz11apur1_c8r32
99.992	0.007	nonzero	0.000	0.000	0.000	0.000	0.000	0.000	0.000	0.002	ma100524_rel.cz11apur1_c8r32
99.992	0.008	nonzero	nonzero	0.000	0.000	0.000	0.000	0.000	0.000	0.004	ma100617_rel.cz11apur1_c8r32
99.992	0.008	0.001	0.000	0.000	0.000	0.000	0.000	0.000	0.000	0.003	ma101107_rel.cz11apur1_c8r32
99.992	0.007	0.001	0.000	0.000	0.000	0.000	0.000	0.000	0.000	0.002	ma110401_rel.cz11bpur1_c8r32
Insert response time histogram
256us	1ms	4ms	16ms	64ms	256ms	1s	4s	16s	gt	max	tag
0.000	0.792	95.993	3.028	0.188	0.000	0.000	0.000	0.000	0.000	0.027	ma100244_rel.cz11apur1_c8r32
0.000	1.500	95.424	2.861	0.215	0.000	0.000	0.000	0.000	0.000	0.025	ma100339_rel.cz11apur1_c8r32
0.000	0.889	95.938	3.021	0.153	0.000	0.000	0.000	0.000	0.000	0.027	ma100433_rel.cz11apur1_c8r32
0.000	6.611	93.389	0.000	0.000	0.000	0.000	0.000	0.000	0.000	0.003	ma100524_rel.cz11apur1_c8r32
0.000	11.889	88.104	0.007	0.000	0.000	0.000	0.000	0.000	0.000	0.005	ma100617_rel.cz11apur1_c8r32
0.000	1.424	57.028	41.549	0.000	0.000	0.000	0.000	0.000	0.000	0.012	ma101107_rel.cz11apur1_c8r32
0.000	1.146	52.660	46.194	0.000	0.000	0.000	0.000	0.000	0.000	0.012	ma110401_rel.cz11bpur1_c8r32
Delete response time histogram
256us	1ms	4ms	16ms	64ms	256ms	1s	4s	16s	gt	max	tag
0.000	46.118	50.958	2.792	0.132	0.000	0.000	0.000	0.000	0.000	0.036	ma100244_rel.cz11apur1_c8r32
0.000	77.382	19.979	2.500	0.139	0.000	0.000	0.000	0.000	0.000	0.026	ma100339_rel.cz11apur1_c8r32
0.000	82.611	14.722	2.604	0.062	0.000	0.000	0.000	0.000	0.000	0.024	ma100433_rel.cz11apur1_c8r32
0.000	80.292	19.708	0.000	0.000	0.000	0.000	0.000	0.000	0.000	0.003	ma100524_rel.cz11apur1_c8r32
0.000	50.847	49.146	0.007	0.000	0.000	0.000	0.000	0.000	0.000	0.005	ma100617_rel.cz11apur1_c8r32
0.000	13.514	44.944	41.542	0.000	0.000	0.000	0.000	0.000	0.000	0.012	ma101107_rel.cz11apur1_c8r32
0.000	10.632	43.188	46.181	0.000	0.000	0.000	0.000	0.000	0.000	0.011	ma110401_rel.cz11bpur1_c8r32
qp100.L2
- qp100.L2: point queries with 100 insert/s per client
- Legend for results is here.
- Each entry lists the percentage of responses that fit in that bucket (slower than max time for previous bucket, faster than min time for next bucket).
Query response time histogram
256us	1ms	4ms	16ms	64ms	256ms	1s	4s	16s	gt	max	tag
99.983	0.017	nonzero	nonzero	0.000	0.000	0.000	0.000	0.000	0.000	0.008	ma100244_rel.cz11apur1_c8r32
99.969	0.030	0.001	nonzero	nonzero	0.000	0.000	0.000	0.000	0.000	0.026	ma100339_rel.cz11apur1_c8r32
99.958	0.041	0.001	nonzero	nonzero	0.000	0.000	0.000	0.000	0.000	0.020	ma100433_rel.cz11apur1_c8r32
99.959	0.041	nonzero	0.000	0.000	0.000	0.000	0.000	0.000	0.000	0.002	ma100524_rel.cz11apur1_c8r32
99.942	0.057	0.001	0.000	0.000	0.000	0.000	0.000	0.000	0.000	0.003	ma100617_rel.cz11apur1_c8r32
99.939	0.061	nonzero	0.000	0.000	0.000	0.000	0.000	0.000	0.000	0.002	ma101107_rel.cz11apur1_c8r32
99.937	0.061	0.002	0.000	0.000	0.000	0.000	0.000	0.000	0.000	0.002	ma110401_rel.cz11bpur1_c8r32
Insert response time histogram
256us	1ms	4ms	16ms	64ms	256ms	1s	4s	16s	gt	max	tag
0.000	0.201	96.493	3.153	0.153	0.000	0.000	0.000	0.000	0.000	0.032	ma100244_rel.cz11apur1_c8r32
0.000	0.472	96.278	3.014	0.236	0.000	0.000	0.000	0.000	0.000	0.036	ma100339_rel.cz11apur1_c8r32
0.000	0.069	96.826	2.972	0.132	0.000	0.000	0.000	0.000	0.000	0.035	ma100433_rel.cz11apur1_c8r32
0.000	3.590	96.403	0.007	0.000	0.000	0.000	0.000	0.000	0.000	0.004	ma100524_rel.cz11apur1_c8r32
0.000	10.278	89.722	0.000	0.000	0.000	0.000	0.000	0.000	0.000	0.004	ma100617_rel.cz11apur1_c8r32
0.000	11.361	87.250	1.389	0.000	0.000	0.000	0.000	0.000	0.000	0.013	ma101107_rel.cz11apur1_c8r32
0.000	0.521	54.153	45.326	0.000	0.000	0.000	0.000	0.000	0.000	0.012	ma110401_rel.cz11bpur1_c8r32
Delete response time histogram
256us	1ms	4ms	16ms	64ms	256ms	1s	4s	16s	gt	max	tag
0.000	38.396	58.861	2.576	0.167	0.000	0.000	0.000	0.000	0.000	0.028	ma100244_rel.cz11apur1_c8r32
0.000	76.160	21.188	2.535	0.118	0.000	0.000	0.000	0.000	0.000	0.028	ma100339_rel.cz11apur1_c8r32
0.000	69.035	28.264	2.604	0.097	0.000	0.000	0.000	0.000	0.000	0.028	ma100433_rel.cz11apur1_c8r32
0.000	69.750	30.250	0.000	0.000	0.000	0.000	0.000	0.000	0.000	0.003	ma100524_rel.cz11apur1_c8r32
0.000	56.556	43.444	0.000	0.000	0.000	0.000	0.000	0.000	0.000	0.004	ma100617_rel.cz11apur1_c8r32
0.000	68.299	30.250	1.451	0.000	0.000	0.000	0.000	0.000	0.000	0.012	ma101107_rel.cz11apur1_c8r32
0.000	5.729	48.611	45.660	0.000	0.000	0.000	0.000	0.000	0.000	0.012	ma110401_rel.cz11bpur1_c8r32
qr500.L3
- qr500.L3: range queries with 500 insert/s per client
- Legend for results is here.
- Each entry lists the percentage of responses that fit in that bucket (slower than max time for previous bucket, faster than min time for next bucket).
Query response time histogram
256us	1ms	4ms	16ms	64ms	256ms	1s	4s	16s	gt	max	tag
99.914	0.076	0.009	0.002	nonzero	0.000	0.000	0.000	0.000	0.000	0.032	ma100244_rel.cz11apur1_c8r32
99.900	0.087	0.011	0.002	nonzero	0.000	0.000	0.000	0.000	0.000	0.040	ma100339_rel.cz11apur1_c8r32
99.880	0.108	0.010	0.002	nonzero	0.000	0.000	0.000	0.000	0.000	0.038	ma100433_rel.cz11apur1_c8r32
99.969	0.025	0.006	nonzero	0.000	0.000	0.000	0.000	0.000	0.000	0.012	ma100524_rel.cz11apur1_c8r32
99.965	0.027	0.008	nonzero	nonzero	0.000	0.000	0.000	0.000	0.000	0.016	ma100617_rel.cz11apur1_c8r32
99.954	0.036	0.010	nonzero	nonzero	0.000	0.000	0.000	0.000	0.000	0.022	ma101107_rel.cz11apur1_c8r32
99.950	0.038	0.013	nonzero	nonzero	0.000	0.000	0.000	0.000	0.000	0.016	ma110401_rel.cz11bpur1_c8r32
Insert response time histogram
256us	1ms	4ms	16ms	64ms	256ms	1s	4s	16s	gt	max	tag
0.000	5.388	84.338	9.679	0.596	0.000	0.000	0.000	0.000	0.000	0.051	ma100244_rel.cz11apur1_c8r32
0.000	7.282	82.371	9.804	0.543	0.000	0.000	0.000	0.000	0.000	0.052	ma100339_rel.cz11apur1_c8r32
0.000	6.335	83.237	9.860	0.568	0.000	0.000	0.000	0.000	0.000	0.053	ma100433_rel.cz11apur1_c8r32
0.000	17.243	80.996	1.749	0.013	0.000	0.000	0.000	0.000	0.000	0.037	ma100524_rel.cz11apur1_c8r32
0.000	15.611	81.768	2.606	0.015	0.000	0.000	0.000	0.000	0.000	0.038	ma100617_rel.cz11apur1_c8r32
0.000	7.587	86.171	6.229	0.013	0.000	0.000	0.000	0.000	0.000	0.028	ma101107_rel.cz11apur1_c8r32
0.000	2.461	87.375	10.143	0.021	0.000	0.000	0.000	0.000	0.000	0.062	ma110401_rel.cz11bpur1_c8r32
Delete response time histogram
256us	1ms	4ms	16ms	64ms	256ms	1s	4s	16s	gt	max	tag
0.000	63.847	27.525	8.153	0.475	0.000	0.000	0.000	0.000	0.000	0.057	ma100244_rel.cz11apur1_c8r32
0.000	77.990	13.433	8.165	0.411	0.000	0.000	0.000	0.000	0.000	0.048	ma100339_rel.cz11apur1_c8r32
0.000	76.271	15.024	8.279	0.426	0.000	0.000	0.000	0.000	0.000	0.049	ma100433_rel.cz11apur1_c8r32
0.000	81.997	16.724	1.268	0.011	0.000	0.000	0.000	0.000	0.000	0.037	ma100524_rel.cz11apur1_c8r32
0.000	52.210	45.807	1.969	0.014	0.000	0.000	0.000	0.000	0.000	0.036	ma100617_rel.cz11apur1_c8r32
0.000	38.828	55.560	5.603	0.010	0.000	0.000	0.000	0.000	0.000	0.027	ma101107_rel.cz11apur1_c8r32
0.000	17.339	73.460	9.188	0.014	0.000	0.000	0.000	0.000	0.000	0.032	ma110401_rel.cz11bpur1_c8r32
qp500.L4
- qp500.L4: point queries with 500 insert/s per client
- Legend for results is here.
- Each entry lists the percentage of responses that fit in that bucket (slower than max time for previous bucket, faster than min time for next bucket).
Query response time histogram
256us	1ms	4ms	16ms	64ms	256ms	1s	4s	16s	gt	max	tag
99.940	0.055	0.005	nonzero	nonzero	0.000	0.000	0.000	0.000	0.000	0.024	ma100244_rel.cz11apur1_c8r32
99.922	0.072	0.005	0.001	nonzero	0.000	0.000	0.000	0.000	0.000	0.032	ma100339_rel.cz11apur1_c8r32
99.914	0.080	0.005	0.001	nonzero	0.000	0.000	0.000	0.000	0.000	0.027	ma100433_rel.cz11apur1_c8r32
99.945	0.051	0.004	nonzero	0.000	0.000	0.000	0.000	0.000	0.000	0.012	ma100524_rel.cz11apur1_c8r32
99.918	0.077	0.005	nonzero	0.000	0.000	0.000	0.000	0.000	0.000	0.012	ma100617_rel.cz11apur1_c8r32
99.887	0.097	0.016	nonzero	0.000	0.000	0.000	0.000	0.000	0.000	0.008	ma101107_rel.cz11apur1_c8r32
99.889	0.096	0.015	nonzero	0.000	0.000	0.000	0.000	0.000	0.000	0.011	ma110401_rel.cz11bpur1_c8r32
Insert response time histogram
256us	1ms	4ms	16ms	64ms	256ms	1s	4s	16s	gt	max	tag
0.000	4.629	85.915	8.872	0.583	0.000	0.000	0.000	0.000	0.000	0.050	ma100244_rel.cz11apur1_c8r32
0.000	4.758	85.458	9.257	0.526	0.000	0.000	0.000	0.000	0.000	0.048	ma100339_rel.cz11apur1_c8r32
0.000	2.919	86.581	9.849	0.651	0.000	0.000	0.000	0.000	0.000	0.052	ma100433_rel.cz11apur1_c8r32
0.000	14.342	84.404	1.246	0.008	0.000	0.000	0.000	0.000	0.000	0.038	ma100524_rel.cz11apur1_c8r32
0.000	21.186	78.317	0.485	0.013	0.000	0.000	0.000	0.000	0.000	0.039	ma100617_rel.cz11apur1_c8r32
0.000	0.661	89.006	10.322	0.011	0.000	0.000	0.000	0.000	0.000	0.029	ma101107_rel.cz11apur1_c8r32
0.000	1.196	87.918	10.867	0.019	0.000	0.000	0.000	0.000	0.000	0.032	ma110401_rel.cz11bpur1_c8r32
Delete response time histogram
256us	1ms	4ms	16ms	64ms	256ms	1s	4s	16s	gt	max	tag
0.000	61.369	30.599	7.599	0.433	0.000	0.000	0.000	0.000	0.000	0.050	ma100244_rel.cz11apur1_c8r32
0.000	71.971	19.747	7.832	0.450	0.000	0.000	0.000	0.000	0.000	0.048	ma100339_rel.cz11apur1_c8r32
0.000	70.626	20.535	8.369	0.469	0.000	0.000	0.000	0.000	0.000	0.040	ma100433_rel.cz11apur1_c8r32
0.000	79.994	19.043	0.954	0.008	0.000	0.000	0.000	0.000	0.000	0.038	ma100524_rel.cz11apur1_c8r32
0.000	58.825	40.735	0.431	0.010	0.000	0.000	0.000	0.000	0.000	0.039	ma100617_rel.cz11apur1_c8r32
0.000	14.156	76.596	9.238	0.011	0.000	0.000	0.000	0.000	0.000	0.029	ma101107_rel.cz11apur1_c8r32
0.000	13.908	75.981	10.100	0.011	0.000	0.000	0.000	0.000	0.000	0.032	ma110401_rel.cz11bpur1_c8r32
qr1000.L5
- qr1000.L5: range queries with 1000 insert/s per client
- Legend for results is here.
- Each entry lists the percentage of responses that fit in that bucket (slower than max time for previous bucket, faster than min time for next bucket).
Query response time histogram
256us	1ms	4ms	16ms	64ms	256ms	1s	4s	16s	gt	max	tag
99.824	0.146	0.026	0.004	nonzero	0.000	0.000	0.000	0.000	0.000	0.035	ma100244_rel.cz11apur1_c8r32
99.798	0.172	0.026	0.004	nonzero	0.000	0.000	0.000	0.000	0.000	0.057	ma100339_rel.cz11apur1_c8r32
99.735	0.232	0.030	0.004	nonzero	0.000	0.000	0.000	0.000	0.000	0.040	ma100433_rel.cz11apur1_c8r32
99.921	0.062	0.015	0.002	nonzero	0.000	0.000	0.000	0.000	0.000	0.022	ma100524_rel.cz11apur1_c8r32
99.902	0.081	0.016	0.001	nonzero	0.000	0.000	0.000	0.000	0.000	0.032	ma100617_rel.cz11apur1_c8r32
99.931	0.057	0.012	nonzero	0.000	0.000	0.000	0.000	0.000	0.000	0.012	ma101107_rel.cz11apur1_c8r32
99.942	0.050	0.008	0.001	nonzero	0.000	0.000	0.000	0.000	0.000	0.031	ma110401_rel.cz11bpur1_c8r32
Insert response time histogram
256us	1ms	4ms	16ms	64ms	256ms	1s	4s	16s	gt	max	tag
0.000	4.222	83.299	11.897	0.583	0.000	0.000	0.000	0.000	0.000	0.050	ma100244_rel.cz11apur1_c8r32
0.000	5.960	82.247	11.298	0.494	0.000	0.000	0.000	0.000	0.000	0.059	ma100339_rel.cz11apur1_c8r32
0.000	6.621	82.251	10.733	0.395	0.000	0.000	0.000	0.000	0.000	0.041	ma100433_rel.cz11apur1_c8r32
0.000	10.369	85.096	4.460	0.075	0.000	0.000	0.000	0.000	0.000	0.052	ma100524_rel.cz11apur1_c8r32
0.000	18.758	78.447	2.767	0.029	0.000	0.000	0.000	0.000	0.000	0.044	ma100617_rel.cz11apur1_c8r32
0.000	18.163	78.803	3.026	0.008	0.000	0.000	0.000	0.000	0.000	0.033	ma101107_rel.cz11apur1_c8r32
0.000	32.204	65.633	2.131	0.032	0.000	0.000	0.000	0.000	0.000	0.032	ma110401_rel.cz11bpur1_c8r32
Delete response time histogram
256us	1ms	4ms	16ms	64ms	256ms	1s	4s	16s	gt	max	tag
0.000	58.361	31.448	9.727	0.464	0.000	0.000	0.000	0.000	0.000	0.044	ma100244_rel.cz11apur1_c8r32
0.000	72.666	17.879	9.056	0.399	0.000	0.000	0.000	0.000	0.000	0.052	ma100339_rel.cz11apur1_c8r32
0.000	75.708	15.339	8.696	0.258	0.000	0.000	0.000	0.000	0.000	0.043	ma100433_rel.cz11apur1_c8r32
0.000	69.351	27.028	3.551	0.070	0.000	0.000	0.000	0.000	0.000	0.042	ma100524_rel.cz11apur1_c8r32
0.000	61.049	36.519	2.406	0.027	0.000	0.000	0.000	0.000	0.000	0.042	ma100617_rel.cz11apur1_c8r32
0.000	64.862	32.660	2.473	0.006	0.000	0.000	0.000	0.000	0.000	0.032	ma101107_rel.cz11apur1_c8r32
0.000	70.389	27.787	1.808	0.016	0.000	0.000	0.000	0.000	0.000	0.032	ma110401_rel.cz11bpur1_c8r32
qp1000.L6
- qp1000.L6: point queries with 1000 insert/s per client
- Legend for results is here.
- Each entry lists the percentage of responses that fit in that bucket (slower than max time for previous bucket, faster than min time for next bucket).
Query response time histogram
256us	1ms	4ms	16ms	64ms	256ms	1s	4s	16s	gt	max	tag
99.858	0.126	0.015	0.002	nonzero	0.000	0.000	0.000	0.000	0.000	0.034	ma100244_rel.cz11apur1_c8r32
99.835	0.146	0.016	0.002	nonzero	0.000	0.000	0.000	0.000	0.000	0.022	ma100339_rel.cz11apur1_c8r32
99.834	0.149	0.016	0.002	nonzero	0.000	0.000	0.000	0.000	0.000	0.036	ma100433_rel.cz11apur1_c8r32
99.889	0.093	0.016	0.002	nonzero	0.000	0.000	0.000	0.000	0.000	0.018	ma100524_rel.cz11apur1_c8r32
99.885	0.103	0.011	nonzero	nonzero	0.000	0.000	0.000	0.000	0.000	0.028	ma100617_rel.cz11apur1_c8r32
99.873	0.117	0.010	nonzero	nonzero	0.000	0.000	0.000	0.000	0.000	0.016	ma101107_rel.cz11apur1_c8r32
99.876	0.113	0.010	nonzero	0.000	0.000	0.000	0.000	0.000	0.000	0.016	ma110401_rel.cz11bpur1_c8r32
Insert response time histogram
256us	1ms	4ms	16ms	64ms	256ms	1s	4s	16s	gt	max	tag
0.000	5.600	83.405	10.438	0.558	0.000	0.000	0.000	0.000	0.000	0.055	ma100244_rel.cz11apur1_c8r32
0.000	5.736	82.470	11.243	0.551	0.000	0.000	0.000	0.000	0.000	0.057	ma100339_rel.cz11apur1_c8r32
0.000	4.295	84.271	10.898	0.536	0.000	0.000	0.000	0.000	0.000	0.057	ma100433_rel.cz11apur1_c8r32
0.000	6.126	88.704	5.084	0.086	0.000	0.000	0.000	0.000	0.000	0.044	ma100524_rel.cz11apur1_c8r32
0.000	15.144	82.567	2.273	0.017	0.000	0.000	0.000	0.000	0.000	0.041	ma100617_rel.cz11apur1_c8r32
0.000	13.897	83.936	2.162	0.006	0.000	0.000	0.000	0.000	0.000	0.035	ma101107_rel.cz11apur1_c8r32
0.000	19.472	77.906	2.594	0.027	0.000	0.000	0.000	0.000	0.000	0.033	ma110401_rel.cz11bpur1_c8r32
Delete response time histogram
256us	1ms	4ms	16ms	64ms	256ms	1s	4s	16s	gt	max	tag
0.000	63.269	27.808	8.497	0.426	0.000	0.000	0.000	0.000	0.000	0.059	ma100244_rel.cz11apur1_c8r32
0.000	71.812	18.771	9.003	0.414	0.000	0.000	0.000	0.000	0.000	0.058	ma100339_rel.cz11apur1_c8r32
0.000	71.837	19.031	8.730	0.401	0.001	0.000	0.000	0.000	0.000	0.066	ma100433_rel.cz11apur1_c8r32
0.000	63.878	31.813	4.231	0.078	0.000	0.000	0.000	0.000	0.000	0.048	ma100524_rel.cz11apur1_c8r32
0.000	60.304	37.633	2.040	0.023	0.000	0.000	0.000	0.000	0.000	0.043	ma100617_rel.cz11apur1_c8r32
0.000	61.240	36.850	1.907	0.003	0.000	0.000	0.000	0.000	0.000	0.034	ma101107_rel.cz11apur1_c8r32
0.000	60.481	37.293	2.214	0.012	0.000	0.000	0.000	0.000	0.000	0.033	ma110401_rel.cz11bpur1_c8r32