Introduction
This is a report for the insert benchmark with 50M docs and 1 client(s). It is generated by scripts (bash, awk, sed) and Tufte might not be impressed. An overview of the insert benchmark is here and a short update is here. Below, by DBMS, I mean DBMS+version.config. An example is my8020.c10b40 where my means MySQL, 8020 is version 8.0.20 and c10b40 is the name for the configuration file.
The test server has 8 AMD cores, 32G RAM and an NVMe SSD. It is described here as the ASUS PN53. The benchmark was run with 1 client and there were 1 or 3 connections per client (1 for queries or inserts without rate limits, 1+1 for rate limited inserts+deletes). It uses 1 table. It loads 50M rows per table without secondary indexes, creates 3 secondary indexes per table, then inserts 40m+10m rows per table with a delete per insert to avoid growing the table. It then does 6 read+write tests for 1800s each that do queries as fast as possible with 100,100,500,500,1000,1000 inserts/s and the same for deletes/s per client concurrent with the queries. The database is cached in memory. Clients and the DBMS share one server. The per-database configs are in the per-database subdirectories here.
The tested DBMS are:
- my5651_rel.cz11a_c8r32 - MySQL 5.6.51 with the cz11a_c8r32 config
- my5744_rel.cz11a_c8r32 - MySQL 5.7.44 with the cz11a_c8r32 config that uses innodb_purge_threads=4
- my5744_rel.cz11apur1_c8r32 - MySQL 5.7.44 with the cz11apur1_c8r32 config that uses innodb_purge_threads=1
- my8036_rel.cz11a_c8r32 - MySQL 8.0.36 with the cz11a_c8r32 config that uses innodb_purge_threads=4
- my8036_rel.cz11apur1_c8r32 - MySQL 8.0.36 with the cz11apur1_c8r32 config that uses innodb_purge_threads=1
Contents
- Summary
- l.i0: load without secondary indexes
- l.x: create secondary indexes
- l.i1: continue load after secondary indexes created with 50 inserts per transaction
- l.i2: continue load after secondary indexes created with 5 inserts per transaction
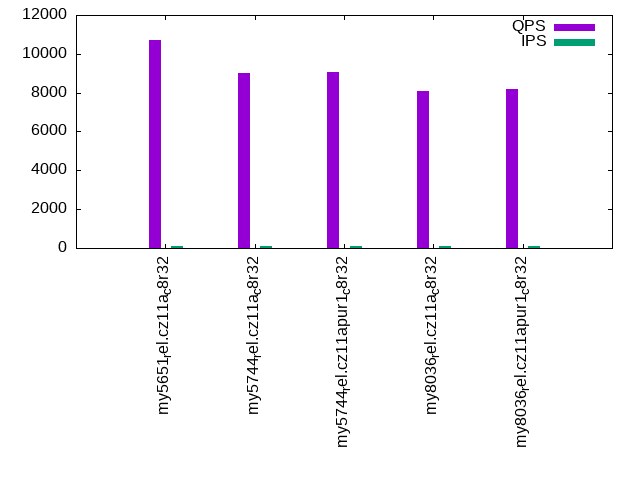
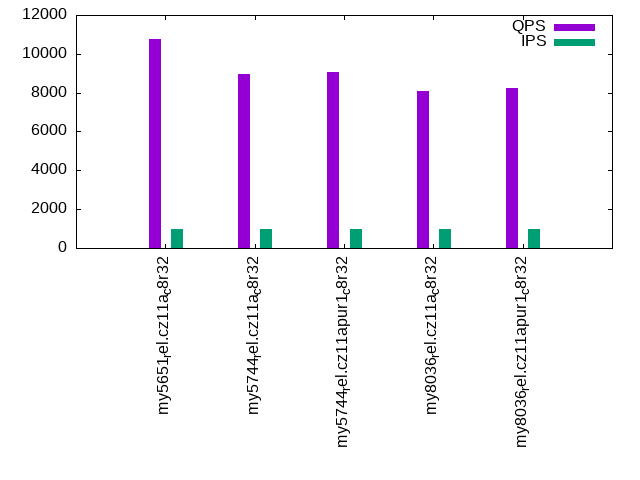
- qr100.L1: range queries with 100 insert/s per client
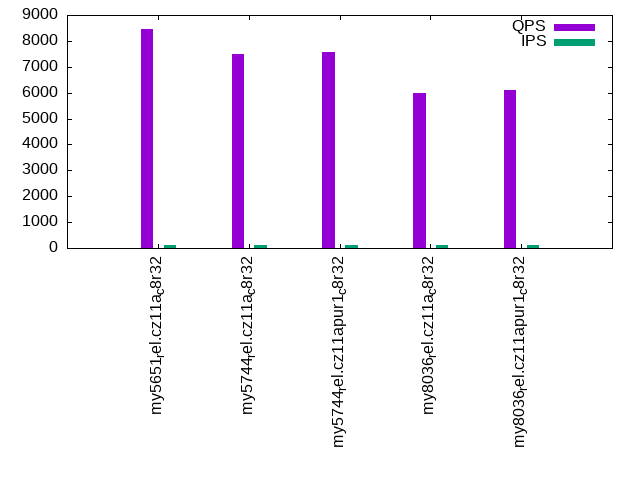
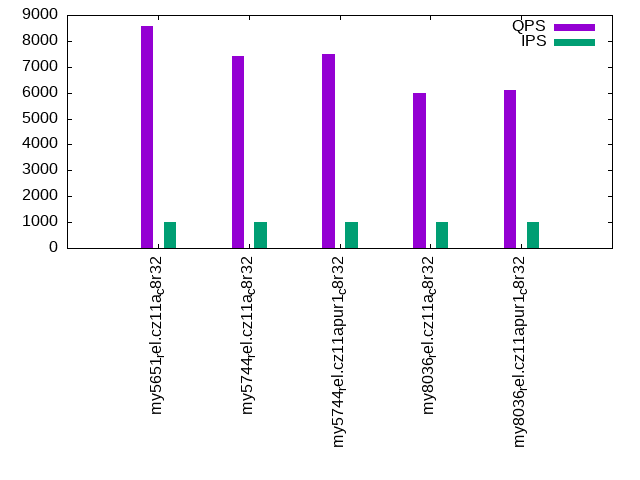
- qp100.L2: point queries with 100 insert/s per client
- qr500.L3: range queries with 500 insert/s per client
- qp500.L4: point queries with 500 insert/s per client
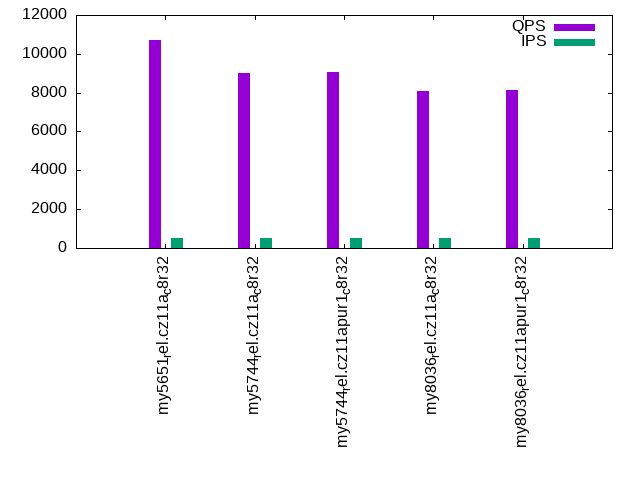
- qr1000.L5: range queries with 1000 insert/s per client
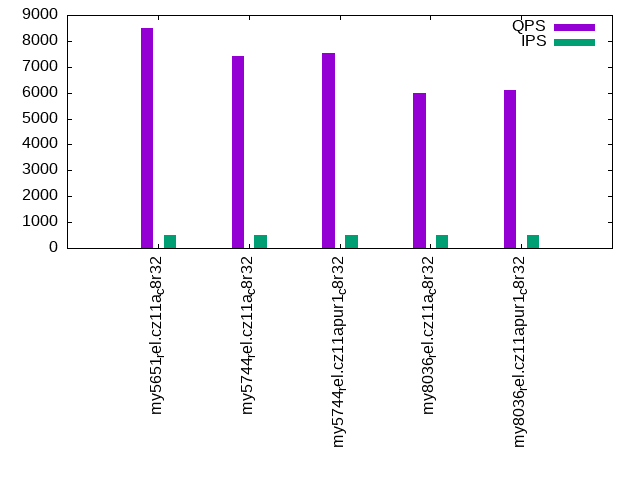
- qp1000.L6: point queries with 1000 insert/s per client
Summary
The numbers are inserts/s for l.i0, l.i1 and l.i2, indexed docs (or rows) /s for l.x and queries/s for qr100, qp100 thru qr1000, qp1000" The values are the average rate over the entire test for inserts (IPS) and queries (QPS). The range of values for IPS and QPS is split into 3 parts: bottom 25%, middle 50%, top 25%. Values in the bottom 25% have a red background, values in the top 25% have a green background and values in the middle have no color. A gray background is used for values that can be ignored because the DBMS did not sustain the target insert rate. Red backgrounds are not used when the minimum value is within 80% of the max value.
| dbms | l.i0 | l.x | l.i1 | l.i2 | qr100 | qp100 | qr500 | qp500 | qr1000 | qp1000 |
|---|---|---|---|---|---|---|---|---|---|---|
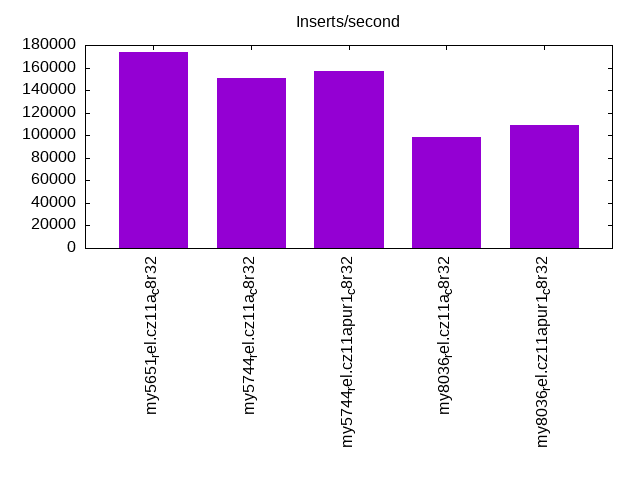
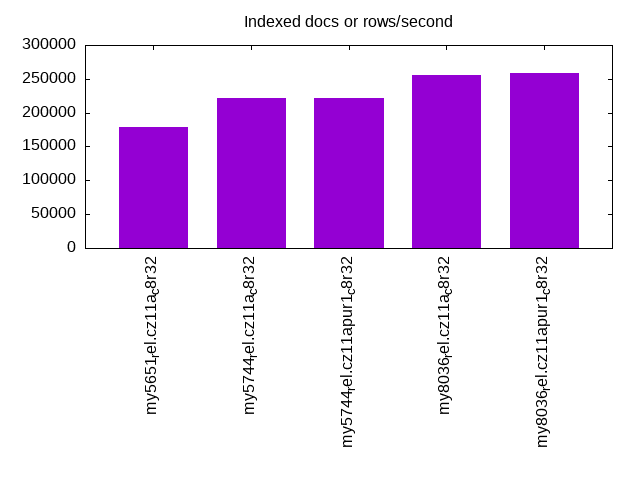
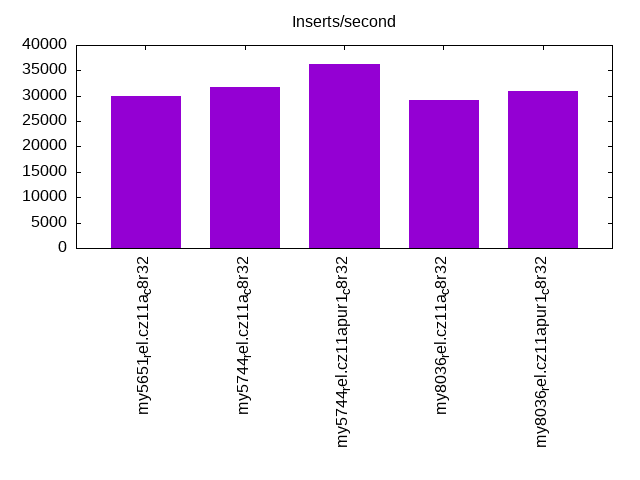
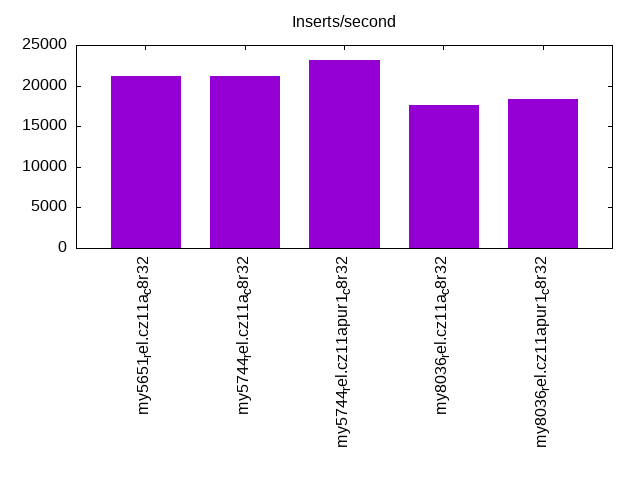
| my5651_rel.cz11a_c8r32 | 174216 | 179212 | 29895 | 21142 | 10706 | 8446 | 10693 | 8495 | 10766 | 8592 |
| my5744_rel.cz11a_c8r32 | 150602 | 221239 | 31671 | 21142 | 9031 | 7503 | 9036 | 7420 | 8942 | 7433 |
| my5744_rel.cz11apur1_c8r32 | 157233 | 222223 | 36199 | 23095 | 9074 | 7573 | 9056 | 7514 | 9074 | 7508 |
| my8036_rel.cz11a_c8r32 | 98039 | 255102 | 29218 | 17668 | 8079 | 6002 | 8106 | 5985 | 8081 | 6006 |
| my8036_rel.cz11apur1_c8r32 | 108696 | 259068 | 30960 | 18349 | 8207 | 6109 | 8146 | 6099 | 8230 | 6095 |
This table has relative throughput, throughput for the DBMS relative to the DBMS in the first line, using the absolute throughput from the previous table. Values less than 0.95 have a yellow background. Values greater than 1.05 have a blue background.
| dbms | l.i0 | l.x | l.i1 | l.i2 | qr100 | qp100 | qr500 | qp500 | qr1000 | qp1000 |
|---|---|---|---|---|---|---|---|---|---|---|
| my5651_rel.cz11a_c8r32 | 1.00 | 1.00 | 1.00 | 1.00 | 1.00 | 1.00 | 1.00 | 1.00 | 1.00 | 1.00 |
| my5744_rel.cz11a_c8r32 | 0.86 | 1.23 | 1.06 | 1.00 | 0.84 | 0.89 | 0.85 | 0.87 | 0.83 | 0.87 |
| my5744_rel.cz11apur1_c8r32 | 0.90 | 1.24 | 1.21 | 1.09 | 0.85 | 0.90 | 0.85 | 0.88 | 0.84 | 0.87 |
| my8036_rel.cz11a_c8r32 | 0.56 | 1.42 | 0.98 | 0.84 | 0.75 | 0.71 | 0.76 | 0.70 | 0.75 | 0.70 |
| my8036_rel.cz11apur1_c8r32 | 0.62 | 1.45 | 1.04 | 0.87 | 0.77 | 0.72 | 0.76 | 0.72 | 0.76 | 0.71 |
This lists the average rate of inserts/s for the tests that do inserts concurrent with queries. For such tests the query rate is listed in the table above. The read+write tests are setup so that the insert rate should match the target rate every second. Cells that are not at least 95% of the target have a red background to indicate a failure to satisfy the target.
| dbms | qr100.L1 | qp100.L2 | qr500.L3 | qp500.L4 | qr1000.L5 | qp1000.L6 |
|---|---|---|---|---|---|---|
| my5651_rel.cz11a_c8r32 | 100 | 100 | 499 | 499 | 999 | 999 |
| my5744_rel.cz11a_c8r32 | 100 | 100 | 499 | 499 | 999 | 999 |
| my5744_rel.cz11apur1_c8r32 | 100 | 100 | 499 | 499 | 999 | 999 |
| my8036_rel.cz11a_c8r32 | 100 | 100 | 499 | 499 | 999 | 999 |
| my8036_rel.cz11apur1_c8r32 | 100 | 100 | 499 | 499 | 999 | 999 |
| target | 100 | 100 | 500 | 500 | 1000 | 1000 |
l.i0
l.i0: load without secondary indexes. Graphs for performance per 1-second interval are here.
Average throughput:
Insert response time histogram: each cell has the percentage of responses that take <= the time in the header and max is the max response time in seconds. For the max column values in the top 25% of the range have a red background and in the bottom 25% of the range have a green background. The red background is not used when the min value is within 80% of the max value.
| dbms | 256us | 1ms | 4ms | 16ms | 64ms | 256ms | 1s | 4s | 16s | gt | max |
|---|---|---|---|---|---|---|---|---|---|---|---|
| my5651_rel.cz11a_c8r32 | 99.693 | 0.242 | 0.053 | 0.010 | 0.001 | 0.149 | |||||
| my5744_rel.cz11a_c8r32 | 99.547 | 0.191 | 0.129 | 0.132 | 0.001 | 0.084 | |||||
| my5744_rel.cz11apur1_c8r32 | 99.560 | 0.177 | 0.132 | 0.130 | 0.001 | 0.144 | |||||
| my8036_rel.cz11a_c8r32 | 86.376 | 13.218 | 0.271 | 0.133 | 0.002 | 0.085 | |||||
| my8036_rel.cz11apur1_c8r32 | 99.249 | 0.367 | 0.252 | 0.131 | 0.002 | 0.079 |
Performance metrics for the DBMS listed above. Some are normalized by throughput, others are not. Legend for results is here.
ips	qps	rps	rmbps	wps	wmbps	rpq	rkbpq	wpi	wkbpi	csps	cpups	cspq	cpupq	dbgb1	dbgb2	rss	maxop	p50	p99	tag
174216	0	1526	6.0	749.0	51.5	0.009	0.035	0.004	0.303	20690	21.5	0.119	10	3.3	33.8	4.7	0.149	174800	149339	my5651_rel.cz11a_c8r32
150602	0	0	0.0	665.7	44.9	0.000	0.000	0.004	0.305	15565	19.9	0.103	11	3.3	33.8	5.3	0.084	150334	136751	my5744_rel.cz11a_c8r32
157233	0	0	0.0	695.9	47.0	0.000	0.000	0.004	0.306	16251	20.7	0.103	11	3.3	33.8	5.1	0.144	158029	144243	my5744_rel.cz11apur1_c8r32
98039	0	0	0.0	519.2	31.8	0.000	0.000	0.005	0.333	11433	17.8	0.117	15	3.3	33.9	5.5	0.085	98490	88902	my8036_rel.cz11a_c8r32
108696	0	0	0.0	576.2	35.3	0.000	0.000	0.005	0.333	12490	17.8	0.115	13	3.3	33.9	5.4	0.079	109179	100591	my8036_rel.cz11apur1_c8r32
l.x
l.x: create secondary indexes.
Average throughput:
Performance metrics for the DBMS listed above. Some are normalized by throughput, others are not. Legend for results is here.
ips	qps	rps	rmbps	wps	wmbps	rpq	rkbpq	wpi	wkbpi	csps	cpups	cspq	cpupq	dbgb1	dbgb2	rss	maxop	p50	p99	tag
179212	0	11	0.0	2467.1	190.4	0.000	0.000	0.014	1.088	3869	11.8	0.022	5	7.0	37.5	8.4	0.002	NA	NA	my5651_rel.cz11a_c8r32
221239	0	0	0.0	3427.0	220.9	0.000	0.000	0.015	1.023	13512	12.1	0.061	4	7.6	38.1	7.8	0.001	NA	NA	my5744_rel.cz11a_c8r32
222223	0	0	0.0	3517.9	222.8	0.000	0.000	0.016	1.027	13764	12.1	0.062	4	7.6	38.1	7.8	0.001	NA	NA	my5744_rel.cz11apur1_c8r32
255102	0	1295	82.0	5643.8	304.4	0.005	0.329	0.022	1.222	18932	40.5	0.074	13	7.6	38.1	8.9	0.002	NA	NA	my8036_rel.cz11a_c8r32
259068	0	1330	84.2	5274.5	304.2	0.005	0.333	0.020	1.202	18413	40.9	0.071	13	7.6	38.1	9.1	0.002	NA	NA	my8036_rel.cz11apur1_c8r32
l.i1
l.i1: continue load after secondary indexes created with 50 inserts per transaction. Graphs for performance per 1-second interval are here.
Average throughput:
Insert response time histogram: each cell has the percentage of responses that take <= the time in the header and max is the max response time in seconds. For the max column values in the top 25% of the range have a red background and in the bottom 25% of the range have a green background. The red background is not used when the min value is within 80% of the max value.
| dbms | 256us | 1ms | 4ms | 16ms | 64ms | 256ms | 1s | 4s | 16s | gt | max |
|---|---|---|---|---|---|---|---|---|---|---|---|
| my5651_rel.cz11a_c8r32 | 3.650 | 93.735 | 2.424 | 0.190 | 0.001 | 0.083 | |||||
| my5744_rel.cz11a_c8r32 | 0.356 | 97.451 | 2.139 | 0.053 | 0.001 | 0.093 | |||||
| my5744_rel.cz11apur1_c8r32 | 0.433 | 97.428 | 2.084 | 0.054 | 0.001 | 0.091 | |||||
| my8036_rel.cz11a_c8r32 | 97.822 | 2.051 | 0.126 | 0.001 | 0.074 | ||||||
| my8036_rel.cz11apur1_c8r32 | 97.843 | 2.025 | 0.131 | 0.001 | 0.097 |
Delete response time histogram: each cell has the percentage of responses that take <= the time in the header and max is the max response time in seconds. For the max column values in the top 25% of the range have a red background and in the bottom 25% of the range have a green background. The red background is not used when the min value is within 80% of the max value.
| dbms | 256us | 1ms | 4ms | 16ms | 64ms | 256ms | 1s | 4s | 16s | gt | max |
|---|---|---|---|---|---|---|---|---|---|---|---|
| my5651_rel.cz11a_c8r32 | 65.418 | 33.131 | 1.300 | 0.150 | 0.001 | 0.083 | |||||
| my5744_rel.cz11a_c8r32 | 57.763 | 40.682 | 1.542 | 0.012 | 0.001 | 0.081 | |||||
| my5744_rel.cz11apur1_c8r32 | 94.026 | 4.227 | 1.734 | 0.013 | 0.001 | 0.091 | |||||
| my8036_rel.cz11a_c8r32 | 30.858 | 67.601 | 1.514 | 0.027 | 0.001 | 0.091 | |||||
| my8036_rel.cz11apur1_c8r32 | 53.232 | 45.212 | 1.524 | 0.031 | nonzero | 0.088 |
Performance metrics for the DBMS listed above. Some are normalized by throughput, others are not. Legend for results is here.
ips	qps	rps	rmbps	wps	wmbps	rpq	rkbpq	wpi	wkbpi	csps	cpups	cspq	cpupq	dbgb1	dbgb2	rss	maxop	p50	p99	tag
29895	0	812	3.2	3251.1	131.3	0.027	0.109	0.109	4.499	36545	40.8	1.222	109	10.0	40.5	11.5	0.083	32165	7945	my5651_rel.cz11a_c8r32
31671	0	0	0.0	3598.5	143.7	0.000	0.000	0.114	4.647	27021	45.6	0.853	115	10.1	40.7	12.0	0.093	33463	8545	my5744_rel.cz11a_c8r32
36199	0	0	0.0	4130.5	164.0	0.000	0.000	0.114	4.640	26667	34.3	0.737	76	10.6	41.2	12.6	0.091	38020	10348	my5744_rel.cz11apur1_c8r32
29218	0	166	2.6	4754.1	176.3	0.006	0.091	0.163	6.179	48213	35.3	1.650	97	10.4	41.3	12.4	0.074	31266	3897	my8036_rel.cz11a_c8r32
30960	0	175	2.7	4996.7	184.5	0.006	0.091	0.161	6.104	27393	34.3	0.885	89	10.6	41.6	12.7	0.097	33264	3946	my8036_rel.cz11apur1_c8r32
l.i2
l.i2: continue load after secondary indexes created with 5 inserts per transaction. Graphs for performance per 1-second interval are here.
Average throughput:
Insert response time histogram: each cell has the percentage of responses that take <= the time in the header and max is the max response time in seconds. For the max column values in the top 25% of the range have a red background and in the bottom 25% of the range have a green background. The red background is not used when the min value is within 80% of the max value.
| dbms | 256us | 1ms | 4ms | 16ms | 64ms | 256ms | 1s | 4s | 16s | gt | max |
|---|---|---|---|---|---|---|---|---|---|---|---|
| my5651_rel.cz11a_c8r32 | 84.632 | 15.215 | 0.019 | 0.130 | 0.005 | nonzero | 0.071 | ||||
| my5744_rel.cz11a_c8r32 | 85.724 | 14.078 | 0.055 | 0.140 | 0.003 | nonzero | 0.088 | ||||
| my5744_rel.cz11apur1_c8r32 | 96.579 | 3.270 | 0.008 | 0.139 | 0.003 | nonzero | 0.100 | ||||
| my8036_rel.cz11a_c8r32 | 69.276 | 30.566 | 0.015 | 0.140 | 0.001 | nonzero | 0.101 | ||||
| my8036_rel.cz11apur1_c8r32 | 77.509 | 22.345 | 0.008 | 0.137 | 0.001 | 0.060 |
Delete response time histogram: each cell has the percentage of responses that take <= the time in the header and max is the max response time in seconds. For the max column values in the top 25% of the range have a red background and in the bottom 25% of the range have a green background. The red background is not used when the min value is within 80% of the max value.
| dbms | 256us | 1ms | 4ms | 16ms | 64ms | 256ms | 1s | 4s | 16s | gt | max |
|---|---|---|---|---|---|---|---|---|---|---|---|
| my5651_rel.cz11a_c8r32 | 96.033 | 3.815 | 0.018 | 0.130 | 0.005 | nonzero | 0.071 | ||||
| my5744_rel.cz11a_c8r32 | 89.587 | 10.268 | 0.010 | 0.135 | 0.001 | nonzero | 0.088 | ||||
| my5744_rel.cz11apur1_c8r32 | 98.974 | 0.885 | 0.006 | 0.135 | 0.001 | nonzero | 0.100 | ||||
| my8036_rel.cz11a_c8r32 | 80.631 | 19.223 | 0.010 | 0.134 | 0.001 | nonzero | 0.101 | ||||
| my8036_rel.cz11apur1_c8r32 | 92.298 | 7.564 | 0.005 | 0.132 | 0.001 | 0.053 |
Performance metrics for the DBMS listed above. Some are normalized by throughput, others are not. Legend for results is here.
ips	qps	rps	rmbps	wps	wmbps	rpq	rkbpq	wpi	wkbpi	csps	cpups	cspq	cpupq	dbgb1	dbgb2	rss	maxop	p50	p99	tag
21142	0	3789	14.8	2189.2	82.1	0.179	0.717	0.104	3.976	174469	41.6	8.252	157	10.3	40.8	11.8	0.071	21217	19869	my5651_rel.cz11a_c8r32
21142	0	0	0.0	2163.2	82.3	0.000	0.000	0.102	3.986	85403	40.2	4.040	152	10.4	40.9	12.2	0.088	21211	20314	my5744_rel.cz11a_c8r32
23095	0	0	0.0	2430.3	91.5	0.000	0.000	0.105	4.058	91896	34.4	3.979	119	10.9	41.4	12.9	0.100	23220	21077	my5744_rel.cz11apur1_c8r32
17668	0	28	0.4	2478.4	86.3	0.002	0.025	0.140	5.002	86356	34.2	4.888	155	10.6	41.5	12.9	0.101	17731	16767	my8036_rel.cz11a_c8r32
18349	0	28	0.4	2630.8	91.0	0.002	0.025	0.143	5.077	75403	33.4	4.109	146	10.9	41.8	13.2	0.060	18370	17456	my8036_rel.cz11apur1_c8r32
qr100.L1
qr100.L1: range queries with 100 insert/s per client. Graphs for performance per 1-second interval are here.
Average throughput:
Query response time histogram: each cell has the percentage of responses that take <= the time in the header and max is the max response time in seconds. For max values in the top 25% of the range have a red background and in the bottom 25% of the range have a green background. The red background is not used when the min value is within 80% of the max value.
| dbms | 256us | 1ms | 4ms | 16ms | 64ms | 256ms | 1s | 4s | 16s | gt | max |
|---|---|---|---|---|---|---|---|---|---|---|---|
| my5651_rel.cz11a_c8r32 | 99.937 | 0.061 | nonzero | 0.001 | nonzero | 0.024 | |||||
| my5744_rel.cz11a_c8r32 | 99.964 | 0.036 | nonzero | nonzero | 0.010 | ||||||
| my5744_rel.cz11apur1_c8r32 | 99.997 | 0.003 | nonzero | nonzero | 0.010 | ||||||
| my8036_rel.cz11a_c8r32 | 99.935 | 0.065 | nonzero | 0.001 | |||||||
| my8036_rel.cz11apur1_c8r32 | 99.979 | 0.021 | nonzero | 0.002 |
Insert response time histogram: each cell has the percentage of responses that take <= the time in the header and max is the max response time in seconds. For max values in the top 25% of the range have a red background and in the bottom 25% of the range have a green background. The red background is not used when the min value is within 80% of the max value.
| dbms | 256us | 1ms | 4ms | 16ms | 64ms | 256ms | 1s | 4s | 16s | gt | max |
|---|---|---|---|---|---|---|---|---|---|---|---|
| my5651_rel.cz11a_c8r32 | 0.306 | 91.250 | 6.139 | 2.306 | 0.059 | ||||||
| my5744_rel.cz11a_c8r32 | 0.028 | 99.556 | 0.417 | 0.013 | |||||||
| my5744_rel.cz11apur1_c8r32 | 0.917 | 98.889 | 0.194 | 0.011 | |||||||
| my8036_rel.cz11a_c8r32 | 99.194 | 0.778 | 0.028 | 0.024 | |||||||
| my8036_rel.cz11apur1_c8r32 | 99.917 | 0.083 | 0.010 |
Delete response time histogram: each cell has the percentage of responses that take <= the time in the header and max is the max response time in seconds. For max values in the top 25% of the range have a red background and in the bottom 25% of the range have a green background. The red background is not used when the min value is within 80% of the max value.
| dbms | 256us | 1ms | 4ms | 16ms | 64ms | 256ms | 1s | 4s | 16s | gt | max |
|---|---|---|---|---|---|---|---|---|---|---|---|
| my5651_rel.cz11a_c8r32 | 16.111 | 75.222 | 6.556 | 2.111 | 0.038 | ||||||
| my5744_rel.cz11a_c8r32 | 40.500 | 59.194 | 0.306 | 0.012 | |||||||
| my5744_rel.cz11apur1_c8r32 | 53.250 | 46.583 | 0.167 | 0.008 | |||||||
| my8036_rel.cz11a_c8r32 | 17.917 | 81.361 | 0.667 | 0.056 | 0.023 | ||||||
| my8036_rel.cz11apur1_c8r32 | 48.444 | 51.500 | 0.056 | 0.007 |
Performance metrics for the DBMS listed above. Some are normalized by throughput, others are not. Legend for results is here.
ips	qps	rps	rmbps	wps	wmbps	rpq	rkbpq	wpi	wkbpi	csps	cpups	cspq	cpupq	dbgb1	dbgb2	rss	maxop	p50	p99	tag
100	10706	0	0.0	257.4	7.2	0.000	0.000	2.579	73.364	41770	12.7	3.902	95	10.3	40.8	11.8	0.024	10721	10451	my5651_rel.cz11a_c8r32
100	9031	0	0.0	151.9	4.2	0.000	0.000	1.522	42.686	35111	12.6	3.888	112	10.4	40.9	12.2	0.010	9030	8922	my5744_rel.cz11a_c8r32
100	9074	0	0.0	196.1	5.4	0.000	0.000	1.965	55.259	35416	12.6	3.903	111	10.9	41.4	12.9	0.010	9078	9001	my5744_rel.cz11apur1_c8r32
100	8079	0	0.0	209.5	5.3	0.000	0.000	2.099	53.982	31960	12.5	3.956	124	10.6	41.5	12.9	0.001	8087	7991	my8036_rel.cz11a_c8r32
100	8207	0	0.0	181.5	4.6	0.000	0.000	1.818	46.833	32270	12.5	3.932	122	10.9	41.8	13.2	0.002	8215	8151	my8036_rel.cz11apur1_c8r32
qp100.L2
qp100.L2: point queries with 100 insert/s per client. Graphs for performance per 1-second interval are here.
Average throughput:
Query response time histogram: each cell has the percentage of responses that take <= the time in the header and max is the max response time in seconds. For max values in the top 25% of the range have a red background and in the bottom 25% of the range have a green background. The red background is not used when the min value is within 80% of the max value.
| dbms | 256us | 1ms | 4ms | 16ms | 64ms | 256ms | 1s | 4s | 16s | gt | max |
|---|---|---|---|---|---|---|---|---|---|---|---|
| my5651_rel.cz11a_c8r32 | 99.889 | 0.111 | nonzero | 0.001 | |||||||
| my5744_rel.cz11a_c8r32 | 99.839 | 0.161 | nonzero | 0.001 | |||||||
| my5744_rel.cz11apur1_c8r32 | 99.985 | 0.015 | nonzero | 0.003 | |||||||
| my8036_rel.cz11a_c8r32 | 99.618 | 0.381 | nonzero | 0.002 | |||||||
| my8036_rel.cz11apur1_c8r32 | 99.855 | 0.145 | nonzero | 0.002 |
Insert response time histogram: each cell has the percentage of responses that take <= the time in the header and max is the max response time in seconds. For max values in the top 25% of the range have a red background and in the bottom 25% of the range have a green background. The red background is not used when the min value is within 80% of the max value.
| dbms | 256us | 1ms | 4ms | 16ms | 64ms | 256ms | 1s | 4s | 16s | gt | max |
|---|---|---|---|---|---|---|---|---|---|---|---|
| my5651_rel.cz11a_c8r32 | 99.278 | 0.528 | 0.194 | 0.026 | |||||||
| my5744_rel.cz11a_c8r32 | 99.528 | 0.472 | 0.013 | ||||||||
| my5744_rel.cz11apur1_c8r32 | 99.694 | 0.306 | 0.010 | ||||||||
| my8036_rel.cz11a_c8r32 | 99.583 | 0.417 | 0.012 | ||||||||
| my8036_rel.cz11apur1_c8r32 | 99.833 | 0.167 | 0.011 |
Delete response time histogram: each cell has the percentage of responses that take <= the time in the header and max is the max response time in seconds. For max values in the top 25% of the range have a red background and in the bottom 25% of the range have a green background. The red background is not used when the min value is within 80% of the max value.
| dbms | 256us | 1ms | 4ms | 16ms | 64ms | 256ms | 1s | 4s | 16s | gt | max |
|---|---|---|---|---|---|---|---|---|---|---|---|
| my5651_rel.cz11a_c8r32 | 3.528 | 95.778 | 0.528 | 0.167 | 0.025 | ||||||
| my5744_rel.cz11a_c8r32 | 18.028 | 81.528 | 0.444 | 0.011 | |||||||
| my5744_rel.cz11apur1_c8r32 | 49.000 | 50.778 | 0.222 | 0.012 | |||||||
| my8036_rel.cz11a_c8r32 | 0.083 | 99.500 | 0.417 | 0.012 | |||||||
| my8036_rel.cz11apur1_c8r32 | 0.861 | 99.028 | 0.111 | 0.007 |
Performance metrics for the DBMS listed above. Some are normalized by throughput, others are not. Legend for results is here.
ips	qps	rps	rmbps	wps	wmbps	rpq	rkbpq	wpi	wkbpi	csps	cpups	cspq	cpupq	dbgb1	dbgb2	rss	maxop	p50	p99	tag
100	8446	0	0.0	2.4	0.1	0.000	0.000	0.024	1.220	33831	12.9	4.005	122	10.3	40.8	11.8	0.001	8422	7704	my5651_rel.cz11a_c8r32
100	7503	0	0.0	45.4	1.2	0.000	0.000	0.455	12.382	30301	12.7	4.038	135	10.4	40.9	12.2	0.001	7527	6920	my5744_rel.cz11a_c8r32
100	7573	0	0.0	61.9	1.7	0.000	0.000	0.620	16.994	30667	12.6	4.049	133	10.9	41.4	12.9	0.003	7584	7384	my5744_rel.cz11apur1_c8r32
100	6002	0	0.0	54.6	1.4	0.000	0.000	0.547	14.289	24572	13.1	4.094	175	10.6	41.5	12.9	0.002	6009	5722	my8036_rel.cz11a_c8r32
100	6109	0	0.0	53.8	1.4	0.000	0.000	0.539	14.211	24889	13.1	4.074	172	10.9	41.8	13.2	0.002	6110	5961	my8036_rel.cz11apur1_c8r32
qr500.L3
qr500.L3: range queries with 500 insert/s per client. Graphs for performance per 1-second interval are here.
Average throughput:
Query response time histogram: each cell has the percentage of responses that take <= the time in the header and max is the max response time in seconds. For max values in the top 25% of the range have a red background and in the bottom 25% of the range have a green background. The red background is not used when the min value is within 80% of the max value.
| dbms | 256us | 1ms | 4ms | 16ms | 64ms | 256ms | 1s | 4s | 16s | gt | max |
|---|---|---|---|---|---|---|---|---|---|---|---|
| my5651_rel.cz11a_c8r32 | 99.946 | 0.053 | nonzero | nonzero | 0.010 | ||||||
| my5744_rel.cz11a_c8r32 | 99.952 | 0.048 | nonzero | 0.004 | |||||||
| my5744_rel.cz11apur1_c8r32 | 99.994 | 0.006 | nonzero | 0.002 | |||||||
| my8036_rel.cz11a_c8r32 | 99.916 | 0.084 | nonzero | 0.002 | |||||||
| my8036_rel.cz11apur1_c8r32 | 99.975 | 0.025 | nonzero | 0.002 |
Insert response time histogram: each cell has the percentage of responses that take <= the time in the header and max is the max response time in seconds. For max values in the top 25% of the range have a red background and in the bottom 25% of the range have a green background. The red background is not used when the min value is within 80% of the max value.
| dbms | 256us | 1ms | 4ms | 16ms | 64ms | 256ms | 1s | 4s | 16s | gt | max |
|---|---|---|---|---|---|---|---|---|---|---|---|
| my5651_rel.cz11a_c8r32 | 13.600 | 83.883 | 2.394 | 0.122 | 0.022 | ||||||
| my5744_rel.cz11a_c8r32 | 1.217 | 98.544 | 0.239 | 0.013 | |||||||
| my5744_rel.cz11apur1_c8r32 | 5.694 | 93.989 | 0.317 | 0.013 | |||||||
| my8036_rel.cz11a_c8r32 | 99.817 | 0.183 | 0.015 | ||||||||
| my8036_rel.cz11apur1_c8r32 | 99.856 | 0.133 | 0.011 | 0.023 |
Delete response time histogram: each cell has the percentage of responses that take <= the time in the header and max is the max response time in seconds. For max values in the top 25% of the range have a red background and in the bottom 25% of the range have a green background. The red background is not used when the min value is within 80% of the max value.
| dbms | 256us | 1ms | 4ms | 16ms | 64ms | 256ms | 1s | 4s | 16s | gt | max |
|---|---|---|---|---|---|---|---|---|---|---|---|
| my5651_rel.cz11a_c8r32 | 34.933 | 62.567 | 2.383 | 0.117 | 0.021 | ||||||
| my5744_rel.cz11a_c8r32 | 85.106 | 14.678 | 0.217 | 0.013 | |||||||
| my5744_rel.cz11apur1_c8r32 | 86.489 | 13.239 | 0.272 | 0.011 | |||||||
| my8036_rel.cz11a_c8r32 | 37.844 | 62.033 | 0.122 | 0.014 | |||||||
| my8036_rel.cz11apur1_c8r32 | 82.972 | 16.917 | 0.106 | 0.006 | 0.023 |
Performance metrics for the DBMS listed above. Some are normalized by throughput, others are not. Legend for results is here.
ips	qps	rps	rmbps	wps	wmbps	rpq	rkbpq	wpi	wkbpi	csps	cpups	cspq	cpupq	dbgb1	dbgb2	rss	maxop	p50	p99	tag
499	10693	4	0.0	6.0	0.6	0.000	0.001	0.012	1.149	41277	13.3	3.860	100	10.3	40.8	11.8	0.010	10708	10565	my5651_rel.cz11a_c8r32
499	9036	0	0.0	121.0	3.7	0.000	0.000	0.242	7.496	35129	13.1	3.888	116	10.4	40.9	12.2	0.004	9030	8938	my5744_rel.cz11a_c8r32
499	9056	0	0.0	117.9	3.6	0.000	0.000	0.236	7.302	35194	12.9	3.886	114	10.9	41.4	12.9	0.002	9062	8998	my5744_rel.cz11apur1_c8r32
499	8106	0	0.0	127.5	3.7	0.000	0.000	0.255	7.531	32101	13.0	3.960	128	10.6	41.5	12.9	0.002	8103	8023	my8036_rel.cz11a_c8r32
499	8146	0	0.0	125.5	3.6	0.000	0.000	0.251	7.436	31964	12.9	3.924	127	10.9	41.8	13.2	0.002	8151	8103	my8036_rel.cz11apur1_c8r32
qp500.L4
qp500.L4: point queries with 500 insert/s per client. Graphs for performance per 1-second interval are here.
Average throughput:
Query response time histogram: each cell has the percentage of responses that take <= the time in the header and max is the max response time in seconds. For max values in the top 25% of the range have a red background and in the bottom 25% of the range have a green background. The red background is not used when the min value is within 80% of the max value.
| dbms | 256us | 1ms | 4ms | 16ms | 64ms | 256ms | 1s | 4s | 16s | gt | max |
|---|---|---|---|---|---|---|---|---|---|---|---|
| my5651_rel.cz11a_c8r32 | 99.850 | 0.147 | 0.002 | 0.002 | 0.010 | ||||||
| my5744_rel.cz11a_c8r32 | 99.813 | 0.186 | nonzero | nonzero | 0.006 | ||||||
| my5744_rel.cz11apur1_c8r32 | 99.976 | 0.024 | nonzero | 0.002 | |||||||
| my8036_rel.cz11a_c8r32 | 99.535 | 0.465 | nonzero | 0.002 | |||||||
| my8036_rel.cz11apur1_c8r32 | 99.792 | 0.208 | nonzero | 0.003 |
Insert response time histogram: each cell has the percentage of responses that take <= the time in the header and max is the max response time in seconds. For max values in the top 25% of the range have a red background and in the bottom 25% of the range have a green background. The red background is not used when the min value is within 80% of the max value.
| dbms | 256us | 1ms | 4ms | 16ms | 64ms | 256ms | 1s | 4s | 16s | gt | max |
|---|---|---|---|---|---|---|---|---|---|---|---|
| my5651_rel.cz11a_c8r32 | 10.189 | 80.528 | 9.217 | 0.067 | 0.022 | ||||||
| my5744_rel.cz11a_c8r32 | 0.344 | 99.444 | 0.206 | 0.006 | 0.017 | ||||||
| my5744_rel.cz11apur1_c8r32 | 1.928 | 97.872 | 0.200 | 0.012 | |||||||
| my8036_rel.cz11a_c8r32 | 99.911 | 0.089 | 0.014 | ||||||||
| my8036_rel.cz11apur1_c8r32 | 99.822 | 0.172 | 0.006 | 0.024 |
Delete response time histogram: each cell has the percentage of responses that take <= the time in the header and max is the max response time in seconds. For max values in the top 25% of the range have a red background and in the bottom 25% of the range have a green background. The red background is not used when the min value is within 80% of the max value.
| dbms | 256us | 1ms | 4ms | 16ms | 64ms | 256ms | 1s | 4s | 16s | gt | max |
|---|---|---|---|---|---|---|---|---|---|---|---|
| my5651_rel.cz11a_c8r32 | 13.944 | 76.822 | 9.200 | 0.033 | 0.022 | ||||||
| my5744_rel.cz11a_c8r32 | 64.583 | 35.233 | 0.183 | 0.012 | |||||||
| my5744_rel.cz11apur1_c8r32 | 84.383 | 15.444 | 0.172 | 0.007 | |||||||
| my8036_rel.cz11a_c8r32 | 12.261 | 87.672 | 0.067 | 0.013 | |||||||
| my8036_rel.cz11apur1_c8r32 | 60.550 | 39.311 | 0.133 | 0.006 | 0.023 |
Performance metrics for the DBMS listed above. Some are normalized by throughput, others are not. Legend for results is here.
ips	qps	rps	rmbps	wps	wmbps	rpq	rkbpq	wpi	wkbpi	csps	cpups	cspq	cpupq	dbgb1	dbgb2	rss	maxop	p50	p99	tag
499	8495	16	0.1	10.6	0.7	0.002	0.008	0.021	1.404	34402	12.9	4.050	121	10.3	40.8	11.8	0.010	8539	7607	my5651_rel.cz11a_c8r32
499	7420	0	0.0	47.2	1.6	0.000	0.000	0.095	3.292	30070	13.4	4.053	144	10.4	40.9	12.2	0.006	7432	6920	my5744_rel.cz11a_c8r32
499	7514	0	0.0	43.8	1.5	0.000	0.000	0.088	3.081	30473	13.3	4.056	142	10.9	41.4	12.9	0.002	7528	7339	my5744_rel.cz11apur1_c8r32
499	5985	0	0.0	48.2	1.7	0.000	0.000	0.097	3.523	24762	13.2	4.138	176	10.6	41.6	12.9	0.002	5993	5737	my8036_rel.cz11a_c8r32
499	6099	0	0.0	53.8	1.8	0.000	0.000	0.108	3.790	24928	13.2	4.087	173	10.9	41.8	13.2	0.003	6105	5946	my8036_rel.cz11apur1_c8r32
qr1000.L5
qr1000.L5: range queries with 1000 insert/s per client. Graphs for performance per 1-second interval are here.
Average throughput:
Query response time histogram: each cell has the percentage of responses that take <= the time in the header and max is the max response time in seconds. For max values in the top 25% of the range have a red background and in the bottom 25% of the range have a green background. The red background is not used when the min value is within 80% of the max value.
| dbms | 256us | 1ms | 4ms | 16ms | 64ms | 256ms | 1s | 4s | 16s | gt | max |
|---|---|---|---|---|---|---|---|---|---|---|---|
| my5651_rel.cz11a_c8r32 | 99.936 | 0.061 | 0.001 | 0.002 | 0.012 | ||||||
| my5744_rel.cz11a_c8r32 | 99.937 | 0.063 | nonzero | nonzero | 0.004 | ||||||
| my5744_rel.cz11apur1_c8r32 | 99.991 | 0.009 | nonzero | 0.002 | |||||||
| my8036_rel.cz11a_c8r32 | 99.900 | 0.100 | nonzero | 0.002 | |||||||
| my8036_rel.cz11apur1_c8r32 | 99.969 | 0.031 | nonzero | nonzero | 0.004 |
Insert response time histogram: each cell has the percentage of responses that take <= the time in the header and max is the max response time in seconds. For max values in the top 25% of the range have a red background and in the bottom 25% of the range have a green background. The red background is not used when the min value is within 80% of the max value.
| dbms | 256us | 1ms | 4ms | 16ms | 64ms | 256ms | 1s | 4s | 16s | gt | max |
|---|---|---|---|---|---|---|---|---|---|---|---|
| my5651_rel.cz11a_c8r32 | 14.989 | 79.611 | 5.364 | 0.036 | 0.022 | ||||||
| my5744_rel.cz11a_c8r32 | 3.197 | 96.647 | 0.156 | 0.014 | |||||||
| my5744_rel.cz11apur1_c8r32 | 9.247 | 90.578 | 0.175 | 0.010 | |||||||
| my8036_rel.cz11a_c8r32 | 99.756 | 0.242 | 0.003 | 0.022 | |||||||
| my8036_rel.cz11apur1_c8r32 | 99.822 | 0.172 | 0.006 | 0.024 |
Delete response time histogram: each cell has the percentage of responses that take <= the time in the header and max is the max response time in seconds. For max values in the top 25% of the range have a red background and in the bottom 25% of the range have a green background. The red background is not used when the min value is within 80% of the max value.
| dbms | 256us | 1ms | 4ms | 16ms | 64ms | 256ms | 1s | 4s | 16s | gt | max |
|---|---|---|---|---|---|---|---|---|---|---|---|
| my5651_rel.cz11a_c8r32 | 22.928 | 71.864 | 5.189 | 0.019 | 0.022 | ||||||
| my5744_rel.cz11a_c8r32 | 89.325 | 10.533 | 0.142 | 0.014 | |||||||
| my5744_rel.cz11apur1_c8r32 | 90.347 | 9.522 | 0.131 | 0.007 | |||||||
| my8036_rel.cz11a_c8r32 | 42.083 | 57.731 | 0.183 | 0.003 | 0.020 | ||||||
| my8036_rel.cz11apur1_c8r32 | 78.578 | 21.286 | 0.136 | 0.013 |
Performance metrics for the DBMS listed above. Some are normalized by throughput, others are not. Legend for results is here.
ips	qps	rps	rmbps	wps	wmbps	rpq	rkbpq	wpi	wkbpi	csps	cpups	cspq	cpupq	dbgb1	dbgb2	rss	maxop	p50	p99	tag
999	10766	32	0.1	438.0	13.0	0.003	0.012	0.439	13.287	43269	13.8	4.019	103	10.3	40.8	11.8	0.012	10772	10565	my5651_rel.cz11a_c8r32
999	8942	0	0.0	134.7	4.5	0.000	0.000	0.135	4.586	34981	13.6	3.912	122	10.4	40.9	12.2	0.004	8940	8854	my5744_rel.cz11a_c8r32
999	9074	0	0.0	139.4	4.6	0.000	0.000	0.140	4.708	35500	13.5	3.912	119	10.9	41.4	12.9	0.002	9078	9002	my5744_rel.cz11apur1_c8r32
999	8081	0	0.0	194.0	5.9	0.000	0.000	0.194	6.068	32624	13.6	4.037	135	10.6	41.6	12.9	0.002	8087	8007	my8036_rel.cz11a_c8r32
999	8230	0	0.0	195.1	5.9	0.000	0.000	0.195	6.096	32664	13.4	3.969	130	10.9	41.8	13.2	0.004	8231	8183	my8036_rel.cz11apur1_c8r32
qp1000.L6
qp1000.L6: point queries with 1000 insert/s per client. Graphs for performance per 1-second interval are here.
Average throughput:
Query response time histogram: each cell has the percentage of responses that take <= the time in the header and max is the max response time in seconds. For max values in the top 25% of the range have a red background and in the bottom 25% of the range have a green background. The red background is not used when the min value is within 80% of the max value.
| dbms | 256us | 1ms | 4ms | 16ms | 64ms | 256ms | 1s | 4s | 16s | gt | max |
|---|---|---|---|---|---|---|---|---|---|---|---|
| my5651_rel.cz11a_c8r32 | 99.778 | 0.216 | 0.003 | 0.002 | 0.010 | ||||||
| my5744_rel.cz11a_c8r32 | 99.748 | 0.252 | nonzero | 0.002 | |||||||
| my5744_rel.cz11apur1_c8r32 | 99.967 | 0.033 | nonzero | nonzero | 0.004 | ||||||
| my8036_rel.cz11a_c8r32 | 99.454 | 0.546 | nonzero | 0.002 | |||||||
| my8036_rel.cz11apur1_c8r32 | 99.767 | 0.233 | nonzero | 0.002 |
Insert response time histogram: each cell has the percentage of responses that take <= the time in the header and max is the max response time in seconds. For max values in the top 25% of the range have a red background and in the bottom 25% of the range have a green background. The red background is not used when the min value is within 80% of the max value.
| dbms | 256us | 1ms | 4ms | 16ms | 64ms | 256ms | 1s | 4s | 16s | gt | max |
|---|---|---|---|---|---|---|---|---|---|---|---|
| my5651_rel.cz11a_c8r32 | 14.603 | 80.611 | 4.744 | 0.042 | 0.022 | ||||||
| my5744_rel.cz11a_c8r32 | 1.919 | 97.908 | 0.172 | 0.014 | |||||||
| my5744_rel.cz11apur1_c8r32 | 3.700 | 96.153 | 0.147 | 0.012 | |||||||
| my8036_rel.cz11a_c8r32 | 99.681 | 0.317 | 0.003 | 0.024 | |||||||
| my8036_rel.cz11apur1_c8r32 | 99.731 | 0.267 | 0.003 | 0.023 |
Delete response time histogram: each cell has the percentage of responses that take <= the time in the header and max is the max response time in seconds. For max values in the top 25% of the range have a red background and in the bottom 25% of the range have a green background. The red background is not used when the min value is within 80% of the max value.
| dbms | 256us | 1ms | 4ms | 16ms | 64ms | 256ms | 1s | 4s | 16s | gt | max |
|---|---|---|---|---|---|---|---|---|---|---|---|
| my5651_rel.cz11a_c8r32 | 23.931 | 71.311 | 4.733 | 0.025 | 0.022 | ||||||
| my5744_rel.cz11a_c8r32 | 81.950 | 17.903 | 0.147 | 0.014 | |||||||
| my5744_rel.cz11apur1_c8r32 | 86.850 | 13.011 | 0.139 | 0.012 | |||||||
| my8036_rel.cz11a_c8r32 | 24.089 | 75.667 | 0.242 | 0.003 | 0.023 | ||||||
| my8036_rel.cz11apur1_c8r32 | 56.700 | 43.094 | 0.203 | 0.003 | 0.023 |
Performance metrics for the DBMS listed above. Some are normalized by throughput, others are not. Legend for results is here.
ips	qps	rps	rmbps	wps	wmbps	rpq	rkbpq	wpi	wkbpi	csps	cpups	cspq	cpupq	dbgb1	dbgb2	rss	maxop	p50	p99	tag
999	8592	32	0.1	10.7	1.1	0.004	0.015	0.011	1.143	35168	13.7	4.093	128	10.3	40.8	11.8	0.010	8630	7639	my5651_rel.cz11a_c8r32
999	7433	0	0.0	103.3	3.6	0.000	0.000	0.103	3.698	30462	13.6	4.098	146	10.4	40.9	12.2	0.002	7451	6936	my5744_rel.cz11a_c8r32
999	7508	0	0.0	84.9	3.1	0.000	0.000	0.085	3.155	30744	13.4	4.095	143	10.9	41.4	12.9	0.004	7514	7323	my5744_rel.cz11apur1_c8r32
999	6006	0	0.0	192.5	5.9	0.000	0.000	0.193	6.030	25720	14.0	4.282	186	10.6	41.6	13.0	0.002	6014	5737	my8036_rel.cz11a_c8r32
999	6095	0	0.0	192.9	5.9	0.000	0.000	0.193	6.042	25497	14.0	4.184	184	10.9	41.9	13.2	0.002	6105	5961	my8036_rel.cz11apur1_c8r32
l.i0
l.i0: load without secondary indexes
Performance metrics for all DBMS, not just the ones listed above. Some are normalized by throughput, others are not. Legend for results is here.
ips	qps	rps	rmbps	wps	wmbps	rpq	rkbpq	wpi	wkbpi	csps	cpups	cspq	cpupq	dbgb1	dbgb2	rss	maxop	p50	p99	tag
174216	0	1526	6.0	749.0	51.5	0.009	0.035	0.004	0.303	20690	21.5	0.119	10	3.3	33.8	4.7	0.149	174800	149339	my5651_rel.cz11a_c8r32
150602	0	0	0.0	665.7	44.9	0.000	0.000	0.004	0.305	15565	19.9	0.103	11	3.3	33.8	5.3	0.084	150334	136751	my5744_rel.cz11a_c8r32
157233	0	0	0.0	695.9	47.0	0.000	0.000	0.004	0.306	16251	20.7	0.103	11	3.3	33.8	5.1	0.144	158029	144243	my5744_rel.cz11apur1_c8r32
98039	0	0	0.0	519.2	31.8	0.000	0.000	0.005	0.333	11433	17.8	0.117	15	3.3	33.9	5.5	0.085	98490	88902	my8036_rel.cz11a_c8r32
108696	0	0	0.0	576.2	35.3	0.000	0.000	0.005	0.333	12490	17.8	0.115	13	3.3	33.9	5.4	0.079	109179	100591	my8036_rel.cz11apur1_c8r32
l.x
l.x: create secondary indexes
Performance metrics for all DBMS, not just the ones listed above. Some are normalized by throughput, others are not. Legend for results is here.
ips	qps	rps	rmbps	wps	wmbps	rpq	rkbpq	wpi	wkbpi	csps	cpups	cspq	cpupq	dbgb1	dbgb2	rss	maxop	p50	p99	tag
179212	0	11	0.0	2467.1	190.4	0.000	0.000	0.014	1.088	3869	11.8	0.022	5	7.0	37.5	8.4	0.002	NA	NA	my5651_rel.cz11a_c8r32
221239	0	0	0.0	3427.0	220.9	0.000	0.000	0.015	1.023	13512	12.1	0.061	4	7.6	38.1	7.8	0.001	NA	NA	my5744_rel.cz11a_c8r32
222223	0	0	0.0	3517.9	222.8	0.000	0.000	0.016	1.027	13764	12.1	0.062	4	7.6	38.1	7.8	0.001	NA	NA	my5744_rel.cz11apur1_c8r32
255102	0	1295	82.0	5643.8	304.4	0.005	0.329	0.022	1.222	18932	40.5	0.074	13	7.6	38.1	8.9	0.002	NA	NA	my8036_rel.cz11a_c8r32
259068	0	1330	84.2	5274.5	304.2	0.005	0.333	0.020	1.202	18413	40.9	0.071	13	7.6	38.1	9.1	0.002	NA	NA	my8036_rel.cz11apur1_c8r32
l.i1
l.i1: continue load after secondary indexes created with 50 inserts per transaction
Performance metrics for all DBMS, not just the ones listed above. Some are normalized by throughput, others are not. Legend for results is here.
ips	qps	rps	rmbps	wps	wmbps	rpq	rkbpq	wpi	wkbpi	csps	cpups	cspq	cpupq	dbgb1	dbgb2	rss	maxop	p50	p99	tag
29895	0	812	3.2	3251.1	131.3	0.027	0.109	0.109	4.499	36545	40.8	1.222	109	10.0	40.5	11.5	0.083	32165	7945	my5651_rel.cz11a_c8r32
31671	0	0	0.0	3598.5	143.7	0.000	0.000	0.114	4.647	27021	45.6	0.853	115	10.1	40.7	12.0	0.093	33463	8545	my5744_rel.cz11a_c8r32
36199	0	0	0.0	4130.5	164.0	0.000	0.000	0.114	4.640	26667	34.3	0.737	76	10.6	41.2	12.6	0.091	38020	10348	my5744_rel.cz11apur1_c8r32
29218	0	166	2.6	4754.1	176.3	0.006	0.091	0.163	6.179	48213	35.3	1.650	97	10.4	41.3	12.4	0.074	31266	3897	my8036_rel.cz11a_c8r32
30960	0	175	2.7	4996.7	184.5	0.006	0.091	0.161	6.104	27393	34.3	0.885	89	10.6	41.6	12.7	0.097	33264	3946	my8036_rel.cz11apur1_c8r32
l.i2
l.i2: continue load after secondary indexes created with 5 inserts per transaction
Performance metrics for all DBMS, not just the ones listed above. Some are normalized by throughput, others are not. Legend for results is here.
ips	qps	rps	rmbps	wps	wmbps	rpq	rkbpq	wpi	wkbpi	csps	cpups	cspq	cpupq	dbgb1	dbgb2	rss	maxop	p50	p99	tag
21142	0	3789	14.8	2189.2	82.1	0.179	0.717	0.104	3.976	174469	41.6	8.252	157	10.3	40.8	11.8	0.071	21217	19869	my5651_rel.cz11a_c8r32
21142	0	0	0.0	2163.2	82.3	0.000	0.000	0.102	3.986	85403	40.2	4.040	152	10.4	40.9	12.2	0.088	21211	20314	my5744_rel.cz11a_c8r32
23095	0	0	0.0	2430.3	91.5	0.000	0.000	0.105	4.058	91896	34.4	3.979	119	10.9	41.4	12.9	0.100	23220	21077	my5744_rel.cz11apur1_c8r32
17668	0	28	0.4	2478.4	86.3	0.002	0.025	0.140	5.002	86356	34.2	4.888	155	10.6	41.5	12.9	0.101	17731	16767	my8036_rel.cz11a_c8r32
18349	0	28	0.4	2630.8	91.0	0.002	0.025	0.143	5.077	75403	33.4	4.109	146	10.9	41.8	13.2	0.060	18370	17456	my8036_rel.cz11apur1_c8r32
qr100.L1
qr100.L1: range queries with 100 insert/s per client
Performance metrics for all DBMS, not just the ones listed above. Some are normalized by throughput, others are not. Legend for results is here.
ips	qps	rps	rmbps	wps	wmbps	rpq	rkbpq	wpi	wkbpi	csps	cpups	cspq	cpupq	dbgb1	dbgb2	rss	maxop	p50	p99	tag
100	10706	0	0.0	257.4	7.2	0.000	0.000	2.579	73.364	41770	12.7	3.902	95	10.3	40.8	11.8	0.024	10721	10451	my5651_rel.cz11a_c8r32
100	9031	0	0.0	151.9	4.2	0.000	0.000	1.522	42.686	35111	12.6	3.888	112	10.4	40.9	12.2	0.010	9030	8922	my5744_rel.cz11a_c8r32
100	9074	0	0.0	196.1	5.4	0.000	0.000	1.965	55.259	35416	12.6	3.903	111	10.9	41.4	12.9	0.010	9078	9001	my5744_rel.cz11apur1_c8r32
100	8079	0	0.0	209.5	5.3	0.000	0.000	2.099	53.982	31960	12.5	3.956	124	10.6	41.5	12.9	0.001	8087	7991	my8036_rel.cz11a_c8r32
100	8207	0	0.0	181.5	4.6	0.000	0.000	1.818	46.833	32270	12.5	3.932	122	10.9	41.8	13.2	0.002	8215	8151	my8036_rel.cz11apur1_c8r32
qp100.L2
qp100.L2: point queries with 100 insert/s per client
Performance metrics for all DBMS, not just the ones listed above. Some are normalized by throughput, others are not. Legend for results is here.
ips	qps	rps	rmbps	wps	wmbps	rpq	rkbpq	wpi	wkbpi	csps	cpups	cspq	cpupq	dbgb1	dbgb2	rss	maxop	p50	p99	tag
100	8446	0	0.0	2.4	0.1	0.000	0.000	0.024	1.220	33831	12.9	4.005	122	10.3	40.8	11.8	0.001	8422	7704	my5651_rel.cz11a_c8r32
100	7503	0	0.0	45.4	1.2	0.000	0.000	0.455	12.382	30301	12.7	4.038	135	10.4	40.9	12.2	0.001	7527	6920	my5744_rel.cz11a_c8r32
100	7573	0	0.0	61.9	1.7	0.000	0.000	0.620	16.994	30667	12.6	4.049	133	10.9	41.4	12.9	0.003	7584	7384	my5744_rel.cz11apur1_c8r32
100	6002	0	0.0	54.6	1.4	0.000	0.000	0.547	14.289	24572	13.1	4.094	175	10.6	41.5	12.9	0.002	6009	5722	my8036_rel.cz11a_c8r32
100	6109	0	0.0	53.8	1.4	0.000	0.000	0.539	14.211	24889	13.1	4.074	172	10.9	41.8	13.2	0.002	6110	5961	my8036_rel.cz11apur1_c8r32
qr500.L3
qr500.L3: range queries with 500 insert/s per client
Performance metrics for all DBMS, not just the ones listed above. Some are normalized by throughput, others are not. Legend for results is here.
ips	qps	rps	rmbps	wps	wmbps	rpq	rkbpq	wpi	wkbpi	csps	cpups	cspq	cpupq	dbgb1	dbgb2	rss	maxop	p50	p99	tag
499	10693	4	0.0	6.0	0.6	0.000	0.001	0.012	1.149	41277	13.3	3.860	100	10.3	40.8	11.8	0.010	10708	10565	my5651_rel.cz11a_c8r32
499	9036	0	0.0	121.0	3.7	0.000	0.000	0.242	7.496	35129	13.1	3.888	116	10.4	40.9	12.2	0.004	9030	8938	my5744_rel.cz11a_c8r32
499	9056	0	0.0	117.9	3.6	0.000	0.000	0.236	7.302	35194	12.9	3.886	114	10.9	41.4	12.9	0.002	9062	8998	my5744_rel.cz11apur1_c8r32
499	8106	0	0.0	127.5	3.7	0.000	0.000	0.255	7.531	32101	13.0	3.960	128	10.6	41.5	12.9	0.002	8103	8023	my8036_rel.cz11a_c8r32
499	8146	0	0.0	125.5	3.6	0.000	0.000	0.251	7.436	31964	12.9	3.924	127	10.9	41.8	13.2	0.002	8151	8103	my8036_rel.cz11apur1_c8r32
qp500.L4
qp500.L4: point queries with 500 insert/s per client
Performance metrics for all DBMS, not just the ones listed above. Some are normalized by throughput, others are not. Legend for results is here.
ips	qps	rps	rmbps	wps	wmbps	rpq	rkbpq	wpi	wkbpi	csps	cpups	cspq	cpupq	dbgb1	dbgb2	rss	maxop	p50	p99	tag
499	8495	16	0.1	10.6	0.7	0.002	0.008	0.021	1.404	34402	12.9	4.050	121	10.3	40.8	11.8	0.010	8539	7607	my5651_rel.cz11a_c8r32
499	7420	0	0.0	47.2	1.6	0.000	0.000	0.095	3.292	30070	13.4	4.053	144	10.4	40.9	12.2	0.006	7432	6920	my5744_rel.cz11a_c8r32
499	7514	0	0.0	43.8	1.5	0.000	0.000	0.088	3.081	30473	13.3	4.056	142	10.9	41.4	12.9	0.002	7528	7339	my5744_rel.cz11apur1_c8r32
499	5985	0	0.0	48.2	1.7	0.000	0.000	0.097	3.523	24762	13.2	4.138	176	10.6	41.6	12.9	0.002	5993	5737	my8036_rel.cz11a_c8r32
499	6099	0	0.0	53.8	1.8	0.000	0.000	0.108	3.790	24928	13.2	4.087	173	10.9	41.8	13.2	0.003	6105	5946	my8036_rel.cz11apur1_c8r32
qr1000.L5
qr1000.L5: range queries with 1000 insert/s per client
Performance metrics for all DBMS, not just the ones listed above. Some are normalized by throughput, others are not. Legend for results is here.
ips	qps	rps	rmbps	wps	wmbps	rpq	rkbpq	wpi	wkbpi	csps	cpups	cspq	cpupq	dbgb1	dbgb2	rss	maxop	p50	p99	tag
999	10766	32	0.1	438.0	13.0	0.003	0.012	0.439	13.287	43269	13.8	4.019	103	10.3	40.8	11.8	0.012	10772	10565	my5651_rel.cz11a_c8r32
999	8942	0	0.0	134.7	4.5	0.000	0.000	0.135	4.586	34981	13.6	3.912	122	10.4	40.9	12.2	0.004	8940	8854	my5744_rel.cz11a_c8r32
999	9074	0	0.0	139.4	4.6	0.000	0.000	0.140	4.708	35500	13.5	3.912	119	10.9	41.4	12.9	0.002	9078	9002	my5744_rel.cz11apur1_c8r32
999	8081	0	0.0	194.0	5.9	0.000	0.000	0.194	6.068	32624	13.6	4.037	135	10.6	41.6	12.9	0.002	8087	8007	my8036_rel.cz11a_c8r32
999	8230	0	0.0	195.1	5.9	0.000	0.000	0.195	6.096	32664	13.4	3.969	130	10.9	41.8	13.2	0.004	8231	8183	my8036_rel.cz11apur1_c8r32
qp1000.L6
qp1000.L6: point queries with 1000 insert/s per client
Performance metrics for all DBMS, not just the ones listed above. Some are normalized by throughput, others are not. Legend for results is here.
ips	qps	rps	rmbps	wps	wmbps	rpq	rkbpq	wpi	wkbpi	csps	cpups	cspq	cpupq	dbgb1	dbgb2	rss	maxop	p50	p99	tag
999	8592	32	0.1	10.7	1.1	0.004	0.015	0.011	1.143	35168	13.7	4.093	128	10.3	40.8	11.8	0.010	8630	7639	my5651_rel.cz11a_c8r32
999	7433	0	0.0	103.3	3.6	0.000	0.000	0.103	3.698	30462	13.6	4.098	146	10.4	40.9	12.2	0.002	7451	6936	my5744_rel.cz11a_c8r32
999	7508	0	0.0	84.9	3.1	0.000	0.000	0.085	3.155	30744	13.4	4.095	143	10.9	41.4	12.9	0.004	7514	7323	my5744_rel.cz11apur1_c8r32
999	6006	0	0.0	192.5	5.9	0.000	0.000	0.193	6.030	25720	14.0	4.282	186	10.6	41.6	13.0	0.002	6014	5737	my8036_rel.cz11a_c8r32
999	6095	0	0.0	192.9	5.9	0.000	0.000	0.193	6.042	25497	14.0	4.184	184	10.9	41.9	13.2	0.002	6105	5961	my8036_rel.cz11apur1_c8r32
l.i0
- l.i0: load without secondary indexes
- Legend for results is here.
- Each entry lists the percentage of responses that fit in that bucket (slower than max time for previous bucket, faster than min time for next bucket).
Insert response time histogram
256us	1ms	4ms	16ms	64ms	256ms	1s	4s	16s	gt	max	tag
0.000	99.693	0.242	0.053	0.010	0.001	0.000	0.000	0.000	0.000	0.149	my5651_rel.cz11a_c8r32
0.000	99.547	0.191	0.129	0.132	0.001	0.000	0.000	0.000	0.000	0.084	my5744_rel.cz11a_c8r32
0.000	99.560	0.177	0.132	0.130	0.001	0.000	0.000	0.000	0.000	0.144	my5744_rel.cz11apur1_c8r32
0.000	86.376	13.218	0.271	0.133	0.002	0.000	0.000	0.000	0.000	0.085	my8036_rel.cz11a_c8r32
0.000	99.249	0.367	0.252	0.131	0.002	0.000	0.000	0.000	0.000	0.079	my8036_rel.cz11apur1_c8r32
l.x
- l.x: create secondary indexes
- Legend for results is here.
- Each entry lists the percentage of responses that fit in that bucket (slower than max time for previous bucket, faster than min time for next bucket).
TODO - determine whether there is data for create index response time
l.i1
- l.i1: continue load after secondary indexes created with 50 inserts per transaction
- Legend for results is here.
- Each entry lists the percentage of responses that fit in that bucket (slower than max time for previous bucket, faster than min time for next bucket).
Insert response time histogram
256us	1ms	4ms	16ms	64ms	256ms	1s	4s	16s	gt	max	tag
0.000	3.650	93.735	2.424	0.190	0.001	0.000	0.000	0.000	0.000	0.083	my5651_rel.cz11a_c8r32
0.000	0.356	97.451	2.139	0.053	0.001	0.000	0.000	0.000	0.000	0.093	my5744_rel.cz11a_c8r32
0.000	0.433	97.428	2.084	0.054	0.001	0.000	0.000	0.000	0.000	0.091	my5744_rel.cz11apur1_c8r32
0.000	0.000	97.822	2.051	0.126	0.001	0.000	0.000	0.000	0.000	0.074	my8036_rel.cz11a_c8r32
0.000	0.000	97.843	2.025	0.131	0.001	0.000	0.000	0.000	0.000	0.097	my8036_rel.cz11apur1_c8r32
Delete response time histogram
256us	1ms	4ms	16ms	64ms	256ms	1s	4s	16s	gt	max	tag
0.000	65.418	33.131	1.300	0.150	0.001	0.000	0.000	0.000	0.000	0.083	my5651_rel.cz11a_c8r32
0.000	57.763	40.682	1.542	0.012	0.001	0.000	0.000	0.000	0.000	0.081	my5744_rel.cz11a_c8r32
0.000	94.026	4.227	1.734	0.013	0.001	0.000	0.000	0.000	0.000	0.091	my5744_rel.cz11apur1_c8r32
0.000	30.858	67.601	1.514	0.027	0.001	0.000	0.000	0.000	0.000	0.091	my8036_rel.cz11a_c8r32
0.000	53.232	45.212	1.524	0.031	nonzero	0.000	0.000	0.000	0.000	0.088	my8036_rel.cz11apur1_c8r32
l.i2
- l.i2: continue load after secondary indexes created with 5 inserts per transaction
- Legend for results is here.
- Each entry lists the percentage of responses that fit in that bucket (slower than max time for previous bucket, faster than min time for next bucket).
Insert response time histogram
256us	1ms	4ms	16ms	64ms	256ms	1s	4s	16s	gt	max	tag
84.632	15.215	0.019	0.130	0.005	nonzero	0.000	0.000	0.000	0.000	0.071	my5651_rel.cz11a_c8r32
85.724	14.078	0.055	0.140	0.003	nonzero	0.000	0.000	0.000	0.000	0.088	my5744_rel.cz11a_c8r32
96.579	3.270	0.008	0.139	0.003	nonzero	0.000	0.000	0.000	0.000	0.100	my5744_rel.cz11apur1_c8r32
69.276	30.566	0.015	0.140	0.001	nonzero	0.000	0.000	0.000	0.000	0.101	my8036_rel.cz11a_c8r32
77.509	22.345	0.008	0.137	0.001	0.000	0.000	0.000	0.000	0.000	0.060	my8036_rel.cz11apur1_c8r32
Delete response time histogram
256us	1ms	4ms	16ms	64ms	256ms	1s	4s	16s	gt	max	tag
96.033	3.815	0.018	0.130	0.005	nonzero	0.000	0.000	0.000	0.000	0.071	my5651_rel.cz11a_c8r32
89.587	10.268	0.010	0.135	0.001	nonzero	0.000	0.000	0.000	0.000	0.088	my5744_rel.cz11a_c8r32
98.974	0.885	0.006	0.135	0.001	nonzero	0.000	0.000	0.000	0.000	0.100	my5744_rel.cz11apur1_c8r32
80.631	19.223	0.010	0.134	0.001	nonzero	0.000	0.000	0.000	0.000	0.101	my8036_rel.cz11a_c8r32
92.298	7.564	0.005	0.132	0.001	0.000	0.000	0.000	0.000	0.000	0.053	my8036_rel.cz11apur1_c8r32
qr100.L1
- qr100.L1: range queries with 100 insert/s per client
- Legend for results is here.
- Each entry lists the percentage of responses that fit in that bucket (slower than max time for previous bucket, faster than min time for next bucket).
Query response time histogram
256us	1ms	4ms	16ms	64ms	256ms	1s	4s	16s	gt	max	tag
99.937	0.061	nonzero	0.001	nonzero	0.000	0.000	0.000	0.000	0.000	0.024	my5651_rel.cz11a_c8r32
99.964	0.036	nonzero	nonzero	0.000	0.000	0.000	0.000	0.000	0.000	0.010	my5744_rel.cz11a_c8r32
99.997	0.003	nonzero	nonzero	0.000	0.000	0.000	0.000	0.000	0.000	0.010	my5744_rel.cz11apur1_c8r32
99.935	0.065	nonzero	0.000	0.000	0.000	0.000	0.000	0.000	0.000	0.001	my8036_rel.cz11a_c8r32
99.979	0.021	nonzero	0.000	0.000	0.000	0.000	0.000	0.000	0.000	0.002	my8036_rel.cz11apur1_c8r32
Insert response time histogram
256us	1ms	4ms	16ms	64ms	256ms	1s	4s	16s	gt	max	tag
0.000	0.306	91.250	6.139	2.306	0.000	0.000	0.000	0.000	0.000	0.059	my5651_rel.cz11a_c8r32
0.000	0.028	99.556	0.417	0.000	0.000	0.000	0.000	0.000	0.000	0.013	my5744_rel.cz11a_c8r32
0.000	0.917	98.889	0.194	0.000	0.000	0.000	0.000	0.000	0.000	0.011	my5744_rel.cz11apur1_c8r32
0.000	0.000	99.194	0.778	0.028	0.000	0.000	0.000	0.000	0.000	0.024	my8036_rel.cz11a_c8r32
0.000	0.000	99.917	0.083	0.000	0.000	0.000	0.000	0.000	0.000	0.010	my8036_rel.cz11apur1_c8r32
Delete response time histogram
256us	1ms	4ms	16ms	64ms	256ms	1s	4s	16s	gt	max	tag
0.000	16.111	75.222	6.556	2.111	0.000	0.000	0.000	0.000	0.000	0.038	my5651_rel.cz11a_c8r32
0.000	40.500	59.194	0.306	0.000	0.000	0.000	0.000	0.000	0.000	0.012	my5744_rel.cz11a_c8r32
0.000	53.250	46.583	0.167	0.000	0.000	0.000	0.000	0.000	0.000	0.008	my5744_rel.cz11apur1_c8r32
0.000	17.917	81.361	0.667	0.056	0.000	0.000	0.000	0.000	0.000	0.023	my8036_rel.cz11a_c8r32
0.000	48.444	51.500	0.056	0.000	0.000	0.000	0.000	0.000	0.000	0.007	my8036_rel.cz11apur1_c8r32
qp100.L2
- qp100.L2: point queries with 100 insert/s per client
- Legend for results is here.
- Each entry lists the percentage of responses that fit in that bucket (slower than max time for previous bucket, faster than min time for next bucket).
Query response time histogram
256us	1ms	4ms	16ms	64ms	256ms	1s	4s	16s	gt	max	tag
99.889	0.111	nonzero	0.000	0.000	0.000	0.000	0.000	0.000	0.000	0.001	my5651_rel.cz11a_c8r32
99.839	0.161	nonzero	0.000	0.000	0.000	0.000	0.000	0.000	0.000	0.001	my5744_rel.cz11a_c8r32
99.985	0.015	nonzero	0.000	0.000	0.000	0.000	0.000	0.000	0.000	0.003	my5744_rel.cz11apur1_c8r32
99.618	0.381	nonzero	0.000	0.000	0.000	0.000	0.000	0.000	0.000	0.002	my8036_rel.cz11a_c8r32
99.855	0.145	nonzero	0.000	0.000	0.000	0.000	0.000	0.000	0.000	0.002	my8036_rel.cz11apur1_c8r32
Insert response time histogram
256us	1ms	4ms	16ms	64ms	256ms	1s	4s	16s	gt	max	tag
0.000	0.000	99.278	0.528	0.194	0.000	0.000	0.000	0.000	0.000	0.026	my5651_rel.cz11a_c8r32
0.000	0.000	99.528	0.472	0.000	0.000	0.000	0.000	0.000	0.000	0.013	my5744_rel.cz11a_c8r32
0.000	0.000	99.694	0.306	0.000	0.000	0.000	0.000	0.000	0.000	0.010	my5744_rel.cz11apur1_c8r32
0.000	0.000	99.583	0.417	0.000	0.000	0.000	0.000	0.000	0.000	0.012	my8036_rel.cz11a_c8r32
0.000	0.000	99.833	0.167	0.000	0.000	0.000	0.000	0.000	0.000	0.011	my8036_rel.cz11apur1_c8r32
Delete response time histogram
256us	1ms	4ms	16ms	64ms	256ms	1s	4s	16s	gt	max	tag
0.000	3.528	95.778	0.528	0.167	0.000	0.000	0.000	0.000	0.000	0.025	my5651_rel.cz11a_c8r32
0.000	18.028	81.528	0.444	0.000	0.000	0.000	0.000	0.000	0.000	0.011	my5744_rel.cz11a_c8r32
0.000	49.000	50.778	0.222	0.000	0.000	0.000	0.000	0.000	0.000	0.012	my5744_rel.cz11apur1_c8r32
0.000	0.083	99.500	0.417	0.000	0.000	0.000	0.000	0.000	0.000	0.012	my8036_rel.cz11a_c8r32
0.000	0.861	99.028	0.111	0.000	0.000	0.000	0.000	0.000	0.000	0.007	my8036_rel.cz11apur1_c8r32
qr500.L3
- qr500.L3: range queries with 500 insert/s per client
- Legend for results is here.
- Each entry lists the percentage of responses that fit in that bucket (slower than max time for previous bucket, faster than min time for next bucket).
Query response time histogram
256us	1ms	4ms	16ms	64ms	256ms	1s	4s	16s	gt	max	tag
99.946	0.053	nonzero	nonzero	0.000	0.000	0.000	0.000	0.000	0.000	0.010	my5651_rel.cz11a_c8r32
99.952	0.048	nonzero	0.000	0.000	0.000	0.000	0.000	0.000	0.000	0.004	my5744_rel.cz11a_c8r32
99.994	0.006	nonzero	0.000	0.000	0.000	0.000	0.000	0.000	0.000	0.002	my5744_rel.cz11apur1_c8r32
99.916	0.084	nonzero	0.000	0.000	0.000	0.000	0.000	0.000	0.000	0.002	my8036_rel.cz11a_c8r32
99.975	0.025	nonzero	0.000	0.000	0.000	0.000	0.000	0.000	0.000	0.002	my8036_rel.cz11apur1_c8r32
Insert response time histogram
256us	1ms	4ms	16ms	64ms	256ms	1s	4s	16s	gt	max	tag
0.000	13.600	83.883	2.394	0.122	0.000	0.000	0.000	0.000	0.000	0.022	my5651_rel.cz11a_c8r32
0.000	1.217	98.544	0.239	0.000	0.000	0.000	0.000	0.000	0.000	0.013	my5744_rel.cz11a_c8r32
0.000	5.694	93.989	0.317	0.000	0.000	0.000	0.000	0.000	0.000	0.013	my5744_rel.cz11apur1_c8r32
0.000	0.000	99.817	0.183	0.000	0.000	0.000	0.000	0.000	0.000	0.015	my8036_rel.cz11a_c8r32
0.000	0.000	99.856	0.133	0.011	0.000	0.000	0.000	0.000	0.000	0.023	my8036_rel.cz11apur1_c8r32
Delete response time histogram
256us	1ms	4ms	16ms	64ms	256ms	1s	4s	16s	gt	max	tag
0.000	34.933	62.567	2.383	0.117	0.000	0.000	0.000	0.000	0.000	0.021	my5651_rel.cz11a_c8r32
0.000	85.106	14.678	0.217	0.000	0.000	0.000	0.000	0.000	0.000	0.013	my5744_rel.cz11a_c8r32
0.000	86.489	13.239	0.272	0.000	0.000	0.000	0.000	0.000	0.000	0.011	my5744_rel.cz11apur1_c8r32
0.000	37.844	62.033	0.122	0.000	0.000	0.000	0.000	0.000	0.000	0.014	my8036_rel.cz11a_c8r32
0.000	82.972	16.917	0.106	0.006	0.000	0.000	0.000	0.000	0.000	0.023	my8036_rel.cz11apur1_c8r32
qp500.L4
- qp500.L4: point queries with 500 insert/s per client
- Legend for results is here.
- Each entry lists the percentage of responses that fit in that bucket (slower than max time for previous bucket, faster than min time for next bucket).
Query response time histogram
256us	1ms	4ms	16ms	64ms	256ms	1s	4s	16s	gt	max	tag
99.850	0.147	0.002	0.002	0.000	0.000	0.000	0.000	0.000	0.000	0.010	my5651_rel.cz11a_c8r32
99.813	0.186	nonzero	nonzero	0.000	0.000	0.000	0.000	0.000	0.000	0.006	my5744_rel.cz11a_c8r32
99.976	0.024	nonzero	0.000	0.000	0.000	0.000	0.000	0.000	0.000	0.002	my5744_rel.cz11apur1_c8r32
99.535	0.465	nonzero	0.000	0.000	0.000	0.000	0.000	0.000	0.000	0.002	my8036_rel.cz11a_c8r32
99.792	0.208	nonzero	0.000	0.000	0.000	0.000	0.000	0.000	0.000	0.003	my8036_rel.cz11apur1_c8r32
Insert response time histogram
256us	1ms	4ms	16ms	64ms	256ms	1s	4s	16s	gt	max	tag
0.000	10.189	80.528	9.217	0.067	0.000	0.000	0.000	0.000	0.000	0.022	my5651_rel.cz11a_c8r32
0.000	0.344	99.444	0.206	0.006	0.000	0.000	0.000	0.000	0.000	0.017	my5744_rel.cz11a_c8r32
0.000	1.928	97.872	0.200	0.000	0.000	0.000	0.000	0.000	0.000	0.012	my5744_rel.cz11apur1_c8r32
0.000	0.000	99.911	0.089	0.000	0.000	0.000	0.000	0.000	0.000	0.014	my8036_rel.cz11a_c8r32
0.000	0.000	99.822	0.172	0.006	0.000	0.000	0.000	0.000	0.000	0.024	my8036_rel.cz11apur1_c8r32
Delete response time histogram
256us	1ms	4ms	16ms	64ms	256ms	1s	4s	16s	gt	max	tag
0.000	13.944	76.822	9.200	0.033	0.000	0.000	0.000	0.000	0.000	0.022	my5651_rel.cz11a_c8r32
0.000	64.583	35.233	0.183	0.000	0.000	0.000	0.000	0.000	0.000	0.012	my5744_rel.cz11a_c8r32
0.000	84.383	15.444	0.172	0.000	0.000	0.000	0.000	0.000	0.000	0.007	my5744_rel.cz11apur1_c8r32
0.000	12.261	87.672	0.067	0.000	0.000	0.000	0.000	0.000	0.000	0.013	my8036_rel.cz11a_c8r32
0.000	60.550	39.311	0.133	0.006	0.000	0.000	0.000	0.000	0.000	0.023	my8036_rel.cz11apur1_c8r32
qr1000.L5
- qr1000.L5: range queries with 1000 insert/s per client
- Legend for results is here.
- Each entry lists the percentage of responses that fit in that bucket (slower than max time for previous bucket, faster than min time for next bucket).
Query response time histogram
256us	1ms	4ms	16ms	64ms	256ms	1s	4s	16s	gt	max	tag
99.936	0.061	0.001	0.002	0.000	0.000	0.000	0.000	0.000	0.000	0.012	my5651_rel.cz11a_c8r32
99.937	0.063	nonzero	nonzero	0.000	0.000	0.000	0.000	0.000	0.000	0.004	my5744_rel.cz11a_c8r32
99.991	0.009	nonzero	0.000	0.000	0.000	0.000	0.000	0.000	0.000	0.002	my5744_rel.cz11apur1_c8r32
99.900	0.100	nonzero	0.000	0.000	0.000	0.000	0.000	0.000	0.000	0.002	my8036_rel.cz11a_c8r32
99.969	0.031	nonzero	nonzero	0.000	0.000	0.000	0.000	0.000	0.000	0.004	my8036_rel.cz11apur1_c8r32
Insert response time histogram
256us	1ms	4ms	16ms	64ms	256ms	1s	4s	16s	gt	max	tag
0.000	14.989	79.611	5.364	0.036	0.000	0.000	0.000	0.000	0.000	0.022	my5651_rel.cz11a_c8r32
0.000	3.197	96.647	0.156	0.000	0.000	0.000	0.000	0.000	0.000	0.014	my5744_rel.cz11a_c8r32
0.000	9.247	90.578	0.175	0.000	0.000	0.000	0.000	0.000	0.000	0.010	my5744_rel.cz11apur1_c8r32
0.000	0.000	99.756	0.242	0.003	0.000	0.000	0.000	0.000	0.000	0.022	my8036_rel.cz11a_c8r32
0.000	0.000	99.822	0.172	0.006	0.000	0.000	0.000	0.000	0.000	0.024	my8036_rel.cz11apur1_c8r32
Delete response time histogram
256us	1ms	4ms	16ms	64ms	256ms	1s	4s	16s	gt	max	tag
0.000	22.928	71.864	5.189	0.019	0.000	0.000	0.000	0.000	0.000	0.022	my5651_rel.cz11a_c8r32
0.000	89.325	10.533	0.142	0.000	0.000	0.000	0.000	0.000	0.000	0.014	my5744_rel.cz11a_c8r32
0.000	90.347	9.522	0.131	0.000	0.000	0.000	0.000	0.000	0.000	0.007	my5744_rel.cz11apur1_c8r32
0.000	42.083	57.731	0.183	0.003	0.000	0.000	0.000	0.000	0.000	0.020	my8036_rel.cz11a_c8r32
0.000	78.578	21.286	0.136	0.000	0.000	0.000	0.000	0.000	0.000	0.013	my8036_rel.cz11apur1_c8r32
qp1000.L6
- qp1000.L6: point queries with 1000 insert/s per client
- Legend for results is here.
- Each entry lists the percentage of responses that fit in that bucket (slower than max time for previous bucket, faster than min time for next bucket).
Query response time histogram
256us	1ms	4ms	16ms	64ms	256ms	1s	4s	16s	gt	max	tag
99.778	0.216	0.003	0.002	0.000	0.000	0.000	0.000	0.000	0.000	0.010	my5651_rel.cz11a_c8r32
99.748	0.252	nonzero	0.000	0.000	0.000	0.000	0.000	0.000	0.000	0.002	my5744_rel.cz11a_c8r32
99.967	0.033	nonzero	nonzero	0.000	0.000	0.000	0.000	0.000	0.000	0.004	my5744_rel.cz11apur1_c8r32
99.454	0.546	nonzero	0.000	0.000	0.000	0.000	0.000	0.000	0.000	0.002	my8036_rel.cz11a_c8r32
99.767	0.233	nonzero	0.000	0.000	0.000	0.000	0.000	0.000	0.000	0.002	my8036_rel.cz11apur1_c8r32
Insert response time histogram
256us	1ms	4ms	16ms	64ms	256ms	1s	4s	16s	gt	max	tag
0.000	14.603	80.611	4.744	0.042	0.000	0.000	0.000	0.000	0.000	0.022	my5651_rel.cz11a_c8r32
0.000	1.919	97.908	0.172	0.000	0.000	0.000	0.000	0.000	0.000	0.014	my5744_rel.cz11a_c8r32
0.000	3.700	96.153	0.147	0.000	0.000	0.000	0.000	0.000	0.000	0.012	my5744_rel.cz11apur1_c8r32
0.000	0.000	99.681	0.317	0.003	0.000	0.000	0.000	0.000	0.000	0.024	my8036_rel.cz11a_c8r32
0.000	0.000	99.731	0.267	0.003	0.000	0.000	0.000	0.000	0.000	0.023	my8036_rel.cz11apur1_c8r32
Delete response time histogram
256us	1ms	4ms	16ms	64ms	256ms	1s	4s	16s	gt	max	tag
0.000	23.931	71.311	4.733	0.025	0.000	0.000	0.000	0.000	0.000	0.022	my5651_rel.cz11a_c8r32
0.000	81.950	17.903	0.147	0.000	0.000	0.000	0.000	0.000	0.000	0.014	my5744_rel.cz11a_c8r32
0.000	86.850	13.011	0.139	0.000	0.000	0.000	0.000	0.000	0.000	0.012	my5744_rel.cz11apur1_c8r32
0.000	24.089	75.667	0.242	0.003	0.000	0.000	0.000	0.000	0.000	0.023	my8036_rel.cz11a_c8r32
0.000	56.700	43.094	0.203	0.003	0.000	0.000	0.000	0.000	0.000	0.023	my8036_rel.cz11apur1_c8r32