Introduction
This is a report for the insert benchmark with 50M docs and 1 client(s). It is generated by scripts (bash, awk, sed) and Tufte might not be impressed. An overview of the insert benchmark is here and a short update is here. Below, by DBMS, I mean DBMS+version.config. An example is my8020.c10b40 where my means MySQL, 8020 is version 8.0.20 and c10b40 is the name for the configuration file.
The test server has 8 AMD cores, 32G RAM and an NVMe SSD. It is described here as the ASUS PN53. The benchmark was run with 1 client and there were 1 or 3 connections per client (1 for queries or inserts without rate limits, 1+1 for rate limited inserts+deletes). It uses 1 table. It loads 50M rows per table without secondary indexes, creates 3 secondary indexes per table, then inserts 40m+10m rows per table with a delete per insert to avoid growing the table. It then does 6 read+write tests for 1800s each that do queries as fast as possible with 100,100,500,500,1000,1000 inserts/s and the same for deletes/s per client concurrent with the queries. The database is cached in memory. Clients and the DBMS share one server. The per-database configs are in the per-database subdirectories here.
The tested DBMS are:
- ma101107_rel.cz11a_c8r32 - MariaDB 10.11.7 with the cz11a_c8r32 config that uses innodb_purge_threads=4
- ma110401_rel.cz11b_c8r32 - MariaDB 11.4.1 with the cz11a_c8r32 config that uses innodb_purge_threads=4
- my8036_rel.cz11a_c8r32 - MySQL 8.0.36 with the cz11a_c8r32 config that uses innodb_purge_threads=4
Contents
- Summary
- l.i0: load without secondary indexes
- l.x: create secondary indexes
- l.i1: continue load after secondary indexes created with 50 inserts per transaction
- l.i2: continue load after secondary indexes created with 5 inserts per transaction
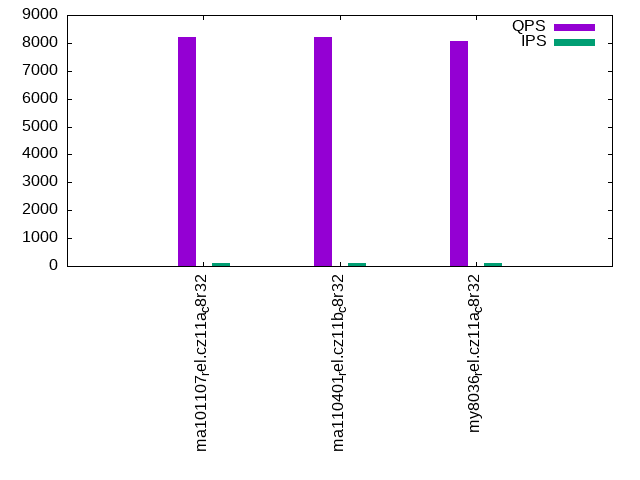
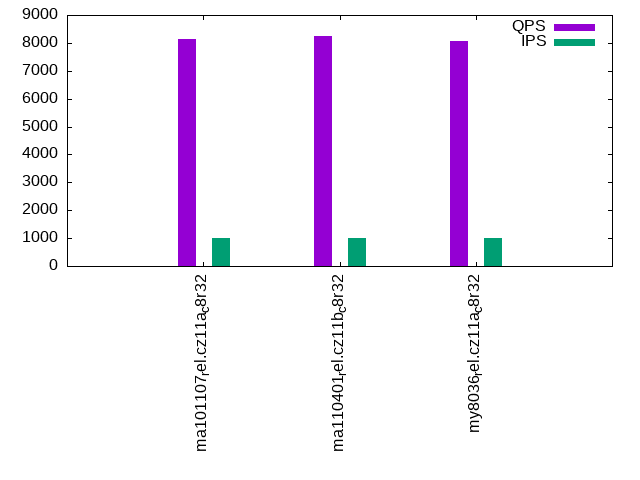
- qr100.L1: range queries with 100 insert/s per client
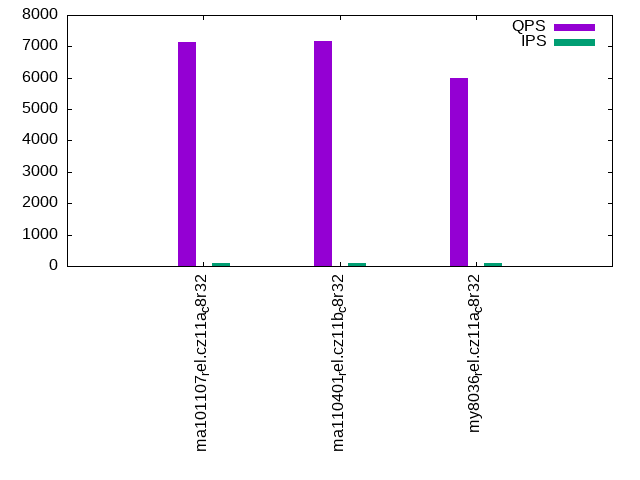
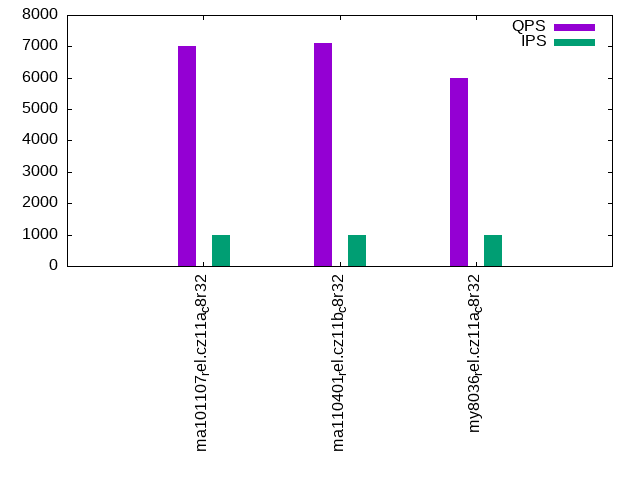
- qp100.L2: point queries with 100 insert/s per client
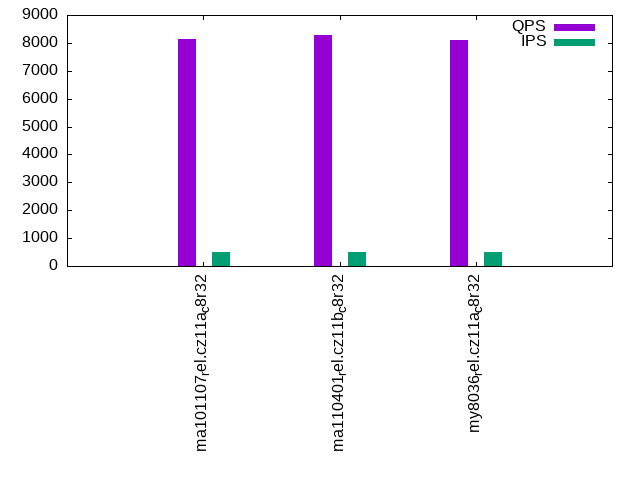
- qr500.L3: range queries with 500 insert/s per client
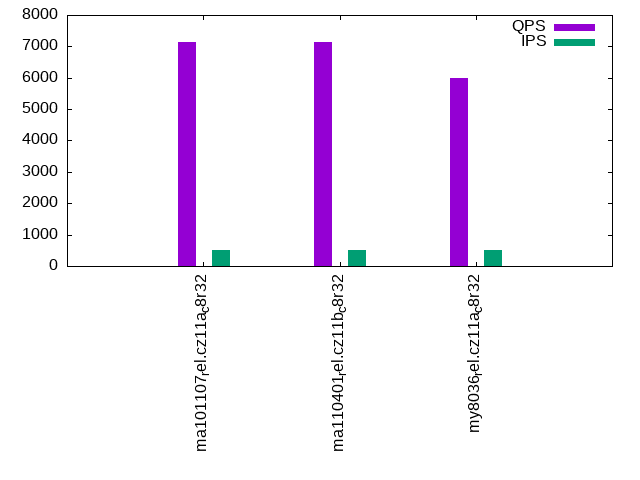
- qp500.L4: point queries with 500 insert/s per client
- qr1000.L5: range queries with 1000 insert/s per client
- qp1000.L6: point queries with 1000 insert/s per client
Summary
The numbers are inserts/s for l.i0, l.i1 and l.i2, indexed docs (or rows) /s for l.x and queries/s for qr100, qp100 thru qr1000, qp1000" The values are the average rate over the entire test for inserts (IPS) and queries (QPS). The range of values for IPS and QPS is split into 3 parts: bottom 25%, middle 50%, top 25%. Values in the bottom 25% have a red background, values in the top 25% have a green background and values in the middle have no color. A gray background is used for values that can be ignored because the DBMS did not sustain the target insert rate. Red backgrounds are not used when the minimum value is within 80% of the max value.
| dbms | l.i0 | l.x | l.i1 | l.i2 | qr100 | qp100 | qr500 | qp500 | qr1000 | qp1000 |
|---|---|---|---|---|---|---|---|---|---|---|
| ma101107_rel.cz11a_c8r32 | 157729 | 201613 | 34100 | 22522 | 8210 | 7125 | 8126 | 7128 | 8156 | 7027 |
| ma110401_rel.cz11b_c8r32 | 160772 | 200000 | 31521 | 21739 | 8213 | 7173 | 8276 | 7141 | 8238 | 7110 |
| my8036_rel.cz11a_c8r32 | 98039 | 255102 | 29218 | 17668 | 8079 | 6002 | 8106 | 5985 | 8081 | 6006 |
This table has relative throughput, throughput for the DBMS relative to the DBMS in the first line, using the absolute throughput from the previous table. Values less than 0.95 have a yellow background. Values greater than 1.05 have a blue background.
| dbms | l.i0 | l.x | l.i1 | l.i2 | qr100 | qp100 | qr500 | qp500 | qr1000 | qp1000 |
|---|---|---|---|---|---|---|---|---|---|---|
| ma101107_rel.cz11a_c8r32 | 1.00 | 1.00 | 1.00 | 1.00 | 1.00 | 1.00 | 1.00 | 1.00 | 1.00 | 1.00 |
| ma110401_rel.cz11b_c8r32 | 1.02 | 0.99 | 0.92 | 0.97 | 1.00 | 1.01 | 1.02 | 1.00 | 1.01 | 1.01 |
| my8036_rel.cz11a_c8r32 | 0.62 | 1.27 | 0.86 | 0.78 | 0.98 | 0.84 | 1.00 | 0.84 | 0.99 | 0.85 |
This lists the average rate of inserts/s for the tests that do inserts concurrent with queries. For such tests the query rate is listed in the table above. The read+write tests are setup so that the insert rate should match the target rate every second. Cells that are not at least 95% of the target have a red background to indicate a failure to satisfy the target.
| dbms | qr100.L1 | qp100.L2 | qr500.L3 | qp500.L4 | qr1000.L5 | qp1000.L6 |
|---|---|---|---|---|---|---|
| ma101107_rel.cz11a_c8r32 | 100 | 100 | 499 | 499 | 999 | 999 |
| ma110401_rel.cz11b_c8r32 | 100 | 100 | 499 | 499 | 999 | 999 |
| my8036_rel.cz11a_c8r32 | 100 | 100 | 499 | 499 | 999 | 999 |
| target | 100 | 100 | 500 | 500 | 1000 | 1000 |
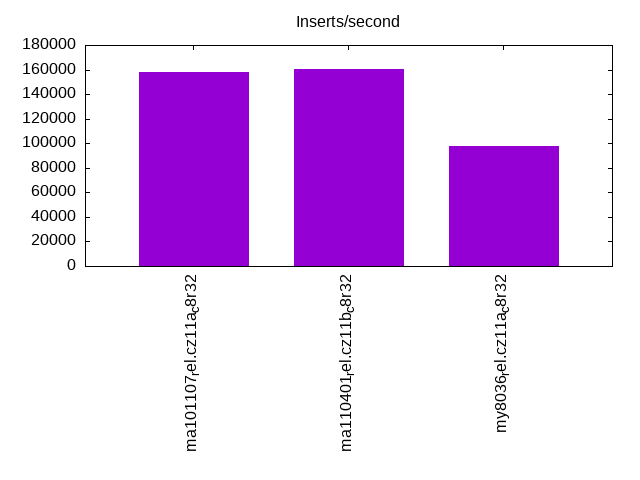
l.i0
l.i0: load without secondary indexes. Graphs for performance per 1-second interval are here.
Average throughput:
Insert response time histogram: each cell has the percentage of responses that take <= the time in the header and max is the max response time in seconds. For the max column values in the top 25% of the range have a red background and in the bottom 25% of the range have a green background. The red background is not used when the min value is within 80% of the max value.
| dbms | 256us | 1ms | 4ms | 16ms | 64ms | 256ms | 1s | 4s | 16s | gt | max |
|---|---|---|---|---|---|---|---|---|---|---|---|
| ma101107_rel.cz11a_c8r32 | 99.499 | 0.253 | 0.231 | 0.013 | 0.005 | 0.169 | |||||
| ma110401_rel.cz11b_c8r32 | 99.516 | 0.239 | 0.228 | 0.013 | 0.005 | 0.179 | |||||
| my8036_rel.cz11a_c8r32 | 86.376 | 13.218 | 0.271 | 0.133 | 0.002 | 0.085 |
Performance metrics for the DBMS listed above. Some are normalized by throughput, others are not. Legend for results is here.
ips	qps	rps	rmbps	wps	wmbps	rpq	rkbpq	wpi	wkbpi	csps	cpups	cspq	cpupq	dbgb1	dbgb2	rss	maxop	p50	p99	tag
157729	0	0	0.0	642.6	40.3	0.000	0.000	0.004	0.262	19905	23.2	0.126	12	3.3	34.1	3.7	0.169	159478	137349	ma101107_rel.cz11a_c8r32
160772	0	0	0.0	661.3	41.1	0.000	0.000	0.004	0.262	21003	23.8	0.131	12	3.3	34.1	3.7	0.179	162421	140149	ma110401_rel.cz11b_c8r32
98039	0	0	0.0	519.2	31.8	0.000	0.000	0.005	0.333	11433	17.8	0.117	15	3.3	33.9	5.5	0.085	98490	88902	my8036_rel.cz11a_c8r32
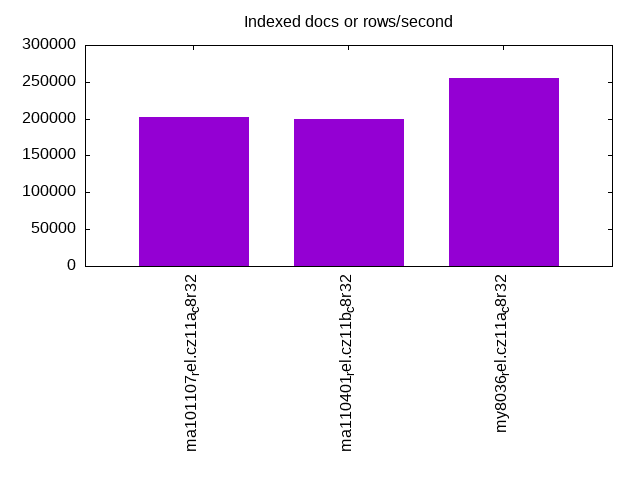
l.x
l.x: create secondary indexes.
Average throughput:
Performance metrics for the DBMS listed above. Some are normalized by throughput, others are not. Legend for results is here.
ips	qps	rps	rmbps	wps	wmbps	rpq	rkbpq	wpi	wkbpi	csps	cpups	cspq	cpupq	dbgb1	dbgb2	rss	maxop	p50	p99	tag
201613	0	0	0.0	2332.0	178.0	0.000	0.000	0.012	0.904	5208	12.1	0.026	5	7.5	38.3	6.9	0.001	NA	NA	ma101107_rel.cz11a_c8r32
200000	0	0	0.0	2288.2	175.7	0.000	0.000	0.011	0.899	5101	12.1	0.026	5	7.5	38.3	6.7	0.001	NA	NA	ma110401_rel.cz11b_c8r32
255102	0	1295	82.0	5643.8	304.4	0.005	0.329	0.022	1.222	18932	40.5	0.074	13	7.6	38.1	8.9	0.002	NA	NA	my8036_rel.cz11a_c8r32
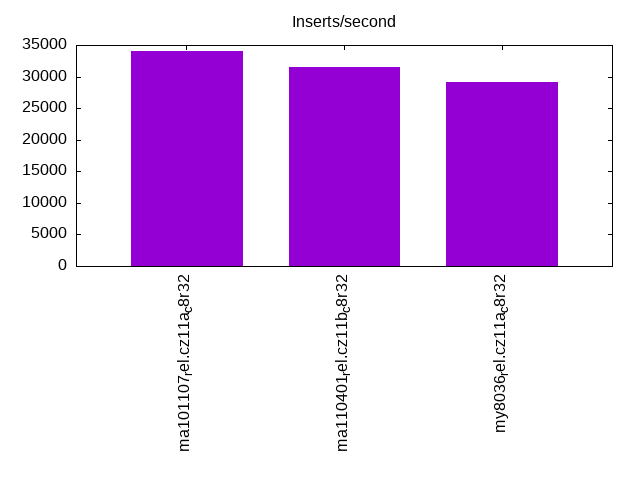
l.i1
l.i1: continue load after secondary indexes created with 50 inserts per transaction. Graphs for performance per 1-second interval are here.
Average throughput:
Insert response time histogram: each cell has the percentage of responses that take <= the time in the header and max is the max response time in seconds. For the max column values in the top 25% of the range have a red background and in the bottom 25% of the range have a green background. The red background is not used when the min value is within 80% of the max value.
| dbms | 256us | 1ms | 4ms | 16ms | 64ms | 256ms | 1s | 4s | 16s | gt | max |
|---|---|---|---|---|---|---|---|---|---|---|---|
| ma101107_rel.cz11a_c8r32 | 2.443 | 96.356 | 1.163 | 0.036 | 0.001 | nonzero | 0.412 | ||||
| ma110401_rel.cz11b_c8r32 | 5.181 | 92.208 | 2.312 | 0.297 | 0.003 | 0.215 | |||||
| my8036_rel.cz11a_c8r32 | 97.822 | 2.051 | 0.126 | 0.001 | 0.074 |
Delete response time histogram: each cell has the percentage of responses that take <= the time in the header and max is the max response time in seconds. For the max column values in the top 25% of the range have a red background and in the bottom 25% of the range have a green background. The red background is not used when the min value is within 80% of the max value.
| dbms | 256us | 1ms | 4ms | 16ms | 64ms | 256ms | 1s | 4s | 16s | gt | max |
|---|---|---|---|---|---|---|---|---|---|---|---|
| ma101107_rel.cz11a_c8r32 | 48.607 | 50.515 | 0.852 | 0.026 | 0.001 | 0.119 | |||||
| ma110401_rel.cz11b_c8r32 | 54.102 | 43.651 | 2.004 | 0.241 | 0.003 | 0.213 | |||||
| my8036_rel.cz11a_c8r32 | 30.858 | 67.601 | 1.514 | 0.027 | 0.001 | 0.091 |
Performance metrics for the DBMS listed above. Some are normalized by throughput, others are not. Legend for results is here.
ips	qps	rps	rmbps	wps	wmbps	rpq	rkbpq	wpi	wkbpi	csps	cpups	cspq	cpupq	dbgb1	dbgb2	rss	maxop	p50	p99	tag
34100	0	874	3.4	5322.9	179.9	0.026	0.103	0.156	5.401	88296	29.8	2.589	70	10.1	40.9	10.0	0.412	36361	11742	ma101107_rel.cz11a_c8r32
31521	0	840	3.3	4950.3	165.6	0.027	0.107	0.157	5.379	80042	27.3	2.539	69	10.1	40.9	10.0	0.215	31616	12986	ma110401_rel.cz11b_c8r32
29218	0	166	2.6	4754.1	176.3	0.006	0.091	0.163	6.179	48213	35.3	1.650	97	10.4	41.3	12.4	0.074	31266	3897	my8036_rel.cz11a_c8r32
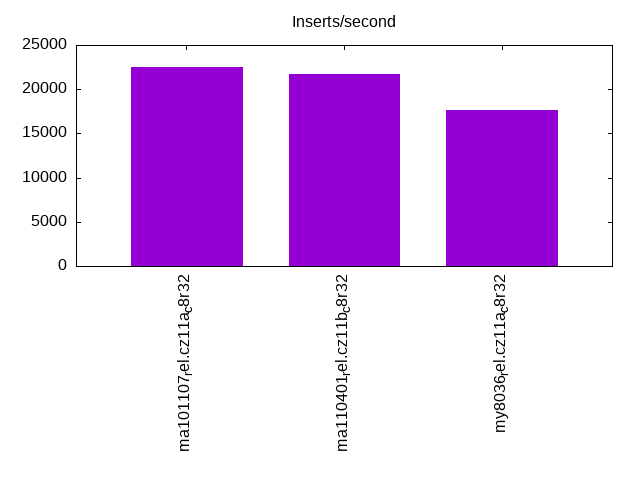
l.i2
l.i2: continue load after secondary indexes created with 5 inserts per transaction. Graphs for performance per 1-second interval are here.
Average throughput:
Insert response time histogram: each cell has the percentage of responses that take <= the time in the header and max is the max response time in seconds. For the max column values in the top 25% of the range have a red background and in the bottom 25% of the range have a green background. The red background is not used when the min value is within 80% of the max value.
| dbms | 256us | 1ms | 4ms | 16ms | 64ms | 256ms | 1s | 4s | 16s | gt | max |
|---|---|---|---|---|---|---|---|---|---|---|---|
| ma101107_rel.cz11a_c8r32 | 88.712 | 11.211 | 0.065 | 0.012 | nonzero | 0.059 | |||||
| ma110401_rel.cz11b_c8r32 | 90.142 | 9.685 | 0.058 | 0.112 | 0.003 | nonzero | 0.068 | ||||
| my8036_rel.cz11a_c8r32 | 69.276 | 30.566 | 0.015 | 0.140 | 0.001 | nonzero | 0.101 |
Delete response time histogram: each cell has the percentage of responses that take <= the time in the header and max is the max response time in seconds. For the max column values in the top 25% of the range have a red background and in the bottom 25% of the range have a green background. The red background is not used when the min value is within 80% of the max value.
| dbms | 256us | 1ms | 4ms | 16ms | 64ms | 256ms | 1s | 4s | 16s | gt | max |
|---|---|---|---|---|---|---|---|---|---|---|---|
| ma101107_rel.cz11a_c8r32 | 95.313 | 4.616 | 0.059 | 0.011 | nonzero | 0.059 | |||||
| ma110401_rel.cz11b_c8r32 | 94.122 | 5.724 | 0.051 | 0.100 | 0.003 | nonzero | 0.068 | ||||
| my8036_rel.cz11a_c8r32 | 80.631 | 19.223 | 0.010 | 0.134 | 0.001 | nonzero | 0.101 |
Performance metrics for the DBMS listed above. Some are normalized by throughput, others are not. Legend for results is here.
ips	qps	rps	rmbps	wps	wmbps	rpq	rkbpq	wpi	wkbpi	csps	cpups	cspq	cpupq	dbgb1	dbgb2	rss	maxop	p50	p99	tag
22522	0	3192	12.5	2614.7	90.7	0.142	0.567	0.116	4.124	114543	33.2	5.086	118	10.3	41.2	10.2	0.059	22488	21487	ma101107_rel.cz11a_c8r32
21739	0	3080	12.0	2563.0	87.9	0.142	0.567	0.118	4.143	110890	32.0	5.101	118	10.3	41.1	10.2	0.068	22557	18266	ma110401_rel.cz11b_c8r32
17668	0	28	0.4	2478.4	86.3	0.002	0.025	0.140	5.002	86356	34.2	4.888	155	10.6	41.5	12.9	0.101	17731	16767	my8036_rel.cz11a_c8r32
qr100.L1
qr100.L1: range queries with 100 insert/s per client. Graphs for performance per 1-second interval are here.
Average throughput:
Query response time histogram: each cell has the percentage of responses that take <= the time in the header and max is the max response time in seconds. For max values in the top 25% of the range have a red background and in the bottom 25% of the range have a green background. The red background is not used when the min value is within 80% of the max value.
| dbms | 256us | 1ms | 4ms | 16ms | 64ms | 256ms | 1s | 4s | 16s | gt | max |
|---|---|---|---|---|---|---|---|---|---|---|---|
| ma101107_rel.cz11a_c8r32 | 99.994 | 0.006 | nonzero | 0.002 | |||||||
| ma110401_rel.cz11b_c8r32 | 99.994 | 0.006 | nonzero | 0.002 | |||||||
| my8036_rel.cz11a_c8r32 | 99.935 | 0.065 | nonzero | 0.001 |
Insert response time histogram: each cell has the percentage of responses that take <= the time in the header and max is the max response time in seconds. For max values in the top 25% of the range have a red background and in the bottom 25% of the range have a green background. The red background is not used when the min value is within 80% of the max value.
| dbms | 256us | 1ms | 4ms | 16ms | 64ms | 256ms | 1s | 4s | 16s | gt | max |
|---|---|---|---|---|---|---|---|---|---|---|---|
| ma101107_rel.cz11a_c8r32 | 0.472 | 52.944 | 46.583 | 0.011 | |||||||
| ma110401_rel.cz11b_c8r32 | 0.944 | 52.472 | 46.583 | 0.011 | |||||||
| my8036_rel.cz11a_c8r32 | 99.194 | 0.778 | 0.028 | 0.024 |
Delete response time histogram: each cell has the percentage of responses that take <= the time in the header and max is the max response time in seconds. For max values in the top 25% of the range have a red background and in the bottom 25% of the range have a green background. The red background is not used when the min value is within 80% of the max value.
| dbms | 256us | 1ms | 4ms | 16ms | 64ms | 256ms | 1s | 4s | 16s | gt | max |
|---|---|---|---|---|---|---|---|---|---|---|---|
| ma101107_rel.cz11a_c8r32 | 4.083 | 49.361 | 46.556 | 0.011 | |||||||
| ma110401_rel.cz11b_c8r32 | 3.861 | 49.556 | 46.583 | 0.011 | |||||||
| my8036_rel.cz11a_c8r32 | 17.917 | 81.361 | 0.667 | 0.056 | 0.023 |
Performance metrics for the DBMS listed above. Some are normalized by throughput, others are not. Legend for results is here.
ips	qps	rps	rmbps	wps	wmbps	rpq	rkbpq	wpi	wkbpi	csps	cpups	cspq	cpupq	dbgb1	dbgb2	rss	maxop	p50	p99	tag
100	8210	4	0.0	2.3	0.1	0.000	0.002	0.024	1.192	31547	12.7	3.842	124	10.3	41.2	10.2	0.002	8215	8151	ma101107_rel.cz11a_c8r32
100	8213	4	0.0	2.4	0.1	0.000	0.002	0.024	1.203	31561	12.6	3.843	123	10.3	41.1	10.2	0.002	8215	8119	ma110401_rel.cz11b_c8r32
100	8079	0	0.0	209.5	5.3	0.000	0.000	2.099	53.982	31960	12.5	3.956	124	10.6	41.5	12.9	0.001	8087	7991	my8036_rel.cz11a_c8r32
qp100.L2
qp100.L2: point queries with 100 insert/s per client. Graphs for performance per 1-second interval are here.
Average throughput:
Query response time histogram: each cell has the percentage of responses that take <= the time in the header and max is the max response time in seconds. For max values in the top 25% of the range have a red background and in the bottom 25% of the range have a green background. The red background is not used when the min value is within 80% of the max value.
| dbms | 256us | 1ms | 4ms | 16ms | 64ms | 256ms | 1s | 4s | 16s | gt | max |
|---|---|---|---|---|---|---|---|---|---|---|---|
| ma101107_rel.cz11a_c8r32 | 99.981 | 0.018 | nonzero | 0.002 | |||||||
| ma110401_rel.cz11b_c8r32 | 99.983 | 0.017 | nonzero | 0.002 | |||||||
| my8036_rel.cz11a_c8r32 | 99.618 | 0.381 | nonzero | 0.002 |
Insert response time histogram: each cell has the percentage of responses that take <= the time in the header and max is the max response time in seconds. For max values in the top 25% of the range have a red background and in the bottom 25% of the range have a green background. The red background is not used when the min value is within 80% of the max value.
| dbms | 256us | 1ms | 4ms | 16ms | 64ms | 256ms | 1s | 4s | 16s | gt | max |
|---|---|---|---|---|---|---|---|---|---|---|---|
| ma101107_rel.cz11a_c8r32 | 53.083 | 46.917 | 0.011 | ||||||||
| ma110401_rel.cz11b_c8r32 | 0.083 | 53.389 | 46.528 | 0.014 | |||||||
| my8036_rel.cz11a_c8r32 | 99.583 | 0.417 | 0.012 |
Delete response time histogram: each cell has the percentage of responses that take <= the time in the header and max is the max response time in seconds. For max values in the top 25% of the range have a red background and in the bottom 25% of the range have a green background. The red background is not used when the min value is within 80% of the max value.
| dbms | 256us | 1ms | 4ms | 16ms | 64ms | 256ms | 1s | 4s | 16s | gt | max |
|---|---|---|---|---|---|---|---|---|---|---|---|
| ma101107_rel.cz11a_c8r32 | 2.389 | 50.694 | 46.917 | 0.011 | |||||||
| ma110401_rel.cz11b_c8r32 | 2.639 | 50.833 | 46.528 | 0.014 | |||||||
| my8036_rel.cz11a_c8r32 | 0.083 | 99.500 | 0.417 | 0.012 |
Performance metrics for the DBMS listed above. Some are normalized by throughput, others are not. Legend for results is here.
ips	qps	rps	rmbps	wps	wmbps	rpq	rkbpq	wpi	wkbpi	csps	cpups	cspq	cpupq	dbgb1	dbgb2	rss	maxop	p50	p99	tag
100	7125	3	0.0	21.1	0.6	0.000	0.002	0.211	6.491	28848	13.2	4.049	148	10.3	41.2	10.2	0.002	7128	6936	ma101107_rel.cz11a_c8r32
100	7173	3	0.0	16.3	0.5	0.000	0.002	0.163	5.067	28995	13.0	4.042	145	10.3	41.1	10.2	0.002	7176	6968	ma110401_rel.cz11b_c8r32
100	6002	0	0.0	54.6	1.4	0.000	0.000	0.547	14.289	24572	13.1	4.094	175	10.6	41.5	12.9	0.002	6009	5722	my8036_rel.cz11a_c8r32
qr500.L3
qr500.L3: range queries with 500 insert/s per client. Graphs for performance per 1-second interval are here.
Average throughput:
Query response time histogram: each cell has the percentage of responses that take <= the time in the header and max is the max response time in seconds. For max values in the top 25% of the range have a red background and in the bottom 25% of the range have a green background. The red background is not used when the min value is within 80% of the max value.
| dbms | 256us | 1ms | 4ms | 16ms | 64ms | 256ms | 1s | 4s | 16s | gt | max |
|---|---|---|---|---|---|---|---|---|---|---|---|
| ma101107_rel.cz11a_c8r32 | 99.984 | 0.016 | nonzero | nonzero | 0.004 | ||||||
| ma110401_rel.cz11b_c8r32 | 99.987 | 0.013 | nonzero | nonzero | 0.009 | ||||||
| my8036_rel.cz11a_c8r32 | 99.916 | 0.084 | nonzero | 0.002 |
Insert response time histogram: each cell has the percentage of responses that take <= the time in the header and max is the max response time in seconds. For max values in the top 25% of the range have a red background and in the bottom 25% of the range have a green background. The red background is not used when the min value is within 80% of the max value.
| dbms | 256us | 1ms | 4ms | 16ms | 64ms | 256ms | 1s | 4s | 16s | gt | max |
|---|---|---|---|---|---|---|---|---|---|---|---|
| ma101107_rel.cz11a_c8r32 | 11.956 | 78.694 | 9.350 | 0.011 | |||||||
| ma110401_rel.cz11b_c8r32 | 23.078 | 67.650 | 9.272 | 0.011 | |||||||
| my8036_rel.cz11a_c8r32 | 99.817 | 0.183 | 0.015 |
Delete response time histogram: each cell has the percentage of responses that take <= the time in the header and max is the max response time in seconds. For max values in the top 25% of the range have a red background and in the bottom 25% of the range have a green background. The red background is not used when the min value is within 80% of the max value.
| dbms | 256us | 1ms | 4ms | 16ms | 64ms | 256ms | 1s | 4s | 16s | gt | max |
|---|---|---|---|---|---|---|---|---|---|---|---|
| ma101107_rel.cz11a_c8r32 | 78.511 | 12.139 | 9.350 | 0.011 | |||||||
| ma110401_rel.cz11b_c8r32 | 78.950 | 11.783 | 9.267 | 0.011 | |||||||
| my8036_rel.cz11a_c8r32 | 37.844 | 62.033 | 0.122 | 0.014 |
Performance metrics for the DBMS listed above. Some are normalized by throughput, others are not. Legend for results is here.
ips	qps	rps	rmbps	wps	wmbps	rpq	rkbpq	wpi	wkbpi	csps	cpups	cspq	cpupq	dbgb1	dbgb2	rss	maxop	p50	p99	tag
499	8126	19	0.1	18.6	0.9	0.002	0.009	0.037	1.855	31531	13.2	3.880	130	10.3	41.2	10.2	0.004	8135	8071	ma101107_rel.cz11a_c8r32
499	8276	19	0.1	19.0	0.9	0.002	0.009	0.038	1.861	32089	13.2	3.877	128	10.3	41.1	10.2	0.009	8279	8215	ma110401_rel.cz11b_c8r32
499	8106	0	0.0	127.5	3.7	0.000	0.000	0.255	7.531	32101	13.0	3.960	128	10.6	41.5	12.9	0.002	8103	8023	my8036_rel.cz11a_c8r32
qp500.L4
qp500.L4: point queries with 500 insert/s per client. Graphs for performance per 1-second interval are here.
Average throughput:
Query response time histogram: each cell has the percentage of responses that take <= the time in the header and max is the max response time in seconds. For max values in the top 25% of the range have a red background and in the bottom 25% of the range have a green background. The red background is not used when the min value is within 80% of the max value.
| dbms | 256us | 1ms | 4ms | 16ms | 64ms | 256ms | 1s | 4s | 16s | gt | max |
|---|---|---|---|---|---|---|---|---|---|---|---|
| ma101107_rel.cz11a_c8r32 | 99.968 | 0.032 | nonzero | nonzero | 0.004 | ||||||
| ma110401_rel.cz11b_c8r32 | 99.965 | 0.035 | nonzero | nonzero | 0.004 | ||||||
| my8036_rel.cz11a_c8r32 | 99.535 | 0.465 | nonzero | 0.002 |
Insert response time histogram: each cell has the percentage of responses that take <= the time in the header and max is the max response time in seconds. For max values in the top 25% of the range have a red background and in the bottom 25% of the range have a green background. The red background is not used when the min value is within 80% of the max value.
| dbms | 256us | 1ms | 4ms | 16ms | 64ms | 256ms | 1s | 4s | 16s | gt | max |
|---|---|---|---|---|---|---|---|---|---|---|---|
| ma101107_rel.cz11a_c8r32 | 5.106 | 85.617 | 9.278 | 0.011 | |||||||
| ma110401_rel.cz11b_c8r32 | 13.200 | 77.544 | 9.256 | 0.011 | |||||||
| my8036_rel.cz11a_c8r32 | 99.911 | 0.089 | 0.014 |
Delete response time histogram: each cell has the percentage of responses that take <= the time in the header and max is the max response time in seconds. For max values in the top 25% of the range have a red background and in the bottom 25% of the range have a green background. The red background is not used when the min value is within 80% of the max value.
| dbms | 256us | 1ms | 4ms | 16ms | 64ms | 256ms | 1s | 4s | 16s | gt | max |
|---|---|---|---|---|---|---|---|---|---|---|---|
| ma101107_rel.cz11a_c8r32 | 74.383 | 16.339 | 9.278 | 0.011 | |||||||
| ma110401_rel.cz11b_c8r32 | 76.511 | 14.239 | 9.250 | 0.011 | |||||||
| my8036_rel.cz11a_c8r32 | 12.261 | 87.672 | 0.067 | 0.013 |
Performance metrics for the DBMS listed above. Some are normalized by throughput, others are not. Legend for results is here.
ips	qps	rps	rmbps	wps	wmbps	rpq	rkbpq	wpi	wkbpi	csps	cpups	cspq	cpupq	dbgb1	dbgb2	rss	maxop	p50	p99	tag
499	7128	18	0.1	12.3	0.7	0.003	0.010	0.025	1.499	29038	13.3	4.074	149	10.3	41.2	10.2	0.004	7131	6942	ma101107_rel.cz11a_c8r32
499	7141	18	0.1	12.8	0.7	0.003	0.010	0.026	1.521	29093	13.4	4.074	150	10.3	41.1	10.2	0.004	7144	6952	ma110401_rel.cz11b_c8r32
499	5985	0	0.0	48.2	1.7	0.000	0.000	0.097	3.523	24762	13.2	4.138	176	10.6	41.6	12.9	0.002	5993	5737	my8036_rel.cz11a_c8r32
qr1000.L5
qr1000.L5: range queries with 1000 insert/s per client. Graphs for performance per 1-second interval are here.
Average throughput:
Query response time histogram: each cell has the percentage of responses that take <= the time in the header and max is the max response time in seconds. For max values in the top 25% of the range have a red background and in the bottom 25% of the range have a green background. The red background is not used when the min value is within 80% of the max value.
| dbms | 256us | 1ms | 4ms | 16ms | 64ms | 256ms | 1s | 4s | 16s | gt | max |
|---|---|---|---|---|---|---|---|---|---|---|---|
| ma101107_rel.cz11a_c8r32 | 99.978 | 0.021 | 0.001 | nonzero | 0.008 | ||||||
| ma110401_rel.cz11b_c8r32 | 99.981 | 0.018 | nonzero | nonzero | 0.015 | ||||||
| my8036_rel.cz11a_c8r32 | 99.900 | 0.100 | nonzero | 0.002 |
Insert response time histogram: each cell has the percentage of responses that take <= the time in the header and max is the max response time in seconds. For max values in the top 25% of the range have a red background and in the bottom 25% of the range have a green background. The red background is not used when the min value is within 80% of the max value.
| dbms | 256us | 1ms | 4ms | 16ms | 64ms | 256ms | 1s | 4s | 16s | gt | max |
|---|---|---|---|---|---|---|---|---|---|---|---|
| ma101107_rel.cz11a_c8r32 | 20.794 | 74.481 | 4.722 | 0.003 | 0.042 | ||||||
| ma110401_rel.cz11b_c8r32 | 31.753 | 63.400 | 4.836 | 0.011 | 0.040 | ||||||
| my8036_rel.cz11a_c8r32 | 99.756 | 0.242 | 0.003 | 0.022 |
Delete response time histogram: each cell has the percentage of responses that take <= the time in the header and max is the max response time in seconds. For max values in the top 25% of the range have a red background and in the bottom 25% of the range have a green background. The red background is not used when the min value is within 80% of the max value.
| dbms | 256us | 1ms | 4ms | 16ms | 64ms | 256ms | 1s | 4s | 16s | gt | max |
|---|---|---|---|---|---|---|---|---|---|---|---|
| ma101107_rel.cz11a_c8r32 | 86.119 | 9.175 | 4.703 | 0.003 | 0.042 | ||||||
| ma110401_rel.cz11b_c8r32 | 86.300 | 8.939 | 4.753 | 0.008 | 0.040 | ||||||
| my8036_rel.cz11a_c8r32 | 42.083 | 57.731 | 0.183 | 0.003 | 0.020 |
Performance metrics for the DBMS listed above. Some are normalized by throughput, others are not. Legend for results is here.
ips	qps	rps	rmbps	wps	wmbps	rpq	rkbpq	wpi	wkbpi	csps	cpups	cspq	cpupq	dbgb1	dbgb2	rss	maxop	p50	p99	tag
999	8156	37	0.1	131.0	4.3	0.005	0.018	0.131	4.400	32475	13.4	3.982	131	10.3	41.2	10.3	0.008	8154	8026	ma101107_rel.cz11a_c8r32
999	8238	37	0.1	133.0	4.3	0.005	0.018	0.133	4.407	32787	13.4	3.980	130	10.3	41.1	10.3	0.015	8247	8119	ma110401_rel.cz11b_c8r32
999	8081	0	0.0	194.0	5.9	0.000	0.000	0.194	6.068	32624	13.6	4.037	135	10.6	41.6	12.9	0.002	8087	8007	my8036_rel.cz11a_c8r32
qp1000.L6
qp1000.L6: point queries with 1000 insert/s per client. Graphs for performance per 1-second interval are here.
Average throughput:
Query response time histogram: each cell has the percentage of responses that take <= the time in the header and max is the max response time in seconds. For max values in the top 25% of the range have a red background and in the bottom 25% of the range have a green background. The red background is not used when the min value is within 80% of the max value.
| dbms | 256us | 1ms | 4ms | 16ms | 64ms | 256ms | 1s | 4s | 16s | gt | max |
|---|---|---|---|---|---|---|---|---|---|---|---|
| ma101107_rel.cz11a_c8r32 | 99.954 | 0.046 | nonzero | nonzero | 0.006 | ||||||
| ma110401_rel.cz11b_c8r32 | 99.957 | 0.043 | nonzero | 0.003 | |||||||
| my8036_rel.cz11a_c8r32 | 99.454 | 0.546 | nonzero | 0.002 |
Insert response time histogram: each cell has the percentage of responses that take <= the time in the header and max is the max response time in seconds. For max values in the top 25% of the range have a red background and in the bottom 25% of the range have a green background. The red background is not used when the min value is within 80% of the max value.
| dbms | 256us | 1ms | 4ms | 16ms | 64ms | 256ms | 1s | 4s | 16s | gt | max |
|---|---|---|---|---|---|---|---|---|---|---|---|
| ma101107_rel.cz11a_c8r32 | 10.458 | 84.881 | 4.658 | 0.003 | 0.026 | ||||||
| ma110401_rel.cz11b_c8r32 | 17.042 | 78.308 | 4.647 | 0.003 | 0.031 | ||||||
| my8036_rel.cz11a_c8r32 | 99.681 | 0.317 | 0.003 | 0.024 |
Delete response time histogram: each cell has the percentage of responses that take <= the time in the header and max is the max response time in seconds. For max values in the top 25% of the range have a red background and in the bottom 25% of the range have a green background. The red background is not used when the min value is within 80% of the max value.
| dbms | 256us | 1ms | 4ms | 16ms | 64ms | 256ms | 1s | 4s | 16s | gt | max |
|---|---|---|---|---|---|---|---|---|---|---|---|
| ma101107_rel.cz11a_c8r32 | 82.714 | 12.631 | 4.653 | 0.003 | 0.026 | ||||||
| ma110401_rel.cz11b_c8r32 | 82.625 | 12.744 | 4.628 | 0.003 | 0.031 | ||||||
| my8036_rel.cz11a_c8r32 | 24.089 | 75.667 | 0.242 | 0.003 | 0.023 |
Performance metrics for the DBMS listed above. Some are normalized by throughput, others are not. Legend for results is here.
ips	qps	rps	rmbps	wps	wmbps	rpq	rkbpq	wpi	wkbpi	csps	cpups	cspq	cpupq	dbgb1	dbgb2	rss	maxop	p50	p99	tag
999	7027	37	0.1	49.6	2.1	0.005	0.021	0.050	2.130	29221	13.5	4.158	154	10.3	41.2	10.3	0.006	7032	6904	ma101107_rel.cz11a_c8r32
999	7110	37	0.1	39.4	1.8	0.005	0.021	0.039	1.847	29473	13.4	4.145	151	10.3	41.1	10.3	0.003	7112	6923	ma110401_rel.cz11b_c8r32
999	6006	0	0.0	192.5	5.9	0.000	0.000	0.193	6.030	25720	14.0	4.282	186	10.6	41.6	13.0	0.002	6014	5737	my8036_rel.cz11a_c8r32
l.i0
l.i0: load without secondary indexes
Performance metrics for all DBMS, not just the ones listed above. Some are normalized by throughput, others are not. Legend for results is here.
ips	qps	rps	rmbps	wps	wmbps	rpq	rkbpq	wpi	wkbpi	csps	cpups	cspq	cpupq	dbgb1	dbgb2	rss	maxop	p50	p99	tag
157729	0	0	0.0	642.6	40.3	0.000	0.000	0.004	0.262	19905	23.2	0.126	12	3.3	34.1	3.7	0.169	159478	137349	ma101107_rel.cz11a_c8r32
160772	0	0	0.0	661.3	41.1	0.000	0.000	0.004	0.262	21003	23.8	0.131	12	3.3	34.1	3.7	0.179	162421	140149	ma110401_rel.cz11b_c8r32
98039	0	0	0.0	519.2	31.8	0.000	0.000	0.005	0.333	11433	17.8	0.117	15	3.3	33.9	5.5	0.085	98490	88902	my8036_rel.cz11a_c8r32
l.x
l.x: create secondary indexes
Performance metrics for all DBMS, not just the ones listed above. Some are normalized by throughput, others are not. Legend for results is here.
ips	qps	rps	rmbps	wps	wmbps	rpq	rkbpq	wpi	wkbpi	csps	cpups	cspq	cpupq	dbgb1	dbgb2	rss	maxop	p50	p99	tag
201613	0	0	0.0	2332.0	178.0	0.000	0.000	0.012	0.904	5208	12.1	0.026	5	7.5	38.3	6.9	0.001	NA	NA	ma101107_rel.cz11a_c8r32
200000	0	0	0.0	2288.2	175.7	0.000	0.000	0.011	0.899	5101	12.1	0.026	5	7.5	38.3	6.7	0.001	NA	NA	ma110401_rel.cz11b_c8r32
255102	0	1295	82.0	5643.8	304.4	0.005	0.329	0.022	1.222	18932	40.5	0.074	13	7.6	38.1	8.9	0.002	NA	NA	my8036_rel.cz11a_c8r32
l.i1
l.i1: continue load after secondary indexes created with 50 inserts per transaction
Performance metrics for all DBMS, not just the ones listed above. Some are normalized by throughput, others are not. Legend for results is here.
ips	qps	rps	rmbps	wps	wmbps	rpq	rkbpq	wpi	wkbpi	csps	cpups	cspq	cpupq	dbgb1	dbgb2	rss	maxop	p50	p99	tag
34100	0	874	3.4	5322.9	179.9	0.026	0.103	0.156	5.401	88296	29.8	2.589	70	10.1	40.9	10.0	0.412	36361	11742	ma101107_rel.cz11a_c8r32
31521	0	840	3.3	4950.3	165.6	0.027	0.107	0.157	5.379	80042	27.3	2.539	69	10.1	40.9	10.0	0.215	31616	12986	ma110401_rel.cz11b_c8r32
29218	0	166	2.6	4754.1	176.3	0.006	0.091	0.163	6.179	48213	35.3	1.650	97	10.4	41.3	12.4	0.074	31266	3897	my8036_rel.cz11a_c8r32
l.i2
l.i2: continue load after secondary indexes created with 5 inserts per transaction
Performance metrics for all DBMS, not just the ones listed above. Some are normalized by throughput, others are not. Legend for results is here.
ips	qps	rps	rmbps	wps	wmbps	rpq	rkbpq	wpi	wkbpi	csps	cpups	cspq	cpupq	dbgb1	dbgb2	rss	maxop	p50	p99	tag
22522	0	3192	12.5	2614.7	90.7	0.142	0.567	0.116	4.124	114543	33.2	5.086	118	10.3	41.2	10.2	0.059	22488	21487	ma101107_rel.cz11a_c8r32
21739	0	3080	12.0	2563.0	87.9	0.142	0.567	0.118	4.143	110890	32.0	5.101	118	10.3	41.1	10.2	0.068	22557	18266	ma110401_rel.cz11b_c8r32
17668	0	28	0.4	2478.4	86.3	0.002	0.025	0.140	5.002	86356	34.2	4.888	155	10.6	41.5	12.9	0.101	17731	16767	my8036_rel.cz11a_c8r32
qr100.L1
qr100.L1: range queries with 100 insert/s per client
Performance metrics for all DBMS, not just the ones listed above. Some are normalized by throughput, others are not. Legend for results is here.
ips	qps	rps	rmbps	wps	wmbps	rpq	rkbpq	wpi	wkbpi	csps	cpups	cspq	cpupq	dbgb1	dbgb2	rss	maxop	p50	p99	tag
100	8210	4	0.0	2.3	0.1	0.000	0.002	0.024	1.192	31547	12.7	3.842	124	10.3	41.2	10.2	0.002	8215	8151	ma101107_rel.cz11a_c8r32
100	8213	4	0.0	2.4	0.1	0.000	0.002	0.024	1.203	31561	12.6	3.843	123	10.3	41.1	10.2	0.002	8215	8119	ma110401_rel.cz11b_c8r32
100	8079	0	0.0	209.5	5.3	0.000	0.000	2.099	53.982	31960	12.5	3.956	124	10.6	41.5	12.9	0.001	8087	7991	my8036_rel.cz11a_c8r32
qp100.L2
qp100.L2: point queries with 100 insert/s per client
Performance metrics for all DBMS, not just the ones listed above. Some are normalized by throughput, others are not. Legend for results is here.
ips	qps	rps	rmbps	wps	wmbps	rpq	rkbpq	wpi	wkbpi	csps	cpups	cspq	cpupq	dbgb1	dbgb2	rss	maxop	p50	p99	tag
100	7125	3	0.0	21.1	0.6	0.000	0.002	0.211	6.491	28848	13.2	4.049	148	10.3	41.2	10.2	0.002	7128	6936	ma101107_rel.cz11a_c8r32
100	7173	3	0.0	16.3	0.5	0.000	0.002	0.163	5.067	28995	13.0	4.042	145	10.3	41.1	10.2	0.002	7176	6968	ma110401_rel.cz11b_c8r32
100	6002	0	0.0	54.6	1.4	0.000	0.000	0.547	14.289	24572	13.1	4.094	175	10.6	41.5	12.9	0.002	6009	5722	my8036_rel.cz11a_c8r32
qr500.L3
qr500.L3: range queries with 500 insert/s per client
Performance metrics for all DBMS, not just the ones listed above. Some are normalized by throughput, others are not. Legend for results is here.
ips	qps	rps	rmbps	wps	wmbps	rpq	rkbpq	wpi	wkbpi	csps	cpups	cspq	cpupq	dbgb1	dbgb2	rss	maxop	p50	p99	tag
499	8126	19	0.1	18.6	0.9	0.002	0.009	0.037	1.855	31531	13.2	3.880	130	10.3	41.2	10.2	0.004	8135	8071	ma101107_rel.cz11a_c8r32
499	8276	19	0.1	19.0	0.9	0.002	0.009	0.038	1.861	32089	13.2	3.877	128	10.3	41.1	10.2	0.009	8279	8215	ma110401_rel.cz11b_c8r32
499	8106	0	0.0	127.5	3.7	0.000	0.000	0.255	7.531	32101	13.0	3.960	128	10.6	41.5	12.9	0.002	8103	8023	my8036_rel.cz11a_c8r32
qp500.L4
qp500.L4: point queries with 500 insert/s per client
Performance metrics for all DBMS, not just the ones listed above. Some are normalized by throughput, others are not. Legend for results is here.
ips	qps	rps	rmbps	wps	wmbps	rpq	rkbpq	wpi	wkbpi	csps	cpups	cspq	cpupq	dbgb1	dbgb2	rss	maxop	p50	p99	tag
499	7128	18	0.1	12.3	0.7	0.003	0.010	0.025	1.499	29038	13.3	4.074	149	10.3	41.2	10.2	0.004	7131	6942	ma101107_rel.cz11a_c8r32
499	7141	18	0.1	12.8	0.7	0.003	0.010	0.026	1.521	29093	13.4	4.074	150	10.3	41.1	10.2	0.004	7144	6952	ma110401_rel.cz11b_c8r32
499	5985	0	0.0	48.2	1.7	0.000	0.000	0.097	3.523	24762	13.2	4.138	176	10.6	41.6	12.9	0.002	5993	5737	my8036_rel.cz11a_c8r32
qr1000.L5
qr1000.L5: range queries with 1000 insert/s per client
Performance metrics for all DBMS, not just the ones listed above. Some are normalized by throughput, others are not. Legend for results is here.
ips	qps	rps	rmbps	wps	wmbps	rpq	rkbpq	wpi	wkbpi	csps	cpups	cspq	cpupq	dbgb1	dbgb2	rss	maxop	p50	p99	tag
999	8156	37	0.1	131.0	4.3	0.005	0.018	0.131	4.400	32475	13.4	3.982	131	10.3	41.2	10.3	0.008	8154	8026	ma101107_rel.cz11a_c8r32
999	8238	37	0.1	133.0	4.3	0.005	0.018	0.133	4.407	32787	13.4	3.980	130	10.3	41.1	10.3	0.015	8247	8119	ma110401_rel.cz11b_c8r32
999	8081	0	0.0	194.0	5.9	0.000	0.000	0.194	6.068	32624	13.6	4.037	135	10.6	41.6	12.9	0.002	8087	8007	my8036_rel.cz11a_c8r32
qp1000.L6
qp1000.L6: point queries with 1000 insert/s per client
Performance metrics for all DBMS, not just the ones listed above. Some are normalized by throughput, others are not. Legend for results is here.
ips	qps	rps	rmbps	wps	wmbps	rpq	rkbpq	wpi	wkbpi	csps	cpups	cspq	cpupq	dbgb1	dbgb2	rss	maxop	p50	p99	tag
999	7027	37	0.1	49.6	2.1	0.005	0.021	0.050	2.130	29221	13.5	4.158	154	10.3	41.2	10.3	0.006	7032	6904	ma101107_rel.cz11a_c8r32
999	7110	37	0.1	39.4	1.8	0.005	0.021	0.039	1.847	29473	13.4	4.145	151	10.3	41.1	10.3	0.003	7112	6923	ma110401_rel.cz11b_c8r32
999	6006	0	0.0	192.5	5.9	0.000	0.000	0.193	6.030	25720	14.0	4.282	186	10.6	41.6	13.0	0.002	6014	5737	my8036_rel.cz11a_c8r32
l.i0
- l.i0: load without secondary indexes
- Legend for results is here.
- Each entry lists the percentage of responses that fit in that bucket (slower than max time for previous bucket, faster than min time for next bucket).
Insert response time histogram
256us	1ms	4ms	16ms	64ms	256ms	1s	4s	16s	gt	max	tag
0.000	99.499	0.253	0.231	0.013	0.005	0.000	0.000	0.000	0.000	0.169	ma101107_rel.cz11a_c8r32
0.000	99.516	0.239	0.228	0.013	0.005	0.000	0.000	0.000	0.000	0.179	ma110401_rel.cz11b_c8r32
0.000	86.376	13.218	0.271	0.133	0.002	0.000	0.000	0.000	0.000	0.085	my8036_rel.cz11a_c8r32
l.x
- l.x: create secondary indexes
- Legend for results is here.
- Each entry lists the percentage of responses that fit in that bucket (slower than max time for previous bucket, faster than min time for next bucket).
TODO - determine whether there is data for create index response time
l.i1
- l.i1: continue load after secondary indexes created with 50 inserts per transaction
- Legend for results is here.
- Each entry lists the percentage of responses that fit in that bucket (slower than max time for previous bucket, faster than min time for next bucket).
Insert response time histogram
256us	1ms	4ms	16ms	64ms	256ms	1s	4s	16s	gt	max	tag
0.000	2.443	96.356	1.163	0.036	0.001	nonzero	0.000	0.000	0.000	0.412	ma101107_rel.cz11a_c8r32
0.000	5.181	92.208	2.312	0.297	0.003	0.000	0.000	0.000	0.000	0.215	ma110401_rel.cz11b_c8r32
0.000	0.000	97.822	2.051	0.126	0.001	0.000	0.000	0.000	0.000	0.074	my8036_rel.cz11a_c8r32
Delete response time histogram
256us	1ms	4ms	16ms	64ms	256ms	1s	4s	16s	gt	max	tag
0.000	48.607	50.515	0.852	0.026	0.001	0.000	0.000	0.000	0.000	0.119	ma101107_rel.cz11a_c8r32
0.000	54.102	43.651	2.004	0.241	0.003	0.000	0.000	0.000	0.000	0.213	ma110401_rel.cz11b_c8r32
0.000	30.858	67.601	1.514	0.027	0.001	0.000	0.000	0.000	0.000	0.091	my8036_rel.cz11a_c8r32
l.i2
- l.i2: continue load after secondary indexes created with 5 inserts per transaction
- Legend for results is here.
- Each entry lists the percentage of responses that fit in that bucket (slower than max time for previous bucket, faster than min time for next bucket).
Insert response time histogram
256us	1ms	4ms	16ms	64ms	256ms	1s	4s	16s	gt	max	tag
88.712	11.211	0.065	0.012	nonzero	0.000	0.000	0.000	0.000	0.000	0.059	ma101107_rel.cz11a_c8r32
90.142	9.685	0.058	0.112	0.003	nonzero	0.000	0.000	0.000	0.000	0.068	ma110401_rel.cz11b_c8r32
69.276	30.566	0.015	0.140	0.001	nonzero	0.000	0.000	0.000	0.000	0.101	my8036_rel.cz11a_c8r32
Delete response time histogram
256us	1ms	4ms	16ms	64ms	256ms	1s	4s	16s	gt	max	tag
95.313	4.616	0.059	0.011	nonzero	0.000	0.000	0.000	0.000	0.000	0.059	ma101107_rel.cz11a_c8r32
94.122	5.724	0.051	0.100	0.003	nonzero	0.000	0.000	0.000	0.000	0.068	ma110401_rel.cz11b_c8r32
80.631	19.223	0.010	0.134	0.001	nonzero	0.000	0.000	0.000	0.000	0.101	my8036_rel.cz11a_c8r32
qr100.L1
- qr100.L1: range queries with 100 insert/s per client
- Legend for results is here.
- Each entry lists the percentage of responses that fit in that bucket (slower than max time for previous bucket, faster than min time for next bucket).
Query response time histogram
256us	1ms	4ms	16ms	64ms	256ms	1s	4s	16s	gt	max	tag
99.994	0.006	nonzero	0.000	0.000	0.000	0.000	0.000	0.000	0.000	0.002	ma101107_rel.cz11a_c8r32
99.994	0.006	nonzero	0.000	0.000	0.000	0.000	0.000	0.000	0.000	0.002	ma110401_rel.cz11b_c8r32
99.935	0.065	nonzero	0.000	0.000	0.000	0.000	0.000	0.000	0.000	0.001	my8036_rel.cz11a_c8r32
Insert response time histogram
256us	1ms	4ms	16ms	64ms	256ms	1s	4s	16s	gt	max	tag
0.000	0.472	52.944	46.583	0.000	0.000	0.000	0.000	0.000	0.000	0.011	ma101107_rel.cz11a_c8r32
0.000	0.944	52.472	46.583	0.000	0.000	0.000	0.000	0.000	0.000	0.011	ma110401_rel.cz11b_c8r32
0.000	0.000	99.194	0.778	0.028	0.000	0.000	0.000	0.000	0.000	0.024	my8036_rel.cz11a_c8r32
Delete response time histogram
256us	1ms	4ms	16ms	64ms	256ms	1s	4s	16s	gt	max	tag
0.000	4.083	49.361	46.556	0.000	0.000	0.000	0.000	0.000	0.000	0.011	ma101107_rel.cz11a_c8r32
0.000	3.861	49.556	46.583	0.000	0.000	0.000	0.000	0.000	0.000	0.011	ma110401_rel.cz11b_c8r32
0.000	17.917	81.361	0.667	0.056	0.000	0.000	0.000	0.000	0.000	0.023	my8036_rel.cz11a_c8r32
qp100.L2
- qp100.L2: point queries with 100 insert/s per client
- Legend for results is here.
- Each entry lists the percentage of responses that fit in that bucket (slower than max time for previous bucket, faster than min time for next bucket).
Query response time histogram
256us	1ms	4ms	16ms	64ms	256ms	1s	4s	16s	gt	max	tag
99.981	0.018	nonzero	0.000	0.000	0.000	0.000	0.000	0.000	0.000	0.002	ma101107_rel.cz11a_c8r32
99.983	0.017	nonzero	0.000	0.000	0.000	0.000	0.000	0.000	0.000	0.002	ma110401_rel.cz11b_c8r32
99.618	0.381	nonzero	0.000	0.000	0.000	0.000	0.000	0.000	0.000	0.002	my8036_rel.cz11a_c8r32
Insert response time histogram
256us	1ms	4ms	16ms	64ms	256ms	1s	4s	16s	gt	max	tag
0.000	0.000	53.083	46.917	0.000	0.000	0.000	0.000	0.000	0.000	0.011	ma101107_rel.cz11a_c8r32
0.000	0.083	53.389	46.528	0.000	0.000	0.000	0.000	0.000	0.000	0.014	ma110401_rel.cz11b_c8r32
0.000	0.000	99.583	0.417	0.000	0.000	0.000	0.000	0.000	0.000	0.012	my8036_rel.cz11a_c8r32
Delete response time histogram
256us	1ms	4ms	16ms	64ms	256ms	1s	4s	16s	gt	max	tag
0.000	2.389	50.694	46.917	0.000	0.000	0.000	0.000	0.000	0.000	0.011	ma101107_rel.cz11a_c8r32
0.000	2.639	50.833	46.528	0.000	0.000	0.000	0.000	0.000	0.000	0.014	ma110401_rel.cz11b_c8r32
0.000	0.083	99.500	0.417	0.000	0.000	0.000	0.000	0.000	0.000	0.012	my8036_rel.cz11a_c8r32
qr500.L3
- qr500.L3: range queries with 500 insert/s per client
- Legend for results is here.
- Each entry lists the percentage of responses that fit in that bucket (slower than max time for previous bucket, faster than min time for next bucket).
Query response time histogram
256us	1ms	4ms	16ms	64ms	256ms	1s	4s	16s	gt	max	tag
99.984	0.016	nonzero	nonzero	0.000	0.000	0.000	0.000	0.000	0.000	0.004	ma101107_rel.cz11a_c8r32
99.987	0.013	nonzero	nonzero	0.000	0.000	0.000	0.000	0.000	0.000	0.009	ma110401_rel.cz11b_c8r32
99.916	0.084	nonzero	0.000	0.000	0.000	0.000	0.000	0.000	0.000	0.002	my8036_rel.cz11a_c8r32
Insert response time histogram
256us	1ms	4ms	16ms	64ms	256ms	1s	4s	16s	gt	max	tag
0.000	11.956	78.694	9.350	0.000	0.000	0.000	0.000	0.000	0.000	0.011	ma101107_rel.cz11a_c8r32
0.000	23.078	67.650	9.272	0.000	0.000	0.000	0.000	0.000	0.000	0.011	ma110401_rel.cz11b_c8r32
0.000	0.000	99.817	0.183	0.000	0.000	0.000	0.000	0.000	0.000	0.015	my8036_rel.cz11a_c8r32
Delete response time histogram
256us	1ms	4ms	16ms	64ms	256ms	1s	4s	16s	gt	max	tag
0.000	78.511	12.139	9.350	0.000	0.000	0.000	0.000	0.000	0.000	0.011	ma101107_rel.cz11a_c8r32
0.000	78.950	11.783	9.267	0.000	0.000	0.000	0.000	0.000	0.000	0.011	ma110401_rel.cz11b_c8r32
0.000	37.844	62.033	0.122	0.000	0.000	0.000	0.000	0.000	0.000	0.014	my8036_rel.cz11a_c8r32
qp500.L4
- qp500.L4: point queries with 500 insert/s per client
- Legend for results is here.
- Each entry lists the percentage of responses that fit in that bucket (slower than max time for previous bucket, faster than min time for next bucket).
Query response time histogram
256us	1ms	4ms	16ms	64ms	256ms	1s	4s	16s	gt	max	tag
99.968	0.032	nonzero	nonzero	0.000	0.000	0.000	0.000	0.000	0.000	0.004	ma101107_rel.cz11a_c8r32
99.965	0.035	nonzero	nonzero	0.000	0.000	0.000	0.000	0.000	0.000	0.004	ma110401_rel.cz11b_c8r32
99.535	0.465	nonzero	0.000	0.000	0.000	0.000	0.000	0.000	0.000	0.002	my8036_rel.cz11a_c8r32
Insert response time histogram
256us	1ms	4ms	16ms	64ms	256ms	1s	4s	16s	gt	max	tag
0.000	5.106	85.617	9.278	0.000	0.000	0.000	0.000	0.000	0.000	0.011	ma101107_rel.cz11a_c8r32
0.000	13.200	77.544	9.256	0.000	0.000	0.000	0.000	0.000	0.000	0.011	ma110401_rel.cz11b_c8r32
0.000	0.000	99.911	0.089	0.000	0.000	0.000	0.000	0.000	0.000	0.014	my8036_rel.cz11a_c8r32
Delete response time histogram
256us	1ms	4ms	16ms	64ms	256ms	1s	4s	16s	gt	max	tag
0.000	74.383	16.339	9.278	0.000	0.000	0.000	0.000	0.000	0.000	0.011	ma101107_rel.cz11a_c8r32
0.000	76.511	14.239	9.250	0.000	0.000	0.000	0.000	0.000	0.000	0.011	ma110401_rel.cz11b_c8r32
0.000	12.261	87.672	0.067	0.000	0.000	0.000	0.000	0.000	0.000	0.013	my8036_rel.cz11a_c8r32
qr1000.L5
- qr1000.L5: range queries with 1000 insert/s per client
- Legend for results is here.
- Each entry lists the percentage of responses that fit in that bucket (slower than max time for previous bucket, faster than min time for next bucket).
Query response time histogram
256us	1ms	4ms	16ms	64ms	256ms	1s	4s	16s	gt	max	tag
99.978	0.021	0.001	nonzero	0.000	0.000	0.000	0.000	0.000	0.000	0.008	ma101107_rel.cz11a_c8r32
99.981	0.018	nonzero	nonzero	0.000	0.000	0.000	0.000	0.000	0.000	0.015	ma110401_rel.cz11b_c8r32
99.900	0.100	nonzero	0.000	0.000	0.000	0.000	0.000	0.000	0.000	0.002	my8036_rel.cz11a_c8r32
Insert response time histogram
256us	1ms	4ms	16ms	64ms	256ms	1s	4s	16s	gt	max	tag
0.000	20.794	74.481	4.722	0.003	0.000	0.000	0.000	0.000	0.000	0.042	ma101107_rel.cz11a_c8r32
0.000	31.753	63.400	4.836	0.011	0.000	0.000	0.000	0.000	0.000	0.040	ma110401_rel.cz11b_c8r32
0.000	0.000	99.756	0.242	0.003	0.000	0.000	0.000	0.000	0.000	0.022	my8036_rel.cz11a_c8r32
Delete response time histogram
256us	1ms	4ms	16ms	64ms	256ms	1s	4s	16s	gt	max	tag
0.000	86.119	9.175	4.703	0.003	0.000	0.000	0.000	0.000	0.000	0.042	ma101107_rel.cz11a_c8r32
0.000	86.300	8.939	4.753	0.008	0.000	0.000	0.000	0.000	0.000	0.040	ma110401_rel.cz11b_c8r32
0.000	42.083	57.731	0.183	0.003	0.000	0.000	0.000	0.000	0.000	0.020	my8036_rel.cz11a_c8r32
qp1000.L6
- qp1000.L6: point queries with 1000 insert/s per client
- Legend for results is here.
- Each entry lists the percentage of responses that fit in that bucket (slower than max time for previous bucket, faster than min time for next bucket).
Query response time histogram
256us	1ms	4ms	16ms	64ms	256ms	1s	4s	16s	gt	max	tag
99.954	0.046	nonzero	nonzero	0.000	0.000	0.000	0.000	0.000	0.000	0.006	ma101107_rel.cz11a_c8r32
99.957	0.043	nonzero	0.000	0.000	0.000	0.000	0.000	0.000	0.000	0.003	ma110401_rel.cz11b_c8r32
99.454	0.546	nonzero	0.000	0.000	0.000	0.000	0.000	0.000	0.000	0.002	my8036_rel.cz11a_c8r32
Insert response time histogram
256us	1ms	4ms	16ms	64ms	256ms	1s	4s	16s	gt	max	tag
0.000	10.458	84.881	4.658	0.003	0.000	0.000	0.000	0.000	0.000	0.026	ma101107_rel.cz11a_c8r32
0.000	17.042	78.308	4.647	0.003	0.000	0.000	0.000	0.000	0.000	0.031	ma110401_rel.cz11b_c8r32
0.000	0.000	99.681	0.317	0.003	0.000	0.000	0.000	0.000	0.000	0.024	my8036_rel.cz11a_c8r32
Delete response time histogram
256us	1ms	4ms	16ms	64ms	256ms	1s	4s	16s	gt	max	tag
0.000	82.714	12.631	4.653	0.003	0.000	0.000	0.000	0.000	0.000	0.026	ma101107_rel.cz11a_c8r32
0.000	82.625	12.744	4.628	0.003	0.000	0.000	0.000	0.000	0.000	0.031	ma110401_rel.cz11b_c8r32
0.000	24.089	75.667	0.242	0.003	0.000	0.000	0.000	0.000	0.000	0.023	my8036_rel.cz11a_c8r32