Introduction
This is a report for the insert benchmark with 50M docs and 1 client(s). It is generated by scripts (bash, awk, sed) and Tufte might not be impressed. An overview of the insert benchmark is here and a short update is here. Below, by DBMS, I mean DBMS+version.config. An example is my8020.c10b40 where my means MySQL, 8020 is version 8.0.20 and c10b40 is the name for the configuration file.
The test server has 8 AMD cores, 32G RAM and an NVMe SSD. It is described here as the ASUS PN53. The benchmark was run with 1 client and there were 1 or 3 connections per client (1 for queries or inserts without rate limits, 1+1 for rate limited inserts+deletes). It uses 1 table. It loads 50M rows per table without secondary indexes, creates 3 secondary indexes per table, then inserts 40m+10m rows per table with a delete per insert to avoid growing the table. It then does 6 read+write tests for 1800s each that do queries as fast as possible with 100,100,500,500,1000,1000 inserts/s and the same for deletes/s per client concurrent with the queries. The database is cached in memory. Clients and the DBMS share one server. The per-database configs are in the per-database subdirectories here.
The tested DBMS are:
- ma100244_rel.cz11a_c8r32 - MariaDB 10.2.44 with the cz11a_c8r32 config that uses innodb_purge_threads=4
- ma100339_rel.cz11a_c8r32 - MariaDB 10.3.39 with the cz11a_c8r32 config that uses innodb_purge_threads=4
- ma100433_rel.cz11a_c8r32 - MariaDB 10.4.33 with the cz11a_c8r32 config that uses innodb_purge_threads=4
- ma100524_rel.cz11a_c8r32 - MariaDB 10.5.24 with the cz11a_c8r32 config that uses innodb_purge_threads=4
- ma100617_rel.cz11a_c8r32 - MariaDB 10.6.17 with the cz11a_c8r32 config that uses innodb_purge_threads=4
- ma101107_rel.cz11a_c8r32 - MariaDB 10.11.7 with the cz11a_c8r32 config that uses innodb_purge_threads=4
- ma110401_rel.cz11b_c8r32 - MariaDB 11.4.1 with the cz11a_c8r32 config that uses innodb_purge_threads=4
Contents
- Summary
- l.i0: load without secondary indexes
- l.x: create secondary indexes
- l.i1: continue load after secondary indexes created with 50 inserts per transaction
- l.i2: continue load after secondary indexes created with 5 inserts per transaction
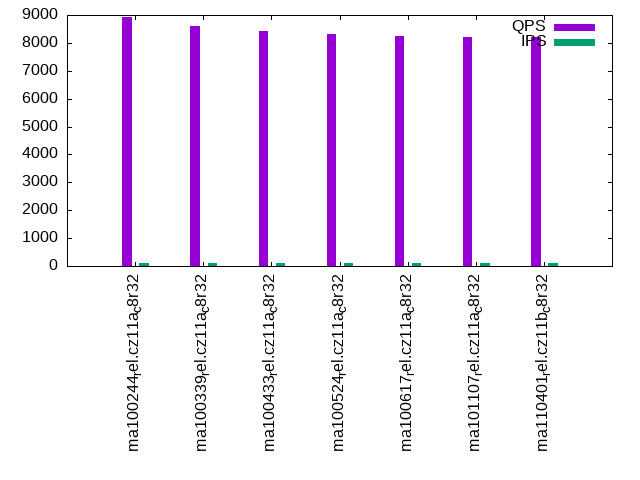
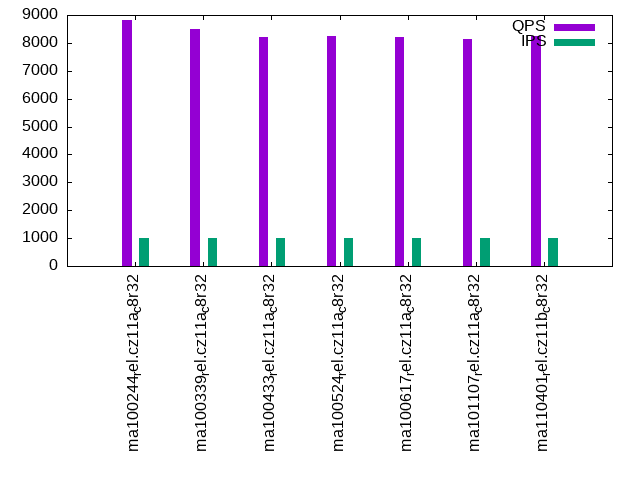
- qr100.L1: range queries with 100 insert/s per client
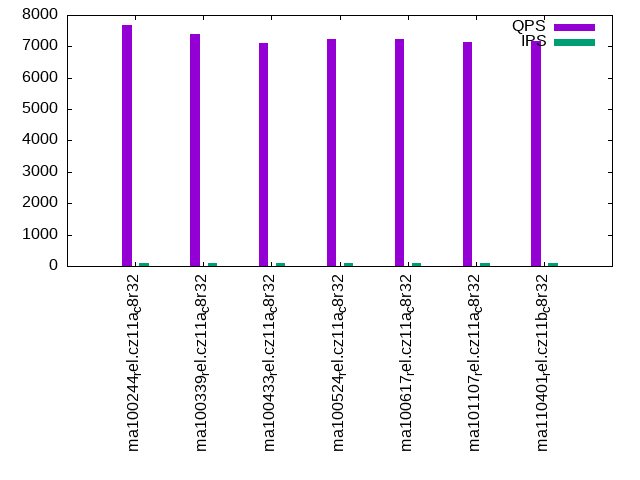
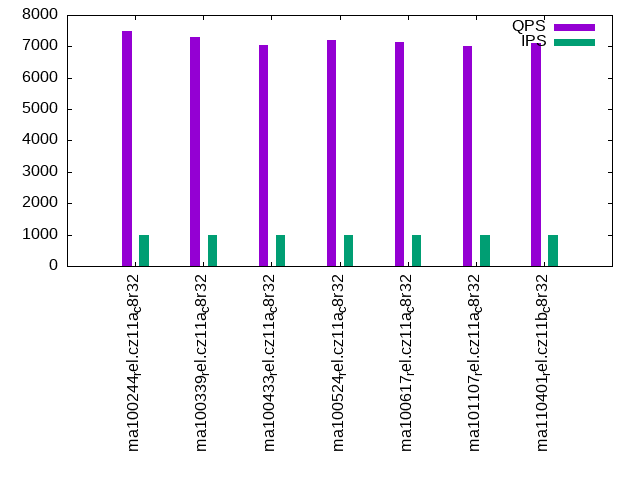
- qp100.L2: point queries with 100 insert/s per client
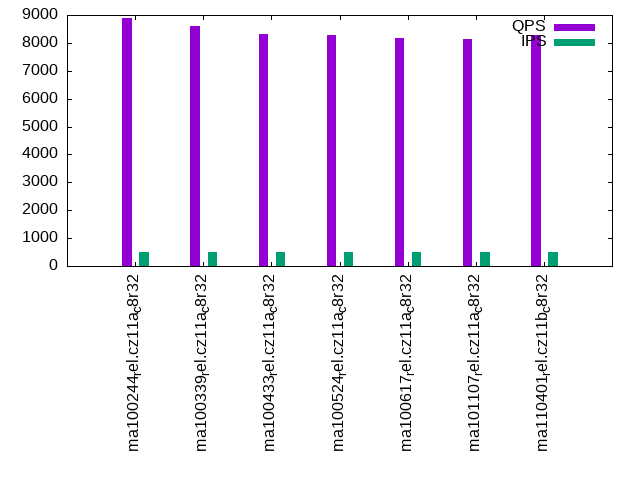
- qr500.L3: range queries with 500 insert/s per client
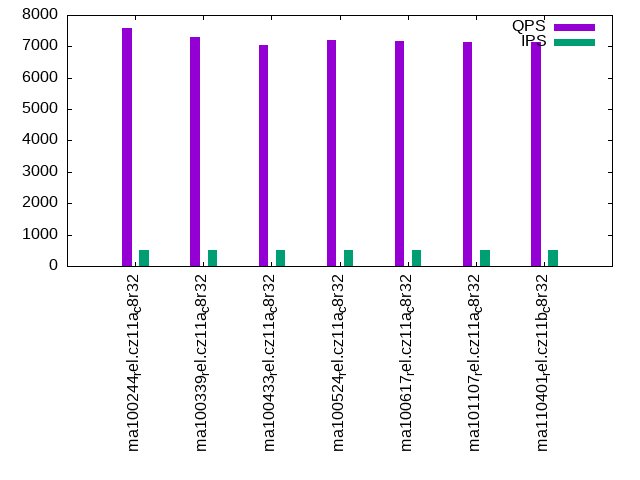
- qp500.L4: point queries with 500 insert/s per client
- qr1000.L5: range queries with 1000 insert/s per client
- qp1000.L6: point queries with 1000 insert/s per client
Summary
The numbers are inserts/s for l.i0, l.i1 and l.i2, indexed docs (or rows) /s for l.x and queries/s for qr100, qp100 thru qr1000, qp1000" The values are the average rate over the entire test for inserts (IPS) and queries (QPS). The range of values for IPS and QPS is split into 3 parts: bottom 25%, middle 50%, top 25%. Values in the bottom 25% have a red background, values in the top 25% have a green background and values in the middle have no color. A gray background is used for values that can be ignored because the DBMS did not sustain the target insert rate. Red backgrounds are not used when the minimum value is within 80% of the max value.
| dbms | l.i0 | l.x | l.i1 | l.i2 | qr100 | qp100 | qr500 | qp500 | qr1000 | qp1000 |
|---|---|---|---|---|---|---|---|---|---|---|
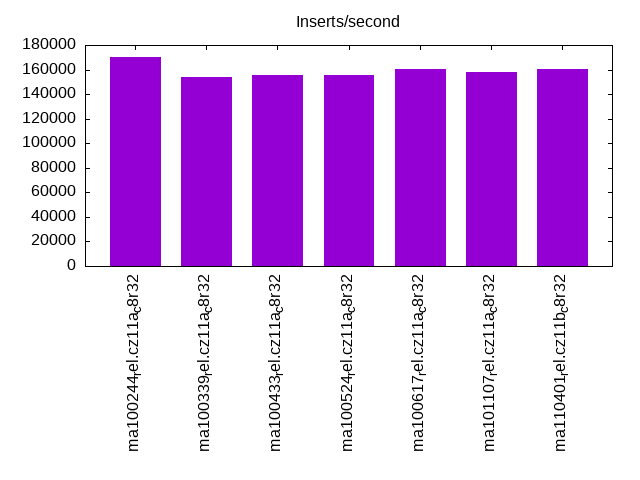
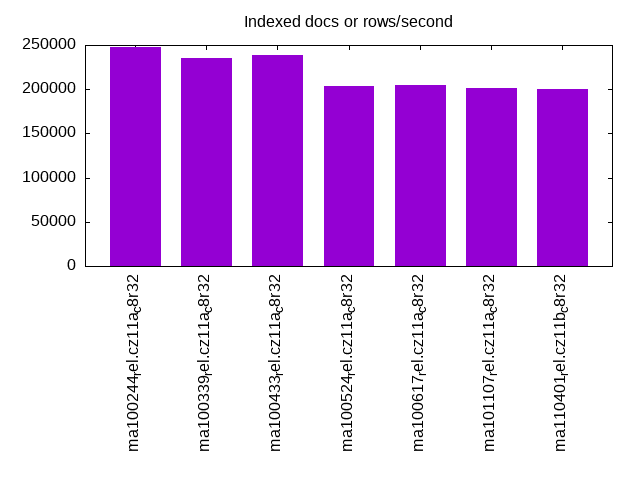
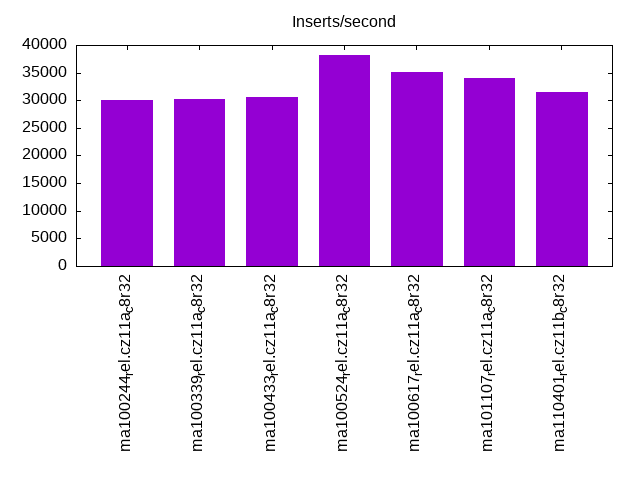
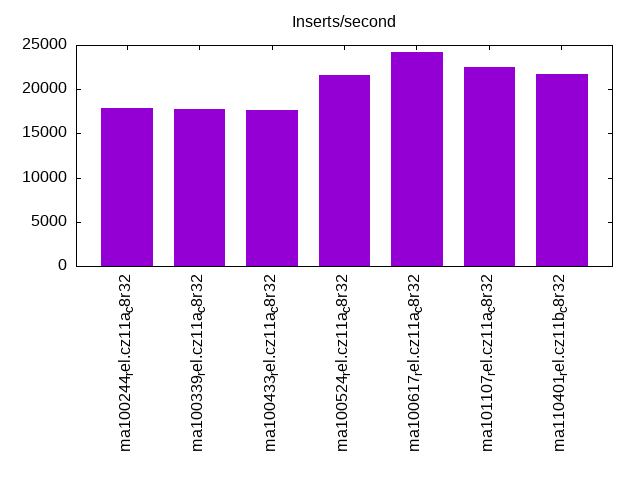
| ma100244_rel.cz11a_c8r32 | 170068 | 247525 | 30052 | 17857 | 8939 | 7689 | 8886 | 7600 | 8816 | 7495 |
| ma100339_rel.cz11a_c8r32 | 154321 | 235850 | 30257 | 17730 | 8619 | 7382 | 8604 | 7309 | 8508 | 7286 |
| ma100433_rel.cz11a_c8r32 | 155763 | 239235 | 30558 | 17606 | 8412 | 7109 | 8319 | 7034 | 8216 | 7038 |
| ma100524_rel.cz11a_c8r32 | 155763 | 203252 | 38204 | 21552 | 8304 | 7234 | 8283 | 7193 | 8234 | 7204 |
| ma100617_rel.cz11a_c8r32 | 160772 | 204918 | 35180 | 24154 | 8251 | 7244 | 8187 | 7176 | 8210 | 7134 |
| ma101107_rel.cz11a_c8r32 | 157729 | 201613 | 34100 | 22522 | 8210 | 7125 | 8126 | 7128 | 8156 | 7027 |
| ma110401_rel.cz11b_c8r32 | 160772 | 200000 | 31521 | 21739 | 8213 | 7173 | 8276 | 7141 | 8238 | 7110 |
This table has relative throughput, throughput for the DBMS relative to the DBMS in the first line, using the absolute throughput from the previous table. Values less than 0.95 have a yellow background. Values greater than 1.05 have a blue background.
| dbms | l.i0 | l.x | l.i1 | l.i2 | qr100 | qp100 | qr500 | qp500 | qr1000 | qp1000 |
|---|---|---|---|---|---|---|---|---|---|---|
| ma100244_rel.cz11a_c8r32 | 1.00 | 1.00 | 1.00 | 1.00 | 1.00 | 1.00 | 1.00 | 1.00 | 1.00 | 1.00 |
| ma100339_rel.cz11a_c8r32 | 0.91 | 0.95 | 1.01 | 0.99 | 0.96 | 0.96 | 0.97 | 0.96 | 0.97 | 0.97 |
| ma100433_rel.cz11a_c8r32 | 0.92 | 0.97 | 1.02 | 0.99 | 0.94 | 0.92 | 0.94 | 0.93 | 0.93 | 0.94 |
| ma100524_rel.cz11a_c8r32 | 0.92 | 0.82 | 1.27 | 1.21 | 0.93 | 0.94 | 0.93 | 0.95 | 0.93 | 0.96 |
| ma100617_rel.cz11a_c8r32 | 0.95 | 0.83 | 1.17 | 1.35 | 0.92 | 0.94 | 0.92 | 0.94 | 0.93 | 0.95 |
| ma101107_rel.cz11a_c8r32 | 0.93 | 0.81 | 1.13 | 1.26 | 0.92 | 0.93 | 0.91 | 0.94 | 0.93 | 0.94 |
| ma110401_rel.cz11b_c8r32 | 0.95 | 0.81 | 1.05 | 1.22 | 0.92 | 0.93 | 0.93 | 0.94 | 0.93 | 0.95 |
This lists the average rate of inserts/s for the tests that do inserts concurrent with queries. For such tests the query rate is listed in the table above. The read+write tests are setup so that the insert rate should match the target rate every second. Cells that are not at least 95% of the target have a red background to indicate a failure to satisfy the target.
| dbms | qr100.L1 | qp100.L2 | qr500.L3 | qp500.L4 | qr1000.L5 | qp1000.L6 |
|---|---|---|---|---|---|---|
| ma100244_rel.cz11a_c8r32 | 100 | 100 | 499 | 499 | 999 | 999 |
| ma100339_rel.cz11a_c8r32 | 100 | 100 | 499 | 499 | 999 | 999 |
| ma100433_rel.cz11a_c8r32 | 100 | 100 | 499 | 499 | 999 | 999 |
| ma100524_rel.cz11a_c8r32 | 100 | 100 | 499 | 500 | 999 | 999 |
| ma100617_rel.cz11a_c8r32 | 100 | 100 | 499 | 499 | 999 | 999 |
| ma101107_rel.cz11a_c8r32 | 100 | 100 | 499 | 499 | 999 | 999 |
| ma110401_rel.cz11b_c8r32 | 100 | 100 | 499 | 499 | 999 | 999 |
| target | 100 | 100 | 500 | 500 | 1000 | 1000 |
l.i0
l.i0: load without secondary indexes. Graphs for performance per 1-second interval are here.
Average throughput:
Insert response time histogram: each cell has the percentage of responses that take <= the time in the header and max is the max response time in seconds. For the max column values in the top 25% of the range have a red background and in the bottom 25% of the range have a green background. The red background is not used when the min value is within 80% of the max value.
| dbms | 256us | 1ms | 4ms | 16ms | 64ms | 256ms | 1s | 4s | 16s | gt | max |
|---|---|---|---|---|---|---|---|---|---|---|---|
| ma100244_rel.cz11a_c8r32 | 99.457 | 0.214 | 0.284 | 0.040 | 0.004 | 0.129 | |||||
| ma100339_rel.cz11a_c8r32 | 99.338 | 0.293 | 0.341 | 0.024 | 0.004 | 0.133 | |||||
| ma100433_rel.cz11a_c8r32 | 99.364 | 0.268 | 0.356 | 0.007 | 0.004 | 0.136 | |||||
| ma100524_rel.cz11a_c8r32 | 99.276 | 0.263 | 0.396 | 0.061 | 0.004 | 0.128 | |||||
| ma100617_rel.cz11a_c8r32 | 99.511 | 0.238 | 0.234 | 0.012 | 0.004 | 0.163 | |||||
| ma101107_rel.cz11a_c8r32 | 99.499 | 0.253 | 0.231 | 0.013 | 0.005 | 0.169 | |||||
| ma110401_rel.cz11b_c8r32 | 99.516 | 0.239 | 0.228 | 0.013 | 0.005 | 0.179 |
Performance metrics for the DBMS listed above. Some are normalized by throughput, others are not. Legend for results is here.
ips	qps	rps	rmbps	wps	wmbps	rpq	rkbpq	wpi	wkbpi	csps	cpups	cspq	cpupq	dbgb1	dbgb2	rss	maxop	p50	p99	tag
170068	0	0	0.0	1204.9	63.8	0.000	0.000	0.007	0.384	19250	21.7	0.113	10	3.3	34.1	4.1	0.129	171909	142746	ma100244_rel.cz11a_c8r32
154321	0	0	0.0	1188.0	63.3	0.000	0.000	0.008	0.420	51212	28.8	0.332	15	3.3	34.1	4.1	0.133	156229	129161	ma100339_rel.cz11a_c8r32
155763	0	0	0.0	1182.4	63.1	0.000	0.000	0.008	0.415	52026	28.9	0.334	15	3.3	34.1	NA	0.136	157732	134057	ma100433_rel.cz11a_c8r32
155763	0	0	0.0	1286.9	51.3	0.000	0.000	0.008	0.337	68431	25.6	0.439	13	3.3	34.1	3.9	0.128	157777	136154	ma100524_rel.cz11a_c8r32
160772	0	0	0.0	613.9	39.3	0.000	0.000	0.004	0.250	20365	23.7	0.127	12	3.3	34.1	3.7	0.163	162722	140448	ma100617_rel.cz11a_c8r32
157729	0	0	0.0	642.6	40.3	0.000	0.000	0.004	0.262	19905	23.2	0.126	12	3.3	34.1	3.7	0.169	159478	137349	ma101107_rel.cz11a_c8r32
160772	0	0	0.0	661.3	41.1	0.000	0.000	0.004	0.262	21003	23.8	0.131	12	3.3	34.1	3.7	0.179	162421	140149	ma110401_rel.cz11b_c8r32
l.x
l.x: create secondary indexes.
Average throughput:
Performance metrics for the DBMS listed above. Some are normalized by throughput, others are not. Legend for results is here.
ips	qps	rps	rmbps	wps	wmbps	rpq	rkbpq	wpi	wkbpi	csps	cpups	cspq	cpupq	dbgb1	dbgb2	rss	maxop	p50	p99	tag
247525	0	0	0.0	2504.7	223.5	0.000	0.000	0.010	0.925	10873	12.6	0.044	4	7.6	38.4	6.9	0.001	NA	NA	ma100244_rel.cz11a_c8r32
235850	0	0	0.0	2393.0	213.5	0.000	0.000	0.010	0.927	10485	12.3	0.044	4	7.6	38.4	8.0	0.001	NA	NA	ma100339_rel.cz11a_c8r32
239235	0	0	0.0	2436.7	217.3	0.000	0.000	0.010	0.930	10331	12.5	0.043	4	7.5	38.3	NA	0.001	NA	NA	ma100433_rel.cz11a_c8r32
203252	0	0	0.0	1320.6	163.7	0.000	0.000	0.006	0.825	431	11.8	0.002	5	7.5	38.3	7.4	0.001	NA	NA	ma100524_rel.cz11a_c8r32
204918	0	0	0.0	2445.3	183.0	0.000	0.000	0.012	0.915	5602	12.2	0.027	5	7.5	38.3	7.3	0.001	NA	NA	ma100617_rel.cz11a_c8r32
201613	0	0	0.0	2332.0	178.0	0.000	0.000	0.012	0.904	5208	12.1	0.026	5	7.5	38.3	6.9	0.001	NA	NA	ma101107_rel.cz11a_c8r32
200000	0	0	0.0	2288.2	175.7	0.000	0.000	0.011	0.899	5101	12.1	0.026	5	7.5	38.3	6.7	0.001	NA	NA	ma110401_rel.cz11b_c8r32
l.i1
l.i1: continue load after secondary indexes created with 50 inserts per transaction. Graphs for performance per 1-second interval are here.
Average throughput:
Insert response time histogram: each cell has the percentage of responses that take <= the time in the header and max is the max response time in seconds. For the max column values in the top 25% of the range have a red background and in the bottom 25% of the range have a green background. The red background is not used when the min value is within 80% of the max value.
| dbms | 256us | 1ms | 4ms | 16ms | 64ms | 256ms | 1s | 4s | 16s | gt | max |
|---|---|---|---|---|---|---|---|---|---|---|---|
| ma100244_rel.cz11a_c8r32 | 4.459 | 90.344 | 5.167 | 0.028 | 0.002 | 0.073 | |||||
| ma100339_rel.cz11a_c8r32 | 2.347 | 91.664 | 5.962 | 0.027 | 0.001 | 0.074 | |||||
| ma100433_rel.cz11a_c8r32 | 1.449 | 92.920 | 5.603 | 0.028 | 0.001 | 0.153 | |||||
| ma100524_rel.cz11a_c8r32 | 5.800 | 93.003 | 1.138 | 0.055 | 0.001 | 0.003 | 0.390 | ||||
| ma100617_rel.cz11a_c8r32 | 6.307 | 92.539 | 1.102 | 0.051 | 0.001 | nonzero | 0.313 | ||||
| ma101107_rel.cz11a_c8r32 | 2.443 | 96.356 | 1.163 | 0.036 | 0.001 | nonzero | 0.412 | ||||
| ma110401_rel.cz11b_c8r32 | 5.181 | 92.208 | 2.312 | 0.297 | 0.003 | 0.215 |
Delete response time histogram: each cell has the percentage of responses that take <= the time in the header and max is the max response time in seconds. For the max column values in the top 25% of the range have a red background and in the bottom 25% of the range have a green background. The red background is not used when the min value is within 80% of the max value.
| dbms | 256us | 1ms | 4ms | 16ms | 64ms | 256ms | 1s | 4s | 16s | gt | max |
|---|---|---|---|---|---|---|---|---|---|---|---|
| ma100244_rel.cz11a_c8r32 | 61.624 | 33.965 | 4.399 | 0.010 | 0.001 | 0.073 | |||||
| ma100339_rel.cz11a_c8r32 | 77.893 | 17.161 | 4.938 | 0.008 | nonzero | 0.072 | |||||
| ma100433_rel.cz11a_c8r32 | 77.762 | 17.601 | 4.627 | 0.010 | nonzero | 0.068 | |||||
| ma100524_rel.cz11a_c8r32 | 94.793 | 4.504 | 0.675 | 0.023 | 0.001 | 0.002 | 0.389 | ||||
| ma100617_rel.cz11a_c8r32 | 59.198 | 39.974 | 0.792 | 0.036 | 0.001 | 0.096 | |||||
| ma101107_rel.cz11a_c8r32 | 48.607 | 50.515 | 0.852 | 0.026 | 0.001 | 0.119 | |||||
| ma110401_rel.cz11b_c8r32 | 54.102 | 43.651 | 2.004 | 0.241 | 0.003 | 0.213 |
Performance metrics for the DBMS listed above. Some are normalized by throughput, others are not. Legend for results is here.
ips	qps	rps	rmbps	wps	wmbps	rpq	rkbpq	wpi	wkbpi	csps	cpups	cspq	cpupq	dbgb1	dbgb2	rss	maxop	p50	p99	tag
30052	0	0	0.0	10766.7	339.2	0.000	0.000	0.358	11.558	57360	45.8	1.909	122	10.0	40.9	11.1	0.073	30679	10389	ma100244_rel.cz11a_c8r32
30257	0	0	0.0	12433.8	386.2	0.000	0.000	0.411	13.071	70780	43.8	2.339	116	10.1	40.9	11.1	0.074	30767	9640	ma100339_rel.cz11a_c8r32
30558	0	0	0.0	11873.2	370.9	0.000	0.000	0.389	12.430	69762	43.7	2.283	114	10.1	40.9	NA	0.153	31217	8990	ma100433_rel.cz11a_c8r32
38204	0	0	0.0	9187.8	289.4	0.000	0.000	0.240	7.758	67976	36.6	1.779	77	10.8	42.7	11.1	0.390	40856	7745	ma100524_rel.cz11a_c8r32
35180	0	0	0.0	5442.5	184.0	0.000	0.000	0.155	5.355	91184	30.8	2.592	70	10.1	40.9	10.0	0.313	37720	11243	ma100617_rel.cz11a_c8r32
34100	0	874	3.4	5322.9	179.9	0.026	0.103	0.156	5.401	88296	29.8	2.589	70	10.1	40.9	10.0	0.412	36361	11742	ma101107_rel.cz11a_c8r32
31521	0	840	3.3	4950.3	165.6	0.027	0.107	0.157	5.379	80042	27.3	2.539	69	10.1	40.9	10.0	0.215	31616	12986	ma110401_rel.cz11b_c8r32
l.i2
l.i2: continue load after secondary indexes created with 5 inserts per transaction. Graphs for performance per 1-second interval are here.
Average throughput:
Insert response time histogram: each cell has the percentage of responses that take <= the time in the header and max is the max response time in seconds. For the max column values in the top 25% of the range have a red background and in the bottom 25% of the range have a green background. The red background is not used when the min value is within 80% of the max value.
| dbms | 256us | 1ms | 4ms | 16ms | 64ms | 256ms | 1s | 4s | 16s | gt | max |
|---|---|---|---|---|---|---|---|---|---|---|---|
| ma100244_rel.cz11a_c8r32 | 88.654 | 10.341 | 0.142 | 0.861 | 0.002 | nonzero | 0.074 | ||||
| ma100339_rel.cz11a_c8r32 | 87.125 | 11.865 | 0.147 | 0.862 | 0.001 | nonzero | 0.073 | ||||
| ma100433_rel.cz11a_c8r32 | 86.412 | 12.584 | 0.147 | 0.856 | 0.001 | nonzero | 0.070 | ||||
| ma100524_rel.cz11a_c8r32 | 92.552 | 7.274 | 0.144 | 0.029 | 0.002 | nonzero | 0.064 | ||||
| ma100617_rel.cz11a_c8r32 | 95.162 | 4.776 | 0.049 | 0.013 | 0.001 | 0.060 | |||||
| ma101107_rel.cz11a_c8r32 | 88.712 | 11.211 | 0.065 | 0.012 | nonzero | 0.059 | |||||
| ma110401_rel.cz11b_c8r32 | 90.142 | 9.685 | 0.058 | 0.112 | 0.003 | nonzero | 0.068 |
Delete response time histogram: each cell has the percentage of responses that take <= the time in the header and max is the max response time in seconds. For the max column values in the top 25% of the range have a red background and in the bottom 25% of the range have a green background. The red background is not used when the min value is within 80% of the max value.
| dbms | 256us | 1ms | 4ms | 16ms | 64ms | 256ms | 1s | 4s | 16s | gt | max |
|---|---|---|---|---|---|---|---|---|---|---|---|
| ma100244_rel.cz11a_c8r32 | 91.943 | 7.066 | 0.137 | 0.853 | 0.001 | nonzero | 0.074 | ||||
| ma100339_rel.cz11a_c8r32 | 91.847 | 7.150 | 0.148 | 0.855 | 0.001 | nonzero | 0.073 | ||||
| ma100433_rel.cz11a_c8r32 | 91.751 | 7.248 | 0.149 | 0.851 | 0.001 | nonzero | 0.071 | ||||
| ma100524_rel.cz11a_c8r32 | 95.773 | 4.075 | 0.127 | 0.023 | 0.001 | nonzero | 0.064 | ||||
| ma100617_rel.cz11a_c8r32 | 97.759 | 2.186 | 0.043 | 0.011 | 0.001 | 0.060 | |||||
| ma101107_rel.cz11a_c8r32 | 95.313 | 4.616 | 0.059 | 0.011 | nonzero | 0.059 | |||||
| ma110401_rel.cz11b_c8r32 | 94.122 | 5.724 | 0.051 | 0.100 | 0.003 | nonzero | 0.068 |
Performance metrics for the DBMS listed above. Some are normalized by throughput, others are not. Legend for results is here.
ips	qps	rps	rmbps	wps	wmbps	rpq	rkbpq	wpi	wkbpi	csps	cpups	cspq	cpupq	dbgb1	dbgb2	rss	maxop	p50	p99	tag
17857	0	0	0.0	14055.9	408.5	0.000	0.000	0.787	23.423	199484	44.4	11.171	199	10.3	41.1	11.4	0.074	17796	15319	ma100244_rel.cz11a_c8r32
17730	0	0	0.0	14479.1	420.8	0.000	0.000	0.817	24.301	237744	45.3	13.409	204	10.3	41.1	11.3	0.073	17556	15334	ma100339_rel.cz11a_c8r32
17606	0	0	0.0	14451.4	419.1	0.000	0.000	0.821	24.377	240681	45.2	13.671	205	10.3	41.1	NA	0.070	17526	14919	ma100433_rel.cz11a_c8r32
21552	0	0	0.0	10936.6	317.9	0.000	0.000	0.507	15.106	337340	46.4	15.653	172	11.0	43.0	11.1	0.064	21602	20298	ma100524_rel.cz11a_c8r32
24154	0	0	0.0	2699.5	93.5	0.000	0.000	0.112	3.965	117801	34.6	4.877	115	10.3	41.2	10.2	0.060	24233	23035	ma100617_rel.cz11a_c8r32
22522	0	3192	12.5	2614.7	90.7	0.142	0.567	0.116	4.124	114543	33.2	5.086	118	10.3	41.2	10.2	0.059	22488	21487	ma101107_rel.cz11a_c8r32
21739	0	3080	12.0	2563.0	87.9	0.142	0.567	0.118	4.143	110890	32.0	5.101	118	10.3	41.1	10.2	0.068	22557	18266	ma110401_rel.cz11b_c8r32
qr100.L1
qr100.L1: range queries with 100 insert/s per client. Graphs for performance per 1-second interval are here.
Average throughput:
Query response time histogram: each cell has the percentage of responses that take <= the time in the header and max is the max response time in seconds. For max values in the top 25% of the range have a red background and in the bottom 25% of the range have a green background. The red background is not used when the min value is within 80% of the max value.
| dbms | 256us | 1ms | 4ms | 16ms | 64ms | 256ms | 1s | 4s | 16s | gt | max |
|---|---|---|---|---|---|---|---|---|---|---|---|
| ma100244_rel.cz11a_c8r32 | 99.946 | 0.054 | nonzero | nonzero | nonzero | 0.016 | |||||
| ma100339_rel.cz11a_c8r32 | 99.946 | 0.053 | nonzero | nonzero | nonzero | 0.021 | |||||
| ma100433_rel.cz11a_c8r32 | 99.951 | 0.049 | nonzero | nonzero | nonzero | 0.018 | |||||
| ma100524_rel.cz11a_c8r32 | 99.973 | 0.027 | nonzero | 0.001 | |||||||
| ma100617_rel.cz11a_c8r32 | 99.991 | 0.009 | nonzero | 0.002 | |||||||
| ma101107_rel.cz11a_c8r32 | 99.994 | 0.006 | nonzero | 0.002 | |||||||
| ma110401_rel.cz11b_c8r32 | 99.994 | 0.006 | nonzero | 0.002 |
Insert response time histogram: each cell has the percentage of responses that take <= the time in the header and max is the max response time in seconds. For max values in the top 25% of the range have a red background and in the bottom 25% of the range have a green background. The red background is not used when the min value is within 80% of the max value.
| dbms | 256us | 1ms | 4ms | 16ms | 64ms | 256ms | 1s | 4s | 16s | gt | max |
|---|---|---|---|---|---|---|---|---|---|---|---|
| ma100244_rel.cz11a_c8r32 | 97.056 | 2.361 | 0.583 | 0.038 | |||||||
| ma100339_rel.cz11a_c8r32 | 96.833 | 2.333 | 0.833 | 0.036 | |||||||
| ma100433_rel.cz11a_c8r32 | 97.194 | 2.250 | 0.556 | 0.036 | |||||||
| ma100524_rel.cz11a_c8r32 | 0.528 | 99.472 | 0.002 | ||||||||
| ma100617_rel.cz11a_c8r32 | 10.806 | 89.194 | 0.002 | ||||||||
| ma101107_rel.cz11a_c8r32 | 0.472 | 52.944 | 46.583 | 0.011 | |||||||
| ma110401_rel.cz11b_c8r32 | 0.944 | 52.472 | 46.583 | 0.011 |
Delete response time histogram: each cell has the percentage of responses that take <= the time in the header and max is the max response time in seconds. For max values in the top 25% of the range have a red background and in the bottom 25% of the range have a green background. The red background is not used when the min value is within 80% of the max value.
| dbms | 256us | 1ms | 4ms | 16ms | 64ms | 256ms | 1s | 4s | 16s | gt | max |
|---|---|---|---|---|---|---|---|---|---|---|---|
| ma100244_rel.cz11a_c8r32 | 7.167 | 90.333 | 2.056 | 0.444 | 0.031 | ||||||
| ma100339_rel.cz11a_c8r32 | 14.861 | 82.361 | 2.306 | 0.472 | 0.030 | ||||||
| ma100433_rel.cz11a_c8r32 | 18.778 | 78.667 | 2.278 | 0.278 | 0.024 | ||||||
| ma100524_rel.cz11a_c8r32 | 44.278 | 55.722 | 0.002 | ||||||||
| ma100617_rel.cz11a_c8r32 | 51.667 | 48.333 | 0.002 | ||||||||
| ma101107_rel.cz11a_c8r32 | 4.083 | 49.361 | 46.556 | 0.011 | |||||||
| ma110401_rel.cz11b_c8r32 | 3.861 | 49.556 | 46.583 | 0.011 |
Performance metrics for the DBMS listed above. Some are normalized by throughput, others are not. Legend for results is here.
ips	qps	rps	rmbps	wps	wmbps	rpq	rkbpq	wpi	wkbpi	csps	cpups	cspq	cpupq	dbgb1	dbgb2	rss	maxop	p50	p99	tag
100	8939	0	0.0	861.6	23.9	0.000	0.000	8.633	244.866	37842	12.9	4.233	115	10.3	41.1	11.4	0.016	8938	8838	ma100244_rel.cz11a_c8r32
100	8619	0	0.0	869.6	24.1	0.000	0.000	8.713	247.158	36703	12.9	4.258	120	10.3	41.1	11.3	0.021	8615	8503	ma100339_rel.cz11a_c8r32
100	8412	0	0.0	865.8	24.0	0.000	0.000	8.675	246.055	35998	12.9	4.279	123	10.3	41.1	NA	0.018	8410	8326	ma100433_rel.cz11a_c8r32
100	8304	0	0.0	2.5	0.1	0.000	0.000	0.025	1.213	33066	12.5	3.982	120	11.0	43.0	11.1	0.001	8311	8215	ma100524_rel.cz11a_c8r32
100	8251	0	0.0	2.4	0.1	0.000	0.000	0.024	1.187	31687	12.6	3.840	122	10.3	41.2	10.3	0.002	8250	8183	ma100617_rel.cz11a_c8r32
100	8210	4	0.0	2.3	0.1	0.000	0.002	0.024	1.192	31547	12.7	3.842	124	10.3	41.2	10.2	0.002	8215	8151	ma101107_rel.cz11a_c8r32
100	8213	4	0.0	2.4	0.1	0.000	0.002	0.024	1.203	31561	12.6	3.843	123	10.3	41.1	10.2	0.002	8215	8119	ma110401_rel.cz11b_c8r32
qp100.L2
qp100.L2: point queries with 100 insert/s per client. Graphs for performance per 1-second interval are here.
Average throughput:
Query response time histogram: each cell has the percentage of responses that take <= the time in the header and max is the max response time in seconds. For max values in the top 25% of the range have a red background and in the bottom 25% of the range have a green background. The red background is not used when the min value is within 80% of the max value.
| dbms | 256us | 1ms | 4ms | 16ms | 64ms | 256ms | 1s | 4s | 16s | gt | max |
|---|---|---|---|---|---|---|---|---|---|---|---|
| ma100244_rel.cz11a_c8r32 | 99.835 | 0.165 | nonzero | nonzero | 0.015 | ||||||
| ma100339_rel.cz11a_c8r32 | 99.849 | 0.150 | nonzero | nonzero | 0.016 | ||||||
| ma100433_rel.cz11a_c8r32 | 99.846 | 0.154 | nonzero | nonzero | 0.015 | ||||||
| ma100524_rel.cz11a_c8r32 | 99.964 | 0.036 | nonzero | 0.001 | |||||||
| ma100617_rel.cz11a_c8r32 | 99.973 | 0.027 | nonzero | 0.002 | |||||||
| ma101107_rel.cz11a_c8r32 | 99.981 | 0.018 | nonzero | 0.002 | |||||||
| ma110401_rel.cz11b_c8r32 | 99.983 | 0.017 | nonzero | 0.002 |
Insert response time histogram: each cell has the percentage of responses that take <= the time in the header and max is the max response time in seconds. For max values in the top 25% of the range have a red background and in the bottom 25% of the range have a green background. The red background is not used when the min value is within 80% of the max value.
| dbms | 256us | 1ms | 4ms | 16ms | 64ms | 256ms | 1s | 4s | 16s | gt | max |
|---|---|---|---|---|---|---|---|---|---|---|---|
| ma100244_rel.cz11a_c8r32 | 96.361 | 2.694 | 0.944 | 0.031 | |||||||
| ma100339_rel.cz11a_c8r32 | 96.722 | 2.528 | 0.750 | 0.042 | |||||||
| ma100433_rel.cz11a_c8r32 | 96.500 | 2.556 | 0.944 | 0.031 | |||||||
| ma100524_rel.cz11a_c8r32 | 100.000 | 0.002 | |||||||||
| ma100617_rel.cz11a_c8r32 | 0.444 | 99.528 | 0.028 | 0.011 | |||||||
| ma101107_rel.cz11a_c8r32 | 53.083 | 46.917 | 0.011 | ||||||||
| ma110401_rel.cz11b_c8r32 | 0.083 | 53.389 | 46.528 | 0.014 |
Delete response time histogram: each cell has the percentage of responses that take <= the time in the header and max is the max response time in seconds. For max values in the top 25% of the range have a red background and in the bottom 25% of the range have a green background. The red background is not used when the min value is within 80% of the max value.
| dbms | 256us | 1ms | 4ms | 16ms | 64ms | 256ms | 1s | 4s | 16s | gt | max |
|---|---|---|---|---|---|---|---|---|---|---|---|
| ma100244_rel.cz11a_c8r32 | 96.861 | 2.694 | 0.444 | 0.037 | |||||||
| ma100339_rel.cz11a_c8r32 | 1.306 | 95.639 | 2.583 | 0.472 | 0.032 | ||||||
| ma100433_rel.cz11a_c8r32 | 0.472 | 96.444 | 2.722 | 0.361 | 0.026 | ||||||
| ma100524_rel.cz11a_c8r32 | 20.278 | 79.722 | 0.002 | ||||||||
| ma100617_rel.cz11a_c8r32 | 45.444 | 54.556 | 0.002 | ||||||||
| ma101107_rel.cz11a_c8r32 | 2.389 | 50.694 | 46.917 | 0.011 | |||||||
| ma110401_rel.cz11b_c8r32 | 2.639 | 50.833 | 46.528 | 0.014 |
Performance metrics for the DBMS listed above. Some are normalized by throughput, others are not. Legend for results is here.
ips	qps	rps	rmbps	wps	wmbps	rpq	rkbpq	wpi	wkbpi	csps	cpups	cspq	cpupq	dbgb1	dbgb2	rss	maxop	p50	p99	tag
100	7689	0	0.0	854.7	23.7	0.000	0.000	8.564	242.886	34393	13.1	4.473	136	10.3	41.1	11.4	0.015	7704	7160	ma100244_rel.cz11a_c8r32
100	7382	0	0.0	855.7	23.7	0.000	0.000	8.574	243.169	33266	13.1	4.506	142	10.3	41.1	11.3	0.016	7399	7064	ma100339_rel.cz11a_c8r32
100	7109	0	0.0	856.6	23.7	0.000	0.000	8.583	243.433	32281	13.1	4.541	147	10.3	41.1	NA	0.015	7115	6777	ma100433_rel.cz11a_c8r32
100	7234	0	0.0	2.5	0.1	0.000	0.000	0.025	1.176	30322	12.9	4.191	143	11.0	43.0	11.1	0.001	7240	7032	ma100524_rel.cz11a_c8r32
100	7244	0	0.0	21.1	0.6	0.000	0.000	0.212	6.481	29272	12.9	4.041	142	10.3	41.2	10.3	0.002	7243	7080	ma100617_rel.cz11a_c8r32
100	7125	3	0.0	21.1	0.6	0.000	0.002	0.211	6.491	28848	13.2	4.049	148	10.3	41.2	10.2	0.002	7128	6936	ma101107_rel.cz11a_c8r32
100	7173	3	0.0	16.3	0.5	0.000	0.002	0.163	5.067	28995	13.0	4.042	145	10.3	41.1	10.2	0.002	7176	6968	ma110401_rel.cz11b_c8r32
qr500.L3
qr500.L3: range queries with 500 insert/s per client. Graphs for performance per 1-second interval are here.
Average throughput:
Query response time histogram: each cell has the percentage of responses that take <= the time in the header and max is the max response time in seconds. For max values in the top 25% of the range have a red background and in the bottom 25% of the range have a green background. The red background is not used when the min value is within 80% of the max value.
| dbms | 256us | 1ms | 4ms | 16ms | 64ms | 256ms | 1s | 4s | 16s | gt | max |
|---|---|---|---|---|---|---|---|---|---|---|---|
| ma100244_rel.cz11a_c8r32 | 99.924 | 0.074 | 0.001 | 0.002 | nonzero | 0.020 | |||||
| ma100339_rel.cz11a_c8r32 | 99.928 | 0.070 | 0.001 | 0.002 | nonzero | 0.023 | |||||
| ma100433_rel.cz11a_c8r32 | 99.930 | 0.067 | 0.001 | 0.002 | nonzero | 0.026 | |||||
| ma100524_rel.cz11a_c8r32 | 99.973 | 0.026 | nonzero | 0.002 | |||||||
| ma100617_rel.cz11a_c8r32 | 99.983 | 0.017 | nonzero | nonzero | 0.005 | ||||||
| ma101107_rel.cz11a_c8r32 | 99.984 | 0.016 | nonzero | nonzero | 0.004 | ||||||
| ma110401_rel.cz11b_c8r32 | 99.987 | 0.013 | nonzero | nonzero | 0.009 |
Insert response time histogram: each cell has the percentage of responses that take <= the time in the header and max is the max response time in seconds. For max values in the top 25% of the range have a red background and in the bottom 25% of the range have a green background. The red background is not used when the min value is within 80% of the max value.
| dbms | 256us | 1ms | 4ms | 16ms | 64ms | 256ms | 1s | 4s | 16s | gt | max |
|---|---|---|---|---|---|---|---|---|---|---|---|
| ma100244_rel.cz11a_c8r32 | 8.328 | 84.061 | 6.400 | 1.211 | 0.037 | ||||||
| ma100339_rel.cz11a_c8r32 | 9.850 | 82.617 | 6.611 | 0.922 | 0.041 | ||||||
| ma100433_rel.cz11a_c8r32 | 8.744 | 83.733 | 6.383 | 1.139 | 0.045 | ||||||
| ma100524_rel.cz11a_c8r32 | 15.561 | 84.439 | 0.002 | ||||||||
| ma100617_rel.cz11a_c8r32 | 46.878 | 53.117 | 0.006 | 0.005 | |||||||
| ma101107_rel.cz11a_c8r32 | 11.956 | 78.694 | 9.350 | 0.011 | |||||||
| ma110401_rel.cz11b_c8r32 | 23.078 | 67.650 | 9.272 | 0.011 |
Delete response time histogram: each cell has the percentage of responses that take <= the time in the header and max is the max response time in seconds. For max values in the top 25% of the range have a red background and in the bottom 25% of the range have a green background. The red background is not used when the min value is within 80% of the max value.
| dbms | 256us | 1ms | 4ms | 16ms | 64ms | 256ms | 1s | 4s | 16s | gt | max |
|---|---|---|---|---|---|---|---|---|---|---|---|
| ma100244_rel.cz11a_c8r32 | 31.944 | 60.817 | 6.356 | 0.883 | 0.031 | ||||||
| ma100339_rel.cz11a_c8r32 | 53.494 | 39.328 | 6.472 | 0.706 | 0.036 | ||||||
| ma100433_rel.cz11a_c8r32 | 54.128 | 38.683 | 6.600 | 0.589 | 0.039 | ||||||
| ma100524_rel.cz11a_c8r32 | 87.361 | 12.639 | 0.002 | ||||||||
| ma100617_rel.cz11a_c8r32 | 88.761 | 11.233 | 0.006 | 0.005 | |||||||
| ma101107_rel.cz11a_c8r32 | 78.511 | 12.139 | 9.350 | 0.011 | |||||||
| ma110401_rel.cz11b_c8r32 | 78.950 | 11.783 | 9.267 | 0.011 |
Performance metrics for the DBMS listed above. Some are normalized by throughput, others are not. Legend for results is here.
ips	qps	rps	rmbps	wps	wmbps	rpq	rkbpq	wpi	wkbpi	csps	cpups	cspq	cpupq	dbgb1	dbgb2	rss	maxop	p50	p99	tag
499	8886	0	0.0	3634.3	101.2	0.000	0.000	7.277	207.525	45991	14.3	5.176	129	10.3	41.1	11.4	0.020	8902	8518	ma100244_rel.cz11a_c8r32
499	8604	0	0.0	3654.1	101.8	0.000	0.000	7.317	208.668	45173	14.3	5.250	133	10.3	41.1	11.3	0.023	8614	8279	ma100339_rel.cz11a_c8r32
499	8319	0	0.0	3653.2	101.7	0.000	0.000	7.315	208.612	44500	14.4	5.349	138	10.3	41.1	NA	0.026	8330	8010	ma100433_rel.cz11a_c8r32
499	8283	0	0.0	5.9	0.5	0.000	0.000	0.012	1.120	33255	13.2	4.015	127	11.0	43.0	11.1	0.002	8279	8231	ma100524_rel.cz11a_c8r32
499	8187	0	0.0	12.2	0.7	0.000	0.000	0.024	1.477	31661	13.2	3.867	129	10.3	41.2	10.3	0.005	8199	8122	ma100617_rel.cz11a_c8r32
499	8126	19	0.1	18.6	0.9	0.002	0.009	0.037	1.855	31531	13.2	3.880	130	10.3	41.2	10.2	0.004	8135	8071	ma101107_rel.cz11a_c8r32
499	8276	19	0.1	19.0	0.9	0.002	0.009	0.038	1.861	32089	13.2	3.877	128	10.3	41.1	10.2	0.009	8279	8215	ma110401_rel.cz11b_c8r32
qp500.L4
qp500.L4: point queries with 500 insert/s per client. Graphs for performance per 1-second interval are here.
Average throughput:
Query response time histogram: each cell has the percentage of responses that take <= the time in the header and max is the max response time in seconds. For max values in the top 25% of the range have a red background and in the bottom 25% of the range have a green background. The red background is not used when the min value is within 80% of the max value.
| dbms | 256us | 1ms | 4ms | 16ms | 64ms | 256ms | 1s | 4s | 16s | gt | max |
|---|---|---|---|---|---|---|---|---|---|---|---|
| ma100244_rel.cz11a_c8r32 | 99.754 | 0.246 | nonzero | nonzero | 0.015 | ||||||
| ma100339_rel.cz11a_c8r32 | 99.793 | 0.206 | nonzero | 0.001 | 0.015 | ||||||
| ma100433_rel.cz11a_c8r32 | 99.792 | 0.207 | nonzero | nonzero | nonzero | 0.021 | |||||
| ma100524_rel.cz11a_c8r32 | 99.935 | 0.065 | nonzero | 0.002 | |||||||
| ma100617_rel.cz11a_c8r32 | 99.954 | 0.046 | nonzero | 0.004 | |||||||
| ma101107_rel.cz11a_c8r32 | 99.968 | 0.032 | nonzero | nonzero | 0.004 | ||||||
| ma110401_rel.cz11b_c8r32 | 99.965 | 0.035 | nonzero | nonzero | 0.004 |
Insert response time histogram: each cell has the percentage of responses that take <= the time in the header and max is the max response time in seconds. For max values in the top 25% of the range have a red background and in the bottom 25% of the range have a green background. The red background is not used when the min value is within 80% of the max value.
| dbms | 256us | 1ms | 4ms | 16ms | 64ms | 256ms | 1s | 4s | 16s | gt | max |
|---|---|---|---|---|---|---|---|---|---|---|---|
| ma100244_rel.cz11a_c8r32 | 6.972 | 85.517 | 6.550 | 0.961 | 0.037 | ||||||
| ma100339_rel.cz11a_c8r32 | 8.117 | 84.267 | 6.739 | 0.878 | 0.042 | ||||||
| ma100433_rel.cz11a_c8r32 | 6.789 | 85.744 | 6.661 | 0.806 | 0.032 | ||||||
| ma100524_rel.cz11a_c8r32 | 9.111 | 90.889 | 0.002 | ||||||||
| ma100617_rel.cz11a_c8r32 | 19.100 | 80.900 | 0.002 | ||||||||
| ma101107_rel.cz11a_c8r32 | 5.106 | 85.617 | 9.278 | 0.011 | |||||||
| ma110401_rel.cz11b_c8r32 | 13.200 | 77.544 | 9.256 | 0.011 |
Delete response time histogram: each cell has the percentage of responses that take <= the time in the header and max is the max response time in seconds. For max values in the top 25% of the range have a red background and in the bottom 25% of the range have a green background. The red background is not used when the min value is within 80% of the max value.
| dbms | 256us | 1ms | 4ms | 16ms | 64ms | 256ms | 1s | 4s | 16s | gt | max |
|---|---|---|---|---|---|---|---|---|---|---|---|
| ma100244_rel.cz11a_c8r32 | 25.289 | 67.789 | 6.294 | 0.628 | 0.043 | ||||||
| ma100339_rel.cz11a_c8r32 | 45.761 | 47.183 | 6.533 | 0.522 | 0.037 | ||||||
| ma100433_rel.cz11a_c8r32 | 44.844 | 48.061 | 6.483 | 0.611 | 0.035 | ||||||
| ma100524_rel.cz11a_c8r32 | 79.700 | 20.300 | 0.002 | ||||||||
| ma100617_rel.cz11a_c8r32 | 86.400 | 13.600 | 0.002 | ||||||||
| ma101107_rel.cz11a_c8r32 | 74.383 | 16.339 | 9.278 | 0.011 | |||||||
| ma110401_rel.cz11b_c8r32 | 76.511 | 14.239 | 9.250 | 0.011 |
Performance metrics for the DBMS listed above. Some are normalized by throughput, others are not. Legend for results is here.
ips	qps	rps	rmbps	wps	wmbps	rpq	rkbpq	wpi	wkbpi	csps	cpups	cspq	cpupq	dbgb1	dbgb2	rss	maxop	p50	p99	tag
499	7600	0	0.0	3630.1	101.1	0.000	0.000	7.269	207.296	42419	14.4	5.581	152	10.3	41.1	11.3	0.015	7623	7096	ma100244_rel.cz11a_c8r32
499	7309	0	0.0	3653.6	101.8	0.000	0.000	7.316	208.645	41582	14.4	5.689	158	10.3	41.1	11.3	0.015	7320	6937	ma100339_rel.cz11a_c8r32
499	7034	0	0.0	3654.5	101.8	0.000	0.000	7.318	208.691	40864	14.4	5.810	164	10.3	41.1	NA	0.021	7048	6760	ma100433_rel.cz11a_c8r32
500	7193	0	0.0	5.9	0.5	0.000	0.000	0.012	1.115	30424	13.3	4.230	148	11.0	43.0	11.1	0.002	7192	7016	ma100524_rel.cz11a_c8r32
499	7176	0	0.0	5.9	0.5	0.000	0.000	0.012	1.122	29150	13.3	4.062	148	10.3	41.2	10.3	0.004	7192	6952	ma100617_rel.cz11a_c8r32
499	7128	18	0.1	12.3	0.7	0.003	0.010	0.025	1.499	29038	13.3	4.074	149	10.3	41.2	10.2	0.004	7131	6942	ma101107_rel.cz11a_c8r32
499	7141	18	0.1	12.8	0.7	0.003	0.010	0.026	1.521	29093	13.4	4.074	150	10.3	41.1	10.2	0.004	7144	6952	ma110401_rel.cz11b_c8r32
qr1000.L5
qr1000.L5: range queries with 1000 insert/s per client. Graphs for performance per 1-second interval are here.
Average throughput:
Query response time histogram: each cell has the percentage of responses that take <= the time in the header and max is the max response time in seconds. For max values in the top 25% of the range have a red background and in the bottom 25% of the range have a green background. The red background is not used when the min value is within 80% of the max value.
| dbms | 256us | 1ms | 4ms | 16ms | 64ms | 256ms | 1s | 4s | 16s | gt | max |
|---|---|---|---|---|---|---|---|---|---|---|---|
| ma100244_rel.cz11a_c8r32 | 99.894 | 0.102 | 0.002 | 0.003 | nonzero | 0.037 | |||||
| ma100339_rel.cz11a_c8r32 | 99.901 | 0.094 | 0.002 | 0.003 | nonzero | 0.028 | |||||
| ma100433_rel.cz11a_c8r32 | 99.894 | 0.102 | 0.002 | 0.003 | nonzero | 0.028 | |||||
| ma100524_rel.cz11a_c8r32 | 99.969 | 0.031 | nonzero | 0.002 | |||||||
| ma100617_rel.cz11a_c8r32 | 99.976 | 0.023 | 0.001 | nonzero | 0.013 | ||||||
| ma101107_rel.cz11a_c8r32 | 99.978 | 0.021 | 0.001 | nonzero | 0.008 | ||||||
| ma110401_rel.cz11b_c8r32 | 99.981 | 0.018 | nonzero | nonzero | 0.015 |
Insert response time histogram: each cell has the percentage of responses that take <= the time in the header and max is the max response time in seconds. For max values in the top 25% of the range have a red background and in the bottom 25% of the range have a green background. The red background is not used when the min value is within 80% of the max value.
| dbms | 256us | 1ms | 4ms | 16ms | 64ms | 256ms | 1s | 4s | 16s | gt | max |
|---|---|---|---|---|---|---|---|---|---|---|---|
| ma100244_rel.cz11a_c8r32 | 11.486 | 78.575 | 9.089 | 0.850 | 0.038 | ||||||
| ma100339_rel.cz11a_c8r32 | 12.628 | 77.508 | 9.067 | 0.797 | 0.037 | ||||||
| ma100433_rel.cz11a_c8r32 | 10.236 | 79.867 | 9.181 | 0.717 | 0.039 | ||||||
| ma100524_rel.cz11a_c8r32 | 23.525 | 76.472 | 0.003 | 0.035 | |||||||
| ma100617_rel.cz11a_c8r32 | 50.483 | 49.381 | 0.133 | 0.003 | 0.027 | ||||||
| ma101107_rel.cz11a_c8r32 | 20.794 | 74.481 | 4.722 | 0.003 | 0.042 | ||||||
| ma110401_rel.cz11b_c8r32 | 31.753 | 63.400 | 4.836 | 0.011 | 0.040 |
Delete response time histogram: each cell has the percentage of responses that take <= the time in the header and max is the max response time in seconds. For max values in the top 25% of the range have a red background and in the bottom 25% of the range have a green background. The red background is not used when the min value is within 80% of the max value.
| dbms | 256us | 1ms | 4ms | 16ms | 64ms | 256ms | 1s | 4s | 16s | gt | max |
|---|---|---|---|---|---|---|---|---|---|---|---|
| ma100244_rel.cz11a_c8r32 | 37.142 | 53.522 | 8.786 | 0.550 | 0.038 | ||||||
| ma100339_rel.cz11a_c8r32 | 58.967 | 31.775 | 8.781 | 0.478 | 0.037 | ||||||
| ma100433_rel.cz11a_c8r32 | 56.997 | 33.778 | 8.719 | 0.506 | 0.048 | ||||||
| ma100524_rel.cz11a_c8r32 | 92.789 | 7.208 | 0.003 | 0.035 | |||||||
| ma100617_rel.cz11a_c8r32 | 92.772 | 7.125 | 0.100 | 0.003 | 0.027 | ||||||
| ma101107_rel.cz11a_c8r32 | 86.119 | 9.175 | 4.703 | 0.003 | 0.042 | ||||||
| ma110401_rel.cz11b_c8r32 | 86.300 | 8.939 | 4.753 | 0.008 | 0.040 |
Performance metrics for the DBMS listed above. Some are normalized by throughput, others are not. Legend for results is here.
ips	qps	rps	rmbps	wps	wmbps	rpq	rkbpq	wpi	wkbpi	csps	cpups	cspq	cpupq	dbgb1	dbgb2	rss	maxop	p50	p99	tag
999	8816	0	0.0	6616.7	184.5	0.000	0.000	6.625	189.115	54948	15.8	6.233	143	10.3	41.1	11.4	0.037	8838	8438	ma100244_rel.cz11a_c8r32
999	8508	0	0.0	6659.0	185.6	0.000	0.000	6.667	190.331	55324	15.8	6.503	149	10.3	41.1	11.3	0.028	8535	8087	ma100339_rel.cz11a_c8r32
999	8216	0	0.0	6644.5	185.2	0.000	0.000	6.652	189.911	54853	15.7	6.676	153	10.3	41.1	NA	0.028	8247	7863	ma100433_rel.cz11a_c8r32
999	8234	0	0.0	10.4	1.1	0.000	0.000	0.010	1.122	33323	13.4	4.047	130	11.0	43.0	11.1	0.002	8231	8183	ma100524_rel.cz11a_c8r32
999	8210	0	0.0	142.8	4.6	0.000	0.000	0.143	4.702	32613	13.4	3.972	131	10.3	41.2	10.3	0.013	8215	8071	ma100617_rel.cz11a_c8r32
999	8156	37	0.1	131.0	4.3	0.005	0.018	0.131	4.400	32475	13.4	3.982	131	10.3	41.2	10.3	0.008	8154	8026	ma101107_rel.cz11a_c8r32
999	8238	37	0.1	133.0	4.3	0.005	0.018	0.133	4.407	32787	13.4	3.980	130	10.3	41.1	10.3	0.015	8247	8119	ma110401_rel.cz11b_c8r32
qp1000.L6
qp1000.L6: point queries with 1000 insert/s per client. Graphs for performance per 1-second interval are here.
Average throughput:
Query response time histogram: each cell has the percentage of responses that take <= the time in the header and max is the max response time in seconds. For max values in the top 25% of the range have a red background and in the bottom 25% of the range have a green background. The red background is not used when the min value is within 80% of the max value.
| dbms | 256us | 1ms | 4ms | 16ms | 64ms | 256ms | 1s | 4s | 16s | gt | max |
|---|---|---|---|---|---|---|---|---|---|---|---|
| ma100244_rel.cz11a_c8r32 | 99.708 | 0.291 | nonzero | nonzero | 0.015 | ||||||
| ma100339_rel.cz11a_c8r32 | 99.742 | 0.257 | 0.001 | 0.001 | nonzero | 0.022 | |||||
| ma100433_rel.cz11a_c8r32 | 99.699 | 0.300 | 0.001 | 0.001 | nonzero | 0.023 | |||||
| ma100524_rel.cz11a_c8r32 | 99.926 | 0.074 | nonzero | 0.002 | |||||||
| ma100617_rel.cz11a_c8r32 | 99.943 | 0.057 | nonzero | 0.003 | |||||||
| ma101107_rel.cz11a_c8r32 | 99.954 | 0.046 | nonzero | nonzero | 0.006 | ||||||
| ma110401_rel.cz11b_c8r32 | 99.957 | 0.043 | nonzero | 0.003 |
Insert response time histogram: each cell has the percentage of responses that take <= the time in the header and max is the max response time in seconds. For max values in the top 25% of the range have a red background and in the bottom 25% of the range have a green background. The red background is not used when the min value is within 80% of the max value.
| dbms | 256us | 1ms | 4ms | 16ms | 64ms | 256ms | 1s | 4s | 16s | gt | max |
|---|---|---|---|---|---|---|---|---|---|---|---|
| ma100244_rel.cz11a_c8r32 | 10.392 | 79.681 | 9.222 | 0.706 | 0.038 | ||||||
| ma100339_rel.cz11a_c8r32 | 10.175 | 79.686 | 9.417 | 0.722 | 0.049 | ||||||
| ma100433_rel.cz11a_c8r32 | 8.656 | 81.053 | 9.633 | 0.658 | 0.043 | ||||||
| ma100524_rel.cz11a_c8r32 | 17.350 | 82.647 | 0.003 | 0.036 | |||||||
| ma100617_rel.cz11a_c8r32 | 34.228 | 65.761 | 0.008 | 0.003 | 0.027 | ||||||
| ma101107_rel.cz11a_c8r32 | 10.458 | 84.881 | 4.658 | 0.003 | 0.026 | ||||||
| ma110401_rel.cz11b_c8r32 | 17.042 | 78.308 | 4.647 | 0.003 | 0.031 |
Delete response time histogram: each cell has the percentage of responses that take <= the time in the header and max is the max response time in seconds. For max values in the top 25% of the range have a red background and in the bottom 25% of the range have a green background. The red background is not used when the min value is within 80% of the max value.
| dbms | 256us | 1ms | 4ms | 16ms | 64ms | 256ms | 1s | 4s | 16s | gt | max |
|---|---|---|---|---|---|---|---|---|---|---|---|
| ma100244_rel.cz11a_c8r32 | 32.597 | 58.081 | 8.850 | 0.472 | 0.038 | ||||||
| ma100339_rel.cz11a_c8r32 | 52.017 | 38.581 | 9.008 | 0.394 | 0.033 | ||||||
| ma100433_rel.cz11a_c8r32 | 51.328 | 39.219 | 9.053 | 0.400 | 0.041 | ||||||
| ma100524_rel.cz11a_c8r32 | 89.378 | 10.619 | 0.003 | 0.036 | |||||||
| ma100617_rel.cz11a_c8r32 | 91.842 | 8.153 | 0.003 | 0.003 | 0.026 | ||||||
| ma101107_rel.cz11a_c8r32 | 82.714 | 12.631 | 4.653 | 0.003 | 0.026 | ||||||
| ma110401_rel.cz11b_c8r32 | 82.625 | 12.744 | 4.628 | 0.003 | 0.031 |
Performance metrics for the DBMS listed above. Some are normalized by throughput, others are not. Legend for results is here.
ips	qps	rps	rmbps	wps	wmbps	rpq	rkbpq	wpi	wkbpi	csps	cpups	cspq	cpupq	dbgb1	dbgb2	rss	maxop	p50	p99	tag
999	7495	0	0.0	6621.6	184.6	0.000	0.000	6.630	189.253	51369	15.9	6.854	170	10.3	41.1	11.4	0.015	7512	7080	ma100244_rel.cz11a_c8r32
999	7286	0	0.0	6663.8	185.8	0.000	0.000	6.672	190.469	52027	15.7	7.141	172	10.3	41.1	11.3	0.022	7304	6968	ma100339_rel.cz11a_c8r32
999	7038	0	0.0	6653.4	185.5	0.000	0.000	6.661	190.169	51640	15.6	7.337	177	10.3	41.1	NA	0.023	7051	6681	ma100433_rel.cz11a_c8r32
999	7204	0	0.0	10.3	1.1	0.000	0.000	0.010	1.111	30725	13.4	4.265	149	11.0	43.0	11.1	0.002	7208	7003	ma100524_rel.cz11a_c8r32
999	7134	0	0.0	26.3	1.4	0.000	0.000	0.026	1.484	29409	13.4	4.122	150	10.3	41.2	10.3	0.003	7144	6920	ma100617_rel.cz11a_c8r32
999	7027	37	0.1	49.6	2.1	0.005	0.021	0.050	2.130	29221	13.5	4.158	154	10.3	41.2	10.3	0.006	7032	6904	ma101107_rel.cz11a_c8r32
999	7110	37	0.1	39.4	1.8	0.005	0.021	0.039	1.847	29473	13.4	4.145	151	10.3	41.1	10.3	0.003	7112	6923	ma110401_rel.cz11b_c8r32
l.i0
l.i0: load without secondary indexes
Performance metrics for all DBMS, not just the ones listed above. Some are normalized by throughput, others are not. Legend for results is here.
ips	qps	rps	rmbps	wps	wmbps	rpq	rkbpq	wpi	wkbpi	csps	cpups	cspq	cpupq	dbgb1	dbgb2	rss	maxop	p50	p99	tag
170068	0	0	0.0	1204.9	63.8	0.000	0.000	0.007	0.384	19250	21.7	0.113	10	3.3	34.1	4.1	0.129	171909	142746	ma100244_rel.cz11a_c8r32
154321	0	0	0.0	1188.0	63.3	0.000	0.000	0.008	0.420	51212	28.8	0.332	15	3.3	34.1	4.1	0.133	156229	129161	ma100339_rel.cz11a_c8r32
155763	0	0	0.0	1182.4	63.1	0.000	0.000	0.008	0.415	52026	28.9	0.334	15	3.3	34.1	NA	0.136	157732	134057	ma100433_rel.cz11a_c8r32
155763	0	0	0.0	1286.9	51.3	0.000	0.000	0.008	0.337	68431	25.6	0.439	13	3.3	34.1	3.9	0.128	157777	136154	ma100524_rel.cz11a_c8r32
160772	0	0	0.0	613.9	39.3	0.000	0.000	0.004	0.250	20365	23.7	0.127	12	3.3	34.1	3.7	0.163	162722	140448	ma100617_rel.cz11a_c8r32
157729	0	0	0.0	642.6	40.3	0.000	0.000	0.004	0.262	19905	23.2	0.126	12	3.3	34.1	3.7	0.169	159478	137349	ma101107_rel.cz11a_c8r32
160772	0	0	0.0	661.3	41.1	0.000	0.000	0.004	0.262	21003	23.8	0.131	12	3.3	34.1	3.7	0.179	162421	140149	ma110401_rel.cz11b_c8r32
l.x
l.x: create secondary indexes
Performance metrics for all DBMS, not just the ones listed above. Some are normalized by throughput, others are not. Legend for results is here.
ips	qps	rps	rmbps	wps	wmbps	rpq	rkbpq	wpi	wkbpi	csps	cpups	cspq	cpupq	dbgb1	dbgb2	rss	maxop	p50	p99	tag
247525	0	0	0.0	2504.7	223.5	0.000	0.000	0.010	0.925	10873	12.6	0.044	4	7.6	38.4	6.9	0.001	NA	NA	ma100244_rel.cz11a_c8r32
235850	0	0	0.0	2393.0	213.5	0.000	0.000	0.010	0.927	10485	12.3	0.044	4	7.6	38.4	8.0	0.001	NA	NA	ma100339_rel.cz11a_c8r32
239235	0	0	0.0	2436.7	217.3	0.000	0.000	0.010	0.930	10331	12.5	0.043	4	7.5	38.3	NA	0.001	NA	NA	ma100433_rel.cz11a_c8r32
203252	0	0	0.0	1320.6	163.7	0.000	0.000	0.006	0.825	431	11.8	0.002	5	7.5	38.3	7.4	0.001	NA	NA	ma100524_rel.cz11a_c8r32
204918	0	0	0.0	2445.3	183.0	0.000	0.000	0.012	0.915	5602	12.2	0.027	5	7.5	38.3	7.3	0.001	NA	NA	ma100617_rel.cz11a_c8r32
201613	0	0	0.0	2332.0	178.0	0.000	0.000	0.012	0.904	5208	12.1	0.026	5	7.5	38.3	6.9	0.001	NA	NA	ma101107_rel.cz11a_c8r32
200000	0	0	0.0	2288.2	175.7	0.000	0.000	0.011	0.899	5101	12.1	0.026	5	7.5	38.3	6.7	0.001	NA	NA	ma110401_rel.cz11b_c8r32
l.i1
l.i1: continue load after secondary indexes created with 50 inserts per transaction
Performance metrics for all DBMS, not just the ones listed above. Some are normalized by throughput, others are not. Legend for results is here.
ips	qps	rps	rmbps	wps	wmbps	rpq	rkbpq	wpi	wkbpi	csps	cpups	cspq	cpupq	dbgb1	dbgb2	rss	maxop	p50	p99	tag
30052	0	0	0.0	10766.7	339.2	0.000	0.000	0.358	11.558	57360	45.8	1.909	122	10.0	40.9	11.1	0.073	30679	10389	ma100244_rel.cz11a_c8r32
30257	0	0	0.0	12433.8	386.2	0.000	0.000	0.411	13.071	70780	43.8	2.339	116	10.1	40.9	11.1	0.074	30767	9640	ma100339_rel.cz11a_c8r32
30558	0	0	0.0	11873.2	370.9	0.000	0.000	0.389	12.430	69762	43.7	2.283	114	10.1	40.9	NA	0.153	31217	8990	ma100433_rel.cz11a_c8r32
38204	0	0	0.0	9187.8	289.4	0.000	0.000	0.240	7.758	67976	36.6	1.779	77	10.8	42.7	11.1	0.390	40856	7745	ma100524_rel.cz11a_c8r32
35180	0	0	0.0	5442.5	184.0	0.000	0.000	0.155	5.355	91184	30.8	2.592	70	10.1	40.9	10.0	0.313	37720	11243	ma100617_rel.cz11a_c8r32
34100	0	874	3.4	5322.9	179.9	0.026	0.103	0.156	5.401	88296	29.8	2.589	70	10.1	40.9	10.0	0.412	36361	11742	ma101107_rel.cz11a_c8r32
31521	0	840	3.3	4950.3	165.6	0.027	0.107	0.157	5.379	80042	27.3	2.539	69	10.1	40.9	10.0	0.215	31616	12986	ma110401_rel.cz11b_c8r32
l.i2
l.i2: continue load after secondary indexes created with 5 inserts per transaction
Performance metrics for all DBMS, not just the ones listed above. Some are normalized by throughput, others are not. Legend for results is here.
ips	qps	rps	rmbps	wps	wmbps	rpq	rkbpq	wpi	wkbpi	csps	cpups	cspq	cpupq	dbgb1	dbgb2	rss	maxop	p50	p99	tag
17857	0	0	0.0	14055.9	408.5	0.000	0.000	0.787	23.423	199484	44.4	11.171	199	10.3	41.1	11.4	0.074	17796	15319	ma100244_rel.cz11a_c8r32
17730	0	0	0.0	14479.1	420.8	0.000	0.000	0.817	24.301	237744	45.3	13.409	204	10.3	41.1	11.3	0.073	17556	15334	ma100339_rel.cz11a_c8r32
17606	0	0	0.0	14451.4	419.1	0.000	0.000	0.821	24.377	240681	45.2	13.671	205	10.3	41.1	NA	0.070	17526	14919	ma100433_rel.cz11a_c8r32
21552	0	0	0.0	10936.6	317.9	0.000	0.000	0.507	15.106	337340	46.4	15.653	172	11.0	43.0	11.1	0.064	21602	20298	ma100524_rel.cz11a_c8r32
24154	0	0	0.0	2699.5	93.5	0.000	0.000	0.112	3.965	117801	34.6	4.877	115	10.3	41.2	10.2	0.060	24233	23035	ma100617_rel.cz11a_c8r32
22522	0	3192	12.5	2614.7	90.7	0.142	0.567	0.116	4.124	114543	33.2	5.086	118	10.3	41.2	10.2	0.059	22488	21487	ma101107_rel.cz11a_c8r32
21739	0	3080	12.0	2563.0	87.9	0.142	0.567	0.118	4.143	110890	32.0	5.101	118	10.3	41.1	10.2	0.068	22557	18266	ma110401_rel.cz11b_c8r32
qr100.L1
qr100.L1: range queries with 100 insert/s per client
Performance metrics for all DBMS, not just the ones listed above. Some are normalized by throughput, others are not. Legend for results is here.
ips	qps	rps	rmbps	wps	wmbps	rpq	rkbpq	wpi	wkbpi	csps	cpups	cspq	cpupq	dbgb1	dbgb2	rss	maxop	p50	p99	tag
100	8939	0	0.0	861.6	23.9	0.000	0.000	8.633	244.866	37842	12.9	4.233	115	10.3	41.1	11.4	0.016	8938	8838	ma100244_rel.cz11a_c8r32
100	8619	0	0.0	869.6	24.1	0.000	0.000	8.713	247.158	36703	12.9	4.258	120	10.3	41.1	11.3	0.021	8615	8503	ma100339_rel.cz11a_c8r32
100	8412	0	0.0	865.8	24.0	0.000	0.000	8.675	246.055	35998	12.9	4.279	123	10.3	41.1	NA	0.018	8410	8326	ma100433_rel.cz11a_c8r32
100	8304	0	0.0	2.5	0.1	0.000	0.000	0.025	1.213	33066	12.5	3.982	120	11.0	43.0	11.1	0.001	8311	8215	ma100524_rel.cz11a_c8r32
100	8251	0	0.0	2.4	0.1	0.000	0.000	0.024	1.187	31687	12.6	3.840	122	10.3	41.2	10.3	0.002	8250	8183	ma100617_rel.cz11a_c8r32
100	8210	4	0.0	2.3	0.1	0.000	0.002	0.024	1.192	31547	12.7	3.842	124	10.3	41.2	10.2	0.002	8215	8151	ma101107_rel.cz11a_c8r32
100	8213	4	0.0	2.4	0.1	0.000	0.002	0.024	1.203	31561	12.6	3.843	123	10.3	41.1	10.2	0.002	8215	8119	ma110401_rel.cz11b_c8r32
qp100.L2
qp100.L2: point queries with 100 insert/s per client
Performance metrics for all DBMS, not just the ones listed above. Some are normalized by throughput, others are not. Legend for results is here.
ips	qps	rps	rmbps	wps	wmbps	rpq	rkbpq	wpi	wkbpi	csps	cpups	cspq	cpupq	dbgb1	dbgb2	rss	maxop	p50	p99	tag
100	7689	0	0.0	854.7	23.7	0.000	0.000	8.564	242.886	34393	13.1	4.473	136	10.3	41.1	11.4	0.015	7704	7160	ma100244_rel.cz11a_c8r32
100	7382	0	0.0	855.7	23.7	0.000	0.000	8.574	243.169	33266	13.1	4.506	142	10.3	41.1	11.3	0.016	7399	7064	ma100339_rel.cz11a_c8r32
100	7109	0	0.0	856.6	23.7	0.000	0.000	8.583	243.433	32281	13.1	4.541	147	10.3	41.1	NA	0.015	7115	6777	ma100433_rel.cz11a_c8r32
100	7234	0	0.0	2.5	0.1	0.000	0.000	0.025	1.176	30322	12.9	4.191	143	11.0	43.0	11.1	0.001	7240	7032	ma100524_rel.cz11a_c8r32
100	7244	0	0.0	21.1	0.6	0.000	0.000	0.212	6.481	29272	12.9	4.041	142	10.3	41.2	10.3	0.002	7243	7080	ma100617_rel.cz11a_c8r32
100	7125	3	0.0	21.1	0.6	0.000	0.002	0.211	6.491	28848	13.2	4.049	148	10.3	41.2	10.2	0.002	7128	6936	ma101107_rel.cz11a_c8r32
100	7173	3	0.0	16.3	0.5	0.000	0.002	0.163	5.067	28995	13.0	4.042	145	10.3	41.1	10.2	0.002	7176	6968	ma110401_rel.cz11b_c8r32
qr500.L3
qr500.L3: range queries with 500 insert/s per client
Performance metrics for all DBMS, not just the ones listed above. Some are normalized by throughput, others are not. Legend for results is here.
ips	qps	rps	rmbps	wps	wmbps	rpq	rkbpq	wpi	wkbpi	csps	cpups	cspq	cpupq	dbgb1	dbgb2	rss	maxop	p50	p99	tag
499	8886	0	0.0	3634.3	101.2	0.000	0.000	7.277	207.525	45991	14.3	5.176	129	10.3	41.1	11.4	0.020	8902	8518	ma100244_rel.cz11a_c8r32
499	8604	0	0.0	3654.1	101.8	0.000	0.000	7.317	208.668	45173	14.3	5.250	133	10.3	41.1	11.3	0.023	8614	8279	ma100339_rel.cz11a_c8r32
499	8319	0	0.0	3653.2	101.7	0.000	0.000	7.315	208.612	44500	14.4	5.349	138	10.3	41.1	NA	0.026	8330	8010	ma100433_rel.cz11a_c8r32
499	8283	0	0.0	5.9	0.5	0.000	0.000	0.012	1.120	33255	13.2	4.015	127	11.0	43.0	11.1	0.002	8279	8231	ma100524_rel.cz11a_c8r32
499	8187	0	0.0	12.2	0.7	0.000	0.000	0.024	1.477	31661	13.2	3.867	129	10.3	41.2	10.3	0.005	8199	8122	ma100617_rel.cz11a_c8r32
499	8126	19	0.1	18.6	0.9	0.002	0.009	0.037	1.855	31531	13.2	3.880	130	10.3	41.2	10.2	0.004	8135	8071	ma101107_rel.cz11a_c8r32
499	8276	19	0.1	19.0	0.9	0.002	0.009	0.038	1.861	32089	13.2	3.877	128	10.3	41.1	10.2	0.009	8279	8215	ma110401_rel.cz11b_c8r32
qp500.L4
qp500.L4: point queries with 500 insert/s per client
Performance metrics for all DBMS, not just the ones listed above. Some are normalized by throughput, others are not. Legend for results is here.
ips	qps	rps	rmbps	wps	wmbps	rpq	rkbpq	wpi	wkbpi	csps	cpups	cspq	cpupq	dbgb1	dbgb2	rss	maxop	p50	p99	tag
499	7600	0	0.0	3630.1	101.1	0.000	0.000	7.269	207.296	42419	14.4	5.581	152	10.3	41.1	11.3	0.015	7623	7096	ma100244_rel.cz11a_c8r32
499	7309	0	0.0	3653.6	101.8	0.000	0.000	7.316	208.645	41582	14.4	5.689	158	10.3	41.1	11.3	0.015	7320	6937	ma100339_rel.cz11a_c8r32
499	7034	0	0.0	3654.5	101.8	0.000	0.000	7.318	208.691	40864	14.4	5.810	164	10.3	41.1	NA	0.021	7048	6760	ma100433_rel.cz11a_c8r32
500	7193	0	0.0	5.9	0.5	0.000	0.000	0.012	1.115	30424	13.3	4.230	148	11.0	43.0	11.1	0.002	7192	7016	ma100524_rel.cz11a_c8r32
499	7176	0	0.0	5.9	0.5	0.000	0.000	0.012	1.122	29150	13.3	4.062	148	10.3	41.2	10.3	0.004	7192	6952	ma100617_rel.cz11a_c8r32
499	7128	18	0.1	12.3	0.7	0.003	0.010	0.025	1.499	29038	13.3	4.074	149	10.3	41.2	10.2	0.004	7131	6942	ma101107_rel.cz11a_c8r32
499	7141	18	0.1	12.8	0.7	0.003	0.010	0.026	1.521	29093	13.4	4.074	150	10.3	41.1	10.2	0.004	7144	6952	ma110401_rel.cz11b_c8r32
qr1000.L5
qr1000.L5: range queries with 1000 insert/s per client
Performance metrics for all DBMS, not just the ones listed above. Some are normalized by throughput, others are not. Legend for results is here.
ips	qps	rps	rmbps	wps	wmbps	rpq	rkbpq	wpi	wkbpi	csps	cpups	cspq	cpupq	dbgb1	dbgb2	rss	maxop	p50	p99	tag
999	8816	0	0.0	6616.7	184.5	0.000	0.000	6.625	189.115	54948	15.8	6.233	143	10.3	41.1	11.4	0.037	8838	8438	ma100244_rel.cz11a_c8r32
999	8508	0	0.0	6659.0	185.6	0.000	0.000	6.667	190.331	55324	15.8	6.503	149	10.3	41.1	11.3	0.028	8535	8087	ma100339_rel.cz11a_c8r32
999	8216	0	0.0	6644.5	185.2	0.000	0.000	6.652	189.911	54853	15.7	6.676	153	10.3	41.1	NA	0.028	8247	7863	ma100433_rel.cz11a_c8r32
999	8234	0	0.0	10.4	1.1	0.000	0.000	0.010	1.122	33323	13.4	4.047	130	11.0	43.0	11.1	0.002	8231	8183	ma100524_rel.cz11a_c8r32
999	8210	0	0.0	142.8	4.6	0.000	0.000	0.143	4.702	32613	13.4	3.972	131	10.3	41.2	10.3	0.013	8215	8071	ma100617_rel.cz11a_c8r32
999	8156	37	0.1	131.0	4.3	0.005	0.018	0.131	4.400	32475	13.4	3.982	131	10.3	41.2	10.3	0.008	8154	8026	ma101107_rel.cz11a_c8r32
999	8238	37	0.1	133.0	4.3	0.005	0.018	0.133	4.407	32787	13.4	3.980	130	10.3	41.1	10.3	0.015	8247	8119	ma110401_rel.cz11b_c8r32
qp1000.L6
qp1000.L6: point queries with 1000 insert/s per client
Performance metrics for all DBMS, not just the ones listed above. Some are normalized by throughput, others are not. Legend for results is here.
ips	qps	rps	rmbps	wps	wmbps	rpq	rkbpq	wpi	wkbpi	csps	cpups	cspq	cpupq	dbgb1	dbgb2	rss	maxop	p50	p99	tag
999	7495	0	0.0	6621.6	184.6	0.000	0.000	6.630	189.253	51369	15.9	6.854	170	10.3	41.1	11.4	0.015	7512	7080	ma100244_rel.cz11a_c8r32
999	7286	0	0.0	6663.8	185.8	0.000	0.000	6.672	190.469	52027	15.7	7.141	172	10.3	41.1	11.3	0.022	7304	6968	ma100339_rel.cz11a_c8r32
999	7038	0	0.0	6653.4	185.5	0.000	0.000	6.661	190.169	51640	15.6	7.337	177	10.3	41.1	NA	0.023	7051	6681	ma100433_rel.cz11a_c8r32
999	7204	0	0.0	10.3	1.1	0.000	0.000	0.010	1.111	30725	13.4	4.265	149	11.0	43.0	11.1	0.002	7208	7003	ma100524_rel.cz11a_c8r32
999	7134	0	0.0	26.3	1.4	0.000	0.000	0.026	1.484	29409	13.4	4.122	150	10.3	41.2	10.3	0.003	7144	6920	ma100617_rel.cz11a_c8r32
999	7027	37	0.1	49.6	2.1	0.005	0.021	0.050	2.130	29221	13.5	4.158	154	10.3	41.2	10.3	0.006	7032	6904	ma101107_rel.cz11a_c8r32
999	7110	37	0.1	39.4	1.8	0.005	0.021	0.039	1.847	29473	13.4	4.145	151	10.3	41.1	10.3	0.003	7112	6923	ma110401_rel.cz11b_c8r32
l.i0
- l.i0: load without secondary indexes
- Legend for results is here.
- Each entry lists the percentage of responses that fit in that bucket (slower than max time for previous bucket, faster than min time for next bucket).
Insert response time histogram
256us	1ms	4ms	16ms	64ms	256ms	1s	4s	16s	gt	max	tag
0.000	99.457	0.214	0.284	0.040	0.004	0.000	0.000	0.000	0.000	0.129	ma100244_rel.cz11a_c8r32
0.000	99.338	0.293	0.341	0.024	0.004	0.000	0.000	0.000	0.000	0.133	ma100339_rel.cz11a_c8r32
0.000	99.364	0.268	0.356	0.007	0.004	0.000	0.000	0.000	0.000	0.136	ma100433_rel.cz11a_c8r32
0.000	99.276	0.263	0.396	0.061	0.004	0.000	0.000	0.000	0.000	0.128	ma100524_rel.cz11a_c8r32
0.000	99.511	0.238	0.234	0.012	0.004	0.000	0.000	0.000	0.000	0.163	ma100617_rel.cz11a_c8r32
0.000	99.499	0.253	0.231	0.013	0.005	0.000	0.000	0.000	0.000	0.169	ma101107_rel.cz11a_c8r32
0.000	99.516	0.239	0.228	0.013	0.005	0.000	0.000	0.000	0.000	0.179	ma110401_rel.cz11b_c8r32
l.x
- l.x: create secondary indexes
- Legend for results is here.
- Each entry lists the percentage of responses that fit in that bucket (slower than max time for previous bucket, faster than min time for next bucket).
TODO - determine whether there is data for create index response time
l.i1
- l.i1: continue load after secondary indexes created with 50 inserts per transaction
- Legend for results is here.
- Each entry lists the percentage of responses that fit in that bucket (slower than max time for previous bucket, faster than min time for next bucket).
Insert response time histogram
256us	1ms	4ms	16ms	64ms	256ms	1s	4s	16s	gt	max	tag
0.000	4.459	90.344	5.167	0.028	0.002	0.000	0.000	0.000	0.000	0.073	ma100244_rel.cz11a_c8r32
0.000	2.347	91.664	5.962	0.027	0.001	0.000	0.000	0.000	0.000	0.074	ma100339_rel.cz11a_c8r32
0.000	1.449	92.920	5.603	0.028	0.001	0.000	0.000	0.000	0.000	0.153	ma100433_rel.cz11a_c8r32
0.000	5.800	93.003	1.138	0.055	0.001	0.003	0.000	0.000	0.000	0.390	ma100524_rel.cz11a_c8r32
0.000	6.307	92.539	1.102	0.051	0.001	nonzero	0.000	0.000	0.000	0.313	ma100617_rel.cz11a_c8r32
0.000	2.443	96.356	1.163	0.036	0.001	nonzero	0.000	0.000	0.000	0.412	ma101107_rel.cz11a_c8r32
0.000	5.181	92.208	2.312	0.297	0.003	0.000	0.000	0.000	0.000	0.215	ma110401_rel.cz11b_c8r32
Delete response time histogram
256us	1ms	4ms	16ms	64ms	256ms	1s	4s	16s	gt	max	tag
0.000	61.624	33.965	4.399	0.010	0.001	0.000	0.000	0.000	0.000	0.073	ma100244_rel.cz11a_c8r32
0.000	77.893	17.161	4.938	0.008	nonzero	0.000	0.000	0.000	0.000	0.072	ma100339_rel.cz11a_c8r32
0.000	77.762	17.601	4.627	0.010	nonzero	0.000	0.000	0.000	0.000	0.068	ma100433_rel.cz11a_c8r32
0.000	94.793	4.504	0.675	0.023	0.001	0.002	0.000	0.000	0.000	0.389	ma100524_rel.cz11a_c8r32
0.000	59.198	39.974	0.792	0.036	0.001	0.000	0.000	0.000	0.000	0.096	ma100617_rel.cz11a_c8r32
0.000	48.607	50.515	0.852	0.026	0.001	0.000	0.000	0.000	0.000	0.119	ma101107_rel.cz11a_c8r32
0.000	54.102	43.651	2.004	0.241	0.003	0.000	0.000	0.000	0.000	0.213	ma110401_rel.cz11b_c8r32
l.i2
- l.i2: continue load after secondary indexes created with 5 inserts per transaction
- Legend for results is here.
- Each entry lists the percentage of responses that fit in that bucket (slower than max time for previous bucket, faster than min time for next bucket).
Insert response time histogram
256us	1ms	4ms	16ms	64ms	256ms	1s	4s	16s	gt	max	tag
88.654	10.341	0.142	0.861	0.002	nonzero	0.000	0.000	0.000	0.000	0.074	ma100244_rel.cz11a_c8r32
87.125	11.865	0.147	0.862	0.001	nonzero	0.000	0.000	0.000	0.000	0.073	ma100339_rel.cz11a_c8r32
86.412	12.584	0.147	0.856	0.001	nonzero	0.000	0.000	0.000	0.000	0.070	ma100433_rel.cz11a_c8r32
92.552	7.274	0.144	0.029	0.002	nonzero	0.000	0.000	0.000	0.000	0.064	ma100524_rel.cz11a_c8r32
95.162	4.776	0.049	0.013	0.001	0.000	0.000	0.000	0.000	0.000	0.060	ma100617_rel.cz11a_c8r32
88.712	11.211	0.065	0.012	nonzero	0.000	0.000	0.000	0.000	0.000	0.059	ma101107_rel.cz11a_c8r32
90.142	9.685	0.058	0.112	0.003	nonzero	0.000	0.000	0.000	0.000	0.068	ma110401_rel.cz11b_c8r32
Delete response time histogram
256us	1ms	4ms	16ms	64ms	256ms	1s	4s	16s	gt	max	tag
91.943	7.066	0.137	0.853	0.001	nonzero	0.000	0.000	0.000	0.000	0.074	ma100244_rel.cz11a_c8r32
91.847	7.150	0.148	0.855	0.001	nonzero	0.000	0.000	0.000	0.000	0.073	ma100339_rel.cz11a_c8r32
91.751	7.248	0.149	0.851	0.001	nonzero	0.000	0.000	0.000	0.000	0.071	ma100433_rel.cz11a_c8r32
95.773	4.075	0.127	0.023	0.001	nonzero	0.000	0.000	0.000	0.000	0.064	ma100524_rel.cz11a_c8r32
97.759	2.186	0.043	0.011	0.001	0.000	0.000	0.000	0.000	0.000	0.060	ma100617_rel.cz11a_c8r32
95.313	4.616	0.059	0.011	nonzero	0.000	0.000	0.000	0.000	0.000	0.059	ma101107_rel.cz11a_c8r32
94.122	5.724	0.051	0.100	0.003	nonzero	0.000	0.000	0.000	0.000	0.068	ma110401_rel.cz11b_c8r32
qr100.L1
- qr100.L1: range queries with 100 insert/s per client
- Legend for results is here.
- Each entry lists the percentage of responses that fit in that bucket (slower than max time for previous bucket, faster than min time for next bucket).
Query response time histogram
256us	1ms	4ms	16ms	64ms	256ms	1s	4s	16s	gt	max	tag
99.946	0.054	nonzero	nonzero	nonzero	0.000	0.000	0.000	0.000	0.000	0.016	ma100244_rel.cz11a_c8r32
99.946	0.053	nonzero	nonzero	nonzero	0.000	0.000	0.000	0.000	0.000	0.021	ma100339_rel.cz11a_c8r32
99.951	0.049	nonzero	nonzero	nonzero	0.000	0.000	0.000	0.000	0.000	0.018	ma100433_rel.cz11a_c8r32
99.973	0.027	nonzero	0.000	0.000	0.000	0.000	0.000	0.000	0.000	0.001	ma100524_rel.cz11a_c8r32
99.991	0.009	nonzero	0.000	0.000	0.000	0.000	0.000	0.000	0.000	0.002	ma100617_rel.cz11a_c8r32
99.994	0.006	nonzero	0.000	0.000	0.000	0.000	0.000	0.000	0.000	0.002	ma101107_rel.cz11a_c8r32
99.994	0.006	nonzero	0.000	0.000	0.000	0.000	0.000	0.000	0.000	0.002	ma110401_rel.cz11b_c8r32
Insert response time histogram
256us	1ms	4ms	16ms	64ms	256ms	1s	4s	16s	gt	max	tag
0.000	0.000	97.056	2.361	0.583	0.000	0.000	0.000	0.000	0.000	0.038	ma100244_rel.cz11a_c8r32
0.000	0.000	96.833	2.333	0.833	0.000	0.000	0.000	0.000	0.000	0.036	ma100339_rel.cz11a_c8r32
0.000	0.000	97.194	2.250	0.556	0.000	0.000	0.000	0.000	0.000	0.036	ma100433_rel.cz11a_c8r32
0.000	0.528	99.472	0.000	0.000	0.000	0.000	0.000	0.000	0.000	0.002	ma100524_rel.cz11a_c8r32
0.000	10.806	89.194	0.000	0.000	0.000	0.000	0.000	0.000	0.000	0.002	ma100617_rel.cz11a_c8r32
0.000	0.472	52.944	46.583	0.000	0.000	0.000	0.000	0.000	0.000	0.011	ma101107_rel.cz11a_c8r32
0.000	0.944	52.472	46.583	0.000	0.000	0.000	0.000	0.000	0.000	0.011	ma110401_rel.cz11b_c8r32
Delete response time histogram
256us	1ms	4ms	16ms	64ms	256ms	1s	4s	16s	gt	max	tag
0.000	7.167	90.333	2.056	0.444	0.000	0.000	0.000	0.000	0.000	0.031	ma100244_rel.cz11a_c8r32
0.000	14.861	82.361	2.306	0.472	0.000	0.000	0.000	0.000	0.000	0.030	ma100339_rel.cz11a_c8r32
0.000	18.778	78.667	2.278	0.278	0.000	0.000	0.000	0.000	0.000	0.024	ma100433_rel.cz11a_c8r32
0.000	44.278	55.722	0.000	0.000	0.000	0.000	0.000	0.000	0.000	0.002	ma100524_rel.cz11a_c8r32
0.000	51.667	48.333	0.000	0.000	0.000	0.000	0.000	0.000	0.000	0.002	ma100617_rel.cz11a_c8r32
0.000	4.083	49.361	46.556	0.000	0.000	0.000	0.000	0.000	0.000	0.011	ma101107_rel.cz11a_c8r32
0.000	3.861	49.556	46.583	0.000	0.000	0.000	0.000	0.000	0.000	0.011	ma110401_rel.cz11b_c8r32
qp100.L2
- qp100.L2: point queries with 100 insert/s per client
- Legend for results is here.
- Each entry lists the percentage of responses that fit in that bucket (slower than max time for previous bucket, faster than min time for next bucket).
Query response time histogram
256us	1ms	4ms	16ms	64ms	256ms	1s	4s	16s	gt	max	tag
99.835	0.165	nonzero	nonzero	0.000	0.000	0.000	0.000	0.000	0.000	0.015	ma100244_rel.cz11a_c8r32
99.849	0.150	nonzero	nonzero	0.000	0.000	0.000	0.000	0.000	0.000	0.016	ma100339_rel.cz11a_c8r32
99.846	0.154	nonzero	nonzero	0.000	0.000	0.000	0.000	0.000	0.000	0.015	ma100433_rel.cz11a_c8r32
99.964	0.036	nonzero	0.000	0.000	0.000	0.000	0.000	0.000	0.000	0.001	ma100524_rel.cz11a_c8r32
99.973	0.027	nonzero	0.000	0.000	0.000	0.000	0.000	0.000	0.000	0.002	ma100617_rel.cz11a_c8r32
99.981	0.018	nonzero	0.000	0.000	0.000	0.000	0.000	0.000	0.000	0.002	ma101107_rel.cz11a_c8r32
99.983	0.017	nonzero	0.000	0.000	0.000	0.000	0.000	0.000	0.000	0.002	ma110401_rel.cz11b_c8r32
Insert response time histogram
256us	1ms	4ms	16ms	64ms	256ms	1s	4s	16s	gt	max	tag
0.000	0.000	96.361	2.694	0.944	0.000	0.000	0.000	0.000	0.000	0.031	ma100244_rel.cz11a_c8r32
0.000	0.000	96.722	2.528	0.750	0.000	0.000	0.000	0.000	0.000	0.042	ma100339_rel.cz11a_c8r32
0.000	0.000	96.500	2.556	0.944	0.000	0.000	0.000	0.000	0.000	0.031	ma100433_rel.cz11a_c8r32
0.000	0.000	100.000	0.000	0.000	0.000	0.000	0.000	0.000	0.000	0.002	ma100524_rel.cz11a_c8r32
0.000	0.444	99.528	0.028	0.000	0.000	0.000	0.000	0.000	0.000	0.011	ma100617_rel.cz11a_c8r32
0.000	0.000	53.083	46.917	0.000	0.000	0.000	0.000	0.000	0.000	0.011	ma101107_rel.cz11a_c8r32
0.000	0.083	53.389	46.528	0.000	0.000	0.000	0.000	0.000	0.000	0.014	ma110401_rel.cz11b_c8r32
Delete response time histogram
256us	1ms	4ms	16ms	64ms	256ms	1s	4s	16s	gt	max	tag
0.000	0.000	96.861	2.694	0.444	0.000	0.000	0.000	0.000	0.000	0.037	ma100244_rel.cz11a_c8r32
0.000	1.306	95.639	2.583	0.472	0.000	0.000	0.000	0.000	0.000	0.032	ma100339_rel.cz11a_c8r32
0.000	0.472	96.444	2.722	0.361	0.000	0.000	0.000	0.000	0.000	0.026	ma100433_rel.cz11a_c8r32
0.000	20.278	79.722	0.000	0.000	0.000	0.000	0.000	0.000	0.000	0.002	ma100524_rel.cz11a_c8r32
0.000	45.444	54.556	0.000	0.000	0.000	0.000	0.000	0.000	0.000	0.002	ma100617_rel.cz11a_c8r32
0.000	2.389	50.694	46.917	0.000	0.000	0.000	0.000	0.000	0.000	0.011	ma101107_rel.cz11a_c8r32
0.000	2.639	50.833	46.528	0.000	0.000	0.000	0.000	0.000	0.000	0.014	ma110401_rel.cz11b_c8r32
qr500.L3
- qr500.L3: range queries with 500 insert/s per client
- Legend for results is here.
- Each entry lists the percentage of responses that fit in that bucket (slower than max time for previous bucket, faster than min time for next bucket).
Query response time histogram
256us	1ms	4ms	16ms	64ms	256ms	1s	4s	16s	gt	max	tag
99.924	0.074	0.001	0.002	nonzero	0.000	0.000	0.000	0.000	0.000	0.020	ma100244_rel.cz11a_c8r32
99.928	0.070	0.001	0.002	nonzero	0.000	0.000	0.000	0.000	0.000	0.023	ma100339_rel.cz11a_c8r32
99.930	0.067	0.001	0.002	nonzero	0.000	0.000	0.000	0.000	0.000	0.026	ma100433_rel.cz11a_c8r32
99.973	0.026	nonzero	0.000	0.000	0.000	0.000	0.000	0.000	0.000	0.002	ma100524_rel.cz11a_c8r32
99.983	0.017	nonzero	nonzero	0.000	0.000	0.000	0.000	0.000	0.000	0.005	ma100617_rel.cz11a_c8r32
99.984	0.016	nonzero	nonzero	0.000	0.000	0.000	0.000	0.000	0.000	0.004	ma101107_rel.cz11a_c8r32
99.987	0.013	nonzero	nonzero	0.000	0.000	0.000	0.000	0.000	0.000	0.009	ma110401_rel.cz11b_c8r32
Insert response time histogram
256us	1ms	4ms	16ms	64ms	256ms	1s	4s	16s	gt	max	tag
0.000	8.328	84.061	6.400	1.211	0.000	0.000	0.000	0.000	0.000	0.037	ma100244_rel.cz11a_c8r32
0.000	9.850	82.617	6.611	0.922	0.000	0.000	0.000	0.000	0.000	0.041	ma100339_rel.cz11a_c8r32
0.000	8.744	83.733	6.383	1.139	0.000	0.000	0.000	0.000	0.000	0.045	ma100433_rel.cz11a_c8r32
0.000	15.561	84.439	0.000	0.000	0.000	0.000	0.000	0.000	0.000	0.002	ma100524_rel.cz11a_c8r32
0.000	46.878	53.117	0.006	0.000	0.000	0.000	0.000	0.000	0.000	0.005	ma100617_rel.cz11a_c8r32
0.000	11.956	78.694	9.350	0.000	0.000	0.000	0.000	0.000	0.000	0.011	ma101107_rel.cz11a_c8r32
0.000	23.078	67.650	9.272	0.000	0.000	0.000	0.000	0.000	0.000	0.011	ma110401_rel.cz11b_c8r32
Delete response time histogram
256us	1ms	4ms	16ms	64ms	256ms	1s	4s	16s	gt	max	tag
0.000	31.944	60.817	6.356	0.883	0.000	0.000	0.000	0.000	0.000	0.031	ma100244_rel.cz11a_c8r32
0.000	53.494	39.328	6.472	0.706	0.000	0.000	0.000	0.000	0.000	0.036	ma100339_rel.cz11a_c8r32
0.000	54.128	38.683	6.600	0.589	0.000	0.000	0.000	0.000	0.000	0.039	ma100433_rel.cz11a_c8r32
0.000	87.361	12.639	0.000	0.000	0.000	0.000	0.000	0.000	0.000	0.002	ma100524_rel.cz11a_c8r32
0.000	88.761	11.233	0.006	0.000	0.000	0.000	0.000	0.000	0.000	0.005	ma100617_rel.cz11a_c8r32
0.000	78.511	12.139	9.350	0.000	0.000	0.000	0.000	0.000	0.000	0.011	ma101107_rel.cz11a_c8r32
0.000	78.950	11.783	9.267	0.000	0.000	0.000	0.000	0.000	0.000	0.011	ma110401_rel.cz11b_c8r32
qp500.L4
- qp500.L4: point queries with 500 insert/s per client
- Legend for results is here.
- Each entry lists the percentage of responses that fit in that bucket (slower than max time for previous bucket, faster than min time for next bucket).
Query response time histogram
256us	1ms	4ms	16ms	64ms	256ms	1s	4s	16s	gt	max	tag
99.754	0.246	nonzero	nonzero	0.000	0.000	0.000	0.000	0.000	0.000	0.015	ma100244_rel.cz11a_c8r32
99.793	0.206	nonzero	0.001	0.000	0.000	0.000	0.000	0.000	0.000	0.015	ma100339_rel.cz11a_c8r32
99.792	0.207	nonzero	nonzero	nonzero	0.000	0.000	0.000	0.000	0.000	0.021	ma100433_rel.cz11a_c8r32
99.935	0.065	nonzero	0.000	0.000	0.000	0.000	0.000	0.000	0.000	0.002	ma100524_rel.cz11a_c8r32
99.954	0.046	nonzero	0.000	0.000	0.000	0.000	0.000	0.000	0.000	0.004	ma100617_rel.cz11a_c8r32
99.968	0.032	nonzero	nonzero	0.000	0.000	0.000	0.000	0.000	0.000	0.004	ma101107_rel.cz11a_c8r32
99.965	0.035	nonzero	nonzero	0.000	0.000	0.000	0.000	0.000	0.000	0.004	ma110401_rel.cz11b_c8r32
Insert response time histogram
256us	1ms	4ms	16ms	64ms	256ms	1s	4s	16s	gt	max	tag
0.000	6.972	85.517	6.550	0.961	0.000	0.000	0.000	0.000	0.000	0.037	ma100244_rel.cz11a_c8r32
0.000	8.117	84.267	6.739	0.878	0.000	0.000	0.000	0.000	0.000	0.042	ma100339_rel.cz11a_c8r32
0.000	6.789	85.744	6.661	0.806	0.000	0.000	0.000	0.000	0.000	0.032	ma100433_rel.cz11a_c8r32
0.000	9.111	90.889	0.000	0.000	0.000	0.000	0.000	0.000	0.000	0.002	ma100524_rel.cz11a_c8r32
0.000	19.100	80.900	0.000	0.000	0.000	0.000	0.000	0.000	0.000	0.002	ma100617_rel.cz11a_c8r32
0.000	5.106	85.617	9.278	0.000	0.000	0.000	0.000	0.000	0.000	0.011	ma101107_rel.cz11a_c8r32
0.000	13.200	77.544	9.256	0.000	0.000	0.000	0.000	0.000	0.000	0.011	ma110401_rel.cz11b_c8r32
Delete response time histogram
256us	1ms	4ms	16ms	64ms	256ms	1s	4s	16s	gt	max	tag
0.000	25.289	67.789	6.294	0.628	0.000	0.000	0.000	0.000	0.000	0.043	ma100244_rel.cz11a_c8r32
0.000	45.761	47.183	6.533	0.522	0.000	0.000	0.000	0.000	0.000	0.037	ma100339_rel.cz11a_c8r32
0.000	44.844	48.061	6.483	0.611	0.000	0.000	0.000	0.000	0.000	0.035	ma100433_rel.cz11a_c8r32
0.000	79.700	20.300	0.000	0.000	0.000	0.000	0.000	0.000	0.000	0.002	ma100524_rel.cz11a_c8r32
0.000	86.400	13.600	0.000	0.000	0.000	0.000	0.000	0.000	0.000	0.002	ma100617_rel.cz11a_c8r32
0.000	74.383	16.339	9.278	0.000	0.000	0.000	0.000	0.000	0.000	0.011	ma101107_rel.cz11a_c8r32
0.000	76.511	14.239	9.250	0.000	0.000	0.000	0.000	0.000	0.000	0.011	ma110401_rel.cz11b_c8r32
qr1000.L5
- qr1000.L5: range queries with 1000 insert/s per client
- Legend for results is here.
- Each entry lists the percentage of responses that fit in that bucket (slower than max time for previous bucket, faster than min time for next bucket).
Query response time histogram
256us	1ms	4ms	16ms	64ms	256ms	1s	4s	16s	gt	max	tag
99.894	0.102	0.002	0.003	nonzero	0.000	0.000	0.000	0.000	0.000	0.037	ma100244_rel.cz11a_c8r32
99.901	0.094	0.002	0.003	nonzero	0.000	0.000	0.000	0.000	0.000	0.028	ma100339_rel.cz11a_c8r32
99.894	0.102	0.002	0.003	nonzero	0.000	0.000	0.000	0.000	0.000	0.028	ma100433_rel.cz11a_c8r32
99.969	0.031	nonzero	0.000	0.000	0.000	0.000	0.000	0.000	0.000	0.002	ma100524_rel.cz11a_c8r32
99.976	0.023	0.001	nonzero	0.000	0.000	0.000	0.000	0.000	0.000	0.013	ma100617_rel.cz11a_c8r32
99.978	0.021	0.001	nonzero	0.000	0.000	0.000	0.000	0.000	0.000	0.008	ma101107_rel.cz11a_c8r32
99.981	0.018	nonzero	nonzero	0.000	0.000	0.000	0.000	0.000	0.000	0.015	ma110401_rel.cz11b_c8r32
Insert response time histogram
256us	1ms	4ms	16ms	64ms	256ms	1s	4s	16s	gt	max	tag
0.000	11.486	78.575	9.089	0.850	0.000	0.000	0.000	0.000	0.000	0.038	ma100244_rel.cz11a_c8r32
0.000	12.628	77.508	9.067	0.797	0.000	0.000	0.000	0.000	0.000	0.037	ma100339_rel.cz11a_c8r32
0.000	10.236	79.867	9.181	0.717	0.000	0.000	0.000	0.000	0.000	0.039	ma100433_rel.cz11a_c8r32
0.000	23.525	76.472	0.000	0.003	0.000	0.000	0.000	0.000	0.000	0.035	ma100524_rel.cz11a_c8r32
0.000	50.483	49.381	0.133	0.003	0.000	0.000	0.000	0.000	0.000	0.027	ma100617_rel.cz11a_c8r32
0.000	20.794	74.481	4.722	0.003	0.000	0.000	0.000	0.000	0.000	0.042	ma101107_rel.cz11a_c8r32
0.000	31.753	63.400	4.836	0.011	0.000	0.000	0.000	0.000	0.000	0.040	ma110401_rel.cz11b_c8r32
Delete response time histogram
256us	1ms	4ms	16ms	64ms	256ms	1s	4s	16s	gt	max	tag
0.000	37.142	53.522	8.786	0.550	0.000	0.000	0.000	0.000	0.000	0.038	ma100244_rel.cz11a_c8r32
0.000	58.967	31.775	8.781	0.478	0.000	0.000	0.000	0.000	0.000	0.037	ma100339_rel.cz11a_c8r32
0.000	56.997	33.778	8.719	0.506	0.000	0.000	0.000	0.000	0.000	0.048	ma100433_rel.cz11a_c8r32
0.000	92.789	7.208	0.000	0.003	0.000	0.000	0.000	0.000	0.000	0.035	ma100524_rel.cz11a_c8r32
0.000	92.772	7.125	0.100	0.003	0.000	0.000	0.000	0.000	0.000	0.027	ma100617_rel.cz11a_c8r32
0.000	86.119	9.175	4.703	0.003	0.000	0.000	0.000	0.000	0.000	0.042	ma101107_rel.cz11a_c8r32
0.000	86.300	8.939	4.753	0.008	0.000	0.000	0.000	0.000	0.000	0.040	ma110401_rel.cz11b_c8r32
qp1000.L6
- qp1000.L6: point queries with 1000 insert/s per client
- Legend for results is here.
- Each entry lists the percentage of responses that fit in that bucket (slower than max time for previous bucket, faster than min time for next bucket).
Query response time histogram
256us	1ms	4ms	16ms	64ms	256ms	1s	4s	16s	gt	max	tag
99.708	0.291	nonzero	nonzero	0.000	0.000	0.000	0.000	0.000	0.000	0.015	ma100244_rel.cz11a_c8r32
99.742	0.257	0.001	0.001	nonzero	0.000	0.000	0.000	0.000	0.000	0.022	ma100339_rel.cz11a_c8r32
99.699	0.300	0.001	0.001	nonzero	0.000	0.000	0.000	0.000	0.000	0.023	ma100433_rel.cz11a_c8r32
99.926	0.074	nonzero	0.000	0.000	0.000	0.000	0.000	0.000	0.000	0.002	ma100524_rel.cz11a_c8r32
99.943	0.057	nonzero	0.000	0.000	0.000	0.000	0.000	0.000	0.000	0.003	ma100617_rel.cz11a_c8r32
99.954	0.046	nonzero	nonzero	0.000	0.000	0.000	0.000	0.000	0.000	0.006	ma101107_rel.cz11a_c8r32
99.957	0.043	nonzero	0.000	0.000	0.000	0.000	0.000	0.000	0.000	0.003	ma110401_rel.cz11b_c8r32
Insert response time histogram
256us	1ms	4ms	16ms	64ms	256ms	1s	4s	16s	gt	max	tag
0.000	10.392	79.681	9.222	0.706	0.000	0.000	0.000	0.000	0.000	0.038	ma100244_rel.cz11a_c8r32
0.000	10.175	79.686	9.417	0.722	0.000	0.000	0.000	0.000	0.000	0.049	ma100339_rel.cz11a_c8r32
0.000	8.656	81.053	9.633	0.658	0.000	0.000	0.000	0.000	0.000	0.043	ma100433_rel.cz11a_c8r32
0.000	17.350	82.647	0.000	0.003	0.000	0.000	0.000	0.000	0.000	0.036	ma100524_rel.cz11a_c8r32
0.000	34.228	65.761	0.008	0.003	0.000	0.000	0.000	0.000	0.000	0.027	ma100617_rel.cz11a_c8r32
0.000	10.458	84.881	4.658	0.003	0.000	0.000	0.000	0.000	0.000	0.026	ma101107_rel.cz11a_c8r32
0.000	17.042	78.308	4.647	0.003	0.000	0.000	0.000	0.000	0.000	0.031	ma110401_rel.cz11b_c8r32
Delete response time histogram
256us	1ms	4ms	16ms	64ms	256ms	1s	4s	16s	gt	max	tag
0.000	32.597	58.081	8.850	0.472	0.000	0.000	0.000	0.000	0.000	0.038	ma100244_rel.cz11a_c8r32
0.000	52.017	38.581	9.008	0.394	0.000	0.000	0.000	0.000	0.000	0.033	ma100339_rel.cz11a_c8r32
0.000	51.328	39.219	9.053	0.400	0.000	0.000	0.000	0.000	0.000	0.041	ma100433_rel.cz11a_c8r32
0.000	89.378	10.619	0.000	0.003	0.000	0.000	0.000	0.000	0.000	0.036	ma100524_rel.cz11a_c8r32
0.000	91.842	8.153	0.003	0.003	0.000	0.000	0.000	0.000	0.000	0.026	ma100617_rel.cz11a_c8r32
0.000	82.714	12.631	4.653	0.003	0.000	0.000	0.000	0.000	0.000	0.026	ma101107_rel.cz11a_c8r32
0.000	82.625	12.744	4.628	0.003	0.000	0.000	0.000	0.000	0.000	0.031	ma110401_rel.cz11b_c8r32